Embed Size (px)
Citation preview
Gene Expression and SignalTransduction
Chapter14
PLANT BIOLOGISTS MAY BE FORGIVEN for taking abiding satisfac-
tion in the fact that Mendel’s classic studies on the role of heritable fac-
tors in development were carried out on a flowering plant: the garden
pea. The heritable factors that Mendel discovered, which control such
characteristics as flower color, flower position, pod shape, stem length,
seed color, and seed shape, came to be called genes. Genes are the DNA
sequences that encode the RNA molecules directly involved in making
the enzymes and structural proteins of the cell. Genes are arranged lin-
early on chromosomes, which form linkage groups—that is, genes that
are inherited together. The total amount of DNA or genetic information
contained in a cell, nucleus, or organelle is termed its genome.
Since Mendel’s pioneering discoveries in his garden, the principle has
become firmly established that the growth, development, and environ-
mental responses of even the simplest microorganism are determined
by the programmed expression of its genes. Among multicellular organ-
isms, turning genes on (gene expression) or off alters a cell’s comple-
ment of enzymes and structural proteins, allowing cells to differentiate.
In the chapters that follow, we will discuss various aspects of plant
development in relation to the regulation of gene expression.
Various internal signals are required for coordinating the expression
of genes during development and for enabling the plant to respond to
environmental signals. Such internal (as well as external) signaling
agents typically bring about their effects by means of sequences of bio-
chemical reactions, called signal transduction pathways, that greatly
amplify the original signal and ultimately result in the activation or
repression of genes.
As will be described in the Growth and Development section of the
text, much progress has been made in the study of signal transduction
pathways in plants. However, before discussing these pathways in
plants, we will review the fundamental features of gene expression and
signal transduction in a variety of other organisms, including bacteria,
yeasts, and animals, making reference to plant systems wherever appro-
2 Chapter 14
priate. These models will provide a framework for under-
standing the signaling pathways controlling growth and
development in plants.
Genome Size, Organization, andComplexity As might be expected, the size of the genome bears some
relation to the complexity of the organism. For example,
the genome size of E. coli is 4.7 × 10⁶ base pairs (bp), that of
the fruit fly is 2 × 10⁸ bp per haploid cell, and that of a
human is 3 × 10⁹ bp per haploid cell. However, genome
size in eukaryotes is an unreliable indicator of complexity
because not all of the DNA encodes genes.
In prokaryotes, nearly all of the DNA consists of unique
sequences that encode proteins or functional RNA mole-
cules. In addition to unique sequences, however, eukaryot-
ic chromosomes contain large amounts of noncoding DNA
whose main functions appear to be chromosome organiza-
tion and structure. Much of this noncoding DNA consists
of multicopy sequences called repetitive DNA. The
remainder of the noncoding DNA is made up of single-
copy sequences called spacer DNA. Together, repetitive
and spacer DNA can make up the majority of the total
genome in some eukaryotes. For example, in humans only
about 5% of the total DNA consists of genes, the unique
sequences that code for RNA and protein synthesis.
The genome size in plants is more variable than in any
other group of eukaryotes. In angiosperms, the haploid
genome ranges from about 1.25 × 10⁸ bp for Arabidopsisthaliana (slightly smaller than that of the fruit fly) to 1 × 10¹¹
bp for the monocot Trillium, which is considerably larger
than the human genome. Even closely related beans of the
genus Vicia exhibit genomic DNA contents that vary over
a 20-fold range. Why are plant genomes so variable in size?
Studies of plant molecular biology have shown that
most of the DNA in plants with large genomes is repetitive
DNA. Arabidopsis has the smallest genome of any plant
because only 10% of its nuclear DNA is repetitive DNA.
The genome size of rice is estimated to be about five times
that of Arabidopsis, yet the total amount of unique
sequence DNA in the rice genome is about the same as in
Arabidopsis. Thus the difference in genome size between
Arabidopsis and rice is due mainly to repetitive and spac-
er DNA.
Most plant haploid genomes contain 20,000 to30,000 genesUntil entire genomes were sequenced, the total number of
genes in an organism’s genome was difficult to assess. Such
numbers are now becoming available for an increasing
number of organisms, although precise values are still lack-
ing. The number of genes in bacteria varies from 469
(Mycoplasma genitalium) to 7464 (Nostoc punctiforme) and
overlaps with the number of genes in many simple unicel-
lular eukaryotes. For example, the yeast genome appears
to contain about 6000 genes. More complex eukaryotes,
such as protozoans, flies, and worms, all seem to have gene
numbers in the range of 12,000 to 19,000. The fruit fly
(Drosophila) genome contains about 14,000 genes, while the
nematode worm Caenorhabditis elegans has about 19,000
genes.
The current view is that it takes a minimum of ~12,000
genes to form a eukaryotic organism, although values as
high as 43,000 genes are common in eukaryotes as a result
of multiple copies of certain genes, or multigene families.
The best-studied plant genome is that of A. thaliana. Ara-
bidopsis contains roughly 26,000 genes, approximately the
same number as in the human genome. In contrast, the rice
(Oryza sativa) genome has been estimated to contain
between 35,000 and 55,000 genes, far more than are in the
human genome.
Some of these genes encode proteins that perform
housekeeping functions—basic cellular processes that go
on in all the different kinds of cells. Such genes are perma-
nently turned on; that is, they are constitutively expressed.
Other genes are highly regulated, being turned on or off at
specific stages of development or in response to specific
environmental stimuli.
Prokaryotic Gene Expression The first step in gene expression is transcription, the syn-
thesis of an mRNA copy of the DNA template that encodes
a protein (Alberts et al. 2002; Lodish et al. 2004). Transcrip-
tion is followed by translation, the synthesis of the protein
on the ribosome. Developmental studies have shown that
each plant organ contains large numbers of organ-specif-
ic mRNAs. Transcription is controlled by proteins that bind
DNA, and these DNA-binding proteins are themselves
subject to various types of regulation.
Much of our understanding of the basic elements of
transcription is derived from early work on bacterial sys-
tems; hence we precede our discussion of eukaryotic gene
expression with a brief overview of transcriptional regu-
lation in prokaryotes. However, it is now clear that gene
regulation in eukaryotes is far more complex than in
prokaryotes. The added complexity of gene expression in
eukaryotes is what allows cells and tissues to differentiate
and makes possible the diverse life cycles of plants and
animals.
DNA-binding proteins regulate transcription inprokaryotesIn prokaryotes, genes are arranged in operons, sets of con-
tiguous genes that include structural genes and regulato-
ry sequences. A famous example is the E. coli lactose (lac)
operon, which was first described in 1961 by François Jacob
Gene Expression and Signal Transduction 3
and Jacques Monod of the Pasteur Institute in Paris. The lacoperon is an example of an inducible operon—that is, one
in which a key metabolic intermediate induces the tran-
scription of the genes.
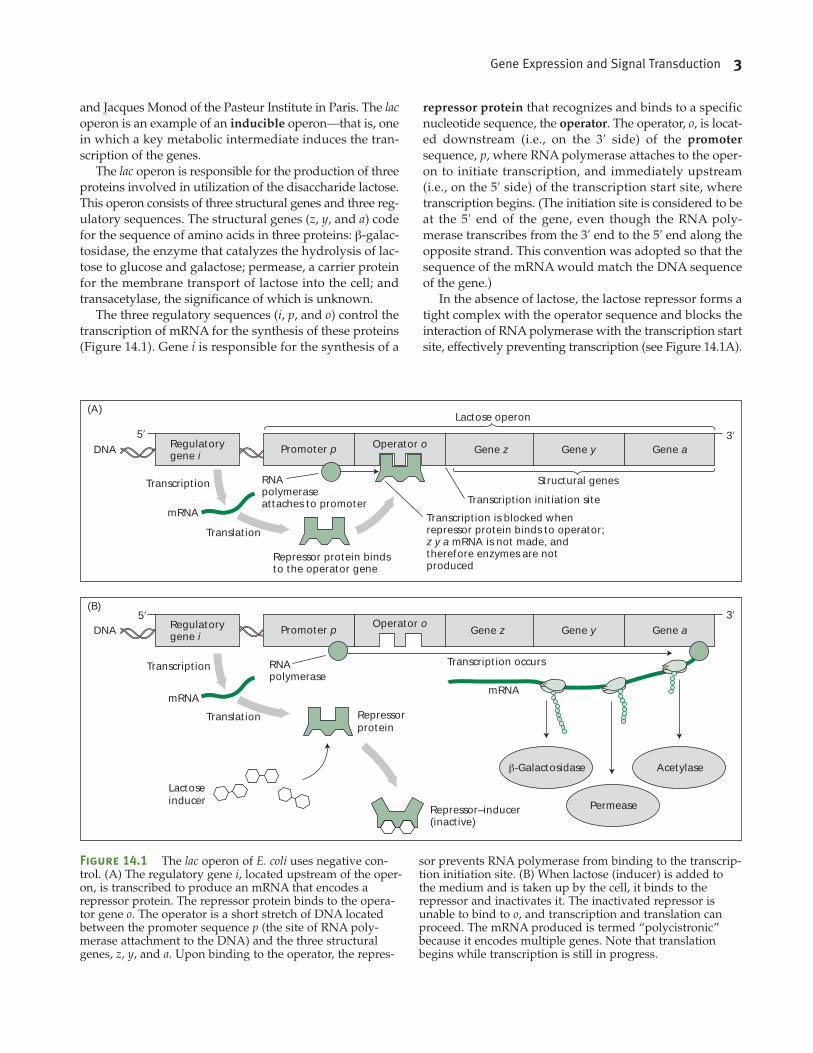
The lac operon is responsible for the production of three
proteins involved in utilization of the disaccharide lactose.
This operon consists of three structural genes and three reg-
ulatory sequences. The structural genes (z, y, and a) code
for the sequence of amino acids in three proteins: β-galac-
tosidase, the enzyme that catalyzes the hydrolysis of lac-
tose to glucose and galactose; permease, a carrier protein
for the membrane transport of lactose into the cell; and
transacetylase, the significance of which is unknown.
The three regulatory sequences (i, p, and o) control the
transcription of mRNA for the synthesis of these proteins
(Figure 14.1). Gene i is responsible for the synthesis of a
repressor protein that recognizes and binds to a specific
nucleotide sequence, the operator. The operator, o, is locat-
ed downstream (i.e., on the 3′ side) of the promoter
sequence, p, where RNA polymerase attaches to the oper-
on to initiate transcription, and immediately upstream
(i.e., on the 5′ side) of the transcription start site, where
transcription begins. (The initiation site is considered to be
at the 5′ end of the gene, even though the RNA poly-
merase transcribes from the 3′ end to the 5′ end along the
opposite strand. This convention was adopted so that the
sequence of the mRNA would match the DNA sequence
of the gene.)
In the absence of lactose, the lactose repressor forms a
tight complex with the operator sequence and blocks the
interaction of RNA polymerase with the transcription start
site, effectively preventing transcription (see Figure 14.1A).
Gene zDNA
mRNA
Gene y Gene aOperator o
Transcription is blocked whenrepressor protein binds to operator;z y a mRNA is not made, andtherefore enzymes are notproduced
Transcription initiation site
Structural genes
Lactose operon
Translation
Transcription
mRNA
Translation
β-Galactosidase Acetylase
Permease
Lactoseinducer
Transcription
Repressor protein bindsto the operator gene
RNApolymeraseattaches to promoter
5′
DNA Gene yGene z
Repressor–inducer(inactive)
Repressorprotein
Gene aPromoter pOperator o
5′
3′
3′
(A)
(B)
RNApolymerase
mRNA
Transcription occurs
Regulatorygene i
Regulatorygene i
Promoter p
Figure 14.1 The lac operon of E. coli uses negative con-trol. (A) The regulatory gene i, located upstream of the oper-on, is transcribed to produce an mRNA that encodes arepressor protein. The repressor protein binds to the opera-tor gene o. The operator is a short stretch of DNA locatedbetween the promoter sequence p (the site of RNA poly-merase attachment to the DNA) and the three structuralgenes, z, y, and a. Upon binding to the operator, the repres-
sor prevents RNA polymerase from binding to the transcrip-tion initiation site. (B) When lactose (inducer) is added tothe medium and is taken up by the cell, it binds to therepressor and inactivates it. The inactivated repressor isunable to bind to o, and transcription and translation canproceed. The mRNA produced is termed “polycistronic”because it encodes multiple genes. Note that translationbegins while transcription is still in progress.
4 Chapter 14
When present, lactose binds to the repressor, causing it to
undergo a conformational change (see Figure 14.1B). The
lac repressor is thus an allosteric protein whose conforma-
tion is determined by the presence or absence of an effec-
tor molecule, in this case lactose. As a result of the confor-
mational change due to binding lactose, the lac repressor
detaches from the operator. When the operator sequence is
unobstructed, the RNA polymerase can move along the
DNA, synthesizing a continuous mRNA. The translation
of this mRNA yields the three proteins, and lactose is said
to induce their synthesis.
The lac repressor is an example of negative control,
since the repressor blocks transcription upon binding to the
operator region of the operon. The lac operon is also reg-
ulated by positive control, which was discovered in con-
nection with a phenomenon called the glucose effect. If glu-
cose is added to a nutrient medium that includes lactose,
the E. coli cells metabolize the glucose and ignore the lac-
tose. Glucose suppresses expression of the lac operon and
prevents synthesis of the enzymes needed to degrade lac-
tose. Glucose exerts this effect by lowering the cellular con-
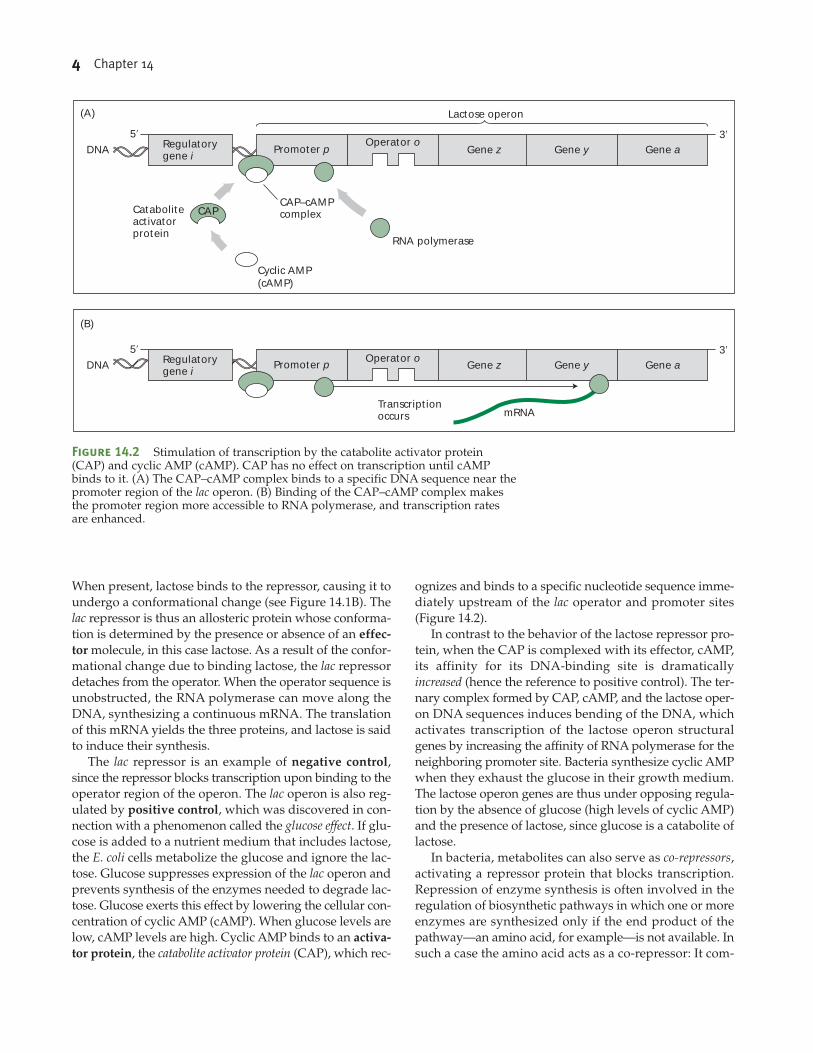
centration of cyclic AMP (cAMP). When glucose levels are
low, cAMP levels are high. Cyclic AMP binds to an activa-
tor protein, the catabolite activator protein (CAP), which rec-
ognizes and binds to a specific nucleotide sequence imme-
diately upstream of the lac operator and promoter sites
(Figure 14.2).
In contrast to the behavior of the lactose repressor pro-
tein, when the CAP is complexed with its effector, cAMP,
its affinity for its DNA-binding site is dramatically
increased (hence the reference to positive control). The ter-
nary complex formed by CAP, cAMP, and the lactose oper-
on DNA sequences induces bending of the DNA, which
activates transcription of the lactose operon structural
genes by increasing the affinity of RNA polymerase for the
neighboring promoter site. Bacteria synthesize cyclic AMP
when they exhaust the glucose in their growth medium.
The lactose operon genes are thus under opposing regula-
tion by the absence of glucose (high levels of cyclic AMP)
and the presence of lactose, since glucose is a catabolite of
lactose.
In bacteria, metabolites can also serve as co-repressors,
activating a repressor protein that blocks transcription.
Repression of enzyme synthesis is often involved in the
regulation of biosynthetic pathways in which one or more
enzymes are synthesized only if the end product of the
pathway—an amino acid, for example—is not available. In
such a case the amino acid acts as a co-repressor: It com-
Gene zDNA Gene y Gene aOperator o
Lactose operon
CAP–cAMPcomplex
RNA polymerase
5′ 3′
(A)
CAP
Cyclic AMP(cAMP)
Gene zDNA Gene y Gene aOperator o
Transcriptionoccurs mRNA
5′ 3′
(B)
Regulatorygene i
Promoter p
Regulatorygene i
Promoter p
Cataboliteactivatorprotein
Figure 14.2 Stimulation of transcription by the catabolite activator protein(CAP) and cyclic AMP (cAMP). CAP has no effect on transcription until cAMPbinds to it. (A) The CAP–cAMP complex binds to a specific DNA sequence near thepromoter region of the lac operon. (B) Binding of the CAP–cAMP complex makesthe promoter region more accessible to RNA polymerase, and transcription ratesare enhanced.
Gene Expression and Signal Transduction 5
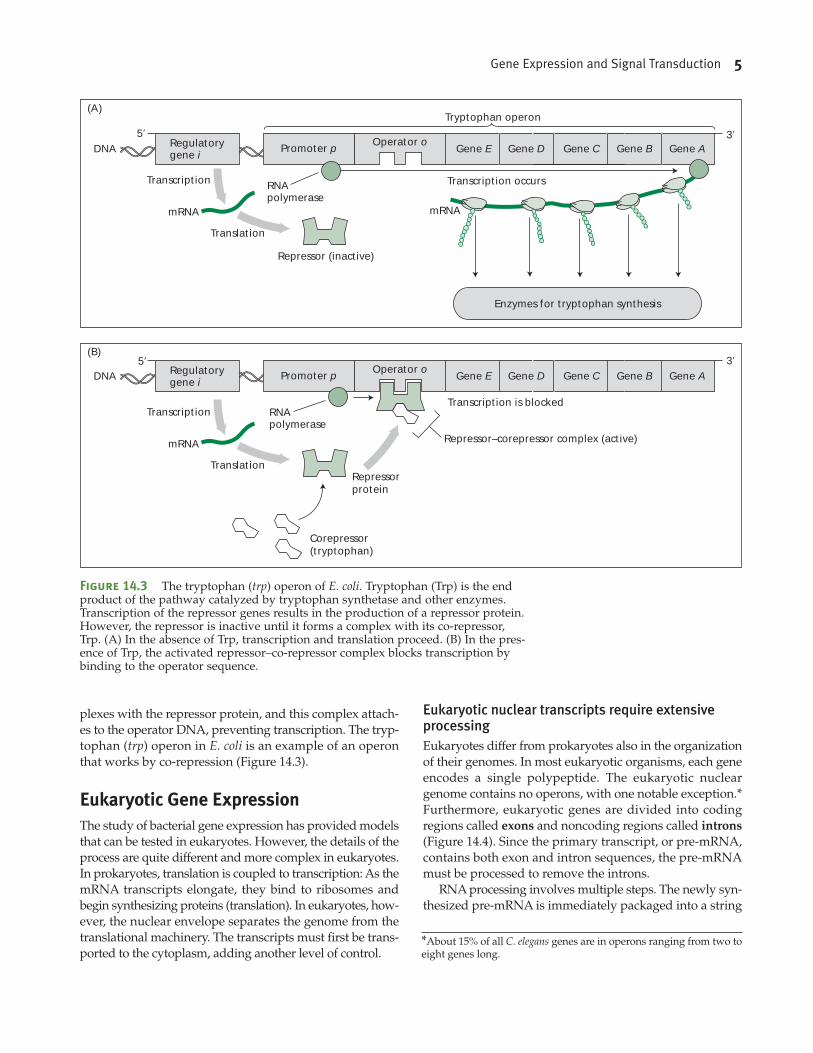
plexes with the repressor protein, and this complex attach-
es to the operator DNA, preventing transcription. The tryp-
tophan (trp) operon in E. coli is an example of an operon
that works by co-repression (Figure 14.3).
Eukaryotic Gene ExpressionThe study of bacterial gene expression has provided models
that can be tested in eukaryotes. However, the details of the
process are quite different and more complex in eukaryotes.
In prokaryotes, translation is coupled to transcription: As the
mRNA transcripts elongate, they bind to ribosomes and
begin synthesizing proteins (translation). In eukaryotes, how-
ever, the nuclear envelope separates the genome from the
translational machinery. The transcripts must first be trans-
ported to the cytoplasm, adding another level of control.
Eukaryotic nuclear transcripts require extensiveprocessingEukaryotes differ from prokaryotes also in the organization
of their genomes. In most eukaryotic organisms, each gene
encodes a single polypeptide. The eukaryotic nuclear
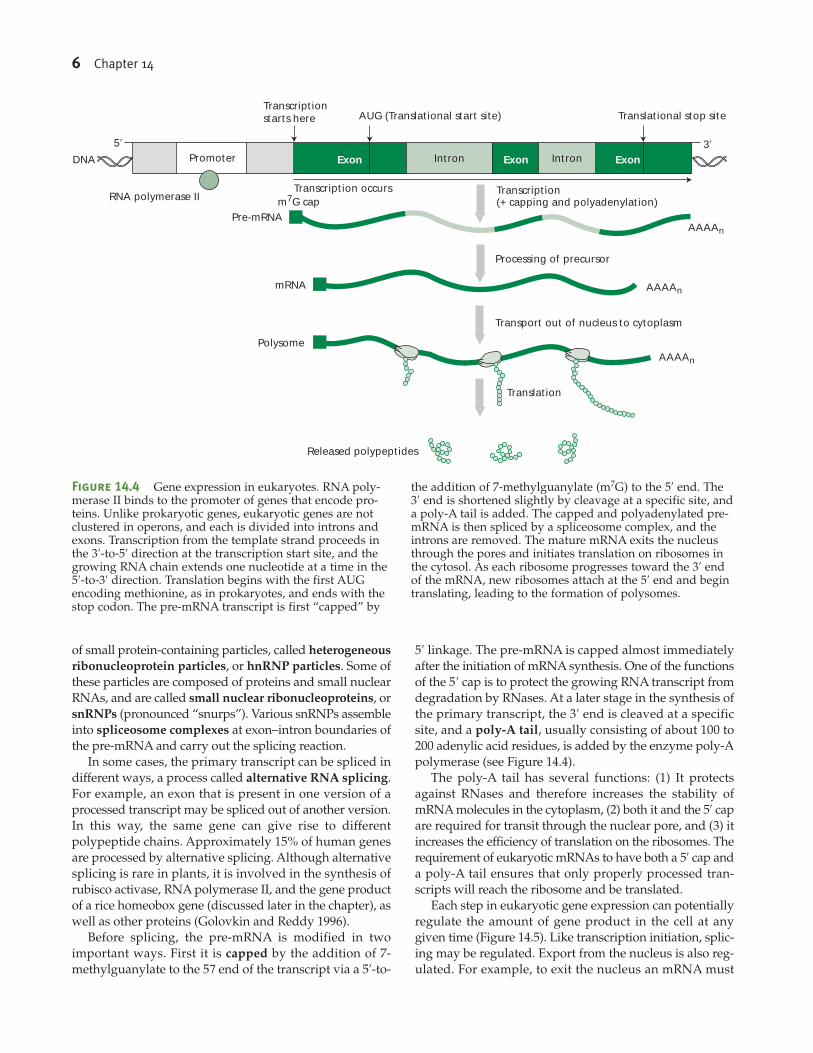
genome contains no operons, with one notable exception.*Furthermore, eukaryotic genes are divided into coding
regions called exons and noncoding regions called introns
(Figure 14.4). Since the primary transcript, or pre-mRNA,
contains both exon and intron sequences, the pre-mRNA
must be processed to remove the introns.
RNA processing involves multiple steps. The newly syn-
thesized pre-mRNA is immediately packaged into a string
Gene EDNA
mRNA
Gene D Gene C Gene B Gene A
Gene E Gene D Gene C Gene B Gene A
Tryptophan operon
Translation
Transcription
mRNA
Translation
Transcription
Repressor (inactive)
RNApolymerase
5′
DNA
Repressorprotein
Corepressor(tryptophan)
5′
3′
3′
(A)
(B)
RNApolymerase
mRNA
Transcription occurs
Repressor–corepressor complex (active)
Transcription is blocked
Enzymes for tryptophan synthesis
Regulatorygene i
Promoter pOperator o
Regulatorygene i
Promoter pOperator o
Figure 14.3 The tryptophan (trp) operon of E. coli. Tryptophan (Trp) is the endproduct of the pathway catalyzed by tryptophan synthetase and other enzymes.Transcription of the repressor genes results in the production of a repressor protein.However, the repressor is inactive until it forms a complex with its co-repressor,Trp. (A) In the absence of Trp, transcription and translation proceed. (B) In the pres-ence of Trp, the activated repressor–co-repressor complex blocks transcription bybinding to the operator sequence.
*About 15% of all C. elegans genes are in operons ranging from two toeight genes long.
6 Chapter 14
of small protein-containing particles, called heterogeneous
ribonucleoprotein particles, or hnRNP particles. Some of
these particles are composed of proteins and small nuclear
RNAs, and are called small nuclear ribonucleoproteins, or
snRNPs (pronounced “snurps”). Various snRNPs assemble
into spliceosome complexes at exon–intron boundaries of
the pre-mRNA and carry out the splicing reaction.
In some cases, the primary transcript can be spliced in
different ways, a process called alternative RNA splicing.
For example, an exon that is present in one version of a
processed transcript may be spliced out of another version.
In this way, the same gene can give rise to different
polypeptide chains. Approximately 15% of human genes
are processed by alternative splicing. Although alternative
splicing is rare in plants, it is involved in the synthesis of
rubisco activase, RNA polymerase II, and the gene product
of a rice homeobox gene (discussed later in the chapter), as
well as other proteins (Golovkin and Reddy 1996).
Before splicing, the pre-mRNA is modified in two
important ways. First it is capped by the addition of 7-
methylguanylate to the 57 end of the transcript via a 5′-to-
5′ linkage. The pre-mRNA is capped almost immediately
after the initiation of mRNA synthesis. One of the functions
of the 5′ cap is to protect the growing RNA transcript from
degradation by RNases. At a later stage in the synthesis of
the primary transcript, the 3′ end is cleaved at a specific
site, and a poly-A tail, usually consisting of about 100 to
200 adenylic acid residues, is added by the enzyme poly-A
polymerase (see Figure 14.4).
The poly-A tail has several functions: (1) It protects
against RNases and therefore increases the stability of
mRNA molecules in the cytoplasm, (2) both it and the 5′ cap
are required for transit through the nuclear pore, and (3) it
increases the efficiency of translation on the ribosomes. The
requirement of eukaryotic mRNAs to have both a 5′ cap and
a poly-A tail ensures that only properly processed tran-
scripts will reach the ribosome and be translated.
Each step in eukaryotic gene expression can potentially
regulate the amount of gene product in the cell at any
given time (Figure 14.5). Like transcription initiation, splic-
ing may be regulated. Export from the nucleus is also reg-
ulated. For example, to exit the nucleus an mRNA must
Intron IntronDNA Promoter Exon Exon Exon
Translational stop siteAUG (Translational start site)Transcriptionstarts here
RNA polymerase II
5′ 3′
mRNA
Polysome
Released polypeptides
Pre-mRNAm7G cap
Transcription occurs Transcription(+ capping and polyadenylation)
Translation
Transport out of nucleus to cytoplasm
Processing of precursor
AAAAn
AAAAn
AAAAn
Figure 14.4 Gene expression in eukaryotes. RNA poly-merase II binds to the promoter of genes that encode pro-teins. Unlike prokaryotic genes, eukaryotic genes are notclustered in operons, and each is divided into introns andexons. Transcription from the template strand proceeds inthe 3′-to-5′ direction at the transcription start site, and thegrowing RNA chain extends one nucleotide at a time in the5′-to-3′ direction. Translation begins with the first AUGencoding methionine, as in prokaryotes, and ends with thestop codon. The pre-mRNA transcript is first “capped” by
the addition of 7-methylguanylate (m7G) to the 5′ end. The3′ end is shortened slightly by cleavage at a specific site, anda poly-A tail is added. The capped and polyadenylated pre-mRNA is then spliced by a spliceosome complex, and theintrons are removed. The mature mRNA exits the nucleusthrough the pores and initiates translation on ribosomes inthe cytosol. As each ribosome progresses toward the 3′ endof the mRNA, new ribosomes attach at the 5′ end and begintranslating, leading to the formation of polysomes.
Gene Expression and Signal Transduction 7
possess a 5′ cap and a poly-A tail, and it must be properly
spliced. Incompletely processed transcripts remain in the
nucleus and are degraded.
Various posttranscriptional regulatory mechanismshave been identifiedThe stabilities or turnover rates of mRNA molecules differ
from one another, and may vary from tissue to tissue,
depending on the physiological conditions. For example,
in fava bean (Vicia faba), fungal infection causes the rapid
degradation of the mRNA that encodes the proline-rich
protein PvPRP1 of the bean cell wall. Another example of
the regulation of gene expression by RNA degradation is
the regulation of expression of one of the genes for the
small subunit of rubisco in roots of the aquatic duckweed
Lemna gibba. Lemna roots are photosynthetic and therefore
express genes for the small subunit of rubisco, but the
expression of one of the genes (SSU5B) is much lower in
roots than in the fronds (leaves). The low level of SSU5B in
the roots is due to a high rate of turnover of the SSU5B pre-
mRNA in the nucleus (Peters and Silverthorne 1995).
In addition to RNA turnover, the translatability of
mRNA molecules is variable. For example, RNAs fold into
molecules with varying secondary and tertiary structures
that can influence the accessibility of the translation initia-
tion codon (the first AUG sequence) to the ribosome.
Another factor that can influence translatability of an
mRNA is codon usage. There is redundancy in the triplet
codons that specify a given amino acid during translation,
and each cell has a characteristic ratio of the different
aminoacylated tRNAs available, known as codon bias. If a
message contains a large number of triplet codons that are
rare for that cell, the small number of charged tRNAs avail-
able for those codons will slow translation. Finally, the cel-
lular location at which translation occurs seems to affect
the rate of gene expression. Free polysomes may translate
mRNAs at very different rates from those at which
polysomes bound to the endoplasmic reticulum do; even
within the endoplasmic reticulum, there may be differen-
tial translation rates.
Although examples of posttranscriptional regulation
have been demonstrated for each of the steps described
above and summarized in Figure 14.5, the expression of mosteukaryotic genes, like their prokaryotic counterparts, appears tobe regulated at the level of transcription.
Transcription in eukaryotes is controlled by cis-acting regulatory sequencesThe synthesis of most eukaryotic proteins is regulated at
the level of transcription. However, transcription in eukary-
otes is much more complex than in prokaryotes. First, there
are three different RNA polymerases in eukaryotes: I, II,
and III. RNA polymerase I is located in the nucleolus and
functions in the synthesis of most ribosomal RNAs. RNA
polymerase II, located in the nucleoplasm, is responsible
for pre-mRNA synthesis. RNA polymerase III, also located
in the nucleoplasm, synthesizes small RNAs, such as tRNA
and 5S rRNA.
A second important difference between transcription in
prokaryotes and in eukaryotes is that the RNA polymeras-
es of eukaryotes require additional proteins called general
transcription factors to position them at the correct start
site. While prokaryotic RNA polymerases also require
accessory polypeptides called sigma factors (σ), these
polypeptides are considered to be subunits of the RNA
polymerase. In contrast, eukaryotic general transcription
factors make up a large, multisubunit transcription initia-
The levels for controlof gene expression
Genome
Transcription
RNA processingand translocation
Translation
Posttranslation
Chromatin
DNA available for expression
NUCLEUS
CYTOPLASM
Gene amplification (rare)DNA rearrangements (rare)Chromatin decondensationDNA methylation
RNA polymerase II
Primary RNA transcript
Processing (5′ capping, additionof poly-A tail, excision ofintrons, splicing together ofexons) and turnover
mRNA in nucleus
Transport of mRNA acrossnuclear envelope
mRNA in cytosol
mRNA degradation(turnover)
Functional protein
Protein degradation(turnover)
Translation
Possible targeting to ER
Polypeptide product in cytosol or ER
Protein folding and assemblyPossible polypeptide cleavagePossible modificationPossible import into organelles
1
2
3
4
5
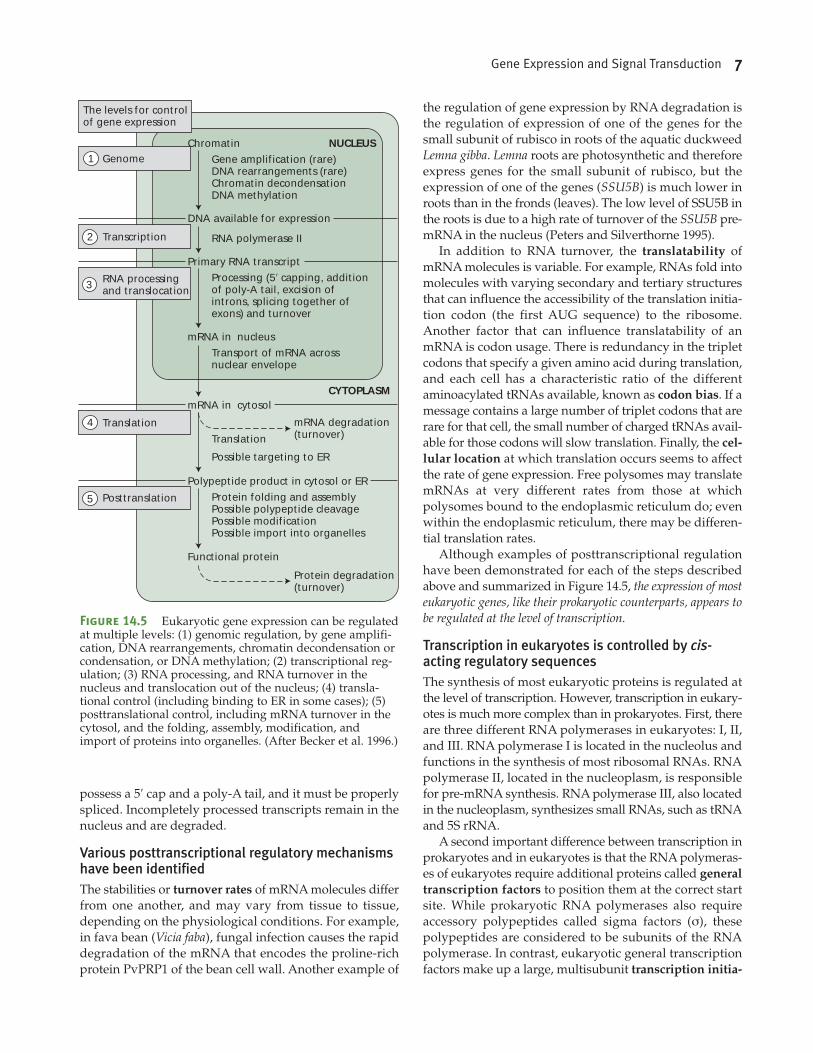
Figure 14.5 Eukaryotic gene expression can be regulatedat multiple levels: (1) genomic regulation, by gene amplifi-cation, DNA rearrangements, chromatin decondensation orcondensation, or DNA methylation; (2) transcriptional reg-ulation; (3) RNA processing, and RNA turnover in thenucleus and translocation out of the nucleus; (4) transla-tional control (including binding to ER in some cases); (5)posttranslational control, including mRNA turnover in thecytosol, and the folding, assembly, modification, andimport of proteins into organelles. (After Becker et al. 1996.)
8 Chapter 14
tion complex. For example, seven general transcription fac-
tors constitute the initiation complex of RNA polymerase
II, each of which must be added in a specific order during
assembly (Figure 14.6).
Transcription is initiated when the final transcription
factor, TFIIH (transcription factor for RNA polymerase IIprotein H), joins the complex and causes phosphorylation
of the RNA polymerase. RNA polymerase II then separates
from the initiation complex and proceeds along the anti-
sense strand in the 3′-to-5′ direction. While some of the gen-
eral transcription factors dissociate from the complex at this
point, others remain to bind another RNA polymerase mol-
ecule and initiate another round of transcription.
A third difference between transcription in prokaryotes
and in eukaryotes is in the complexity of the promoters, the
sequences upstream (5′) of the initiation site that regulate
transcription. We can divide the structure of the eukaryotic
promoter into two parts, the core or minimum promoter,
consisting of the minimum upstream sequence required for
gene expression, and the additional regulatory sequences,
which control the activity of the core promoter.
Each of the three RNA polymerases has a different type
of promoter. An example of a typical RNA polymerase II
promoter is shown schematically in Figure 14.7A. The min-
imum promoter for genes transcribed by RNA polymerase
II typically extends about 100 bp upstream of the transcrip-
tion initiation site and includes several sequence elements
referred to as proximal promoter sequences. About 25 to
35 bp upstream of the transcriptional start site is a short
sequence called the TATA box, consisting of the sequence
TATAAA(A). The TATA box plays a crucial role in tran-
scription because it serves as the site of assembly of the
transcription initiation complex. Approximately 85% of the
plant genes sequenced thus far contain TATA boxes.
In addition to the TATA box, the minimum promoters of
eukaryotes also contain two additional regulatory sequences:
the CAAT box and the GC box (see Figure 14.7A). These two
sequences are the sites of binding of transcription factors,
proteins that enhance the rate of transcription by facilitating
the assembly of the initiation complex. The DNA sequences
themselves are termed cis-acting sequences, since they are
adjacent to the transcription units they are regulating. The
transcription factors that bind to the cis-acting sequences are
called trans-acting factors, since the genes that encode them
are located elsewhere in the genome.
Numerous other cis-acting sequences located farther
upstream of the proximal promoter sequences can exert
either positive or negative control over eukaryotic promot-
ers. These sequences are termed the distal regulatory
sequences and they are usually located within 1000 bp of
the transcription initiation site. As with prokaryotes, the
positively acting transcription factors that bind to these
sites are called activators, while those that inhibit transcrip-
tion are called repressors.
As we will see in Chapters 19 and 20, the regulation of
gene expression by the plant hormones and by phy-
tochrome is thought to involve the deactivation of repres-
sor proteins. Cis-acting sequences involved in gene regula-
tion by hormones and other signaling agents are called
response elements. As will be discussed in Chapters 17
and 19 through 24 (on phytochrome and the plant hor-
mones), numerous response elements that regulate gene
expression have been identified in plants.
In addition to having regulatory sequences within the
promoter itself, eukaryotic genes can be regulated by con-
trol elements located tens of thousands of base pairs away
1
P P P P
Transcription Begins
Protein kinase (TFIIH) activity
Start of transcription
TFIID
TATA
TFIIB
TFIIF
TFIIE
TFIIH RNA polymerase II
2
3
4
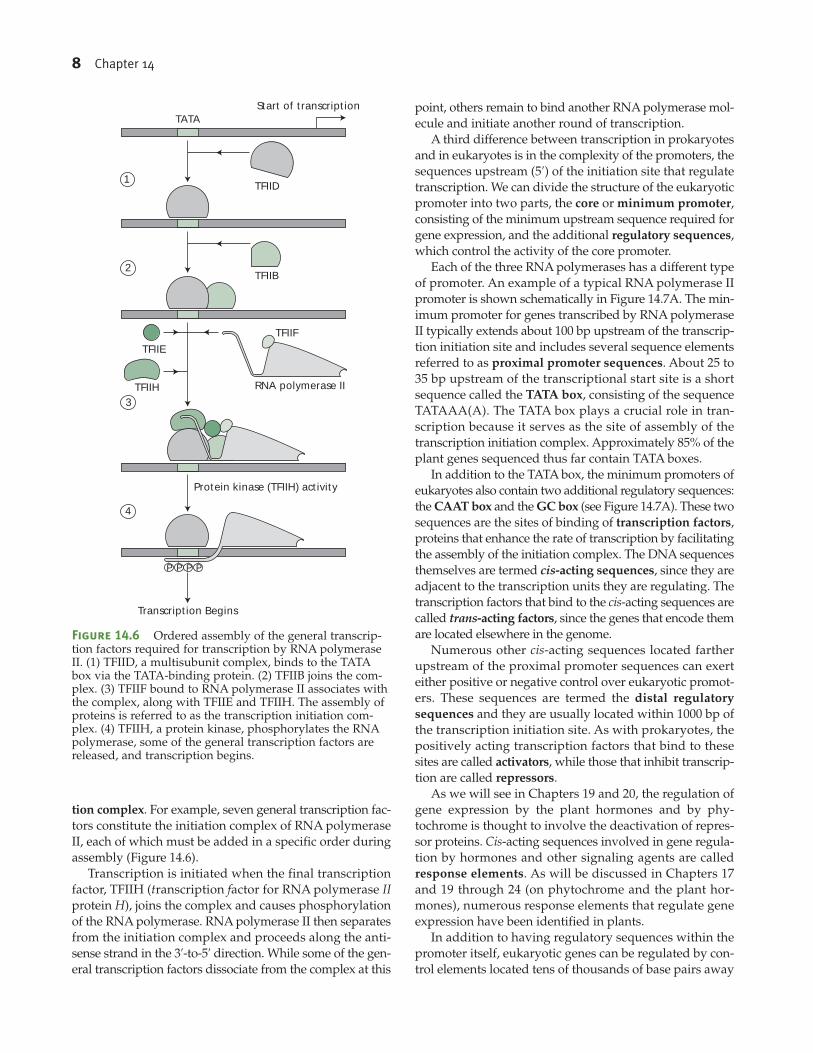
Figure 14.6 Ordered assembly of the general transcrip-tion factors required for transcription by RNA polymeraseII. (1) TFIID, a multisubunit complex, binds to the TATAbox via the TATA-binding protein. (2) TFIIB joins the com-plex. (3) TFIIF bound to RNA polymerase II associates withthe complex, along with TFIIE and TFIIH. The assembly ofproteins is referred to as the transcription initiation com-plex. (4) TFIIH, a protein kinase, phosphorylates the RNApolymerase, some of the general transcription factors arereleased, and transcription begins.
Gene Expression and Signal Transduction 9
from the start site. Distantly located positive regulatory
sequences are called enhancers. Enhancers may be located
either upstream or downstream from the promoter. In
plants, most gene promoters are relatively compact,
although enhancer elements are more common in genes of
the flavonoid biosynthesis pathway (Zhang and Peterson
2005) (see Chapter 13).
How do all the DNA-binding proteins on the cis-acting
sequences regulate transcription? During formation of the
initiation complex, the DNA between the core promoter
and the most distally located control elements loops out in
such a way as to allow all of the transcription factors bound
to that segment of DNA to make physical contact with the
initiation complex (see Figure 14.7B). Through this physi-
cal contact the transcription factor exerts its control, either
positive or negative, over transcription. Given the large
number of control elements that can modify the activity of
a single promoter, the possibilities for differential gene reg-
ulation in eukaryotes are nearly infinite.
Transcription factors contain specific structural motifsTranscription factors generally have three structural fea-
tures: a DNA-binding domain, a transcription-activating
domain, and a ligand-binding domain. To bind to a specif-
ic sequence of DNA, the DNA-binding domain must have
extensive interactions with the double helix through the
formation of hydrogen, ionic, and hydrophobic bonds.
Although the particular combination and spatial distribu-
tion of such interactions are unique for each sequence,
analyses of many DNA-binding proteins have led to the
identification of a small number of highly conserved
DNA-binding structural motifs, which are summarized in
Table 14.1.
GGGCGG
GC box CAAT box
Gene X
Promoter
DNAGCCCAATCT TATAAA
TATA
RNA polymerase II andgeneral transcription factors
SpacerDNA
The genecontrolregionfor gene X
Silent assembly ofregulatory proteins
Strongly activatingassembly
Stronglyinhibitingprotein
Weaklyactivatingproteinassembly
Gene regulatory proteins RNApolymerase II
Regulatorysequence
Proximal control element
Generaltranscriptionfactors
RNAtranscript
(A)
(B)
–100 –80
TATA box
–25
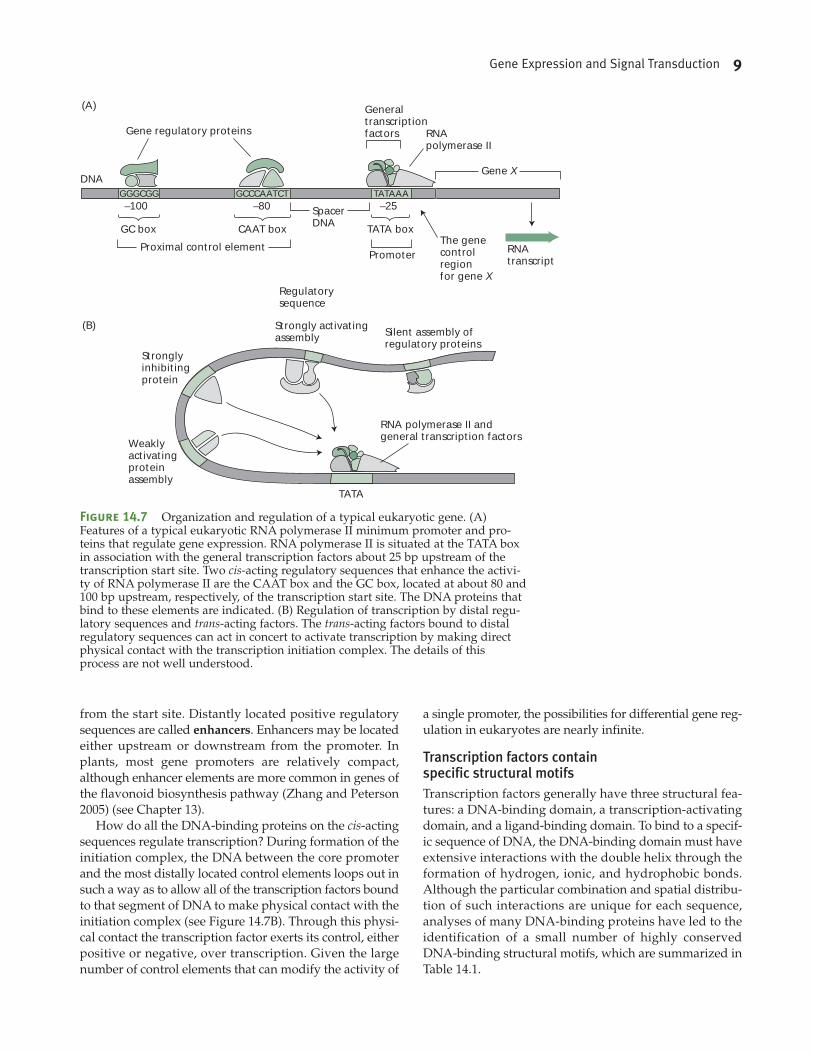
Figure 14.7 Organization and regulation of a typical eukaryotic gene. (A)Features of a typical eukaryotic RNA polymerase II minimum promoter and pro-teins that regulate gene expression. RNA polymerase II is situated at the TATA boxin association with the general transcription factors about 25 bp upstream of thetranscription start site. Two cis-acting regulatory sequences that enhance the activi-ty of RNA polymerase II are the CAAT box and the GC box, located at about 80 and100 bp upstream, respectively, of the transcription start site. The DNA proteins thatbind to these elements are indicated. (B) Regulation of transcription by distal regu-latory sequences and trans-acting factors. The trans-acting factors bound to distalregulatory sequences can act in concert to activate transcription by making directphysical contact with the transcription initiation complex. The details of thisprocess are not well understood.
10 Chapter 14
Most of the transcription factors characterized thus far
in plants belong to the basic zipper (bZIP) class of DNA-
binding proteins. DNA-binding proteins containing the
zinc finger domain are relatively rare in plants.
Homeodomain proteins are a special class of helix-turn-helix proteinsThe term “homeodomain protein” is derived from a group
of Drosophila (fruit fly) genes called selector genes or
homeotic genes. Drosophila homeotic genes encode tran-
scription factors that determine which structures develop
at specific locations on the fly’s body; that is, they act as
major developmental switches that activate a large num-
ber of genes that constitute the entire genetic program for
a particular structure. Mutations in homeotic genes cause
homeosis, the transformation of one body part into anoth-
er. For example, a homeotic mutation in the ANTENNAPE-DIA gene causes a leg to form in place of an antenna. When
the sequences of various homeotic genes in Drosophila were
compared, the proteins were all found to contain a highly
conserved stretch of 60 amino acids called the homeobox.
Homologous homeobox sequences have now been iden-
tified in developmentally important genes of vertebrates
and plants. As will be discussed in Chapter 16, the KNOT-TED (KN1) gene of maize encodes a homeodomain protein
that can affect cell fate during development. Maize plants
with the kn1 mutation exhibit abnormal cell divisions in the
vascular tissues, giving rise to the “knotted” appearance of
the leaf surface. However, the kn1 mutation is not a homeot-
ic mutation, since it does not involve the substitution of one
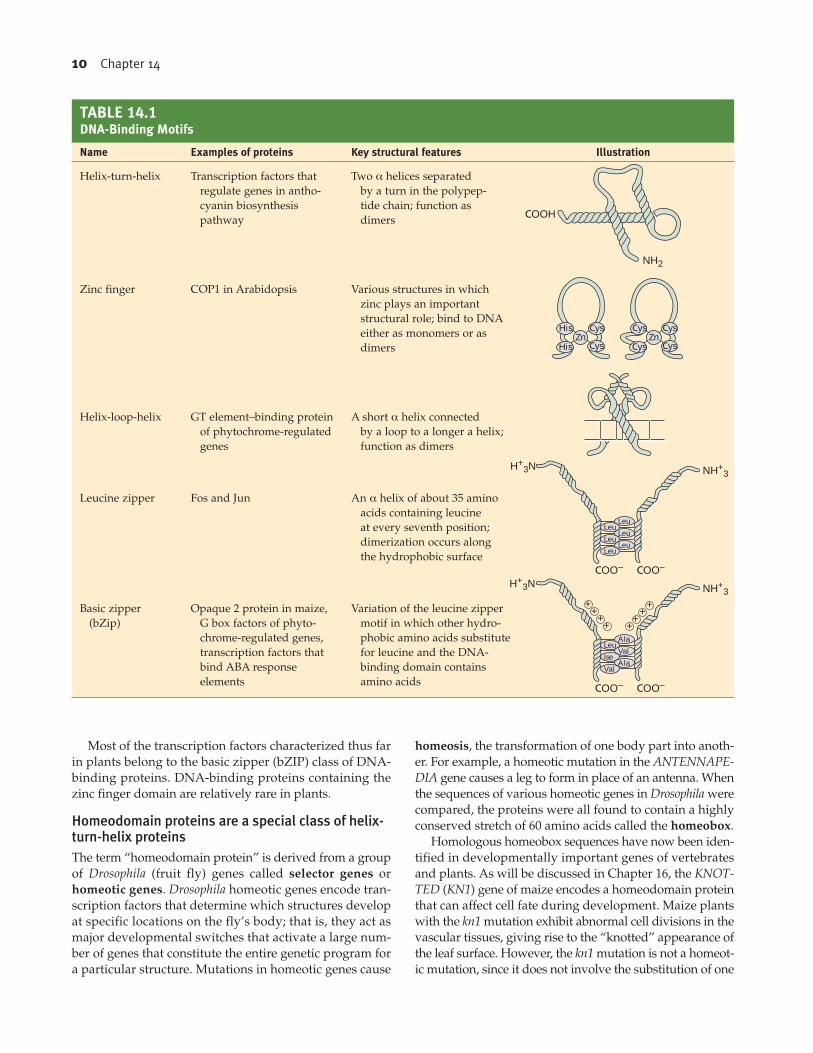
TABLE 14.1
DNA-Binding Motifs
Name Examples of proteins Key structural features Illustration
Helix-turn-helix Transcription factors that Two α helices separated
regulate genes in antho- by a turn in the polypep-
cyanin biosynthesis tide chain; function as
pathway dimers
Zinc finger COP1 in Arabidopsis Various structures in which
zinc plays an important
structural role; bind to DNA
either as monomers or as
dimers
Helix-loop-helix GT element–binding protein A short α helix connected
of phytochrome-regulated by a loop to a longer a helix;
genes function as dimers
Leucine zipper Fos and Jun An α helix of about 35 amino
acids containing leucine
at every seventh position;
dimerization occurs along
the hydrophobic surface
Basic zipper Opaque 2 protein in maize, Variation of the leucine zipper
(bZip) G box factors of phyto- motif in which other hydro-
chrome-regulated genes, phobic amino acids substitute
transcription factors that for leucine and the DNA-
bind ABA response binding domain contains
elements amino acids
COOH
NH2
NH+3
H+3N
ZnHis
His Cys
CysZn
Cys
Cys Cys
Cys
+ ++ +
+ ++ +
LeuLeu
LeuLeu
LeuLeu
NH+3
H+3N
COO– COO–
COO– COO–
AlaLeu
ValIse
AlaVal
Gene Expression and Signal Transduction 11
entire structure for another. Rather, the plant homeodomain
protein, KN1, is involved in the regulation of cell division.
Thus, not all genes that encode homeodomain proteins are
homeotic genes, and vice versa. The Arabidopsis genome
contains over 100 homeodomain sequences, and several of
them (for example, KNOX, BELL, STM, KNAT1, and WUS)
regulate the development of plant organs, although they are
not homeotic genes (see Chapter 16).
As will be discussed in Chapter 25, four of the floral
homeotic genes in plants encode proteins with the DNA-
binding helix-turn-helix motif called the MADS domain.
Eukaryotic genes can be coordinately regulatedAlthough eukaryotic nuclear genes are not arranged into
operons, they are often coordinately regulated in the cell.
For example, in yeast, many of the enzymes involved in
galactose metabolism and transport are inducible and
coregulated, even though the genes are located on differ-
ent chromosomes. Incubation of wild-type yeast cells in
galactose-containing media results in more than a thou-
sandfold increase in the mRNA levels for all of these
enzymes.
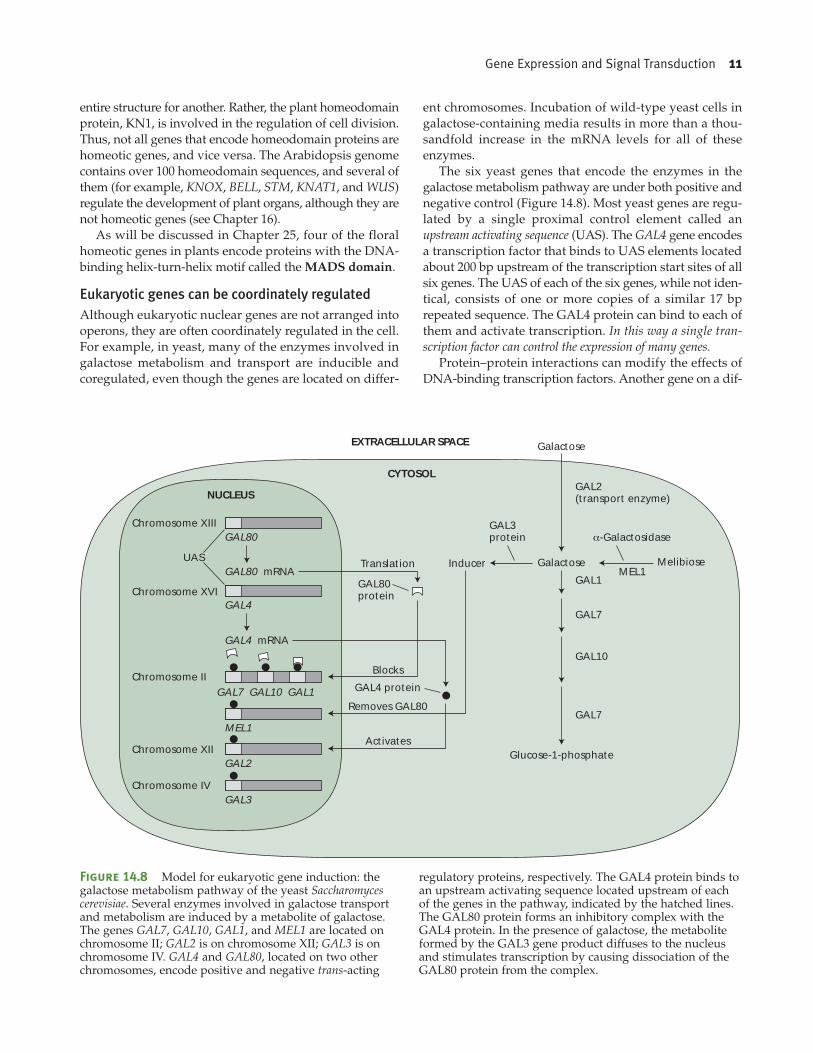
The six yeast genes that encode the enzymes in the
galactose metabolism pathway are under both positive and
negative control (Figure 14.8). Most yeast genes are regu-
lated by a single proximal control element called an
upstream activating sequence (UAS). The GAL4 gene encodes
a transcription factor that binds to UAS elements located
about 200 bp upstream of the transcription start sites of all
six genes. The UAS of each of the six genes, while not iden-
tical, consists of one or more copies of a similar 17 bp
repeated sequence. The GAL4 protein can bind to each of
them and activate transcription. In this way a single tran-scription factor can control the expression of many genes.
Protein–protein interactions can modify the effects of
DNA-binding transcription factors. Another gene on a dif-
EXTRACELLULAR SPACE
NUCLEUS
CYTOSOL
Galactose
Galactose Melibiose
α-GalactosidaseGAL3protein
GAL2(transport enzyme)
Inducer
Glucose-1-phosphate
MEL1GAL1
GAL7
GAL10
GAL7
Chromosome XIII
Chromosome XVI
Chromosome II
Chromosome XII
Chromosome IV
GAL80
Translation
GAL80protein
Blocks
GAL4 protein
Removes GAL80
Activates
GAL80 mRNA
GAL4
GAL4 mRNA
GAL7 GAL10 GAL1
MEL1
GAL2
GAL3
UAS
Figure 14.8 Model for eukaryotic gene induction: thegalactose metabolism pathway of the yeast Saccharomycescerevisiae. Several enzymes involved in galactose transportand metabolism are induced by a metabolite of galactose.The genes GAL7, GAL10, GAL1, and MEL1 are located onchromosome II; GAL2 is on chromosome XII; GAL3 is onchromosome IV. GAL4 and GAL80, located on two otherchromosomes, encode positive and negative trans-acting
regulatory proteins, respectively. The GAL4 protein binds toan upstream activating sequence located upstream of eachof the genes in the pathway, indicated by the hatched lines.The GAL80 protein forms an inhibitory complex with theGAL4 protein. In the presence of galactose, the metaboliteformed by the GAL3 gene product diffuses to the nucleusand stimulates transcription by causing dissociation of theGAL80 protein from the complex.
12 Chapter 14
ferent yeast chromosome, GAL80, encodes a negative tran-
scription regulator that forms a complex with the GAL4
protein when it is bound to the UAS. When the GAL80
protein is complexed with GAL4, transcription is blocked.
In the presence of galactose, however, the metabolite
formed by the enzyme that is encoded by the GAL3 gene
acts as an inducer by causing the dissociation of GAL80
from GAL4 (Johnston 1987; Mortimer et al. 1989).
The GAL4 transcription factor consists of an N-terminal
DNA-binding domain and a C-terminal activation domain,
separated by a flexible protein domain. The DNA-binding
domain binds to a specific DNA sequence element, while
the activation domain initiates transcription of the gene by
interacting with other proteins. Most eukaryotic transcrip-
tion factors have the same basic domain structure as GAL4.
The presence of a flexible protein domain between the
DNA-binding and activation domains allows the transcrip-
tion factor to function even when the distance between the
binding sites and activation sites on the DNA varies
between different related genes.
There are many other examples of coordinate regulation
of genes in eukaryotes. In plants, the developmental effects
induced by light and hormones (see Chapters 17 through
24), as well as the adaptive responses caused by various
types of stress (see Chapter 26), involve the coordinate reg-
ulation of groups of genes that share a common response
element upstream of the promoter. In addition, genes that
act as major developmental switches, such as the homeot-
ic genes, encode transcription factors that bind to a com-
mon regulatory sequence that is present on dozens, or even
hundreds, of genes scattered throughout the genome (see
Chapters 16 and 25).
Small RNAs are posttranscriptional repressors ofgene expressionAfter exiting the nucleus, newly synthesized mRNA asso-
ciates with ribosomes and initiates translation. Several fac-
tors can affect the rate of gene expression posttranscription-
ally. Two of these, mRNA turnover and inhibition of
translation, can be regulated by small RNAs called microR-
NA and short interfering RNA (Baulcombe 2004).
MicroRNAs (miRNAs) were first discovered as muta-
tions in genes of C. elegans that did not encode proteins.
Instead, the products of these genes were short RNAs,
about 21 nucleotides long, that could inhibit the translation
of specific target mRNAs by hybridizing to their 3′ untrans-
lated regions. MiRNAs have since been found to play an
important role in regulating gene expression in both plants
and animals. In plants, however, miRNAs function prima-
rily by directing the cleavage of the target mRNA, rather
than by inhibiting translation on the ribosome.
All miRNAs arise from a 70 nucleotide primary tran-
script called the pri-miRNA. In animals, pri-miRNA itself
is the result of processing of an even longer RNA transcript
in the nucleus by the enzyme Drosha. Thus far, no Drosha
homolog has been found in plants, suggesting that the
early steps of pri-miRNA production may be different in
plants. It has been estimated that the Arabidopsis genome
contains approximately 100 miRNA loci. As we will see in
Chapter 16, miRNAs have been implicated in the regula-
tion of many important developmental events in plants.
The 70-nucleotide pri-miRNA contains palindromic
sequences at its two ends (inverted repeat sequences) that
are complementary and therefore can base pair with each
other. When base-pairing occurs, the pri-miRNA forms
hairpin loops. In animals there are a few mismatches in the
base-pairing of the stem of the hairpin structure (Figure
14.9). These mismatches contribute to the ability of miRNA
to inhibit translation. In plants, however, the base-pairing
in the stem of the pri-miRNA hairpin loop is more precise.
Accordingly, plant miRNAs repress gene expression main-
ly by promoting RNA degradation rather than by inhibit-
ing translation.
The next step involves the processing of the pri-miRNA
stem-loop structure by a ribonuclease that can cleave dou-
ble-stranded RNA. In animal cells, this enzyme is called
Dicer, and it is located in the cytoplasm. Dicer cleaves the
pri-miRNA into a double-stranded RNA fragment, 21–23
nucleotides in length, with overhanging two-nucleotide
tails at the 3′ ends of each strand (see Figure 14.9). Plant
cells contain Dicer-like proteins (for example, DCL1), but
unlike Dicer in animal cells, DCL1 is localized to the nucle-
us, suggesting that the cleavage of pri-miRNA to form the
21- to 23-nucleotide miniduplexes occurs in the nucleus in
plant cells. As described below, the short strands from these
miniduplexes serve as guides to target a ribonuclease com-
plex to specific mRNA molecules. This part of the pathway
is similar to that of a second type of small RNA called shortinterfering RNA.
Short interfering RNA (siRNA) is responsible for the
phenomenon of RNA interference (RNAi). The phenomenon
of RNA interference was first observed in Petunia (Napoli
et al. 1990), although the mechanism was not understood
at the time. In an attempt to produce Petunia flowers with
a deep purple color, petunia plants were transformed with
extra copies of the gene for chalcone synthase, a key
enzyme in the synthesis of anthocyanin pigments (see
Chapter 13). But instead of dark purple flowers, the trans-
formants with extra gene copies produced only white flow-
ers. The tendency of extra copies of a gene to induce the
suppression of the native gene was termed cosuppression.
A related phenomenon was discovered by plant virolo-
gists studying viral resistance mechanisms. The genomes
of most plant viruses consist of single-stranded RNA
(ssRNA). It was known that plants expressing viral pro-
teins exhibited increased resistance to viruses, but it was
subsequently found that even plants expressing short, non-
coding regions of viral RNA sequences became resistant to
the virus. The short viral sequences were somehow able to
attack the incoming viruses.
Gene Expression and Signal Transduction 13
The relationship between cosuppression and viral resist-
ance in plants became apparent with the discovery of
RNA-dependent RNA polymerases (RDRs or RdRPs)
(Baulcombe 2004). RDRs, which form RNA duplexes by
synthesizing antisense RNA using a sense RNA strand as
a template, are required for both cosuppresion and viral
resistance. During cosuppression in Petunia, the presence
of extra chalcone synthase mRNAs triggers the production
of RDRs, which quickly generate RNA duplexes. These
duplexes are then cleaved throughout their length into 21-
to 23-nucleotide double-stranded fragments by Dicer-like
proteins in the nucleus.
Viral resistance in plants also depends on RDRs. Upon
entering the cytoplasm, the viral ssRNA is converted to
double-stranded RNA by plant RDRs. The resulting dou-
ble stranded intermediate then serves as a substrate for
Dicer-like proteins, which generate the canonical 21- to 23-
nucleotide double-stranded fragments involved in the
degradation of the virus (see below). Similar conclusions
about the role of double-stranded RNA in gene suppres-
sion have been reached in studies with other organisms,
including fungi and animals.
After formation of the 21- to 23-nucleotide miRNAs or
siRNAs by the Dicer-like proteins, the duplex associates
with a large ribonuclease complex called the RNA-induced
silencing complex (RISC) (see Figure 14.9). In a reaction
requiring ATP, the RISC then unwinds the duplex and
releases the sense RNA stand. The RISC then uses the
remaining antisense strand as a guide to bind to a target
mRNA or viral sequence, much as the anticodon of tRNA
recognizes the codon of mRNA on the ribosome. In plants,
the miRNA is either perfectly complementary, or nearly
complementary, to the target mRNA sequence, and the
RNA-induced silencing complex typically cleaves the tar-
get RNA in the middle of the binding site. Cleavage ren-
ders the two halves of the mRNA (or virus) susceptible to
further degradation by other cellular ribonucleases.
The ubiquitin pathway regulates protein turnover A protein, once synthesized, has a finite lifetime in the cell,
ranging from a few minutes to several hours. Hence,
steady-state levels of cellular enzymes are attained as the
result of an equilibrium between protein synthesis and pro-
tein degradation, or turnover. Protein turnover plays an
important role in development. In etiolated seedlings, for
example, the red-light photoreceptor phytochrome is reg-
ulated by proteolysis. The phytochrome synthesized in the
dark is highly stable and accumulates in the cells to high
concentrations. Upon exposure to red light, however, the
phytochrome is converted to its active form and simulta-
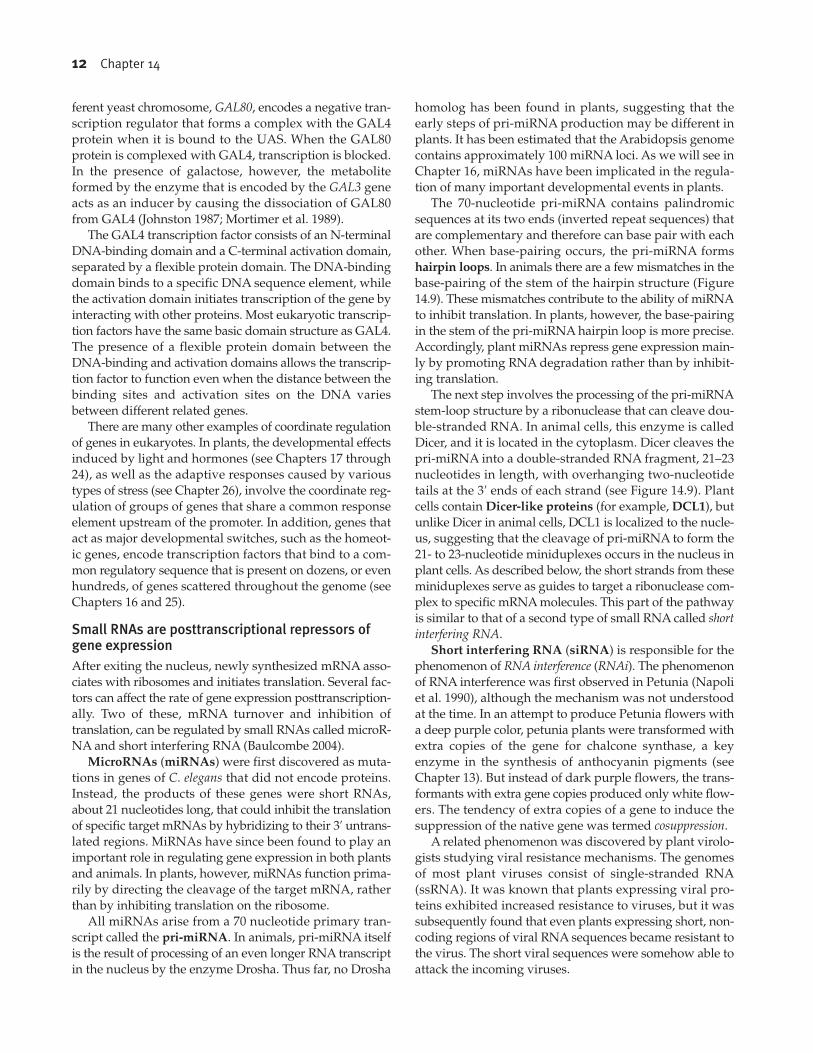
Figure 14.9 Model for the repression of gene expressionby siRNA and miRNA. (1) Pri-miRNA stem-loop structuresand double-stranded RNA generated by the action of RNA-dependent RNA polymerases are processed by the enzymeDICER (or Dicer-like proteins in plants) to 21- to 23-nucleotide sequences, termed miRNA and siRNA, respec-tively. (2) The RNA-induced silencing complex (RISC) asso-
ciates with the miRNA or siRNA and, after activation byATP, releases one of the RNA strands. The remaining RNAstrand serves as a “guide” that directs the complex to its tar-get RNA molecule. (3) The target RNA is cleaved by theRISC ribonuclease, and the cleavage products are furtherdegraded by other cellular ribonucleases.
dsRNA
DICER RISC
RISC*
si/miRNA
siRNA
miRNA
pri-miRNA
NUCLEUS
Activation by ATP
ss si/miRNA
AAAAAAAA
AAAAAA
m7G
m7G
Target mRNA substrate
Cleavage
Degradation
1
2
3
14 Chapter 14
neously becomes highly susceptible to degradation by pro-
teases (see Chapter 17). The auxin receptor appears to be
an enzyme that participates in the turnover of proteins in
the nucleus. By inducing the turnover of repressor proteins,
auxin stimulates the expression of genes important in cell
growth and differentiation (see Chapter 19).
In both plant and animal cells there are two distinct
pathways of protein turnover, one in specialized lytic vac-
uoles (called lysosomes in animal cells) and the other in the
soluble matrix of the cytoplasm and nucleus. Protein
turnover by lytic vacuoles was discussed in Chapter 1.
Autophagosomes containing engulfed cytoplasm can fuse
directly with a lytic vacuole, initiating degradation of the
protein within. Alternatively, the prevacuolar compartment
containing membranes from endocytotic vesicles may also
fuse with a lytic vacuole (see Chapter 1).
The nonvacuolar pathway of protein turnover involves
the ATP-dependent formation of a covalent bond to a
small, 76-amino-acid polypeptide called ubiquitin. Ubiq-
uitination of an enzyme molecule apparently marks it for
destruction by a large ATP-dependent proteolytic complex
(proteasome) that specifically recognizes the “tagged” mol-
ecule (Figure 14.10) (Coux et al. 1996). More than 90% of
the short-lived proteins in eukaryotic cells are degraded via
the ubiquitin pathway (Lam 1997). The ubiquitin pathway
regulates cytosolic and nuclear protein turnover in plant
cells as well (Shanklin et al. 1987):
• Before it can take part in protein tagging, free ubiqui-tin must be activated.
• The ubiquitin-activating enzyme (E1) catalyzes theATP-dependent adenylylation of the C terminus ofubiquitin.
• The adenylylated ubiquitin is then transferred to acysteine residue on a second enzyme, the ubiquitin-
conjugating enzyme (E2).
• Proteins destined for turnover form complexes with athird protein, ubiquitin ligase (E3).
• Finally, the E2–ubiquitin conjugate is used to transferubiquitin to the lysine residues of proteins bound toE3. This process can occur multiple times to form apolymer of ubiquitin.
• The ubiquitinated protein is then targeted to the pro-teasome for degradation.
As we shall see later in the book, a variety of developmental
phenomena in plants are regulated by protein turnover. In
fact, the auxin receptor involved in gene regulation has now
been shown to be a ubiquitin protein ligase (see Chapter 19).
Signal Transduction in ProkaryotesProkaryotic cells could not have survived billions of years of
evolution without an exquisitely developed ability to sense
their environment. As we have seen, bacteria respond to the
presence of a nutrient by synthesizing the proteins involved
in the uptake and metabolism of that nutrient. Bacteria can
also respond to nonnutrient signals, both physical and
chemical. Motile bacteria can adjust their movements
according to the prevailing gradients of light, oxygen, osmo-
larity, temperature, and toxic chemicals in the medium.
The basic mechanisms that enable bacteria to sense and
to respond to their environment are common to all cell sen-
sory systems and include stimulus detection, signal amplifi-cation, and the appropriate output responses. Many bacteri-
al signaling pathways have been shown to consist of
modular units called transmitters and receivers. These mod-
ules form the basis of the so-called two-component regula-
tory systems.
Bacteria employ two-component regulatorysystems to sense extracellular signalsBacteria sense chemicals in the environment by means of
a small family of cell surface receptors, each involved in the
response to a defined group of chemicals (hereafter referred
to as ligands). A protein in the plasma membrane of bacte-
ria binds directly to a ligand, or binds to a soluble protein
that has already attached to the ligand, in the periplasmic
space between the plasma membrane and the cell wall.
Upon binding, the membrane protein undergoes a confor-
mational change that is propagated across the membrane to
the cytosolic domain of the receptor protein. This conforma-
tional change initiates the signaling pathway that leads to
the response.
E1
E1
E2
E2
E3
AMP
ATP+
UU U
U
U
UU
U
U
U
U
U
Target Target
Degradation
Target
Ubiquitin activation
26Sproteasome
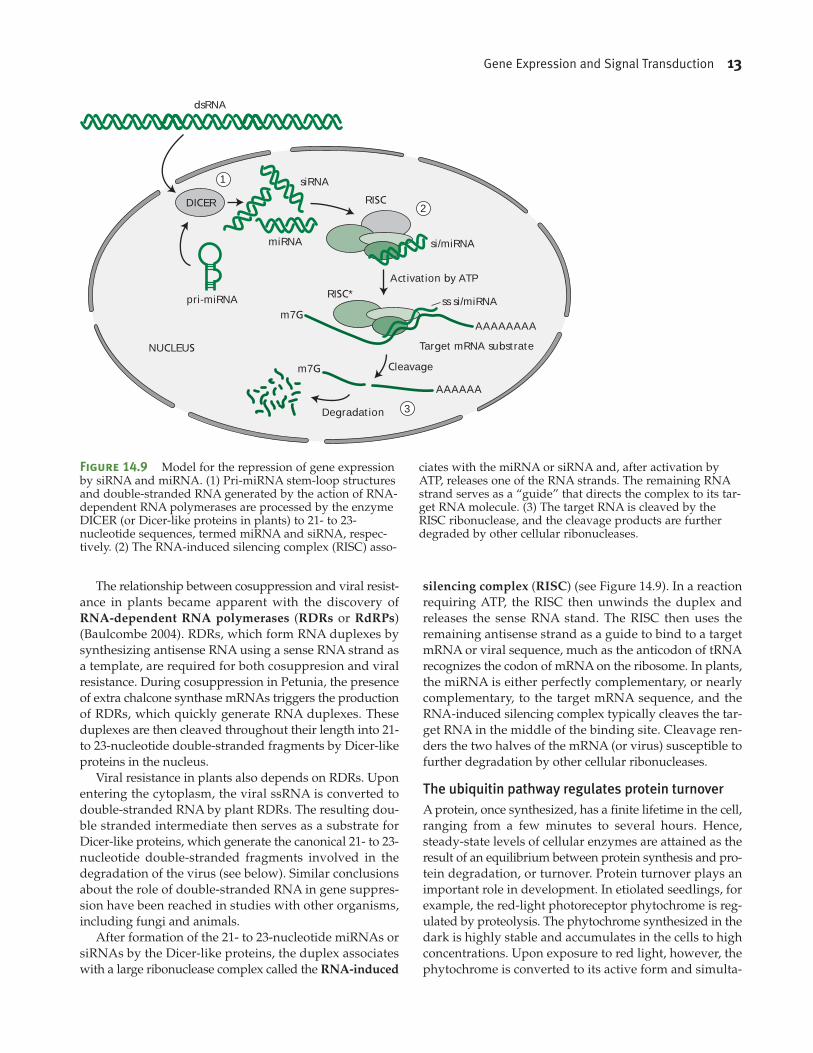
Figure 14.10 Diagram of the ubiquitin (U) pathway ofprotein degradation in the cytosol. ATP is required for theinitial activation of E1. E1 transfers ubiquitin to E2. E3 medi-ates the final transfer of ubiquitin to a target protein, whichmay be ubiquitinated multiple times. The ubiquitinated tar-get protein is then degraded by the 26S proteasome.
Gene Expression and Signal Transduction 15
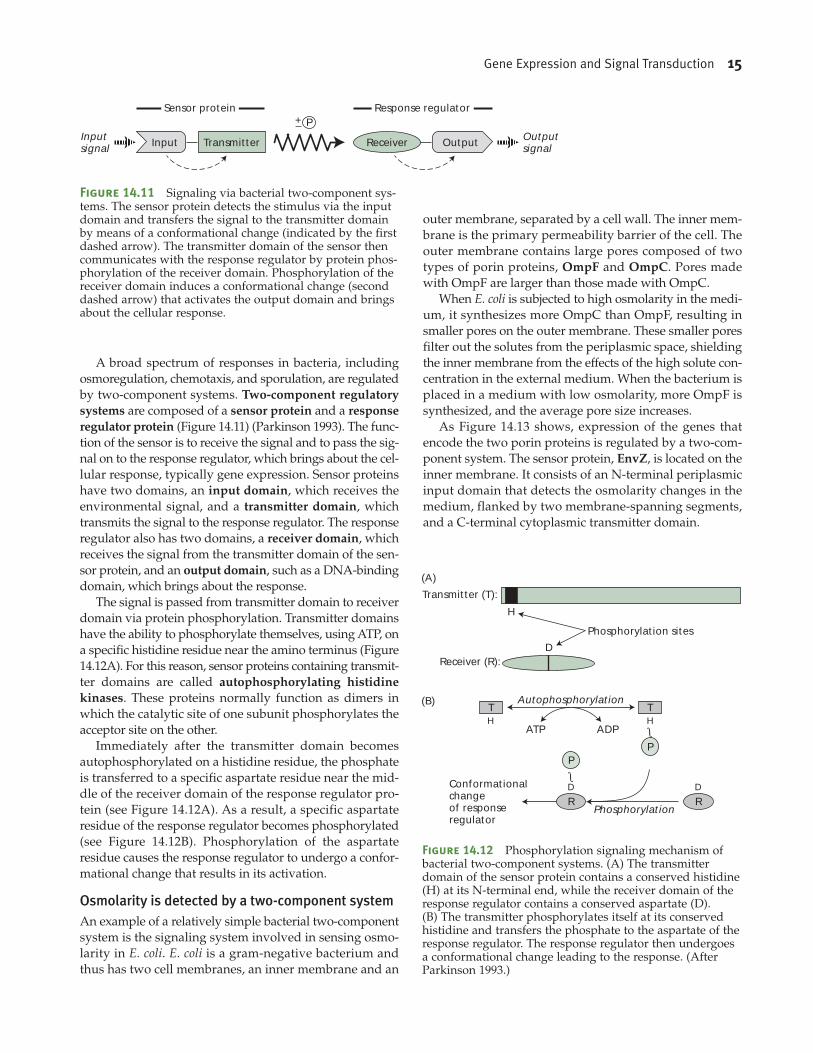
A broad spectrum of responses in bacteria, including
osmoregulation, chemotaxis, and sporulation, are regulated
by two-component systems. Two-component regulatory
systems are composed of a sensor protein and a response
regulator protein (Figure 14.11) (Parkinson 1993). The func-
tion of the sensor is to receive the signal and to pass the sig-
nal on to the response regulator, which brings about the cel-
lular response, typically gene expression. Sensor proteins
have two domains, an input domain, which receives the
environmental signal, and a transmitter domain, which
transmits the signal to the response regulator. The response
regulator also has two domains, a receiver domain, which
receives the signal from the transmitter domain of the sen-
sor protein, and an output domain, such as a DNA-binding
domain, which brings about the response.
The signal is passed from transmitter domain to receiver
domain via protein phosphorylation. Transmitter domains
have the ability to phosphorylate themselves, using ATP, on
a specific histidine residue near the amino terminus (Figure
14.12A). For this reason, sensor proteins containing transmit-
ter domains are called autophosphorylating histidine
kinases. These proteins normally function as dimers in
which the catalytic site of one subunit phosphorylates the
acceptor site on the other.
Immediately after the transmitter domain becomes
autophosphorylated on a histidine residue, the phosphate
is transferred to a specific aspartate residue near the mid-
dle of the receiver domain of the response regulator pro-
tein (see Figure 14.12A). As a result, a specific aspartate
residue of the response regulator becomes phosphorylated
(see Figure 14.12B). Phosphorylation of the aspartate
residue causes the response regulator to undergo a confor-
mational change that results in its activation.
Osmolarity is detected by a two-component systemAn example of a relatively simple bacterial two-component
system is the signaling system involved in sensing osmo-
larity in E. coli. E. coli is a gram-negative bacterium and
thus has two cell membranes, an inner membrane and an
outer membrane, separated by a cell wall. The inner mem-
brane is the primary permeability barrier of the cell. The
outer membrane contains large pores composed of two
types of porin proteins, OmpF and OmpC. Pores made
with OmpF are larger than those made with OmpC.
When E. coli is subjected to high osmolarity in the medi-
um, it synthesizes more OmpC than OmpF, resulting in
smaller pores on the outer membrane. These smaller pores
filter out the solutes from the periplasmic space, shielding
the inner membrane from the effects of the high solute con-
centration in the external medium. When the bacterium is
placed in a medium with low osmolarity, more OmpF is
synthesized, and the average pore size increases.
As Figure 14.13 shows, expression of the genes that
encode the two porin proteins is regulated by a two-com-
ponent system. The sensor protein, EnvZ, is located on the
inner membrane. It consists of an N-terminal periplasmic
input domain that detects the osmolarity changes in the
medium, flanked by two membrane-spanning segments,
and a C-terminal cytoplasmic transmitter domain.
Sensor protein Response regulator
Inputsignal
OutputsignalInput OutputTransmitter Receiver
P+–
P
R R
HH
Transmitter (T):
(A)
(B)
Receiver (R):
H
Phosphorylation sites
D
T TAutophosphorylation
Phosphorylation
ATP ADP
P
D DConformationalchangeof responseregulator
∫
∫
Figure 14.11 Signaling via bacterial two-component sys-tems. The sensor protein detects the stimulus via the inputdomain and transfers the signal to the transmitter domainby means of a conformational change (indicated by the firstdashed arrow). The transmitter domain of the sensor thencommunicates with the response regulator by protein phos-phorylation of the receiver domain. Phosphorylation of thereceiver domain induces a conformational change (seconddashed arrow) that activates the output domain and bringsabout the cellular response.
Figure 14.12 Phosphorylation signaling mechanism ofbacterial two-component systems. (A) The transmitterdomain of the sensor protein contains a conserved histidine(H) at its N-terminal end, while the receiver domain of theresponse regulator contains a conserved aspartate (D). (B) The transmitter phosphorylates itself at its conservedhistidine and transfers the phosphate to the aspartate of theresponse regulator. The response regulator then undergoesa conformational change leading to the response. (AfterParkinson 1993.)
16 Chapter 14
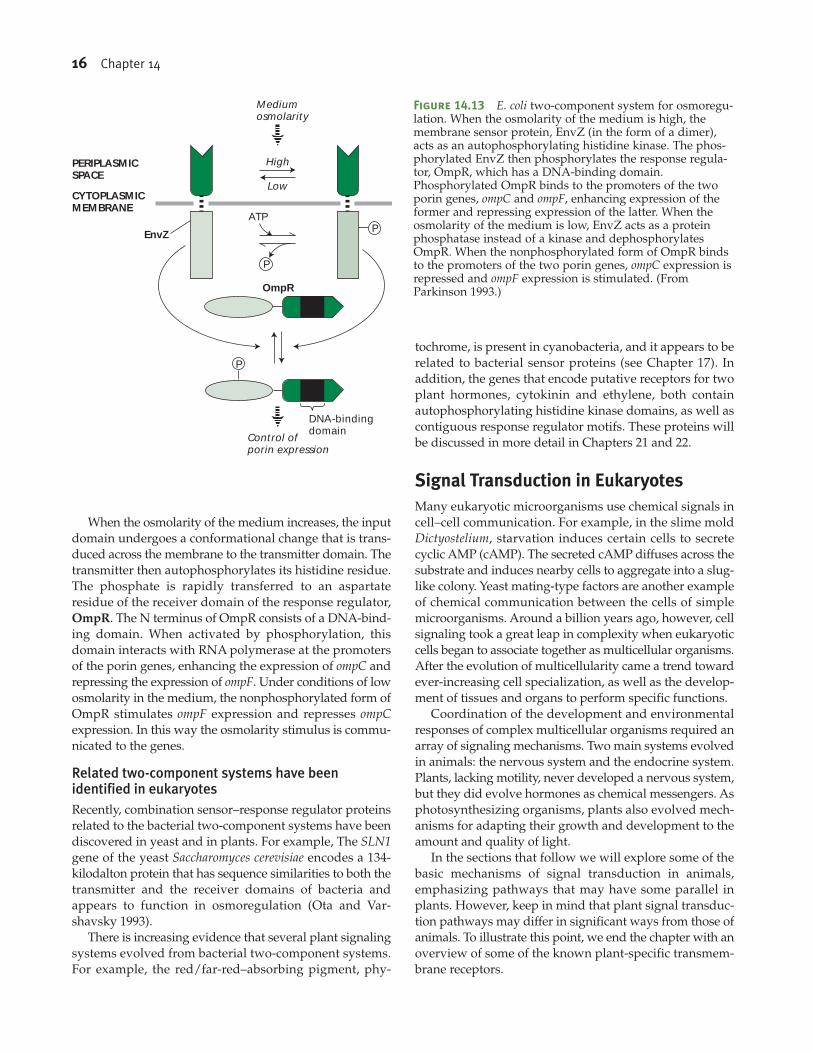
When the osmolarity of the medium increases, the input
domain undergoes a conformational change that is trans-
duced across the membrane to the transmitter domain. The
transmitter then autophosphorylates its histidine residue.
The phosphate is rapidly transferred to an aspartate
residue of the receiver domain of the response regulator,
OmpR. The N terminus of OmpR consists of a DNA-bind-
ing domain. When activated by phosphorylation, this
domain interacts with RNA polymerase at the promoters
of the porin genes, enhancing the expression of ompC and
repressing the expression of ompF. Under conditions of low
osmolarity in the medium, the nonphosphorylated form of
OmpR stimulates ompF expression and represses ompCexpression. In this way the osmolarity stimulus is commu-
nicated to the genes.
Related two-component systems have beenidentified in eukaryotesRecently, combination sensor–response regulator proteins
related to the bacterial two-component systems have been
discovered in yeast and in plants. For example, The SLN1gene of the yeast Saccharomyces cerevisiae encodes a 134-
kilodalton protein that has sequence similarities to both the
transmitter and the receiver domains of bacteria and
appears to function in osmoregulation (Ota and Var-
shavsky 1993).
There is increasing evidence that several plant signaling
systems evolved from bacterial two-component systems.
For example, the red/far-red–absorbing pigment, phy-
tochrome, is present in cyanobacteria, and it appears to be
related to bacterial sensor proteins (see Chapter 17). In
addition, the genes that encode putative receptors for two
plant hormones, cytokinin and ethylene, both contain
autophosphorylating histidine kinase domains, as well as
contiguous response regulator motifs. These proteins will
be discussed in more detail in Chapters 21 and 22.
Signal Transduction in EukaryotesMany eukaryotic microorganisms use chemical signals in
cell–cell communication. For example, in the slime mold
Dictyostelium, starvation induces certain cells to secrete
cyclic AMP (cAMP). The secreted cAMP diffuses across the
substrate and induces nearby cells to aggregate into a slug-
like colony. Yeast mating-type factors are another example
of chemical communication between the cells of simple
microorganisms. Around a billion years ago, however, cell
signaling took a great leap in complexity when eukaryotic
cells began to associate together as multicellular organisms.
After the evolution of multicellularity came a trend toward
ever-increasing cell specialization, as well as the develop-
ment of tissues and organs to perform specific functions.
Coordination of the development and environmental
responses of complex multicellular organisms required an
array of signaling mechanisms. Two main systems evolved
in animals: the nervous system and the endocrine system.
Plants, lacking motility, never developed a nervous system,
but they did evolve hormones as chemical messengers. As
photosynthesizing organisms, plants also evolved mech-
anisms for adapting their growth and development to the
amount and quality of light.
In the sections that follow we will explore some of the
basic mechanisms of signal transduction in animals,
emphasizing pathways that may have some parallel in
plants. However, keep in mind that plant signal transduc-
tion pathways may differ in significant ways from those of
animals. To illustrate this point, we end the chapter with an
overview of some of the known plant-specific transmem-
brane receptors.
Figure 14.13 E. coli two-component system for osmoregu-lation. When the osmolarity of the medium is high, themembrane sensor protein, EnvZ (in the form of a dimer),acts as an autophosphorylating histidine kinase. The phos-phorylated EnvZ then phosphorylates the response regula-tor, OmpR, which has a DNA-binding domain.Phosphorylated OmpR binds to the promoters of the twoporin genes, ompC and ompF, enhancing expression of theformer and repressing expression of the latter. When theosmolarity of the medium is low, EnvZ acts as a proteinphosphatase instead of a kinase and dephosphorylatesOmpR. When the nonphosphorylated form of OmpR bindsto the promoters of the two porin genes, ompC expression isrepressed and ompF expression is stimulated. (FromParkinson 1993.)
PERIPLASMICSPACE
CYTOPLASMICMEMBRANE
P
ATP
P
P
Mediumosmolarity
Control ofporin expression
High
Low
EnvZ
OmpR
DNA-bindingdomain
Gene Expression and Signal Transduction 17
Two classes of hormonal signals define two classesof receptorsHormones fall into two classes based on their ability to
move across the plasma membrane: lipophilic hormones,
which diffuse readily across the hydrophobic bilayer of the
plasma membrane; and water-soluble hormones, which are
unable to enter the cell. Lipophilic hormones bind mainly
to receptors in the cytoplasm or nucleus; water-soluble hor-
mones bind to receptors located on the cell surface. In
either case, ligand binding alters the receptor, typically by
causing a conformational change.
Some receptors, such as the steroid hormone receptors
(see the next section), can regulate gene expression direct-
ly. In the vast majority of cases, however, the receptor ini-
tiates one or more sequences of biochemical reactions that
connect the stimulus to a cellular response. Such a
sequence of reactions is called a signal transduction path-
way. Typically, the end result of signal transduction path-
ways is to regulate transcription factors, which in turn reg-
ulate gene expression.
Signal transduction pathways often involve the genera-
tion of second messengers, transient secondary signals
inside the cell that greatly amplify the original signal. For
example, a single hormone molecule might lead to the acti-
vation of an enzyme that produces hundreds of molecules
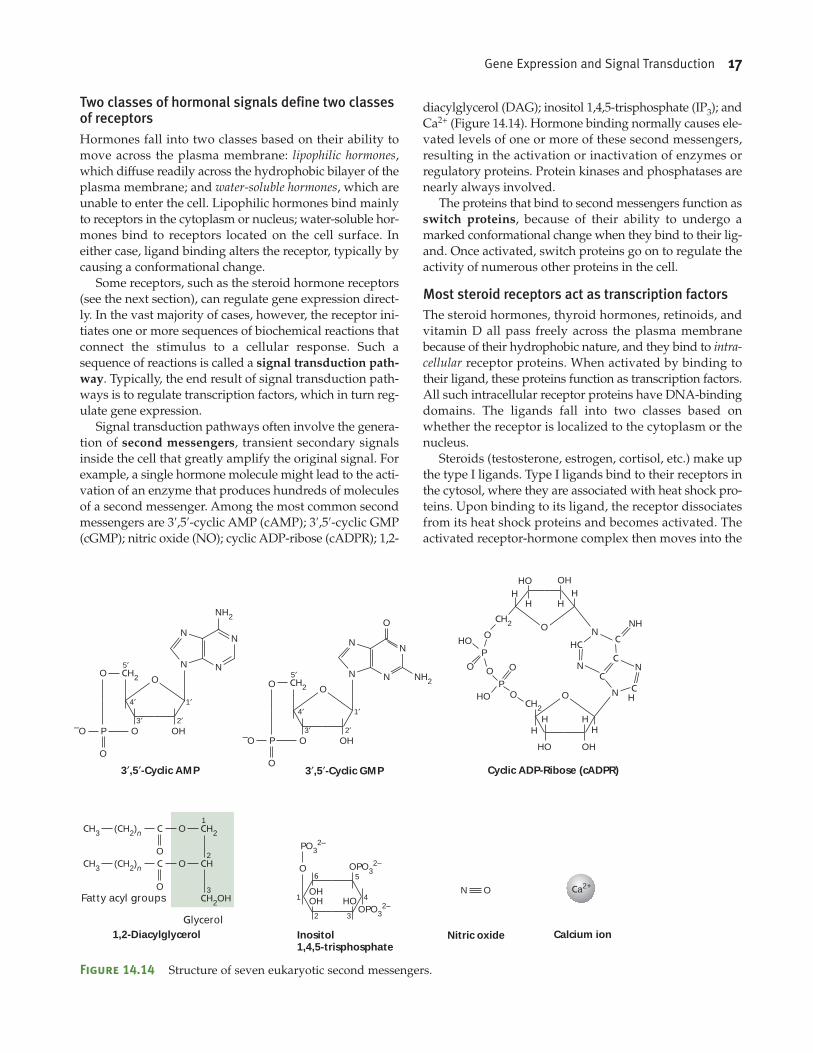
of a second messenger. Among the most common second
messengers are 3′,5′-cyclic AMP (cAMP); 3′,5′-cyclic GMP
(cGMP); nitric oxide (NO); cyclic ADP-ribose (cADPR); 1,2-
diacylglycerol (DAG); inositol 1,4,5-trisphosphate (IP3); and
Ca2+ (Figure 14.14). Hormone binding normally causes ele-
vated levels of one or more of these second messengers,
resulting in the activation or inactivation of enzymes or
regulatory proteins. Protein kinases and phosphatases are
nearly always involved.
The proteins that bind to second messengers function as
switch proteins, because of their ability to undergo a
marked conformational change when they bind to their lig-
and. Once activated, switch proteins go on to regulate the
activity of numerous other proteins in the cell.
Most steroid receptors act as transcription factors The steroid hormones, thyroid hormones, retinoids, and
vitamin D all pass freely across the plasma membrane
because of their hydrophobic nature, and they bind to intra-cellular receptor proteins. When activated by binding to
their ligand, these proteins function as transcription factors.
All such intracellular receptor proteins have DNA-binding
domains. The ligands fall into two classes based on
whether the receptor is localized to the cytoplasm or the
nucleus.
Steroids (testosterone, estrogen, cortisol, etc.) make up
the type I ligands. Type I ligands bind to their receptors in
the cytosol, where they are associated with heat shock pro-
teins. Upon binding to its ligand, the receptor dissociates
from its heat shock proteins and becomes activated. The
activated receptor-hormone complex then moves into the
NN
NN
O
OP–O OH
CH2
NH2
O
O
3′,5′-Cyclic AMP
2′
1′4′
3′
5′
NN
NN
O
O OH
CH2NH2
3′,5′-Cyclic GMP
2′
1′4′
3′
5′
O
CH3 C(CH2)n CH2O
CH3 C(CH2)n O
1
CH2
CH2OH3
Fatty acyl groups
Glycerol
O
O
1,2-Diacylglycerol Inositol1,4,5-trisphosphate
Calcium ion
PO32–
O
OHOH HO
3
41
2
56OPO3
2–
OPO32–
Ca2+
NO
HO OH
Cyclic ADP-Ribose (cADPR)
HHH
CH2
CN
CH
N
HCN
C
C
NH
H
O
OHH
HH
HOH
CH2
O
O
P
OP
HO
OO
HO
N O
Nitric oxide
P–O
O
O
Figure 14.14 Structure of seven eukaryotic second messengers.
18 Chapter 14
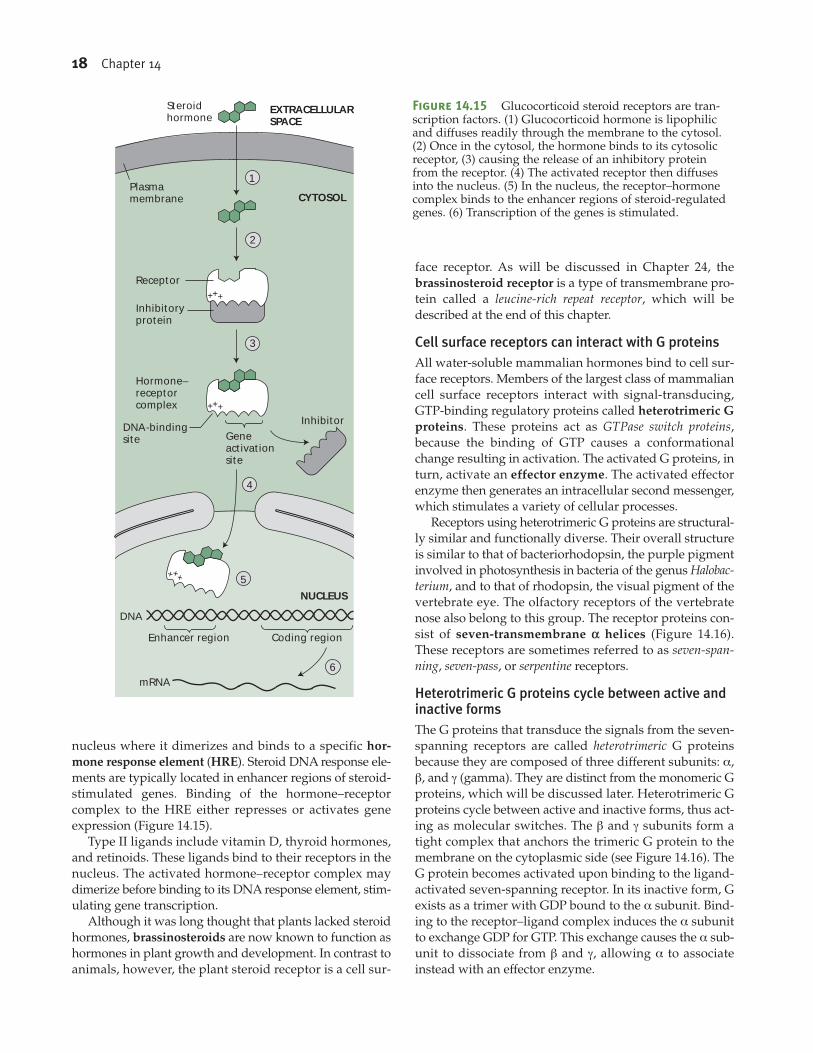
nucleus where it dimerizes and binds to a specific hor-
mone response element (HRE). Steroid DNA response ele-
ments are typically located in enhancer regions of steroid-
stimulated genes. Binding of the hormone–receptor
complex to the HRE either represses or activates gene
expression (Figure 14.15).
Type II ligands include vitamin D, thyroid hormones,
and retinoids. These ligands bind to their receptors in the
nucleus. The activated hormone–receptor complex may
dimerize before binding to its DNA response element, stim-
ulating gene transcription.
Although it was long thought that plants lacked steroid
hormones, brassinosteroids are now known to function as
hormones in plant growth and development. In contrast to
animals, however, the plant steroid receptor is a cell sur-
face receptor. As will be discussed in Chapter 24, the
brassinosteroid receptor is a type of transmembrane pro-
tein called a leucine-rich repeat receptor, which will be
described at the end of this chapter.
Cell surface receptors can interact with G proteinsAll water-soluble mammalian hormones bind to cell sur-
face receptors. Members of the largest class of mammalian
cell surface receptors interact with signal-transducing,
GTP-binding regulatory proteins called heterotrimeric G
proteins. These proteins act as GTPase switch proteins,
because the binding of GTP causes a conformational
change resulting in activation. The activated G proteins, in
turn, activate an effector enzyme. The activated effector
enzyme then generates an intracellular second messenger,
which stimulates a variety of cellular processes.
Receptors using heterotrimeric G proteins are structural-
ly similar and functionally diverse. Their overall structure
is similar to that of bacteriorhodopsin, the purple pigment
involved in photosynthesis in bacteria of the genus Halobac-terium, and to that of rhodopsin, the visual pigment of the
vertebrate eye. The olfactory receptors of the vertebrate
nose also belong to this group. The receptor proteins con-
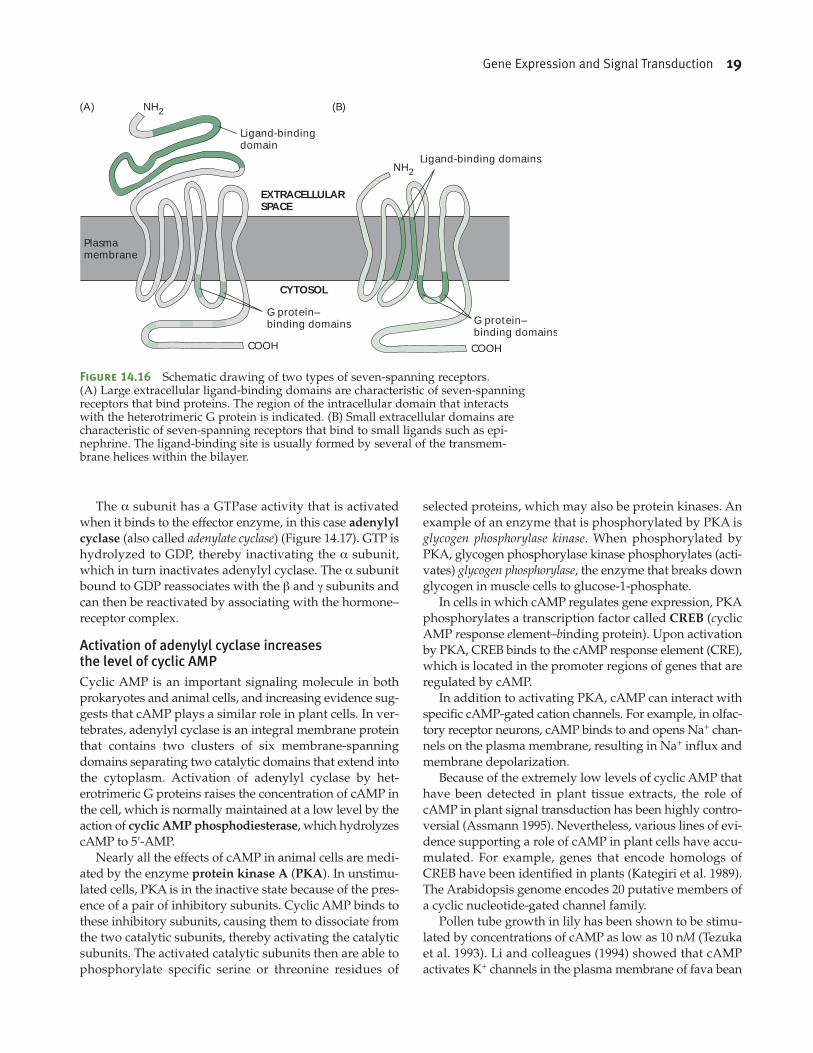
sist of seven-transmembrane a helices (Figure 14.16).
These receptors are sometimes referred to as seven-span-ning, seven-pass, or serpentine receptors.
Heterotrimeric G proteins cycle between active andinactive formsThe G proteins that transduce the signals from the seven-
spanning receptors are called heterotrimeric G proteins
because they are composed of three different subunits: α,
β, and γ (gamma). They are distinct from the monomeric G
proteins, which will be discussed later. Heterotrimeric G
proteins cycle between active and inactive forms, thus act-
ing as molecular switches. The β and γ subunits form a
tight complex that anchors the trimeric G protein to the
membrane on the cytoplasmic side (see Figure 14.16). The
G protein becomes activated upon binding to the ligand-
activated seven-spanning receptor. In its inactive form, G
exists as a trimer with GDP bound to the α subunit. Bind-
ing to the receptor–ligand complex induces the α subunit
to exchange GDP for GTP. This exchange causes the α sub-
unit to dissociate from β and γ, allowing α to associate
instead with an effector enzyme.
+++
EXTRACELLULARSPACE
CYTOSOL
NUCLEUS
Plasmamembrane
Steroidhormone
+++
Receptor
Inhibitoryprotein
Hormone–receptorcomplex
DNA-bindingsite Gene
activationsite
Inhibitor
Enhancer region
mRNA
+++
Coding region
DNA
4
5
6
3
2
1
Figure 14.15 Glucocorticoid steroid receptors are tran-scription factors. (1) Glucocorticoid hormone is lipophilicand diffuses readily through the membrane to the cytosol.(2) Once in the cytosol, the hormone binds to its cytosolicreceptor, (3) causing the release of an inhibitory proteinfrom the receptor. (4) The activated receptor then diffusesinto the nucleus. (5) In the nucleus, the receptor–hormonecomplex binds to the enhancer regions of steroid-regulatedgenes. (6) Transcription of the genes is stimulated.
Gene Expression and Signal Transduction 19
The α subunit has a GTPase activity that is activated
when it binds to the effector enzyme, in this case adenylyl
cyclase (also called adenylate cyclase) (Figure 14.17). GTP is
hydrolyzed to GDP, thereby inactivating the α subunit,
which in turn inactivates adenylyl cyclase. The α subunit
bound to GDP reassociates with the β and γ subunits and
can then be reactivated by associating with the hormone–
receptor complex.
Activation of adenylyl cyclase increases the level of cyclic AMPCyclic AMP is an important signaling molecule in both
prokaryotes and animal cells, and increasing evidence sug-
gests that cAMP plays a similar role in plant cells. In ver-
tebrates, adenylyl cyclase is an integral membrane protein
that contains two clusters of six membrane-spanning
domains separating two catalytic domains that extend into
the cytoplasm. Activation of adenylyl cyclase by het-
erotrimeric G proteins raises the concentration of cAMP in
the cell, which is normally maintained at a low level by the
action of cyclic AMP phosphodiesterase, which hydrolyzes
cAMP to 5′-AMP.
Nearly all the effects of cAMP in animal cells are medi-
ated by the enzyme protein kinase A (PKA). In unstimu-
lated cells, PKA is in the inactive state because of the pres-
ence of a pair of inhibitory subunits. Cyclic AMP binds to
these inhibitory subunits, causing them to dissociate from
the two catalytic subunits, thereby activating the catalytic
subunits. The activated catalytic subunits then are able to
phosphorylate specific serine or threonine residues of
selected proteins, which may also be protein kinases. An
example of an enzyme that is phosphorylated by PKA is
glycogen phosphorylase kinase. When phosphorylated by
PKA, glycogen phosphorylase kinase phosphorylates (acti-
vates) glycogen phosphorylase, the enzyme that breaks down
glycogen in muscle cells to glucose-1-phosphate.
In cells in which cAMP regulates gene expression, PKA
phosphorylates a transcription factor called CREB (cyclic
AMP response element–binding protein). Upon activation
by PKA, CREB binds to the cAMP response element (CRE),
which is located in the promoter regions of genes that are
regulated by cAMP.
In addition to activating PKA, cAMP can interact with
specific cAMP-gated cation channels. For example, in olfac-
tory receptor neurons, cAMP binds to and opens Na+ chan-
nels on the plasma membrane, resulting in Na+ influx and
membrane depolarization.
Because of the extremely low levels of cyclic AMP that
have been detected in plant tissue extracts, the role of
cAMP in plant signal transduction has been highly contro-
versial (Assmann 1995). Nevertheless, various lines of evi-
dence supporting a role of cAMP in plant cells have accu-
mulated. For example, genes that encode homologs of
CREB have been identified in plants (Kategiri et al. 1989).
The Arabidopsis genome encodes 20 putative members of
a cyclic nucleotide-gated channel family.
Pollen tube growth in lily has been shown to be stimu-
lated by concentrations of cAMP as low as 10 nM (Tezuka
et al. 1993). Li and colleagues (1994) showed that cAMP
activates K+ channels in the plasma membrane of fava bean
NH2
NH2
COOH COOH
CYTOSOL
EXTRACELLULARSPACE
Ligand-bindingdomain
(A) (B)
G protein–binding domains G protein–
binding domains
Plasmamembrane
Ligand-binding domains
Figure 14.16 Schematic drawing of two types of seven-spanning receptors. (A) Large extracellular ligand-binding domains are characteristic of seven-spanningreceptors that bind proteins. The region of the intracellular domain that interactswith the heterotrimeric G protein is indicated. (B) Small extracellular domains arecharacteristic of seven-spanning receptors that bind to small ligands such as epi-nephrine. The ligand-binding site is usually formed by several of the transmem-brane helices within the bilayer.
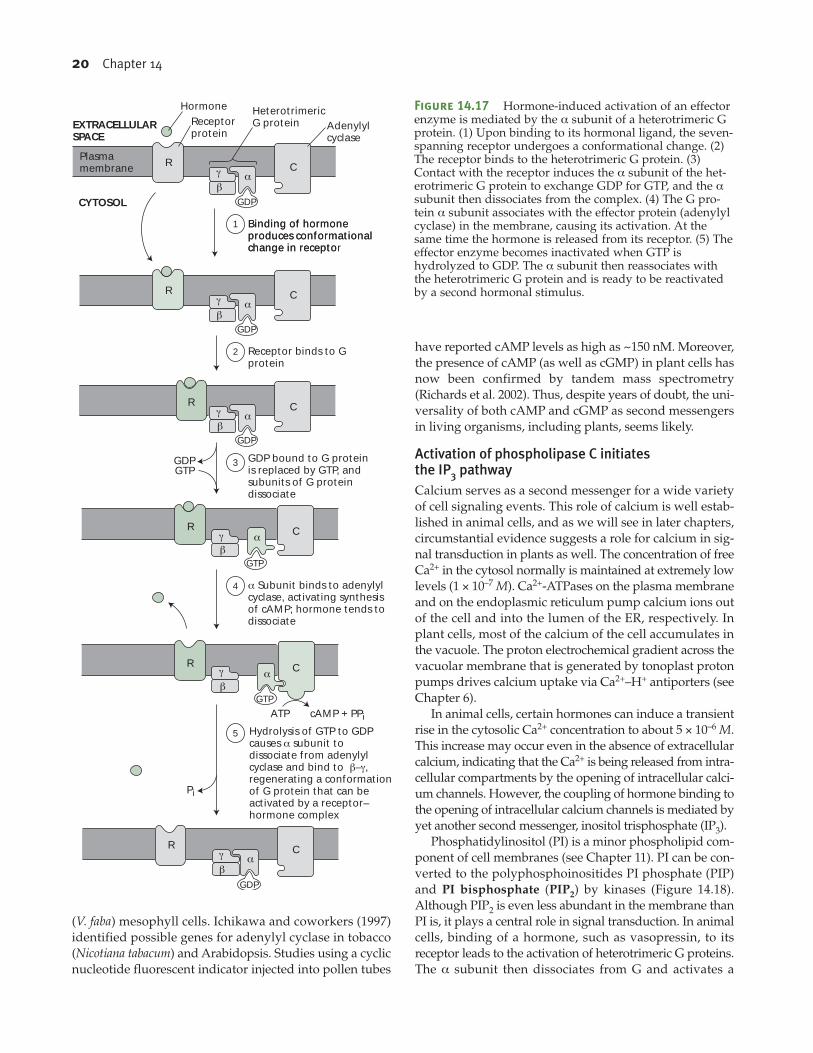
20 Chapter 14
(V. faba) mesophyll cells. Ichikawa and coworkers (1997)
identified possible genes for adenylyl cyclase in tobacco
(Nicotiana tabacum) and Arabidopsis. Studies using a cyclic
nucleotide fluorescent indicator injected into pollen tubes
have reported cAMP levels as high as ~150 nM. Moreover,
the presence of cAMP (as well as cGMP) in plant cells has
now been confirmed by tandem mass spectrometry
(Richards et al. 2002). Thus, despite years of doubt, the uni-
versality of both cAMP and cGMP as second messengers
in living organisms, including plants, seems likely.
Activation of phospholipase C initiates the IP3 pathway Calcium serves as a second messenger for a wide variety
of cell signaling events. This role of calcium is well estab-
lished in animal cells, and as we will see in later chapters,
circumstantial evidence suggests a role for calcium in sig-
nal transduction in plants as well. The concentration of free
Ca2+ in the cytosol normally is maintained at extremely low
levels (1 × 10⁻⁷ M). Ca2+-ATPases on the plasma membrane
and on the endoplasmic reticulum pump calcium ions out
of the cell and into the lumen of the ER, respectively. In
plant cells, most of the calcium of the cell accumulates in
the vacuole. The proton electrochemical gradient across the
vacuolar membrane that is generated by tonoplast proton
pumps drives calcium uptake via Ca2+–H+ antiporters (see
Chapter 6).
In animal cells, certain hormones can induce a transient
rise in the cytosolic Ca2+ concentration to about 5 × 10⁻⁶ M.
This increase may occur even in the absence of extracellular
calcium, indicating that the Ca2+ is being released from intra-
cellular compartments by the opening of intracellular calci-
um channels. However, the coupling of hormone binding to
the opening of intracellular calcium channels is mediated by
yet another second messenger, inositol trisphosphate (IP3).
Phosphatidylinositol (PI) is a minor phospholipid com-
ponent of cell membranes (see Chapter 11). PI can be con-
verted to the polyphosphoinositides PI phosphate (PIP)
and PI bisphosphate (PIP2) by kinases (Figure 14.18).
Although PIP2 is even less abundant in the membrane than
PI is, it plays a central role in signal transduction. In animal
cells, binding of a hormone, such as vasopressin, to its
receptor leads to the activation of heterotrimeric G proteins.
The α subunit then dissociates from G and activates a
GDP
Receptorprotein
Hormone HeterotrimericG protein Adenylyl
cyclase
R Cγ
βα
R Cγ
βα
R Cγβ
α
R Cγβ
α
R Cγ
βα
R Cγ
βα
Binding of hormoneproduces conformationalchange in receptor
Binding of hormoneproduces conformationalchange in recepto
1
GDP
Receptor binds to Gprotein
GDP
GDPGTP
GDP bound to G proteinis replaced by GTP, andsubunits of G proteindissociate
3
GTP
α Subunit binds to adenylylcyclase, activating synthesisof cAMP; hormone tends todissociate
GTP
GDP
ATP cAMP + PPi
EXTRACELLULARSPACE
CYTOSOL
Plasmamembrane
Pi
Hydrolysis of GTP to GDP causes α subunit to dissociate from adenylyl cyclase and bind to β–γ, regenerating a conformation of G protein that can be activated by a receptor–hormone complex
2
4
5
Figure 14.17 Hormone-induced activation of an effectorenzyme is mediated by the α subunit of a heterotrimeric Gprotein. (1) Upon binding to its hormonal ligand, the seven-spanning receptor undergoes a conformational change. (2)The receptor binds to the heterotrimeric G protein. (3)Contact with the receptor induces the α subunit of the het-erotrimeric G protein to exchange GDP for GTP, and the αsubunit then dissociates from the complex. (4) The G pro-tein α subunit associates with the effector protein (adenylylcyclase) in the membrane, causing its activation. At thesame time the hormone is released from its receptor. (5) Theeffector enzyme becomes inactivated when GTP ishydrolyzed to GDP. The α subunit then reassociates withthe heterotrimeric G protein and is ready to be reactivatedby a second hormonal stimulus.
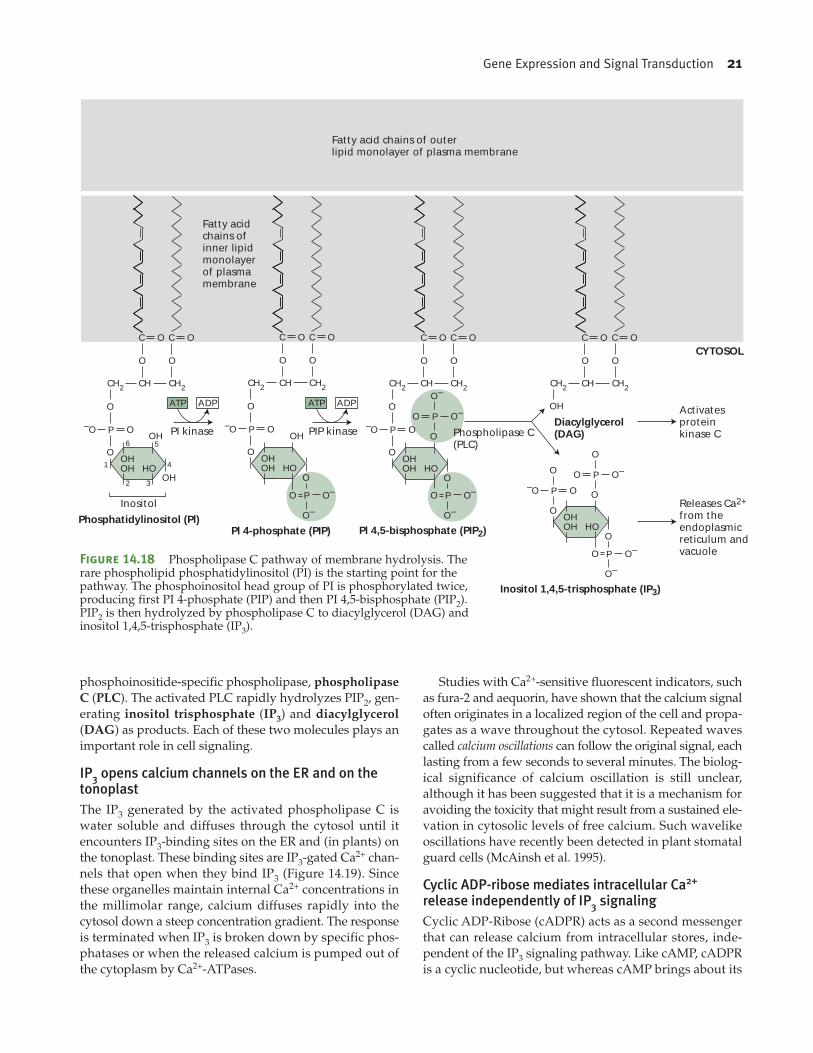
Gene Expression and Signal Transduction 21
phosphoinositide-specific phospholipase, phospholipase
C (PLC). The activated PLC rapidly hydrolyzes PIP2, gen-
erating inositol trisphosphate (IP3) and diacylglycerol
(DAG) as products. Each of these two molecules plays an
important role in cell signaling.
IP3 opens calcium channels on the ER and on thetonoplastThe IP3 generated by the activated phospholipase C is
water soluble and diffuses through the cytosol until it
encounters IP3-binding sites on the ER and (in plants) on
the tonoplast. These binding sites are IP3-gated Ca2+ chan-
nels that open when they bind IP3 (Figure 14.19). Since
these organelles maintain internal Ca2+ concentrations in
the millimolar range, calcium diffuses rapidly into the
cytosol down a steep concentration gradient. The response
is terminated when IP3 is broken down by specific phos-
phatases or when the released calcium is pumped out of
the cytoplasm by Ca2+-ATPases.
Studies with Ca2+-sensitive fluorescent indicators, such
as fura-2 and aequorin, have shown that the calcium signal
often originates in a localized region of the cell and propa-
gates as a wave throughout the cytosol. Repeated waves
called calcium oscillations can follow the original signal, each
lasting from a few seconds to several minutes. The biolog-
ical significance of calcium oscillation is still unclear,
although it has been suggested that it is a mechanism for
avoiding the toxicity that might result from a sustained ele-
vation in cytosolic levels of free calcium. Such wavelike
oscillations have recently been detected in plant stomatal
guard cells (McAinsh et al. 1995).
Cyclic ADP-ribose mediates intracellular Ca2+
release independently of IP3 signalingCyclic ADP-Ribose (cADPR) acts as a second messenger
that can release calcium from intracellular stores, inde-
pendent of the IP3 signaling pathway. Like cAMP, cADPR
is a cyclic nucleotide, but whereas cAMP brings about its
Phosphatidylinositol (Pl)Pl 4-phosphate (PIP) Pl 4,5-bisphosphate (PIP2)
P
O–
O
O–O
CH2 CH2CH
P
O
O
O–O
OHOH HO
O O
C CO O
P
O–
O–O
P
O–
O–O
CH2 CH2CH
OH
O O
C CO O
CH2 CH2CH
P
O
O
O–O
OHOH HO
O O
C CO O
3
41
2
56
OH
OH OH
Inositol
O
CH2 CH2CH
P
O
O
O–O
OHOH HO
O O
C CO O
P
O
O–
O–OActivatesproteinkinase C
Releases Ca2+
from theendoplasmicreticulum andvacuole
ADP
PI kinase
ATP ADP
PIP kinase
ATP
Phospholipase C(PLC)
Diacylglycerol(DAG)
Inositol 1,4,5-trisphosphate (IP3)
O
P
O
O
O–O
OHOH HO
P
O
O
O–O
CYTOSOL
Fatty acid chains of outerlipid monolayer of plasma membrane
Fatty acidchains ofinner lipidmonolayerof plasmamembrane
Figure 14.18 Phospholipase C pathway of membrane hydrolysis. Therare phospholipid phosphatidylinositol (PI) is the starting point for thepathway. The phosphoinositol head group of PI is phosphorylated twice,producing first PI 4-phosphate (PIP) and then PI 4,5-bisphosphate (PIP2).PIP2 is then hydrolyzed by phospholipase C to diacylglycerol (DAG) andinositol 1,4,5-trisphosphate (IP3).
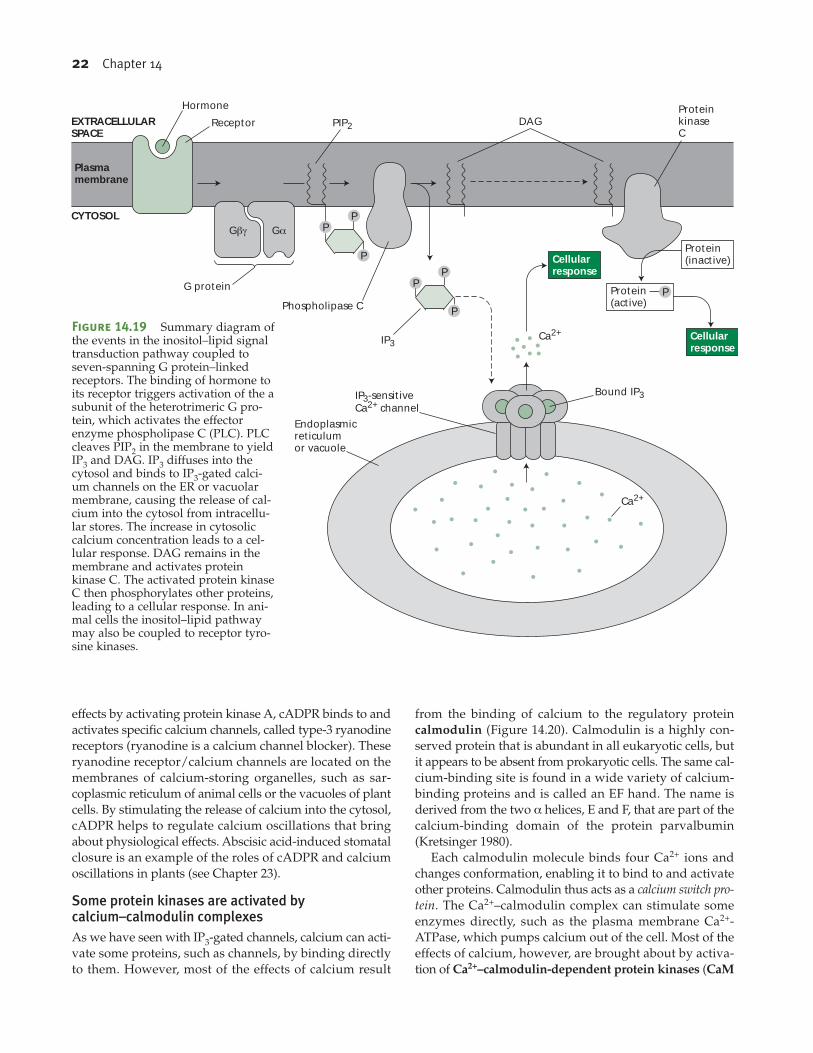
22 Chapter 14
effects by activating protein kinase A, cADPR binds to and
activates specific calcium channels, called type-3 ryanodine
receptors (ryanodine is a calcium channel blocker). These
ryanodine receptor/calcium channels are located on the
membranes of calcium-storing organelles, such as sar-
coplasmic reticulum of animal cells or the vacuoles of plant
cells. By stimulating the release of calcium into the cytosol,
cADPR helps to regulate calcium oscillations that bring
about physiological effects. Abscisic acid-induced stomatal
closure is an example of the roles of cADPR and calcium
oscillations in plants (see Chapter 23).
Some protein kinases are activated bycalcium–calmodulin complexes As we have seen with IP3-gated channels, calcium can acti-
vate some proteins, such as channels, by binding directly
to them. However, most of the effects of calcium result
from the binding of calcium to the regulatory protein
calmodulin (Figure 14.20). Calmodulin is a highly con-
served protein that is abundant in all eukaryotic cells, but
it appears to be absent from prokaryotic cells. The same cal-
cium-binding site is found in a wide variety of calcium-
binding proteins and is called an EF hand. The name is
derived from the two α helices, E and F, that are part of the
calcium-binding domain of the protein parvalbumin
(Kretsinger 1980).
Each calmodulin molecule binds four Ca2+ ions and
changes conformation, enabling it to bind to and activate
other proteins. Calmodulin thus acts as a calcium switch pro-tein. The Ca2+–calmodulin complex can stimulate some
enzymes directly, such as the plasma membrane Ca2+-
ATPase, which pumps calcium out of the cell. Most of the
effects of calcium, however, are brought about by activa-
tion of Ca2+–calmodulin-dependent protein kinases (CaM
Cellularresponse
EXTRACELLULARSPACE
CYTOSOL
Hormone
Receptor
G protein
Phospholipase C
Gβγ GαP
P
P
PP
Protein(inactive)Cellular
response
ProteinkinaseC
DAGPIP2
IP3
Protein(active)
Ca2+
IP3-sensitiveCa2+ channel
Endoplasmicreticulumor vacuole
P
P
Plasmamembrane
Ca2+
Bound IP3
Figure 14.19 Summary diagram ofthe events in the inositol–lipid signaltransduction pathway coupled toseven-spanning G protein–linkedreceptors. The binding of hormone toits receptor triggers activation of the asubunit of the heterotrimeric G pro-tein, which activates the effectorenzyme phospholipase C (PLC). PLCcleaves PIP2 in the membrane to yieldIP3 and DAG. IP3 diffuses into thecytosol and binds to IP3-gated calci-um channels on the ER or vacuolarmembrane, causing the release of cal-cium into the cytosol from intracellu-lar stores. The increase in cytosoliccalcium concentration leads to a cel-lular response. DAG remains in themembrane and activates proteinkinase C. The activated protein kinaseC then phosphorylates other proteins,leading to a cellular response. In ani-mal cells the inositol–lipid pathwaymay also be coupled to receptor tyro-sine kinases.
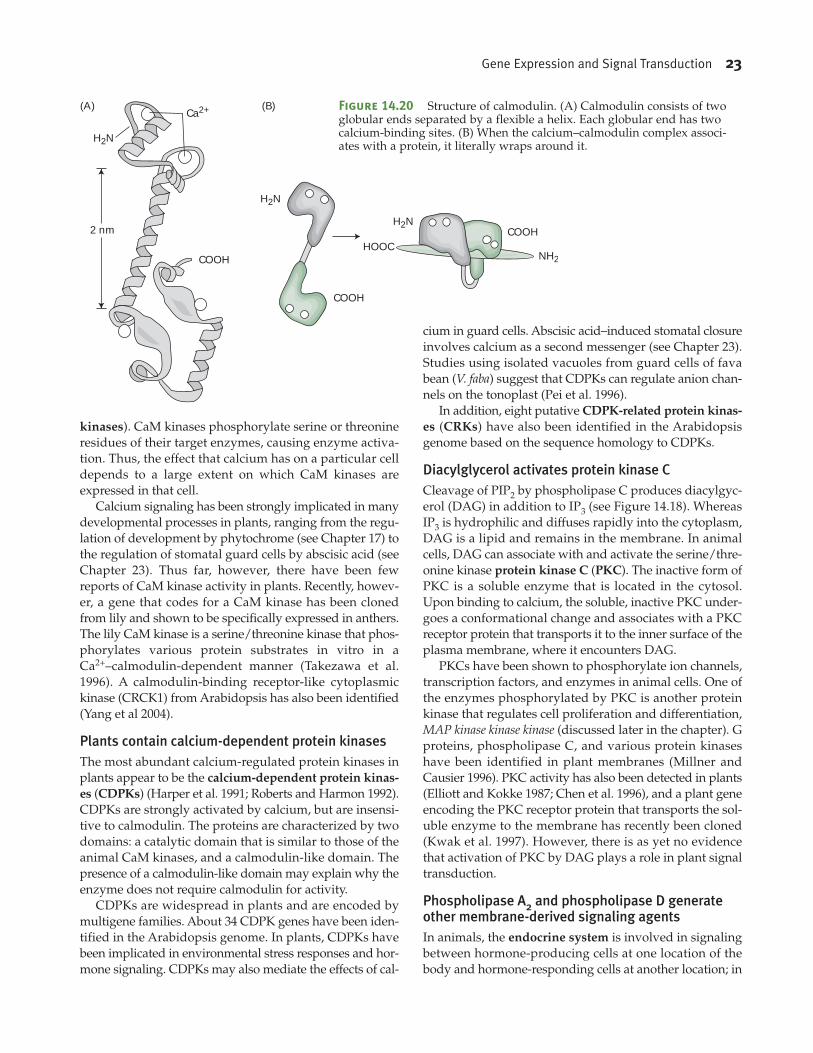
Gene Expression and Signal Transduction 23
kinases). CaM kinases phosphorylate serine or threonine
residues of their target enzymes, causing enzyme activa-
tion. Thus, the effect that calcium has on a particular cell
depends to a large extent on which CaM kinases are
expressed in that cell.
Calcium signaling has been strongly implicated in many
developmental processes in plants, ranging from the regu-
lation of development by phytochrome (see Chapter 17) to
the regulation of stomatal guard cells by abscisic acid (see
Chapter 23). Thus far, however, there have been few
reports of CaM kinase activity in plants. Recently, howev-
er, a gene that codes for a CaM kinase has been cloned
from lily and shown to be specifically expressed in anthers.
The lily CaM kinase is a serine/threonine kinase that phos-
phorylates various protein substrates in vitro in a
Ca2+–calmodulin-dependent manner (Takezawa et al.
1996). A calmodulin-binding receptor-like cytoplasmic
kinase (CRCK1) from Arabidopsis has also been identified
(Yang et al 2004).
Plants contain calcium-dependent protein kinasesThe most abundant calcium-regulated protein kinases in
plants appear to be the calcium-dependent protein kinas-
es (CDPKs) (Harper et al. 1991; Roberts and Harmon 1992).
CDPKs are strongly activated by calcium, but are insensi-
tive to calmodulin. The proteins are characterized by two
domains: a catalytic domain that is similar to those of the
animal CaM kinases, and a calmodulin-like domain. The
presence of a calmodulin-like domain may explain why the
enzyme does not require calmodulin for activity.
CDPKs are widespread in plants and are encoded by
multigene families. About 34 CDPK genes have been iden-
tified in the Arabidopsis genome. In plants, CDPKs have
been implicated in environmental stress responses and hor-
mone signaling. CDPKs may also mediate the effects of cal-
cium in guard cells. Abscisic acid–induced stomatal closure
involves calcium as a second messenger (see Chapter 23).
Studies using isolated vacuoles from guard cells of fava
bean (V. faba) suggest that CDPKs can regulate anion chan-
nels on the tonoplast (Pei et al. 1996).
In addition, eight putative CDPK-related protein kinas-
es (CRKs) have also been identified in the Arabidopsis
genome based on the sequence homology to CDPKs.
Diacylglycerol activates protein kinase C Cleavage of PIP2 by phospholipase C produces diacylgyc-
erol (DAG) in addition to IP3 (see Figure 14.18). Whereas
IP3 is hydrophilic and diffuses rapidly into the cytoplasm,
DAG is a lipid and remains in the membrane. In animal
cells, DAG can associate with and activate the serine/thre-
onine kinase protein kinase C (PKC). The inactive form of
PKC is a soluble enzyme that is located in the cytosol.
Upon binding to calcium, the soluble, inactive PKC under-
goes a conformational change and associates with a PKC
receptor protein that transports it to the inner surface of the
plasma membrane, where it encounters DAG.
PKCs have been shown to phosphorylate ion channels,
transcription factors, and enzymes in animal cells. One of
the enzymes phosphorylated by PKC is another protein
kinase that regulates cell proliferation and differentiation,
MAP kinase kinase kinase (discussed later in the chapter). Gproteins, phospholipase C, and various protein kinases
have been identified in plant membranes (Millner and
Causier 1996). PKC activity has also been detected in plants
(Elliott and Kokke 1987; Chen et al. 1996), and a plant gene
encoding the PKC receptor protein that transports the sol-
uble enzyme to the membrane has recently been cloned
(Kwak et al. 1997). However, there is as yet no evidence
that activation of PKC by DAG plays a role in plant signal
transduction.
Phospholipase A2 and phospholipase D generateother membrane-derived signaling agentsIn animals, the endocrine system is involved in signaling
between hormone-producing cells at one location of the
body and hormone-responding cells at another location; in
COOH
COOH
COOH
2 nm
HOOCNH2
H2N
Ca2+
H2N
H2N
(A) (B) Figure 14.20 Structure of calmodulin. (A) Calmodulin consists of twoglobular ends separated by a flexible a helix. Each globular end has twocalcium-binding sites. (B) When the calcium–calmodulin complex associ-ates with a protein, it literally wraps around it.
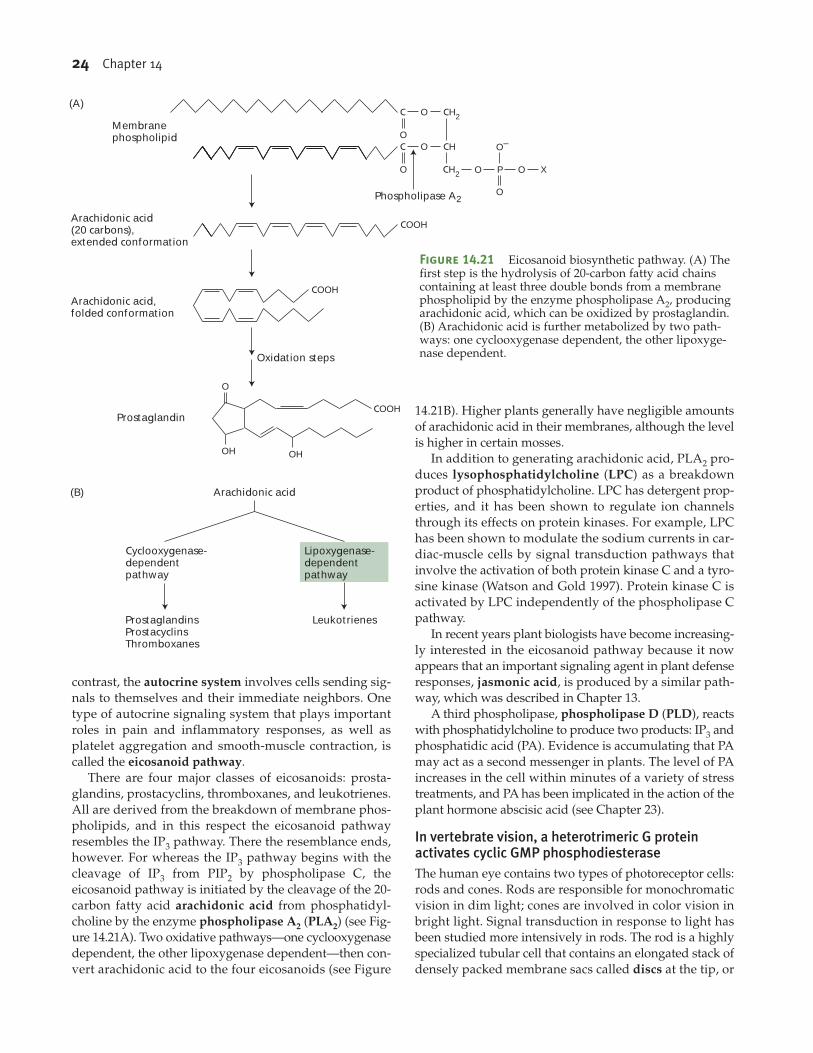
24 Chapter 14
contrast, the autocrine system involves cells sending sig-
nals to themselves and their immediate neighbors. One
type of autocrine signaling system that plays important
roles in pain and inflammatory responses, as well as
platelet aggregation and smooth-muscle contraction, is
called the eicosanoid pathway.
There are four major classes of eicosanoids: prosta-
glandins, prostacyclins, thromboxanes, and leukotrienes.
All are derived from the breakdown of membrane phos-
pholipids, and in this respect the eicosanoid pathway
resembles the IP3 pathway. There the resemblance ends,
however. For whereas the IP3 pathway begins with the
cleavage of IP3 from PIP2 by phospholipase C, the
eicosanoid pathway is initiated by the cleavage of the 20-
carbon fatty acid arachidonic acid from phosphatidyl-
choline by the enzyme phospholipase A2 (PLA2) (see Fig-
ure 14.21A). Two oxidative pathways—one cyclooxygenase
dependent, the other lipoxygenase dependent—then con-
vert arachidonic acid to the four eicosanoids (see Figure
14.21B). Higher plants generally have negligible amounts
of arachidonic acid in their membranes, although the level
is higher in certain mosses.
In addition to generating arachidonic acid, PLA2 pro-
duces lysophosphatidylcholine (LPC) as a breakdown
product of phosphatidylcholine. LPC has detergent prop-
erties, and it has been shown to regulate ion channels
through its effects on protein kinases. For example, LPC
has been shown to modulate the sodium currents in car-
diac-muscle cells by signal transduction pathways that
involve the activation of both protein kinase C and a tyro-
sine kinase (Watson and Gold 1997). Protein kinase C is
activated by LPC independently of the phospholipase C
pathway.
In recent years plant biologists have become increasing-
ly interested in the eicosanoid pathway because it now
appears that an important signaling agent in plant defense
responses, jasmonic acid, is produced by a similar path-
way, which was described in Chapter 13.
A third phospholipase, phospholipase D (PLD), reacts
with phosphatidylcholine to produce two products: IP3 and
phosphatidic acid (PA). Evidence is accumulating that PA
may act as a second messenger in plants. The level of PA
increases in the cell within minutes of a variety of stress
treatments, and PA has been implicated in the action of the
plant hormone abscisic acid (see Chapter 23).
In vertebrate vision, a heterotrimeric G proteinactivates cyclic GMP phosphodiesterase The human eye contains two types of photoreceptor cells:
rods and cones. Rods are responsible for monochromatic
vision in dim light; cones are involved in color vision in
bright light. Signal transduction in response to light has
been studied more intensively in rods. The rod is a highly
specialized tubular cell that contains an elongated stack of
densely packed membrane sacs called discs at the tip, or
OH
COOH
COOH
O
COOH
C CH
OH
Oxidation steps
O
O PO XO
O
O–
C CH2O
O
CH2
Phospholipase A2
Membranephospholipid
Arachidonic acid(20 carbons),extended conformation
Arachidonic acid,folded conformation
Prostaglandin
(A)
(B) Arachidonic acid
Cyclooxygenase-dependentpathway
Lipoxygenase-dependentpathway
ProstaglandinsProstacyclinsThromboxanes
Leukotrienes
Figure 14.21 Eicosanoid biosynthetic pathway. (A) Thefirst step is the hydrolysis of 20-carbon fatty acid chainscontaining at least three double bonds from a membranephospholipid by the enzyme phospholipase A2, producingarachidonic acid, which can be oxidized by prostaglandin.(B) Arachidonic acid is further metabolized by two path-ways: one cyclooxygenase dependent, the other lipoxyge-nase dependent.
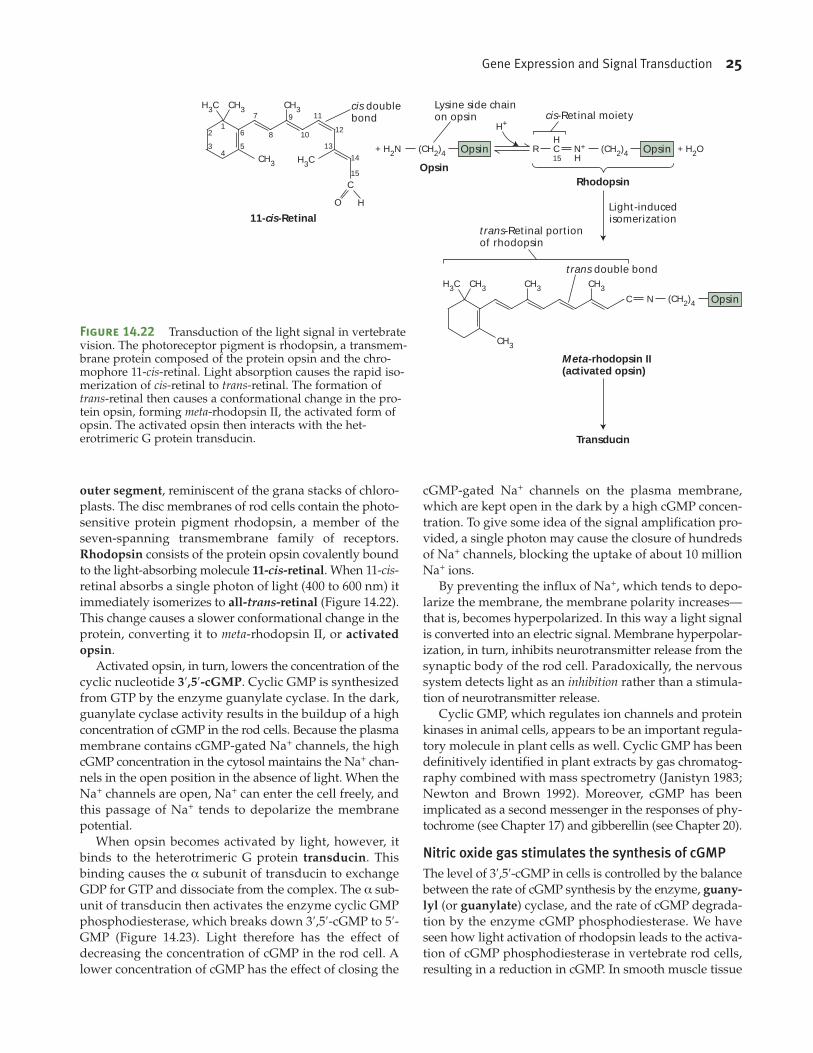
Gene Expression and Signal Transduction 25
outer segment, reminiscent of the grana stacks of chloro-
plasts. The disc membranes of rod cells contain the photo-
sensitive protein pigment rhodopsin, a member of the
seven-spanning transmembrane family of receptors.
Rhodopsin consists of the protein opsin covalently bound
to the light-absorbing molecule 11-cis-retinal. When 11-cis-
retinal absorbs a single photon of light (400 to 600 nm) it
immediately isomerizes to all-trans-retinal (Figure 14.22).
This change causes a slower conformational change in the
protein, converting it to meta-rhodopsin II, or activated
opsin.
Activated opsin, in turn, lowers the concentration of the
cyclic nucleotide 3′,5′-cGMP. Cyclic GMP is synthesized
from GTP by the enzyme guanylate cyclase. In the dark,
guanylate cyclase activity results in the buildup of a high
concentration of cGMP in the rod cells. Because the plasma
membrane contains cGMP-gated Na+ channels, the high
cGMP concentration in the cytosol maintains the Na+ chan-
nels in the open position in the absence of light. When the
Na+ channels are open, Na+ can enter the cell freely, and
this passage of Na+ tends to depolarize the membrane
potential.
When opsin becomes activated by light, however, it
binds to the heterotrimeric G protein transducin. This
binding causes the α subunit of transducin to exchange
GDP for GTP and dissociate from the complex. The α sub-
unit of transducin then activates the enzyme cyclic GMP
phosphodiesterase, which breaks down 3′,5′-cGMP to 5′-GMP (Figure 14.23). Light therefore has the effect of
decreasing the concentration of cGMP in the rod cell. A
lower concentration of cGMP has the effect of closing the
cGMP-gated Na+ channels on the plasma membrane,
which are kept open in the dark by a high cGMP concen-
tration. To give some idea of the signal amplification pro-
vided, a single photon may cause the closure of hundreds
of Na+ channels, blocking the uptake of about 10 million
Na+ ions.
By preventing the influx of Na+, which tends to depo-
larize the membrane, the membrane polarity increases—
that is, becomes hyperpolarized. In this way a light signal
is converted into an electric signal. Membrane hyperpolar-
ization, in turn, inhibits neurotransmitter release from the
synaptic body of the rod cell. Paradoxically, the nervous
system detects light as an inhibition rather than a stimula-
tion of neurotransmitter release.
Cyclic GMP, which regulates ion channels and protein
kinases in animal cells, appears to be an important regula-
tory molecule in plant cells as well. Cyclic GMP has been
definitively identified in plant extracts by gas chromatog-
raphy combined with mass spectrometry (Janistyn 1983;
Newton and Brown 1992). Moreover, cGMP has been
implicated as a second messenger in the responses of phy-
tochrome (see Chapter 17) and gibberellin (see Chapter 20).
Nitric oxide gas stimulates the synthesis of cGMPThe level of 3′,5′-cGMP in cells is controlled by the balance
between the rate of cGMP synthesis by the enzyme, guany-
lyl (or guanylate) cyclase, and the rate of cGMP degrada-
tion by the enzyme cGMP phosphodiesterase. We have
seen how light activation of rhodopsin leads to the activa-
tion of cGMP phosphodiesterase in vertebrate rod cells,
resulting in a reduction in cGMP. In smooth muscle tissue
CH3
CH3
CH3
C
O H
H3C
H3C(CH2)4+ H2N + H2OCR
H
HN+ (CH2)4
CH3 CH3
CH3
H3C CH3
1
4
2
3
6 8 10
11
12
13
14
15
7 9
5
cis doublebond
Lysine side chainon opsin cis-Retinal moiety
trans-Retinal portionof rhodopsin
trans double bond
11-cis-Retinal
OpsinRhodopsin
Opsin Opsin
C N Opsin
15
Meta-rhodopsin II(activated opsin)
Transducin
(CH2)4
Light-inducedisomerization
H+
Figure 14.22 Transduction of the light signal in vertebratevision. The photoreceptor pigment is rhodopsin, a transmem-brane protein composed of the protein opsin and the chro-mophore 11-cis-retinal. Light absorption causes the rapid iso-merization of cis-retinal to trans-retinal. The formation oftrans-retinal then causes a conformational change in the pro-tein opsin, forming meta-rhodopsin II, the activated form ofopsin. The activated opsin then interacts with the het-erotrimeric G protein transducin.
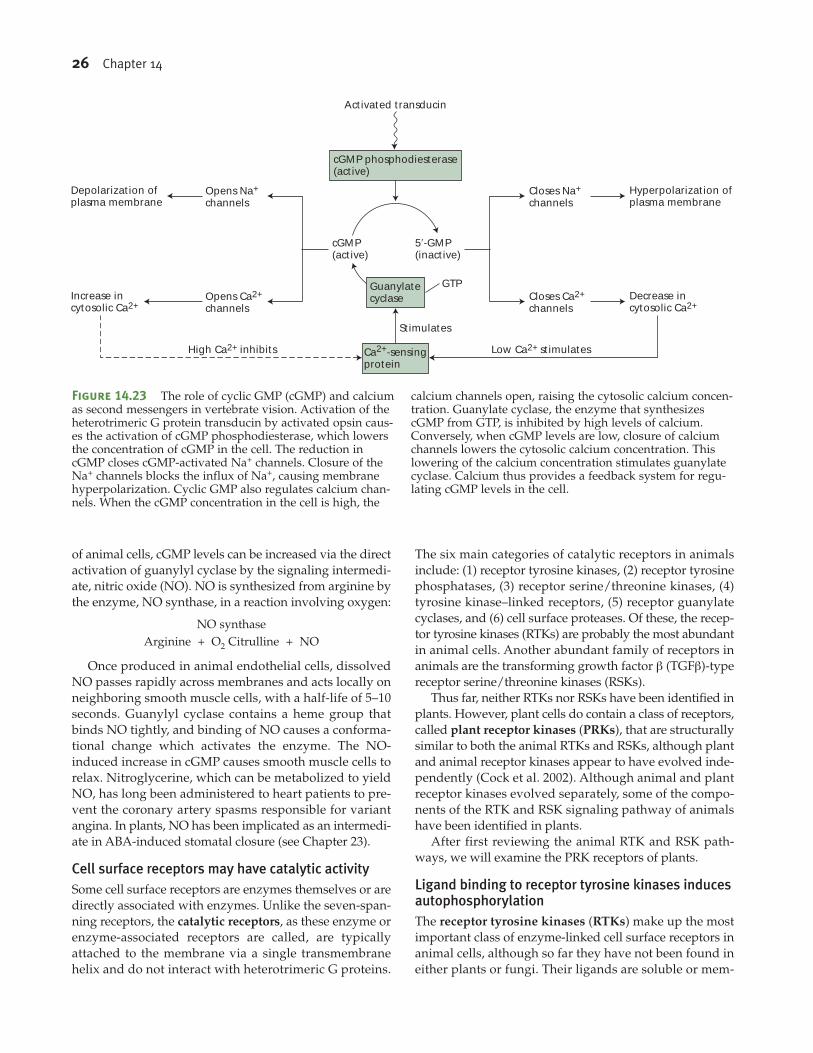
26 Chapter 14
of animal cells, cGMP levels can be increased via the direct
activation of guanylyl cyclase by the signaling intermedi-
ate, nitric oxide (NO). NO is synthesized from arginine by
the enzyme, NO synthase, in a reaction involving oxygen:
NO synthase
Arginine + O2 Citrulline + NO
Once produced in animal endothelial cells, dissolved
NO passes rapidly across membranes and acts locally on
neighboring smooth muscle cells, with a half-life of 5–10
seconds. Guanylyl cyclase contains a heme group that
binds NO tightly, and binding of NO causes a conforma-
tional change which activates the enzyme. The NO-
induced increase in cGMP causes smooth muscle cells to
relax. Nitroglycerine, which can be metabolized to yield
NO, has long been administered to heart patients to pre-
vent the coronary artery spasms responsible for variant
angina. In plants, NO has been implicated as an intermedi-
ate in ABA-induced stomatal closure (see Chapter 23).
Cell surface receptors may have catalytic activitySome cell surface receptors are enzymes themselves or are
directly associated with enzymes. Unlike the seven-span-
ning receptors, the catalytic receptors, as these enzyme or
enzyme-associated receptors are called, are typically
attached to the membrane via a single transmembrane
helix and do not interact with heterotrimeric G proteins.
The six main categories of catalytic receptors in animals
include: (1) receptor tyrosine kinases, (2) receptor tyrosine
phosphatases, (3) receptor serine/threonine kinases, (4)
tyrosine kinase–linked receptors, (5) receptor guanylate
cyclases, and (6) cell surface proteases. Of these, the recep-
tor tyrosine kinases (RTKs) are probably the most abundant
in animal cells. Another abundant family of receptors in
animals are the transforming growth factor β (TGFβ)-type
receptor serine/threonine kinases (RSKs).
Thus far, neither RTKs nor RSKs have been identified in
plants. However, plant cells do contain a class of receptors,
called plant receptor kinases (PRKs), that are structurally
similar to both the animal RTKs and RSKs, although plant
and animal receptor kinases appear to have evolved inde-
pendently (Cock et al. 2002). Although animal and plant
receptor kinases evolved separately, some of the compo-
nents of the RTK and RSK signaling pathway of animals
have been identified in plants.
After first reviewing the animal RTK and RSK path-
ways, we will examine the PRK receptors of plants.
Ligand binding to receptor tyrosine kinases inducesautophosphorylationThe receptor tyrosine kinases (RTKs) make up the most
important class of enzyme-linked cell surface receptors in
animal cells, although so far they have not been found in
either plants or fungi. Their ligands are soluble or mem-
Depolarization ofplasma membrane
Opens Na+
channels
Increase incytosolic Ca2+
Hyperpolarization ofplasma membrane
Decrease incytosolic Ca2+
Opens Ca2+
channels
Closes Na+
channels
Closes Ca2+
channels
cGMP(active)
GTP
Stimulates
5′-GMP(inactive)
Guanylatecyclase
cGMP phosphodiesterase(active)
Activated transducin
High Ca2+ inhibits Low Ca2+ stimulatesCa2+-sensingprotein
Figure 14.23 The role of cyclic GMP (cGMP) and calciumas second messengers in vertebrate vision. Activation of theheterotrimeric G protein transducin by activated opsin caus-es the activation of cGMP phosphodiesterase, which lowersthe concentration of cGMP in the cell. The reduction incGMP closes cGMP-activated Na+ channels. Closure of theNa+ channels blocks the influx of Na+, causing membranehyperpolarization. Cyclic GMP also regulates calcium chan-nels. When the cGMP concentration in the cell is high, the
calcium channels open, raising the cytosolic calcium concen-tration. Guanylate cyclase, the enzyme that synthesizescGMP from GTP, is inhibited by high levels of calcium.Conversely, when cGMP levels are low, closure of calciumchannels lowers the cytosolic calcium concentration. Thislowering of the calcium concentration stimulates guanylatecyclase. Calcium thus provides a feedback system for regu-lating cGMP levels in the cell.
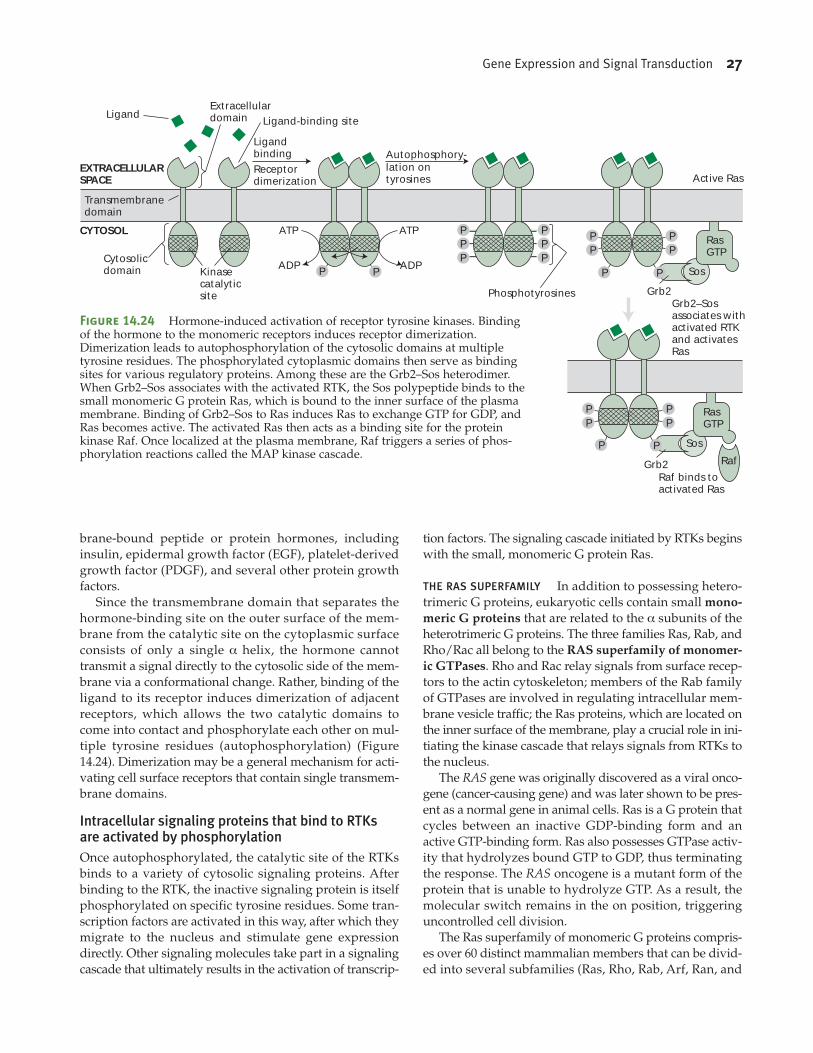
Gene Expression and Signal Transduction 27
brane-bound peptide or protein hormones, including
insulin, epidermal growth factor (EGF), platelet-derived
growth factor (PDGF), and several other protein growth
factors.
Since the transmembrane domain that separates the
hormone-binding site on the outer surface of the mem-
brane from the catalytic site on the cytoplasmic surface
consists of only a single α helix, the hormone cannot
transmit a signal directly to the cytosolic side of the mem-
brane via a conformational change. Rather, binding of the
ligand to its receptor induces dimerization of adjacent
receptors, which allows the two catalytic domains to
come into contact and phosphorylate each other on mul-
tiple tyrosine residues (autophosphorylation) (Figure
14.24). Dimerization may be a general mechanism for acti-
vating cell surface receptors that contain single transmem-
brane domains.
Intracellular signaling proteins that bind to RTKsare activated by phosphorylation Once autophosphorylated, the catalytic site of the RTKs
binds to a variety of cytosolic signaling proteins. After
binding to the RTK, the inactive signaling protein is itself
phosphorylated on specific tyrosine residues. Some tran-
scription factors are activated in this way, after which they
migrate to the nucleus and stimulate gene expression
directly. Other signaling molecules take part in a signaling
cascade that ultimately results in the activation of transcrip-
tion factors. The signaling cascade initiated by RTKs begins
with the small, monomeric G protein Ras.
THE RAS SUPERFAMILY In addition to possessing hetero-
trimeric G proteins, eukaryotic cells contain small mono-
meric G proteins that are related to the α subunits of the
heterotrimeric G proteins. The three families Ras, Rab, and
Rho/Rac all belong to the RAS superfamily of monomer-
ic GTPases. Rho and Rac relay signals from surface recep-
tors to the actin cytoskeleton; members of the Rab family
of GTPases are involved in regulating intracellular mem-
brane vesicle traffic; the Ras proteins, which are located on
the inner surface of the membrane, play a crucial role in ini-
tiating the kinase cascade that relays signals from RTKs to
the nucleus.
The RAS gene was originally discovered as a viral onco-
gene (cancer-causing gene) and was later shown to be pres-
ent as a normal gene in animal cells. Ras is a G protein that
cycles between an inactive GDP-binding form and an
active GTP-binding form. Ras also possesses GTPase activ-
ity that hydrolyzes bound GTP to GDP, thus terminating
the response. The RAS oncogene is a mutant form of the
protein that is unable to hydrolyze GTP. As a result, the
molecular switch remains in the on position, triggering
uncontrolled cell division.
The Ras superfamily of monomeric G proteins compris-
es over 60 distinct mammalian members that can be divid-
ed into several subfamilies (Ras, Rho, Rab, Arf, Ran, and
PP
PP
P
PP
PP
Sos
Grb2
RasGTP
Raf
Grb2Phosphotyrosines
P
Sos
RasGTP
ExtracellulardomainLigand
Cytosolicdomain
Transmembranedomain
Kinasecatalyticsite
CYTOSOL
Ligandbinding
Ligand-binding site
Receptordimerization
Autophosphory-lation ontyrosines Active Ras
PP
P
P
PP
Raf binds toactivated Ras
Grb2–Sosassociates withactivated RTKand activatesRas
PP
P
ATP
ADP
ATP
ADPP
EXTRACELLULARSPACE
Figure 14.24 Hormone-induced activation of receptor tyrosine kinases. Bindingof the hormone to the monomeric receptors induces receptor dimerization.Dimerization leads to autophosphorylation of the cytosolic domains at multipletyrosine residues. The phosphorylated cytoplasmic domains then serve as bindingsites for various regulatory proteins. Among these are the Grb2–Sos heterodimer.When Grb2–Sos associates with the activated RTK, the Sos polypeptide binds to thesmall monomeric G protein Ras, which is bound to the inner surface of the plasmamembrane. Binding of Grb2–Sos to Ras induces Ras to exchange GTP for GDP, andRas becomes active. The activated Ras then acts as a binding site for the proteinkinase Raf. Once localized at the plasma membrane, Raf triggers a series of phos-phorylation reactions called the MAP kinase cascade.
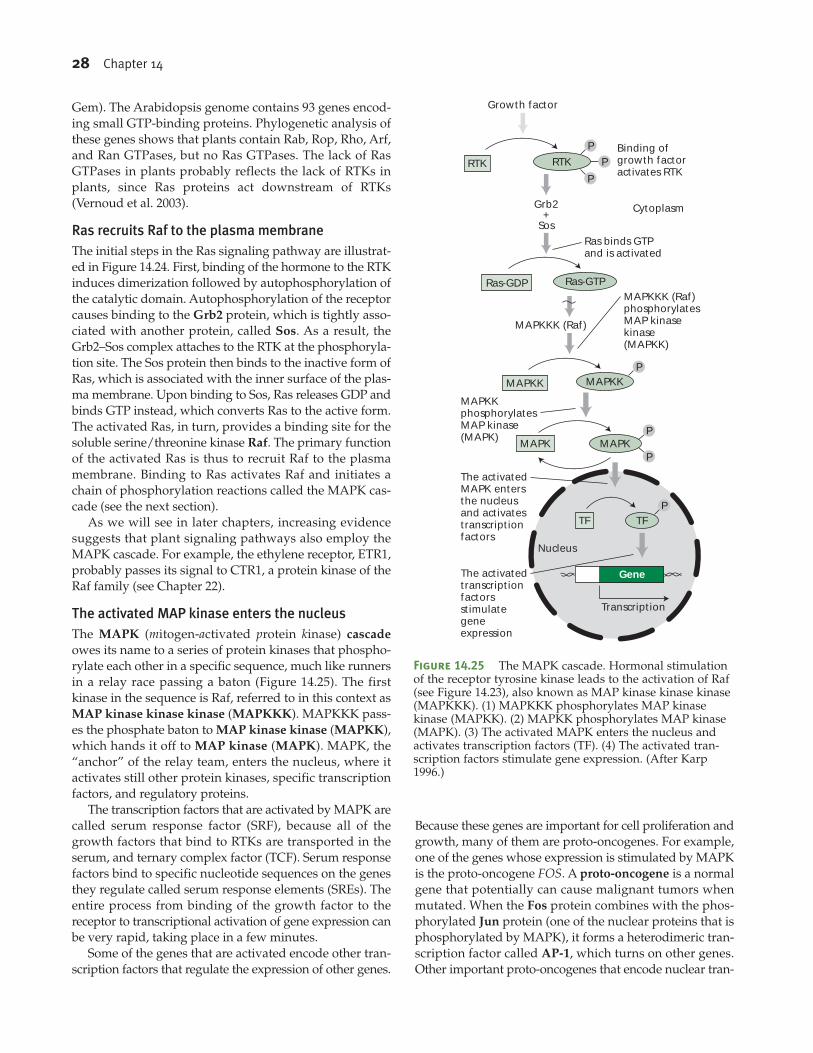
28 Chapter 14
Gem). The Arabidopsis genome contains 93 genes encod-
ing small GTP-binding proteins. Phylogenetic analysis of
these genes shows that plants contain Rab, Rop, Rho, Arf,
and Ran GTPases, but no Ras GTPases. The lack of Ras
GTPases in plants probably reflects the lack of RTKs in
plants, since Ras proteins act downstream of RTKs
(Vernoud et al. 2003).
Ras recruits Raf to the plasma membraneThe initial steps in the Ras signaling pathway are illustrat-
ed in Figure 14.24. First, binding of the hormone to the RTK
induces dimerization followed by autophosphorylation of
the catalytic domain. Autophosphorylation of the receptor
causes binding to the Grb2 protein, which is tightly asso-
ciated with another protein, called Sos. As a result, the
Grb2–Sos complex attaches to the RTK at the phosphoryla-
tion site. The Sos protein then binds to the inactive form of
Ras, which is associated with the inner surface of the plas-
ma membrane. Upon binding to Sos, Ras releases GDP and
binds GTP instead, which converts Ras to the active form.
The activated Ras, in turn, provides a binding site for the
soluble serine/threonine kinase Raf. The primary function
of the activated Ras is thus to recruit Raf to the plasma
membrane. Binding to Ras activates Raf and initiates a
chain of phosphorylation reactions called the MAPK cas-
cade (see the next section).
As we will see in later chapters, increasing evidence
suggests that plant signaling pathways also employ the
MAPK cascade. For example, the ethylene receptor, ETR1,
probably passes its signal to CTR1, a protein kinase of the
Raf family (see Chapter 22).
The activated MAP kinase enters the nucleus The MAPK (mitogen-activated protein kinase) cascade
owes its name to a series of protein kinases that phospho-
rylate each other in a specific sequence, much like runners
in a relay race passing a baton (Figure 14.25). The first
kinase in the sequence is Raf, referred to in this context as
MAP kinase kinase kinase (MAPKKK). MAPKKK pass-
es the phosphate baton to MAP kinase kinase (MAPKK),
which hands it off to MAP kinase (MAPK). MAPK, the
“anchor” of the relay team, enters the nucleus, where it
activates still other protein kinases, specific transcription
factors, and regulatory proteins.
The transcription factors that are activated by MAPK are
called serum response factor (SRF), because all of the
growth factors that bind to RTKs are transported in the
serum, and ternary complex factor (TCF). Serum response
factors bind to specific nucleotide sequences on the genes
they regulate called serum response elements (SREs). The
entire process from binding of the growth factor to the
receptor to transcriptional activation of gene expression can
be very rapid, taking place in a few minutes.
Some of the genes that are activated encode other tran-
scription factors that regulate the expression of other genes.
Because these genes are important for cell proliferation and
growth, many of them are proto-oncogenes. For example,
one of the genes whose expression is stimulated by MAPK
is the proto-oncogene FOS. A proto-oncogene is a normal
gene that potentially can cause malignant tumors when
mutated. When the Fos protein combines with the phos-
phorylated Jun protein (one of the nuclear proteins that is
phosphorylated by MAPK), it forms a heterodimeric tran-
scription factor called AP-1, which turns on other genes.
Other important proto-oncogenes that encode nuclear tran-
P
P
P
TF
MAPK
MAPKK
TF
MAPK
MAPKK
MAPKKK (Raf)
P
P
P
P
Ras-GTPRas-GDP
RTKRTK
Transcription
Nucleus
Gene
CytoplasmGrb2+
Sos
Growth factor
Binding ofgrowth factoractivates RTK
Ras binds GTPand is activated
MAPKKK (Raf) phosphorylatesMAP kinase kinase (MAPKK)
MAPKKphosphorylatesMAP kinase (MAPK)
The activatedMAPK entersthe nucleusand activatestranscriptionfactors
The activatedtranscriptionfactorsstimulategeneexpression
Figure 14.25 The MAPK cascade. Hormonal stimulationof the receptor tyrosine kinase leads to the activation of Raf(see Figure 14.23), also known as MAP kinase kinase kinase(MAPKKK). (1) MAPKKK phosphorylates MAP kinasekinase (MAPKK). (2) MAPKK phosphorylates MAP kinase(MAPK). (3) The activated MAPK enters the nucleus andactivates transcription factors (TF). (4) The activated tran-scription factors stimulate gene expression. (After Karp1996.)
Gene Expression and Signal Transduction 29
scription factors include MYC and MYB. Both phy-
tochrome (see Chapter 17) and gibberellin (see Chapter 20)
are believed to regulate gene expression via the up-regula-
tion of MYB-like transcription factors.
Plant receptor kinases are structurally similar toanimal receptor tyrosine kinases Plant receptor kinases (PRKs) are structurally similar to the
animal RTKs and RSKs. They have a large extracellular
domain, span the membrane only once, and contain a cat-
alytic domain on the cytoplasmic side. Like the animal
RTKs and RSKs, PRKs typically are active in the dimeric
state. Like the RSKs of animal cells, PRKs are autophospho-
rylating serine/threonine kinases (Cock et al. 2002).
Over 20 distinct types of extracllular domains have been
identified in receptors of the PRK superfamily. These
include S domains, leucine-rich repeat (LRR) domains,
domains with epidermal growth factor (EGF) repeat
sequences, and lectin domains. S-locus and LRR receptors
are perhaps the best-studied examples.
S-domain receptors are characterized by an extracellular
S domain homologous to the self-incompatibility locus (S-
locus) glycoprotein, and are called S receptor kinases or
SRKs. The S domain was first identified in a group of secret-
ed glycoproteins, called S locus glycoproteins (SLGs), which
regulate self-incompatibility in Brassica species. Self-incom-
patibility is characterized by the failure of pollen tubes to
grow when placed on pistils from the same plant, and self-
incompatibility loci are genes that regulate this phenotype.
The S domain consists of ten cysteines in a particular
arrangement with other amino acids. The high degree of
homology between the S domains of SRKs and those of
SLGs suggests that they are functionally related and are
involved in the recognition pathways involved in pollen
tube growth. Consistent with this idea, SRK genes are
expressed predominantly in pistils. Several other S domain
PRKs with highly divergent sequences have been identi-
fied in other species, and each of these may play unique
roles in plant cell signaling.
The leucine-rich repeat (LRR) family of receptors con-
stitute the second group of RLKs. They were first identified
as disease resistance genes that may play key roles in the
cell surface recognition of ligands produced by pathogens
and the subsequent activation of the intracellular defense
response (Song et al. 1995; Bent 1996). However, plant LRR
receptors have been implicated in normal developmental
functions as well. For example, a pollen-specific LRR recep-
tor has been identified in sunflower that may be involved
in cell–cell recognition during pollination (Reddy et al.
1995), and the Arabidopsis ERECTA gene, which regulates
the shape and size of organs originating from the shoot api-
cal meristem, encodes an LRR receptor (Torii et al. 1996).
More recently, the receptor for the plant steroid hormone
brassinosteroid has been identified as an LRR receptor (see
Chapter 24).
The LRR receptors are members of a larger family of
LRR proteins that includes soluble forms with lower
molecular mass that are widespread in plants and animals.
The most conserved element of the LRR domain forms a βsheet with an exposed face that participates in protein–pro-
tein interactions (Buchanan and Gay 1996). The small sol-
uble LRR proteins may participate in cell signaling by
hydrophobic binding to LRR receptors. For example, in
tomato a protein that contains four tandem repeats of a
canonical 24-amino-acid leucine-rich repeat motif is up-reg-
ulated during virus infection. This protein is apparently
secreted into the apoplast along with a protease that digests
it to lower molecular weight peptides (Tornero et al. 1996).
These peptides could form part of a signaling pathway by
interacting with cell surface LRR receptors.
Other developmentally important PRKs include
CLAVATA1 (CLV1), which is involved in the maintenance
of the apical meristem in Arabidopsis (see Chapter 16), and
wall-associated kinases (WAKs), which are covalently
bound to the cell wall (primarily to pectin molecules) and
help to regulate cell expansion. (For a recent summary of
plant hormone receptors, see Web Essay 14.1.)
SummaryThe size of the genome (the total amount of DNA in a cell,
a nucleus, or an organelle) is related to the complexity of
the organism. However, not all of the DNA in a genome
codes for genes. Prokaryotic genomes consist mainly of
unique sequences (genes). Much of the genome in eukary-
otes, however, consists of repetitive DNA and spacer DNA.
The genome size in plants is highly variable, ranging from
1.5 × 10⁸ bp in Arabidopsis to 1 × 10¹¹ bp in Trillium. Plant
genomes contain about 25,000 genes; by comparison, the
Drosophila genome contains about 12,000 genes.
In prokaryotes, structural genes involved in related
functions are organized into operons, such as the lac oper-
on. Regulatory genes encode DNA-binding proteins that
may repress or activate transcription. In inducible systems,
the regulatory proteins are themselves activated or inacti-
vated by binding to small effector molecules.
Similar control systems are present in eukaryotic
genomes. However, related genes are not clustered in oper-
ons, and genes are subdivided into exons and introns. Pre-
mRNA transcripts must be processed by splicing, capping,
and addition of poly-A tails to produce the mature mRNA,
and the mature mRNA must then exit the nucleus to initi-
ate translation in the cytosol. Despite these differences,
most eukaryotic genes are regulated at the level of tran-
scription, as in prokaryotes.
Transcription in eukaryotes is characterized by three dif-
ferent RNA polymerases whose activities are modulated
by a diverse group of cis-acting regulatory sequences. RNA
polymerase II is responsible for the synthesis of pre-
mRNA. General transcription factors assemble into a tran-
30 Chapter 14
scription initiation complex at the TATA box of the mini-
mum promoter, which lies within 100 bp of the transcrip-
tion start site of the gene. Additional cis-acting regulatory
sequences, such as the CAAT box and GC box, bind tran-
scription factors that enhance expression of the gene. Dis-
tal regulatory sequences located farther upstream bind to
other transcription factors called activators or repressors.
Many plant genes are also regulated by enhancers, distant-
ly located positive regulatory sequences.
Despite being scattered throughout the genome, many
eukaryotic genes are both inducible and coregulated.
Genes that are coordinately regulated have common cis-
acting regulatory sequences in their promoters. Most tran-
scription factors in plants contain the basic zipper (bZIP)
motif. An important group of transcription factors in
plants, the floral homeotic genes, contain the MADS
domain.
Enzyme concentration is also regulated by protein
degradation, or turnover. As yet there is no evidence that
plant vacuoles function like animal lysosomes in protein
turnover, except during senescence, when the contents of
the vacuole are released. However, protein turnover via the
covalent attachment of the short polypeptide ubiquitin and
subsequent proteolysis is an important mechanism for reg-
ulating the cytosolic protein concentration in plants.
Signal transduction pathways coordinate gene expres-
sion with environmental conditions and with develop-
ment. Prokaryotes employ two-component regulatory sys-
tems that include a sensor protein and a response regulator
protein that facilitates the response, typically gene expres-
sion. The sensor and the response regulator communicate
via protein phosphorylation. Receptor proteins related to
the bacterial two-component systems have recently been
identified in yeast and plants.
In multicellular eukaryotes, lipophilic hormones usual-
ly bind to intracellular receptors, while water-soluble hor-
mones bind to cell surface receptors. Binding to a recep-
tor initiates a signal transduction pathway, often involving
the generation of second messengers, such as cyclic
nucleotides, inositol trisphosphate, and calcium, which
greatly amplify the original signal and bring about the cel-
lular response. Such pathways normally lead to changes in
gene expression. In plants, the receptor for the phytohor-
mone brassinosteroid is a cell surface receptor.
The seven-spanning receptors of animal cells interact
with heterotrimeric G proteins, which act as molecular
switches by cycling between active (GTP-binding) forms
and inactive (GDP-binding) forms. Dissociation of the αsubunit from the complex allows it to activate the effector
enzyme. Activation of adenylyl cyclase increases cAMP
levels, resulting in the activation of protein kinase A. Cyclic
AMP can also regulate cation channels directly.
When heterotrimeric G proteins activate phospholipase
C, it initiates the IP3 pathway. IP3 released from the mem-
brane opens intracellular calcium channels, releasing calci-
um from the ER and vacuole into the cytosol. The increase
in calcium concentration, in turn, activates protein kinases
and other enzymes. In plants, calcium dependent protein
kinases, which have a calmodulin domain, are activated by
calcium directly. The other by-product of phospholipase C,
diacylglycerol, can also act as a second messenger by acti-
vating protein kinase C.
There is increasing evidence that cyclic GMP operates as
a second messenger in plant cells as it does in animal cells.
In animal cells, cyclic GMP has been shown to regulate ion
channels and protein kinases.
The most common family of cell surface catalytic recep-
tors in animals consists of the receptor tyrosine kinases.
RTKs dimerize upon binding to the hormone; then their
multiple tyrosine residues are autophosphorylated. The
phosphorylated receptor then acts as an assembly site for
various protein complexes, including the Ras superfami-
ly of monomeric GTPases. Binding of Ras leads to recruit-
ment of the protein kinase Raf to the membrane. Raf initi-
ates the MAPK cascade. The last kinase to be
phosphorylated (activated) is MAP kinase, which enters
the nucleus and activates various transcription factors
(serum response factors), which bind to cis-acting regula-
tory sequences called serum response elements.
Plants appear to lack RTKs, but they have structurally
similar receptors called plant receptor kinases (PRKs),
which are serine/threonine kinases. Over 20 different
extracellular domains have been identified in the PRK
superfamily. The signal transduction pathways of these
receptors are currently being elucidated.
Web Material
Web Essay
14.1 Plant Hormone Receptors: Perception IsEverything
A summary of the known plant hormone
receptors, emphasizing their common fea-
tures and interrelationships.
General Reading*Alberts, B., Bray, D., Lewis, J., Raff, M., Roberts, K., and Watson,
J.D. (1994) Molecular Biology of the Cell, 3rd ed. Garland, NewYork.
*Becker, W. M., Reece, J. B., and Poenie, M. F. (1996) The World ofthe Cell, 3rd ed. Benjamin/Cummings, Menlo Park, Calif.
Dey, P. M., and Harborne, J. B., eds. (1997) Plant Biochemistry. Aca-demic Press, San Diego.
Fosket, D. E. (1994) Plant Growth and Development: A MolecularApproach. Academic Press, San Diego.
*Karp, G. (1996) Cell and Molecular Biology: Concepts and Exper-iments. Wiley, New York.
Gene Expression and Signal Transduction 31
*Lodish, H., Baltimore, D., Berk, A., Zipursky, S., Matsidaira, P.,and Darnell, J. (1995) Molecular Cell Biology. Scientific Amer-ican Books, New York.
Tobin, A. J., and Morel, R. E. (1997) Asking about Cells. HarcourtBrace, Fort Worth, Tex.
* Indicates a reference that is general reading in the field and isalso cited in this chapter.
Chapter ReferencesAlberts, B., Johnson, A., Lewis, J., Raff, M., Roberts, K., and Wal-
ter, P. (2002) Molecular Biology of the Cell, 4th ed. Garland Sci-ence, New York.
Assmann, A. M. (1995) Cyclic AMP as a second messenger inhigher plants: Status and future prospects. Plant Physiol. 91:624–628.
Baulcombe, D. (2004) RNA silencing in plants. Nature 431:356–363.
Bent, A. F. (1996) Plant disease resistance genes: Function meetsstructure. Plant Cell 8: 1757–1771.
Buchanan, S. G., and Gay, N. J. (1996) Structural and functionaldiversity in the leucine-rich repeat family of proteins. Prog. Bio-phys. Mol. Biol. 65: 1–44.
Chen, X., Xiao Z.-A., and Zhang, C.-H. (1996) A preliminary studyon plant protein kinase C. Acta Phytophysiol. Sinica 22: 437–440.
Cock, J. M., Vanoosthuyse, V., and Gaude, T. (2002) Receptorkinase signaling in plants and animals: Distinct molecular sys-tems with mechanistic similarities. Curr. Opin. Cell Biol. 14:230–236.
Coux, O., Tanaka, K., and Goldberg, A. L. (1996) Structure andfunctions of the 20S and 26S proteasomes. Annu. Rev. Biochem.65: 2069–2076.
Elliott, D. C., and Kokke, Y. S. (1987) Partial purification and prop-erties of a protein kinase C type enzyme from plants. Phyto-chemistry 26: 2929–2936.
Golovkin, M., and Reddy, A. S. N. (1996) Structure and expressionof a plant U1 snRNP 70K gene—Alternative splicing of U1snRNP pre-mRNA produces two different transcripts. PlantCell 8: 1421–1435.
Harper, J. J., Sussman, M. R., Schaller, G. E., Putnam-Evans, C.,Charbonneau, H., and Harmon, A. C. (1991) A calcium-dependent protein kinase with a regulatory domain similar tocalmodulin. Science 252: 951–954.
Ichikawa, T., Suzuki, Y., Czaja, I., Schommer, C., Lesnick, A.,Schell, J., and Walden, R. (1997) Identification and role ofadenylyl cyclase in auxin signalling in higher plants. Nature390: 698–701.
Janistyn, B. (1983) Gas chromatographic-mass spectroscopic iden-tification and quantification of cyclic guanosine-3′:5′-monophosphate in maize seedlings (Zea mays). Planta 159:382–385.
Johnston, M. (1987) A model fungal gene regulatory mechanism:The GAL genes of Saccharomyces cerevisiae. Microbiol. Rev. 51:458–476.
Kategiri, F., Lam, E., and Chua, N.-H. (1989) Two tobacco DNAbinding proteins with homology to the nuclear factor CREB.Nature 340: 727–730.
Kretsinger, R. (1980) Structure and evolution of calcium-modulat-ed proteins. CRC Crit. Rev. Biochem. 8: 119–174.
Kwak, J. M., Kim, S. A., Lee, S. K., Oh, S.-A., Byoun, C.-H., Han,J.-K., and Nam, H. G. (1997) Insulin-induced maturation ofXenopus oocytes is inhibited by microinjection of a Brassicanapus cDNA clone with high similarity to a mammalian recep-tor for activated protein kinase C. Planta 201: 245–251.
Lam, E. (1997) Nucleic acids and proteins. In Plant Biochemistry, P.M. Dey and J. B. Harborne, eds., Academic Press, San Diego,pp. 316–352.
Li, W., Luan, S., Schreiber, S. L., and Assmann, S. M. (1994) CyclicAMP stimulates K+ channel activity in mesophyll cells of Viciafaba L. Plant Physiol. 106: 957–961.
Lodish, H., Berk, A., Matsidaira, P., Kaiser, C. A., Krieger, M., Scott,M. P., Zipursky, S., and Darnell, J. (2004) Molecular Cell Biology.W. H. Freeman, New York.
McAinsh, M. R., Webb, A. A. R., Taylor, J. E., and Hetherington, A.M. (1995) Stimulus-induced oscillations in guard cell cytosolicfree calcium. Plant Cell 7: 1207–1219.
Millner, P. A., and Causier, B. E. (1996) G-protein coupled recep-tors in plant cells. J. Exp. Bot. 47: 983–992.
Mortimer, R. K., Schild, D., Contopoulou, C. R., and Kans, J. A.(1989) Genetic map of Saccharomyces cerevisiae, Edition l0. Yeast5: 321–403.
Napoli C., Lemieux C., and Jorgensen R. (1990) Introduction of achalcone synthase gene into Petunia results in reversible co-suppression of homologous genes in trans. Plant Cell 2:279–289.
Newton, R. P., and Brown, E. G. (1992) Analytical procedures forcyclic nucleotides and their associated enzymes in plant tis-sues. Phytochem. Anal. 3: 1–13.
Ota, I. M., and Varshavsky, A. (1993) A yeast protein similar to bac-terial two-component regulators. Science 262: 566–569.
Parkinson, J. S. (1993) Signal transduction schemes of bacteria. Cell73: 857–871.
Pei, Z.-M., Ward, J. M., Harper, J. F., and Schroeder, J. I. (1996) Anovel chloride channel in Vicia faba guard cell vacuoles activat-ed by the serine-threonine kinase, CDPK. EMBO J. 15:6564–6574.
Peters, J. L., and Silverthorne, J. (1995) Organ-specific stability oftwo Lemna rbcS mRNAs is determined primarily in the nuclearcompartment. Plant Cell 7: 131–140.
Reddy, J. T., Dudareva, N., Evrard, J.-L., Krauter, R., Steinmetz, A.,and Pillay, D. T. N. (1995) A pollen-specific gene from sun-flower encodes a member of the leucine-rich-repeat proteinsuperfamily. Plant Sci. 111: 81–93.
Richards, H., Das, S., Smith, C. J., Pereira, L., Geisbrecht, A., Devitt,N. J., Games, D. E., van Geyschem, J., Brenton, A. G., and New-ton, R. P. (2002) Cyclic nucleotide content of tobacco BY-2 cells.Phytochemistry 61: 531–537.
Roberts, D. M., and Harmon, A. C. (1992) Calcium-modulatedprotein targets of intracellular calcium signals in higher plants.Annu. Rev. Plant Physiol. Plant Mol. Biol. 43: 375–414.
Shanklin, J., Jabben, M., and Vierstra, R. D. (1987) Red lightinduced formation of ubiquitin-phytochrome conjugates: Iden-tification of possible intermediates of phytochrome degrada-tion. Proc. Natl. Acad. Sci. USA 84: 359–363.
Song, W.-Y., Wang, G.-L., Chen, L.-L., Kim, H.-S., Pi, L.-Y., Holsten,T., Gardner, J., Wang, B., Zhai, W.-X., Zhu, L.-H., et al. (1995) Areceptor kinase-like protein encoded by the rice disease resist-ance gene, Xa21. Science 270: 1804–1806.
Takezawa, D., Ramachandiran, S., Paranjape, V., and Poovaiah, B.W. (1996) Dual regulation of a chimeric plant serine-threoninekinase by calcium and calcium-calmodulin. J. Biol. Chem. 271:8126–8132.
Tezuka, T., Hiratsuka, S., and Takahasi, S. Y. (1993) Promotion ofthe growth of self-incompatible pollen tubes in lily by cAMP.Plant Cell Physiol. 27: 193–197.
Torii, K. U., Mitsukawa, N., Oosumi, T., Matsuura, Y., Yokayama,R., Whittier, R. F., and Komeda, Y. (1996) The Arabidopsis EREC-TA gene encodes a putative receptor protein kinase with extra-cellular leucine-rich repeats. Plant Cell 8: 735–746.
32 Chapter 14
Tornero, P., Mayda, E., Gomez, M. D., Canas, L., Conejero, V., andVera, P. (1996) Characterization of LRP, a leucine-rich repeat(LRR) protein from tomato plants that is processed duringpathogenesis. Plant J. 10: 315–330.
Vernoud, V., Horton, A. C., Yang, Z., and Nielsen, E. (2003) Analy-sis of the small GTPase gene superfamily of Arabidopsis. PlantPhysiol. 131: 1191–1208.
Watson, C. L., and Gold, M. R. (1997) Lysophosphatidylcholinemodulates cardiac I-Na via multiple protein kinase pathways.Circ. Res. 81: 387–395.
Yang, T., Chaudhuri, S., Yang, L., Chen, Y., and Poovaiah, B. W.(2004) Calcium/calmodulin up-regulates a cytoplasmic recep-tor-like kinase in plants. J. Biol. Chem. 279: 42552–42559.
Zhang, F. and Peterson, T. (2005) Comparisons of maize pericarpcolor1 alleles reveal paralogous gene recombination and anorgan-specific enhancer region. Plant Cell 17: 903–914.