Embed Size (px)
Citation preview

CHAPTER 1 1
PERMEATION OF NITROGEN AND OXYGEN TURO1J68 SHR,
NR AND SSR/NR BLEND MEMBRANES
The results of this chapter have been communicated to Journal of Polymer Engineering Science
Prepared by BeeHive Digital Concepts for Mahatma Gandhi University

M embrane technology for gas separation has now emerged as a viable
alternative to conventional technologies such as cryogenics and pressure
swing adsorption. Further, growth of the technology depends upon the
development of membrane with high selectivity and high permeability. A large
number of gas permeability data has been reported for many kinds of conventional
polymers in the literat~re. ' .~ With the growing interest in gas separation
membranes, the study of gas transport properties of various polymers, including
engineering plastics and novel polymers, has been accelerated during the last
decade. Some examples are the studies by Toi e ~ a l . ~ and Chern e / a ~ . ~ for
poly(pheny1ene oxides), Chiou el for polysulfone and polyethersulfone, Min
and pau16 for poly(methylmethacrylates), Walker and ~ o r o s ' for polypyrroline and
Ichiraku el a/.' for poly(l -trimethyl-l -silyl-1 -propyne).
Recently L a and co-worker? reported studies on the sorption and transport
mechanism of gases in polycarbonate membranes Cobalt aceyl acetonate
[Co(acac),] was added Into a polycarbonate membrane to enhance its oxygen
solubil~ty They found that the oxygen solubrl~ty decreased sharply as pressure
~ncreased, especially at ION pressure region R u m er a1 lo investigated the
oxygedn~trogen separation by polycarbonate/Co (Sal Pr) complex membranes It
was found that both oxygen permeabil~ty and oxygednitroyen selectivity increased
when only 3 wt % Co (Sal Pr) was added
Prepared by BeeHive Digital Concepts for Mahatma Gandhi University

The polymer blendtng IS an ~mportant means of obtrun~ng new mater~als for I 1 1 3 membrane preparat~ons Compared to copolymers, mixture of these polymers
often have better phystcal properties wh~ch can be varted by adjusting the
composttlon of the blend Permeat~on propert~es are senstt~ve to changes tn
membrane structure such as crystall~n~ty, crossl~nk~ng, and phase morphology
In the previous chapters, the transport of liquids and vapours through
styrene-butadiene rubber, natural rubber and their blends has been reported. It is
equally important to study the gas permeation behaviour of these membranes for
various applications. The gas permeation characteristics of styrene-butadiene
rubber vulcanised with different crosslinking systems and styrene-butadiene rubber
and natural rubber blends with respect to nature of crosslinks and blend ratio are
discussed here.
11 .I. Results and discussion
77.77 SBR membranes
The oxygen and nitrogen permeabilities for SBR membranes vulcanised by
different crosslinking systems are shown in Table 1 1 . I . As apparent from
Table 1 1 1 that SBR vulcanised w~th EV systems exhibit high gas permeability and
those with DCP systems exhibit low permeability SBR membranes vulcanised
with CV and mixed systems exhibit intermediate values. The structure of crosslinks
formed during vulcanisation process is already discussed (Figure 9.7). Depending
on the flexibility of crosslinks the gas permeability would be in the order CV >
mixed > EV > DCP instead of the observed behaviour EV > mixed > CV > DCP.
In order to establish the observed behaviour, the crosslink density of the SBR
membranes were determined and are also given in Table 1 1 .1
Prepared by BeeHive Digital Concepts for Mahatma Gandhi University

Table 11.1. Permeability and Crosslink density values (SBR)
n, x I o4 (moUcc) 1 systems t.;:: (cm3 cr2.s c::) 1 I EV 6.95 1.92 0.716
DCP 6.02 1.09 2.49
It is very clear from fhe table that DCP membrane with the highest crosslink
dens~ty exhibits the lowest gas permeability and EV membrane with the lowest
crosslink density exhibits the highest gas permeability. As the number of crosslinks
per unit volume of the polymer increases, it is very difficult for the gas molecules to
pass through the tightly cross linked system. Therefore, the crosslink density and
partly the nature of crosslinks influence the gas permeation behaviour.
11.1.1.1 02/N2 selectivity of SBR membranes
The variation of 021N2 selectivity with crosslinking systems is given in
Figure 11.1. It is clear from the figure that peroxide membrane exhibits high
selectivity and the efficiently wlcanised membrane exhibits the low selectivity. CV
and mixed systems exhibit intermediate selectivity values. The sample which
exhibits high permeability shows only low selectivity and vice versa. The observed
selectivity is also related to tlle crosslink density of the samples (Table 1 1.1). The
relation between the oxygen-to-nitrogen selectivity and oxygen permeability is
given in Figure 11.2. In general, an approximately linear relation with negative
slope exists between the oxygen-to-nitrogen selectivity and oxygen permeability
has been reported. In this case also an approximately linear relationship was
Prepared by BeeHive Digital Concepts for Mahatma Gandhi University

observed. Also, it is reported that gas permeability usually follows the solution-
difision mechanism for many polymer systems. Using SBR membranes, if gas
permeability follows the solution-diffusion mechanism, the glass transition
temperature of the polymer membrane and diffusion constant are the important
factors controlling the process, and an approximately linear relation should exist
between them. The relation between glass transition temperature of the differently
crosslinked SBR and oxygen permeability is shown in Figure 11.3.
Figure 11.1.
. . NKlNG SYSTEMS
Variation of O d N 2 selectivity with crosslinking membranes.
systems in SBR
Figure 11.2. Variation of OZ/N2 selectivity with oxygen permeability
Prepared by BeeHive Digital Concepts for Mahatma Gandhi University

Figure 11.3. Dependence of oxygen permeability on glass transition temperature
As gas molecules pass through the molecules of the polymer membrane, the
rate of permeation is higher if the molecular structure is not rigid or the polymer
has a high free volume, i.e. the polymer having lower glass transition temperature
has higher gas permeabilities. As given in figure, an approximately linear relation
is found between glass transition temperature and oxygen permeabilities. As the ?,
decreases sharply from peroxide to EV, the gas permeability increases.
11.1.2 SBRMR blends
The 0 2 and N2 permeability values of SBRNR blends vulcanised with
different vulcanising systems are given Table 11.2. Both oxygen and nitrogen
permeabilities decrease from EV to DCP as in the case of SBR homopolymer. The
Prepared by BeeHive Digital Concepts for Mahatma Gandhi University

nature of crosslinks formed between rubber chains is identical to that of SBR.
Based on the flexibility of crosslinks we can only expect a high permeability for
CV sample rather than EV. The crosslink density given in Table 11.2 is in
agreement with this observation. The DCP sample with highest crosslink density
exhibits the lowest gas permeability, whereas the EV sample having the lowest
crosslink density exhibits the highest gas permeability.
I Mixed I 15.43 I 6.39 1 2.08 I
Table 11.2. Permeability and crosslink density values (SBRMR blends).
The oxygen-to-nitrogen selectivity of SBRNR blend membranes vulcanised
by different crosslinking systems is shown in Figure 11.4. The selectivity is
maximum for DCP membrane and minimum for EV membrane. CV and mixed
membranes have intermediate values. This behaviour is truly related to the
crosslink density as in the case of SBR membrane. The variation of oxygen-to-
nitrogen selectivity to oxygen permeability is shown in Figure 11.5. An
approximately linear relation was observed between them.
nl x 10' (mol/cc)
1.40
Systems r DCP
P x 10' (cm3 cm/cm2. s cm Hg)
I 14.57
0 2
16.00
N2
6.93
5.10 9.25
Prepared by BeeHive Digital Concepts for Mahatma Gandhi University

CROSSLINKING SYSTEMS
Figure 11.4. Variation of O D 2 selectivity of S B R m blends with different crosslinking systems.
Figure Variation of OzN2 selectivity with oxygen permeability of SBRINR blends.
Prepared by BeeHive Digital Concepts for Mahatma Gandhi University

11.1.3 Effecf of blend composition on pure gas permeability
The permeability coefficients of SBR, NR and SBR/NR blends to 0 2 and
N1 at 25°C are shown in Figure 11 6 . In all cases, gas permeability increases with
increasing NR wncentration. The oxygen and nitrogen permeability slowly
increase with increase of volume fraction of NR (up to 0.3) and then sharply
increase. This behaviour is associated with the blend morphology. As seen from
Figure 8.2, in N30 the highly permeating NR component forms the dispersed phase
in the continuous SBR matrix. This dispersedmatrix heterophase morphology
makes a tortuous path for the permeation of gas molecules. In NSO the dispersed
NR becomes continuous and thereby a sharp increase in gas permeability. The
relatively high permeability of N70 may also be due to the co-continuous
morphology.
0 0.2 0.4 0 6 0.8 1
VOLUME FRACTION OF NR
Figure 11.6. Variation of gas permeability with volume fraction of NR
Prepared by BeeHive Digital Concepts for Mahatma Gandhi University

It is also seen from the Figure 11.6 that oxygen exhibits h~gher permeability
compared to nitrogen. With Increasing NR concentration permeability to oxygen
increases more rapidly compared to permeability to nitrogen. The permeabilities of
polymer are to be a very sensitive function of penetrant size. Thus the increase in
permeability coefficient is more for oxygen compared to nitrogen as the kinetic
diameter of oxygen is less than that of the nitrogen.
11.1.4 Comparison of pure gas permeability of SBRNR blends with models for permeation in heterogeneous media
The experimental gas permeabilities in SBRNR blends are compared with
several theoretical models of permeation in heterogeneous blend^.'^,'^ Mixing rules
for predicting permeability of gases in homogeneous and heterogeneous blends and
copolymers have been developed from a simple free volume model and from the
activated state theory of transport which reduces to"
log P- = 41 log P, + Log Pz (11.1)
where PW is the gas permeability of blend. $1 and $2 are the volume fractions of
polymer 1 and 2 in the blend and PI and PZ are the permeabilities of pure
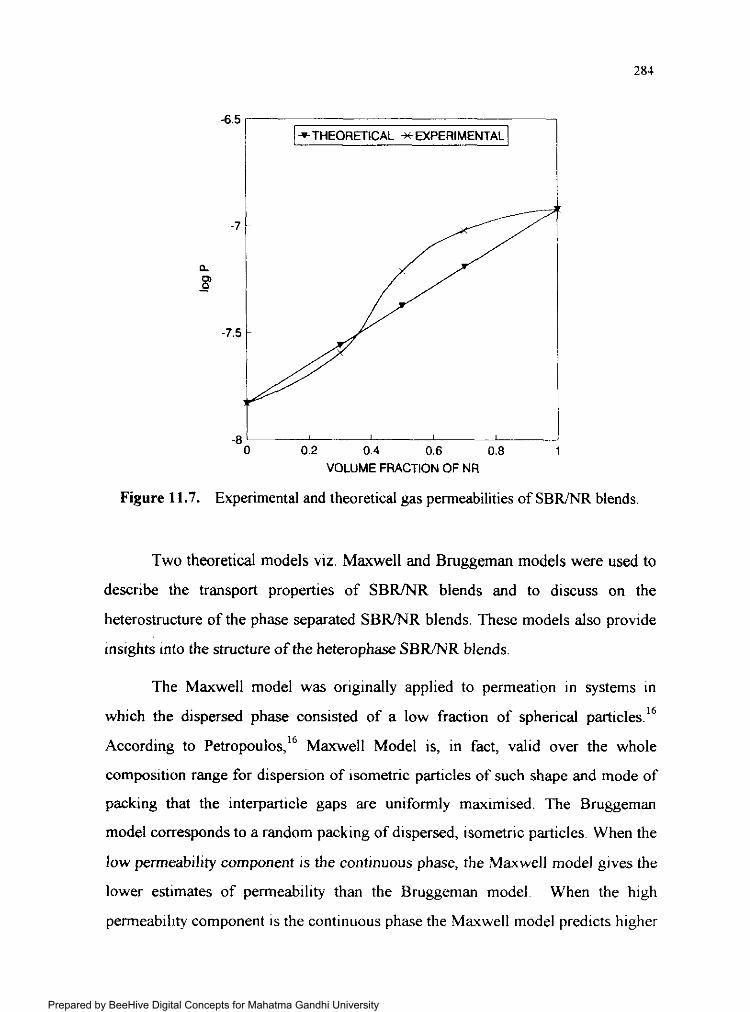
polymer 1 and 2, respectively. Figure 11.7 represents the experimental and
theoretical oxygen permeabilities of SBR/NR blends. The difference between the
two establ~shes the heterophase nature of the blend. There is a marked positive
deviation at higher concentration of NR in the blend. This deviation is due to the
co-continuous nature of N5o and N70 compositions.
Prepared by BeeHive Digital Concepts for Mahatma Gandhi University
VOLUME FRACTION OF NR
Figure 11.7. Experimental and theoretical gas permeabilities of SBRINR blends
Two theoretical models viz. Maxwell and Bruggeman models were used to
describe the transport properties of SBR/NR blends and to discuss on the
heterostructure of the phase separated SBR/NR blends. These models also provide
insights into the structure of the heterophase SBR/NR blends.
The Maxwell model was originally applied to permeation in systems in
which the dispersed phase consisted of a low fraction of spherical particles.16
According to ~ e t r o ~ o u l o s , ~ ~ Maxwell Model is, in fact, valid over the whole
composition range for dispersion of so metric particles of such shape and mode of
packing that the interparticle gaps are uniformly maximised. The Bruggeman
model corresponds to a random packing of dispersed, isometric particles. When the
low permeability component is the continuous phase, the Maxwell model gives the
lower estimates of permeability than the Bruggeman model When the high
permeabil~ty component is the continuous phase the Maxwell model predicts higher
Prepared by BeeHive Digital Concepts for Mahatma Gandhi University
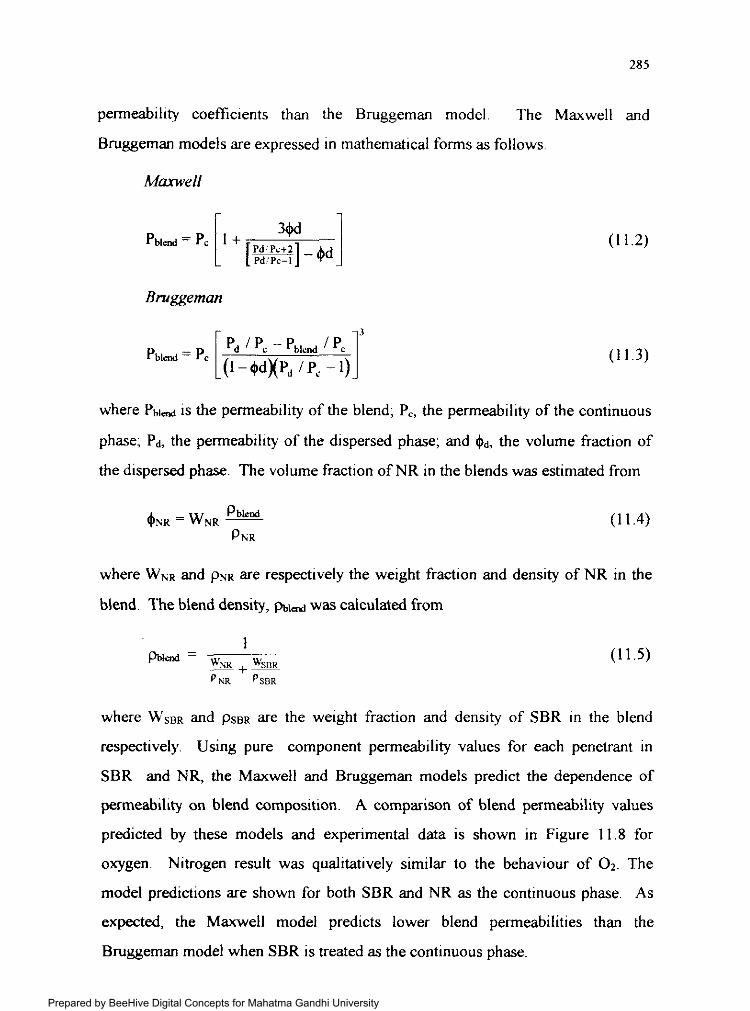
permeability coefficients than the Bruggeman model. The Maxwell and
Bruggeman models are expressed in mathematical forms as follows.
hiaxwell
Bruggeman
where P b ~ d is the permeability of the blend; PC, the permeability of the continuous
phase; Pd, the permeability of the dispersed phase; and +d, the volume fraction of
the dispersed phase. The volume fraction of NR in the blends was estimated from
where WNR and PNR are respectively the weight fraction and density of NR in the
blend. The blend density, was calculated from
where WSBR and p s e ~ are the weight fraction and density of SBR in the blend
respectively. Using pure component permeability values for each penetrant in
SBR and NR, the Maxwell and Bmggeman models predict the dependence of
permeability on blend composition. A comparison of blend permeability values
predicted by these models and experimental data is shown in Figure 11.8 for
oxygen. Nitrogen result was qualitatively similar to the behaviour of 0 2 . The
model predictions are shown for both SBR and NR as the continuous phase. As
expected, the Maxwell model predicts lower blend permeabilities than the
Bmggeman model when SBR is treated as the continuous phase.
Prepared by BeeHive Digital Concepts for Mahatma Gandhi University

f+BRUGGEMAN (NR CONTlNUOUS) 0) I *gRUGGEMAN (SBR CONTINUOUS)
E 30- +MAXWELL (NR CONTINUOUS) 0
U! -+MAXWELL (SBR CONTINUOUS) N
E
01 I 0 0.2 0.4 0.6 0.8 1
VOLUME FRACTION OF NR
Figure 11.8. Comparison of blend permeabilities with various theoretical models.
In SBRrmR blend with 0.3 volume fraction of NR, the permeability data is
close to Maxwell model with SBR is the continuous phase. Thus in this blend the
highly permeating NR forms the dispersed phase in the continuous SBR matrix.
There 1s an inflection point between 0.3 and 0.5 volume fractions and this indicate
a phase inversion. At 0.5 and 0.7 volume fraction of NR, the permeability of the
blend is close to Maxwell model with NR is the continuous phase.
11.1.5 Efiect of blend composition on oxygen to nitrogen selectivity
Pure gas oxygednitrogen selectivity of S B W R blends is given in
Figure 11.9. Oxygen permeability increases as the content of NR in the blend
increases (Figure 11.6). In contrast, the Oz/Nz selectivity decreases sharply with
increasing NR concentration in the blend.
Prepared by BeeHive Digital Concepts for Mahatma Gandhi University

0 1 I 0 0.2 0.4 0.6 0.8 1
VOLUME FRACTION OF NR
Figure 11.9. Variation of OJNz selectivity with volume fraction of NR in SBR/NR blends.
The change in selectivity with blend composition could be related to phase
inversion occurring over a narrow concentration range as is evident from
morphology of the blends. NR is more permeable than SBR to N2 and 0 2 . Thus
for theoretical models, if NR.is the continuous phase, then PdP, (< 1; if SBR is the
continuous phase, then PdP, )) 1. In either of these limits, the Maxwell model
yields the following prediction for blend selectivity.
where a ' & ~ is the ratio of permeability of penetrants A and B in the blend. The
permeabilities of the continuous phase to penetrants A and B are PC,* and PC,B
respectively. According to the Maxwell model, the blend selectivity should be the
selectivity of the continuous phase, and selectivity should be independent of blend
Prepared by BeeHive Digital Concepts for Mahatma Gandhi University

composition as along as phase inversion does not occur. In blends with NR content
less than 30 wt % of NR, SBR is the continuous phase. NR is the continuous phase
for blends with NR concentrations greater than 70 wt %. Between 30 and 70 wt %
of NR, the data suggest a co-continuous structure with both components being
continuous. At concentrations above 70 wt % of NR, the blend selectivity is
essentially that of NR. These predictions are consistent with the results obtained
from morphology studies. This interpretation of the SBRMR blend results is
substantiated by the earlier work of Ranby and co-workers." The gas transport
properties in blends of poly(viny1 chloride) (PVC) and poly(ethy1ene-co-
vinyl acetate) (PEVA) were determined in their studies. The vinyl acetate content
in PEVA was varied to prepare either compatible blends (45% VA) or phase
separated blends (65% VA). For phase separated blends a sharp decrease in
selectivity occurs as the PEVA concentration in the blend increases from
approximately 20%. At higher PEVA contents, the selectivity of the blend is
essentially constant and equal to the selectivity in pure PEVA. At PEVA contents
below 10°h, the selectivity is similar to that of pure PVC. These blends undergo
phase inversion, from PVC continuous to PEVA continuous. These results suggest
that the sharp change in selectivity observed in this study with S B m R blends may
be associated with phase inversion in the blend.
References
S. T. Hwang, C. K. Choi and K. Kammermeyer, Sep. Sci.. 9,461 (1974).
S. Pauly, Permeability und D~fis ion Data (Eds., J . Brandrup and E. H. Immergut), Polymer Hand Book, 3rd edn., John Wiley and Sons, New York, NY, 1989, pp. 435-449.
K. Toi, G. Morel and D. R. Paul, J. Appl. P o l ' . Sci., 27,2997 (1982).
R. T. Chern, F. R Shes, L. Jion, V. T. Stannett and H. B. Hopfenberg, J. Membr. Sci., 35, 103 (1987).
J. S. Chiou, Y. Maede and D. R. Paul, J. Appl. Polym. Sci., 35, 1823 (1987)
K. E. Min and D. R. Paul, J. Polym. Sci., Phys. E d , 26, 1021 (1988).
D. R. B. Walker and W. J. Koros, J. Membr. Sci., 55,99 (1991).
Prepared by BeeHive Digital Concepts for Mahatma Gandhi University

8. Y. Ichiraky S. S. Stem and T. Nakagawa, J. Membr. Sci., 34, 5 (1987)
Shib-Hsiung Chen, Ruoh-Chyu Ruaan and Juin-Yin Lai, J. Membr. Sci., 134, 143 (1997).
Ruoh-Chyu Ruaan, Shih-Hsiung Chen and Juin-Yih Lai, J. Membr. Sci., 135, 91 (1997).
C. T. Nguyen, in Synthetic Polymeric Membrunes (Eds., B. Sedlacek and J. Kahovec), Walter de Gruyter, Berlin, 1987, p. 479.
E. Ruckenstein and J. S. Park, J. Appl. Polym. Sci., 40, 213 (1990).
W. H. Jo, Y. S. Kang and H. J. Kim, J. Membr. Sci., 85, 81 (1993).
J. H. Peteropoulos, in Polymeric Gas Separation Membranes (Eds., D. R. Paul and Y. P. Yampoliskii), CRC Press, Boca Raton, 1994, pp. 17-81.
J. H. Peteropoulos, J. Polym. Sci., Part B: P o l ! . Phys., 23, 1309 (1 985).
R. M. Barter, in D ~ f i s i o n in Polymers (Eds., J . Crank and G. S. Park), Academic Press, London, 1968, pp. 165-21 7.
Y. J. Shur and B. Ranby, J. Appl. Polym. Sci., 19, 1337 (1975).
Prepared by BeeHive Digital Concepts for Mahatma Gandhi University