Embed Size (px)
Citation preview

1
CHAPTER ONE
INTRODUCTION
1.1 Background to the Study
Education is one of the main corner-stones for economic development and
improvement of human welfare. As global economic competition grows stiffer,
education becomes an important source of competitive advantage as it is linked to
economic growth and ways for countries to attract investment and hence jobs
(Srivatsava 2002). Education further appears to be one of the major determinants
of sustainable life-long earnings. Countries, therefore, frequently raise educational
attainment as a way of tackling poverty and deprivation (UNESCO 2005). A well
-educated and skilled workforce is one of the core pillars of the knowledge-based
economies (UNESCO 2005). This realization makes the reforms in education and
development to remain a central pre-occupation for many countries and for
international development. In every country at any given level of economic
development, there is a great demand for education reform in order to be able to
face the prevailing political, social and cultural changes as well as scientific and
technological transformations ( UNESCO Educational policy and Reforms 2008)
Since 1990, many governments have been promoting the use of Information
Communication Technologies (ICT) in education, particularly to expand access to
and improve the quality of education. At the same time, globalization and shift to
a knowledge-based economy requires that education institutions develop
2
individual ability to apply knowledge in dynamic contexts. ICTs have been
identified as a means to attain these objectives (School Net Africa 2003).
Although ICT is now at the center of education reform efforts, not all countries
are currently able to benefit from this development and advances that technology
can offer. Significant barriers often referred to as digital divide limit the ability of
some countries to take advantage of technological development (Kozma and
Anderson 2002). The developing countries are faced with challenges related to
access, pedagogy or assessment when using ICTs to improve and reinforce
education ( Kozma et al 2002). It is important to note that the concept, methods
and application of the term ICTs are constantly evolving rapidly; starting from the
popularity of the issue of computers in education in the 1980s, when relatively
cheap micro-computers became available for the consumer market, later, near the
end of 1980s the term was replaced by IT (Information Technology); signifying a
shift of focus from computing technology to the capacity to store, analyze and
retrieve information. This was followed by the introduction of the term ICTs
(Information Communication Technologies) around 1992 when email and World
Wide Web (Internet) became available to the general public (Pelgrum and Law
2003).
Though initially educators saw the use of ICTs in the classroom mainly as a way
of teaching computer literacy, it has a broader role: that of delivering many kinds
of learning at a lower cost and with high quality than the traditional methods of

3
teaching allow. In addition schools and universities increasingly use ICTs as do
other large organizations, to reduce cost, improve efficiency and administration
(Blurton 2002).
There has however been a wide disparity between the levels of investments in
developed countries vis-a-vis the developing countries, Kenya included.
Scrivatsava (2002), nonetheless states that this disparity is not necessarily a bad
thing as developing countries can learn from developed countries on ICT
integration.
The government of Kenya recognizes the benefits of ICT Integration in Education
at all levels of education in the country. The Kenya Economic Recovery Strategy
for Wealth and Employment (2003-2007), stresses that ICT is crucial for
realization of the required improvement in the Curriculum. The vision of Ministry
of Education Science and Technology (MoEST) is to facilitate ICT as a universal
tool for education and training. In order to achieve this vision, in every
educational institution, teachers, learners and the respective community should be
equipped with appropriate ICT infrastructure, competencies and policies for usage
and progress (Kenya National ICT Strategy GoK 2006)
A critical aspect to the successful implementation of ICT integration-related
objectives is the planning aspect. Pelgrum and law (2003), indicate that policy
makers and educational planners play a central role and indicate that there are
policy and planning implications in each step of implementation.

4
Research done by Brassford, Brown and Cocking (1994),showed that ICT can
enhance critical thinking, information handling skills, the level of
conceptualization and problem solving capacity among learners. However,
according to GoK (2006) there is considerable technology lag in the Kenyan
education institutions. Most of the institutions still use nearly obsolete systems
and consequently are unable to exploit educational potentials of the emerging
technologies. The document also notes that most schools use less than 40% of the
available infrastructure and there is; therefore, a need to ensure optimum use of
ICT resources by students, teachers and administrators in order to exploit
educational potential of the technology. It is, therefore, against the background of
the foregoing, that the researcher sought to investigate the extent of ICT
integration in enhancing teaching and learning activities in public secondary
schools in Kenya.
1.2 Statement of the problem
The successful integration of ICT into the classroom warrants careful planning
and depends largely on how well policy makers understand and appreciate the
dynamics of such integration (Jhurree 2005). Ministry of Education has placed
considerable emphasis on the importance of ICT integration in education as
evidenced by the promulgation of National ICT strategy in 2006 following the
approval of sessional paper number one of 2005. The vision of Ministry of
Education is to facilitate ICT as a universal tool for education and training and in

5
particular stimulate ICT integration in education in various regions in the country.
However, while other countries have reported up to 41% of ICT integration in
teaching and learning the proportion remains substantially low in Africa Kenya
included. Kasharda and Waema (2007) and Irura (2008) referring to the
implementation of ICT integration policy asserts that , there has not been well
spelt out procedure to address uniformity in the pace of ICT integration and it’s
adoption approach due to the various needs and disparities in secondary school in
Kenya. A recent report by Wikipedia Kenya in 2012 in Nyeri South District
indicated that some secondary schools had very few computers and that for most
of the schools that had reasonable number of computers, the main use was in
teaching Computer Studies. Nyeri South is a relatively new district that was
gazette in 2009. A study was therefore essential to determine the extent of ICT
integration in education in Nyeri South district with particular focus on exactly
how technology is being used in the teaching and learning process.
1.3 Purpose of the study
The purpose of this study was to assess the extent of ICT integration in teaching
and learning process in secondary schools in Kenya.
1.4 Objectives of the study
i. To determine the extent of accessibility of computers to teachers and
students in secondary schools in Nyeri South District.

6
ii. To determine the level of teachers’ and students’ expertise in ICT
integration in teaching and learning process in Nyeri South District.
iii. To determine the ways in which ICT is integrated in teaching and learning
process by teachers and students.
iv. To determine the extent of implementation of the Ministry of Education
policy on ICT integration in secondary schools in Nyeri South District.
1.5 Research Questions
i. What is the extent of accessibility of computers and related peripheral to
teachers and students to support e-learning?
ii. What is the level of teachers and student expertise on ICT integration in the
teaching and learning process?
iii. In which ways do teachers and students integrate ICTs in the teaching and
learning process?
iv. To what extent has the Ministry of Education ICT integration policy
objectives been implemented by schools in Nyeri South District?
1.6 Significance of the study
The Study findings may be used to facilitate the integration of ICT in the teaching
and learning process by both teachers and students. This information may also be
useful to administrators, policy makers and other stakeholders in education in
determining the preparedness of secondary schools in Nyeri South District in
terms of availability of appropriate ICT infrastructure for e-learning. Also, the

7
findings may be used as a baseline data for laying strategies on increasing the
level of ICT integration in the district. The study may further indicate the capacity
building gaps which may be useful in formulating framework to empower ICT
users in integrating ICT in the secondary school curriculum.
1.7 Limitations of the study
Some questions of innovation and teaching practices relied on the level of ICT
knowledge of the respondents and some respondents had limited knowledge
owing to their level of ICT awareness. This was solved by use of contingency
question items such that one only responded to items that applied to him or her.
An observation checklist was also be used to confirm, where it was possible, the
veracity of responses in the questionnaire items. Again, owing to the nature of
technology explosion and rapid changes taking place in education institutions, the
ICT integration situation in secondary schools in the district may change rapidly
within a short span of time, rendering the study to be obsolete. However, the
findings may still be useful as a baseline for future study to assess the extent of
such change.
1.8 Delimitation of the study
Delimitation of the study is the boundary limitation Best and Kahn (2005). This
study focused exclusively on utilization of ICTs in teaching and learning activities
but did not focus on ICTs utilization on other aspects in education like
administrative processes. Although Nyeri South District is located in an

8
agriculturally productive area, it is typically a rural area; hence, the findings of
this research may be generalized to other regions with caution since some
conditions in the district may be unique and different from other areas especially
those in urban set-ups.
1.9 Assumptions of the Study
i). Secondary school teachers and students are computer literate and
are conversant with various computer usages in teaching and
learning in Secondary Schools.
ii). The study assumes that secondary schools in Nyeri South District
utilize ICT in the teaching and learning process.
1.10 Definition of significant terms
Access opportunity or right to make use of something.ICT access is usually
determined by the number of ICT equipment available visavis the number of
learners.
Broadband internet of speed greater than or equal to 256 kilobits per second
(Kbps) in one or both direction
Computer training the process of enlightening an individual on how to use the
computers

9
Computer Virus a computer programme designed to affect the normal
functioning of computer. It can damage stored information or fill the computer
storage devices. These include Trojan, autorun, bomb.
Digital Content Refers to information that is published and distributed in
electronic form such as softwares.
Digital Divide It is the gap between those people with access to information and
Communication Technologies (ICTs) and those who do not have.
Hardware Refers to physical or tangible components of a computer including
computer motherboard and its accessories.
Information Communication Technology any product that will store, retrieve,
manipulate, transmit and analyze information electronically in digital form
including the internet, broadcasting technologies and mobile phones. For purpose
of this research the term ICT will be operationalised to imply only computers and
related peripheral devices for instance projectors, printers and scanners.
Information Communication Technology Integration use of any product that
will store, retrieve, manipulate, transmit and analyze information electronically to
introduce, reinforce, supplement and extend learning or acquisition of skills.
Multimedia It’s a combination of various digital means of communication in
computers. (images, sound, video and text).

10
Pedagogy A term generally used to refer to strategies of instruction or style of
instruction.
Peripheral any auxiliary or external device connected to a host computer and it
expands the computer capability for instance printers, scanners, LCD projectors.
In this study the term ICT tool has been used generally to include the computer
themselves, their peripherals or any other related facility.
Software program that instructs a computer to process data. Software’s can be
categorized into open source and proprietary.
World Wide Web It is information superhighway; it comprises networks that are
joined globally.
1.11 Organization of the study
The study is organized into five chapters: Chapter one highlights the background
and statement of the problem, purpose, objectives, significance, limitations,
delimitations, basic assumptions and the definition of significant terms of the
study. Chapter two focuses on literature review which is organized into the
following themes:- the concept of the ICT integration in education, internet
connectivity and ICT equipments in the school, teachers professional
development in ICT, digital curriculum and content of the schools and ICT
integration policy implementation in education. Chapter three covers research
methodology that was employed. These included research design, the target

11
population, the study sample size and sampling procedure, research instruments,
validity for the instruments, reliability of the instruments, data collection and data
analysis technique. Chapter four consists of data presentation analysis and
discussions of the findings while Chapter five comprises of summary,
conclusions, recommendations and suggestions for further research.

12
CHAPTER TWO
LITERATURE REVIEW
2.1 Introduction
This section reviews literature related to the study on ICT integration in the
teaching and learning process in secondary school education. The review is
divided into the following: the concept of ICT integration in education; internet
connectivity and ICT equipment in schools; teacher professional development in
ICT; digital curriculum and content for schools and policy framework for ICT
integration in education. The section ends with the discussion on theoretical
framework and conceptual framework upon which the study was based.
2.2 Concept of ICT Integration in Education
Information Communication Technology (ICT) is basically a tool; it can be a
hardware, a software or both. Jackson (2002) advises that teachers should not
replace what they teach, but see ICT as a tool just like a calculator, a pen or
chalkboard that help them to teach and students to learn. Hodgkison (2006) and
Duplessis (2010) note three types of ICT integration present in schools; the first
being, learning about computers without any link to classroom practice. The
second is full integration with traditional goals whereby computer is just used as a
transmitter of knowledge resulting to just learning “from” the computer and the
third is full integration with constructivist learning space and context, implying
that computers are taken as mediational or transformational tools resulting to

13
learning “with” or “through” using computers. An analysis of South African
Institute of Distance Education (SAIDE) (2003) suggests that the generative mode
integration is not the norm in most Sub-Saharan African schools.
Muchiri (2008) (citing Poole 1998) indicate that educators in United States of
America (USA) are able to put computers to good use in preparing teaching and
learning materials. They are able to produce syllabi, schedules and classroom
materials professionally and more efficiently using computers. By use of
productivity tools such as word processors, database management software,
communication systems and graphic tools educators are able to duplicate
excellence in managing the process of teaching and learning. Generally, educators
have found ICT to be a crucial tool for supporting drills and practice in previously
taught skills and concepts in class. Also opportunities for networking and
collaborative learning indicate that several principles and theories which promote
learner centered constructivist learning can be more easily integrated in teaching.
Furthermore, the internet connectivity makes it possible for educational resources
to be accessed and exchanged with relative ease.
Kenyan experience on ICT integration has been low despite the government and
Ministry of Education’s efforts to support ICT integration initiatives. Ndiku,
(2003) conducted a research on the experience of managers and computer
teachers in eight schools in Uasin Gishu with a focus on problem encountered in
implementing ICT projects. The research identified the following as the most

14
significant factors: insufficient number of computers and peripheral devices,
teacher lack of adequacy in ICT knowledge; inadequate software for instruction
and inadequate technical assistance .The research by Ndiku focused on problems
encountered in ICT implementation but did not capture the extent of ICT usage in
teaching and learning activities.
2.3 Internet Connectivity and ICT Equipments in schools.
Electronic learning in education is the wholesome integration of modern
telecommunication equipment and ICT resources in the teaching and learning
process and it can be online (synchronous) or offline (asynchronous) (Garrison ,
Anderson 2003 and Allen 2003)
An important aspect of e- learning therefore is the utilization of the internet in
education .Tracy (1995) defines the internet as the international network of
communication in which computers in wide area network (WAN) communicate
with each other. Most of the available options for effective use of ICT in support
of education are much more powerful when the activity is linked in a
communication network that permits access to email ,web browsing ,file transfers
through downloading and uploading as well as other communications .Brassford,
Brown and cocking (1999) indicate that High School students in the United
States of America(USA) use the internet to enhance their educational experience
in a variety of ways .These include opportunity for collaborative learning
environment where students actively construct their knowledge with online peers

15
and teachers through message boards, chat rooms and emails creating an arena
where different discourse and leaning styles can comfortably co-exist. Students
also benefit from lectures and presentations in form of video conferencing and
web cast from dispersed teachers and experts .Such learning opportunities can
only be possible if there is efficient internet connectivity in schools. Government
of Kenya (2006) quoting Educational Management Information Systems (EMIS)
survey (2003/2004) indicates that 70% of secondary schools and much larger
population of primary schools require functional internet connectivity. The study
also establishes that about 90% of secondary schools need to establish Local Area
Network to improve sharing of learning resources. Aydin and Tasci (2005)
indicate that secondary schools ought to ensure internet connectivity is in place as
it forms an important indicator of e-readiness for ICT integration.
The other major ICT infrastructure include multimedia computers and related
peripherals .The Kenya National ICT strategy for education and training, (2006)
indicate that with respect to great concern about digital divide, access to ICT
facilities is one major challenge in Africa and Kenya is not an exception. While
ratios of less than 15 students to 1 computer are the norm in most developed
countries, the ratio in Africa stands at 150 students to 1 computer. This ratio is
even wider in disadvantaged regions and areas. Cuban (2001) indicate that the
number of student per computer ratio is a common and important metric to judge
public school response to massive technological change of the last quarter

16
century. The lower the student to computer ratio, the better as a computer is an
individual device most useful for one person at a time.
2.4 Teacher Professional Development in ICT
The growth of the ICT sector has challenged teacher training institutions to
prepare a new generation of teachers to effectively use the new teaching and
learning tools in their profession UNESCO (2002). Pascopella (2001) notes that
globally most educators are not competent to integrate application software
meaningfully into the learning content of a learning area and this may be the
reason that schools do not appear to be exploiting the opportunities offered by
ICT.
A study by Russel (2000) aimed at establishing baseline information regarding
Australian teachers’ experiences and skills in ICT. The investigation revealed that
the teachers saw themselves as competent with basic computer skills but were less
confident with activity requiring advanced use of computers. Muriithi, (2005) in
her study on a framework of integrating ICTs in secondary schools argued that in
Kenya, ICT usage is limited to computer literacy training. She contends that the
present ICT curriculum for teacher-trainees merely deals with training about
computer and not how computers can be used to improve the teaching and
learning in schools. Both Muriithis’ (2005) and Russels’ (2000) studies indicate
that computer studies knowledge possessed by teachers has not yet helped in
transforming the teaching process through ICT integration and thus a review on

17
teacher training and capacity building is still required. The current study aims at
establishing the extent of expertise in ICT usage by secondary school teachers
with particular emphasis on ICT integration skills.
2.5 Digital Curriculum and Content for Schools.
Computers themselves do not come pre-packaged with relevant teaching content
and although the internet provides a vast number of resources, most are in English
and may need to be modified in order to be relevant for the Kenyan student and
curriculum needs (Kenya national ICT strategy (2006). In this light, investment in
custom-made digital material with high relevant content for Kenyan classroom in
rural and urban contexts is important if MoEST wants to tap into the real potential
of ICT for learning. According to Wims and Lawler (2007), a research done in
Rift Valley assessing impacts of investments in educational institutions, found
that most of institutions do not have specialized and simulated academic
programme software installed on their PC (Personal Computers) for use by
students. Despite the many designs of school software by Kenya Institute of
Education (KIE) and MoEST, there has not been great improvement in terms of
software available and used in schools to facilitate easier pedagogical activities in
classroom.
Hash, (2008) asserts that Timetabling and Results analysis software have special
niche in schools such that tasks that used to take even a week or more manually
now take only an a hour when working with Access Database timetabling or

18
results analysis software. This is a clear evidence that the use of ICTs in school
can go along way in improving education delivery (Specialist School and
Academies Trust, 2006).
2.6 Policy Framework for ICT integration In Education
Kenya promulgated a National ICT policy in January 2006 that aims to improve
the livelihood of Kenyans by ensuring the availability of accessible efficient and
affordable ICT services The mission statement of the policy is “To integrate ICT
in education and training for improved access, learning and administration” .The
policy has several sections but it is the section on Information Technology that
sets out the objectives and strategies pertaining to ICT in education. In June 2006,
the ministry of Education introduced the National ICT Strategy for Education and
Training, a sector wide stakeholder driven five year strategy document .The
document was developed in line with National ICT policy ,Kenya Education
Sector Support Programmme (KESSP), E-Government Strategy and the
Millenium Development Goals ( MDGs). Some policy objectives outlined in the
strategy include : To establish functional networked computer laboratories in
education institutions; to equip educational institutions with digital equipment and
internet connectivity; to stimulate integration of ICT in education in various
regions, to develop education software to meet local education requirement in
teaching and learning; to build basic capacity in ICT skills for all players in
education sector; to stipulate minimum hardware specifications adequate for
educational use and to promote public and private sector investment in ICT in the

19
education subsector Despite the policy strategy being comprehensive and a
vehicle through which policy objectives in Kenyan Education can be achieved.
Kashorda , Weema (2007), and Irura (2008) asserts that one of the weaknesses of
the Kenya National ICT Policy and Strategy is the lack of explicit implementation
strategy and adoption approach addressing the various needs and disparities in
secondary schools in Kenya. The current study seeks to determine the extent of
ICT integration in the teaching and learning process with particular focus on the
level of implementation of some ICT policy objectives in secondary schools in
Nyeri South District.
2.7 Summary of Literature Review
Reviewed literature indicates that a lot of work has been done to initiate
comprehensive ICT use in schools, beginning with the developed countries like
USA, Australia and Britain in the last two decades and more recently the
developing countries as well. However, there is still a big gap between advocacy
and real practice especially with regard to extent of ICT integration and actual
classroom pedagogical practice. In Kenya for instance there has not been
uniformity in ICT implementation as this has been carried out largely by
individual schools with occasional support from the private sector. KESSP (2005
– 2010) for instance estimate that only 3 % of Kenyan schools have ICT
infrastructure albeit limited, which is not even put to optimal use.

20
2.8 Theoretical Framework
The research is based on the modern human capital theory developed in the 1960s
by Theodore W. Schultz together with other economists including Gary S.
Becker, Jacob Mincer and Samuel Bowles. Human capital theory is based on the
belief that individuals and societies at large derive economic gains by investing in
people. It is argued that such investments aimed at exploiting the utmost potential
of people should target areas like education, Health and nutritional improvement
Schultz (1971). The theory rests on the assumptions that formal education is
highly instrumental and even necessary to improve the productive capacity of
population that in turn fuels economic growth.
For countries to meet their labour or industrial requirements as well as gain the
necessary competitive edge in the global information and knowledge based
economy, they need a work force that is skilled in use of technology. Information
Communication Technology integration in education forms a critical entry point
Furthermore, equipping institutions and keeping them up to date with ICT
equipment is very expensive operation not only due to the necessary hardware and
software purchases but also because of the recurrent cost associated with
maintenance and support Pelgrum and Law (2003). According to Fagerlind and
Saha (1997) human capital theory provides a basic justification for such large
public expenditure towards providing and improving education.

21
TECHNICAL SUPPORT
FINANCING
ADMINISTRATIVE
SUPPORT
Competent use of
ICT in
presentation and
preparation of
instructional
materials.
2.9 Conceptual Framework
According to Ogula, (1998) conceptual frame work is a description of the main
independent and dependent variables of the study and relationship among them.
The study was conceptualized on the variables used in the objectives.
Figure 2.1 Relationship between variable in the teaching and learning
process and ICT integration
Policy on ICT
Integration
Computers and Support environment
related peripherals
Software availability
Power and internet
Connectivity
ICT expertise and
Attitudes
In figure 2.1 realization of the ICT integration vision in Education dependents on
availability of various variables in schools including among others:- Computers,
education software, ICT skills and internet connectivity. These variables are
taken to affect ICT usage in education delivery. Plans policies and

22
implementation strategies guide the whole processes. Support environment is
required in terms of finances, administration and technical assistance to teachers.
Some indicators of ICT integration include; competent use of internet, ICT use in
presentation and preparation of instructional material, assessment and result
analysis among others.

23
CHAPTER THREE
RESEARCH METHODOLOGY
3.1 Introduction
The section covers research methodology used in this study. It is organized under
the following sub-headings: research design, target population, sample size and
sampling procedure, research instrument, instrument validity, instrument
reliability, data collection procedure and data analysis
3.2 Research Design
A research design is the structure of research. It holds all the elements in a
research project together. It shows how all the major parts of the research project
work together to try to address the central research question Kombo and Tromp,
(2006). The study adopted a descriptive survey design. Kombo, (2006) defines
descriptive survey as a method of collecting information by administering a
questionnaire to a sample of individuals in order to secure evidence concerning all
existing situations, and comparing the present conditions for the next cause of
action. Descriptive survey was suitable since this study sought to determine the
extent of ICT access and usage in the various teaching and learning activities in
secondary school.

24
3.3 Target population
Nyeri South district has 34 secondary schools and all are public. The schools are
categorized as 8 counties and 26 district schools .The target population is 34
principals, 4760 students and 680 teachers from all the 34 schools in the district.
(School statistics return DEO’s office Nyeri South District July 2012 )
3.4 Sample Size and Sampling Procedure
A sample size is a small group obtained from the accessible population while
sampling is a research technique used for selecting a given number of subjects
from a target population as a representative of that population Borg and Gall
(1989). Mugenda and Mugenda (2003) argue that if the population is less than
10,000 and that there is no estimate available of the proportion in the population
assumed to have the characteristic of interest then 50 % can be used with a
corresponding statistics of 1.96 and precision value of plus or minus 5%. A
sample size to be adjusted of 384 can be consequently used. This is arrived at
using the following relation
no=z2 pq/e
2 (1.96)
2 (0.5) (0.5)/(0.05)
2=384
Where :
no = sample size to be adjusted
z= is a value at the area under normal curve of confidence level of 95%

25
p= is a sample population of successes within which is 0.5 and q is (1-p) that
is (1-0.5) = 0.5
e= is precision value or the sample error. Here, it’s taken to lie within plus or
minus 5%.
The population of the teachers and students for this study is each less than 10,000
hence the study adopted the formula for determining the sample size as follows:
nf=no/(1+(no/N))
Where
nf = is the desired sample (when population is less than 10,000)
no= sample size to be adjusted size i.e. 384 (Treated as a constant)
N= estimates of population size
Sample size of student from target population of 4760
Sample size (nf) = 384/(1 + 384/4760)=355
Sample size of teachers from target population of 680
Sample size (nf) = 384/(1+ 384/680) = 245
Data was collected from all the 34 schools and all the 34 Principals were
purposively included as they were key informants to the study. The rest of the
sample was selected using simple random sampling technique where each
member was given an equal chance to participate.

26
3.5 Research Instruments
The study sought for empirical and qualitative data collection approaches. Data
was collected from the secondary schools using three sets of questionnaires. An
observation checklist was used to confirm some facts on the questionnaires. The
questionnaires were divided into two sections covering demographic information,
access and usage of ICT as well as attitudes and challenges on ICT use. Both
open and close ended questions were used. Close ended questions restricted the
respondents to yes or no responses. Matrix questions, contingency questions and
behavioral questions were also included. The open ended questions allowed the
respondents to give an in depth response to the subject of study.
3.5.1 Validity of the Instruments
The validity of the research instruments represents the degree to which a test
measures what it is supposed to measure, (Kombo and Tromp 2006). Mutai
(2000) further indicate that for a research instrument to be considered valid, the
content selected and included in the questionnaire must be relevant to the variable
being investigated. To enhance the validity of the research instruments, the
researcher had the research instruments appraised by the two supervisors who
were the authorities in the area .The content of the questionnaire were then
corrected appropriately according to the supervisors guidance. All the
questionnaires were structured in a simple language to facilitate easy
understanding

27
3.5.2 Instrument Reliability
According to Mugenda and Mugenda (1999), the reliability of instruments is the
measure of the degree to which research instruments yield consistent results or
data after repeated trial. In this study test-retest method was used to test reliability
of the instrument. The same questionnaires were administrated to the same
subject in the same conditions twice within a week . The two sets of scores from
each group were then correlated using pearson’s products moments correlation
coefficient ( r).
r =
Where =score of the first test for each respondent = score of the
second test for each respondent:
r = correlation coefficient of the scores in the two sets
= number of respondents
According to Mugenda and Mugenda, (2003) if (r) is closer to one the research
tools are regarded as accurate .The coefficient of correlation were found to be
0.93, 0.96 and 0.82 for the principal questionnaire teachers and students
questionnaire respectively, hence the reliability of the three questionnaires was
considered to be high enough to give consistent result.
28
3.6 Data Collection Procedure
Permission to carry out research was obtained from: The ministry of Higher
education through the National Council of Science and technology, Nyeri south
District Education Office (DEO) and from Nyeri South District Commissioner’s
Office (DC) Three sets of questionnaires were administered as follows: one set to
the school heads, another set to the subject teachers and a third set to the students.
The researcher also filled an observation schedule in some of the school that were
visited.
3.7 Data Analysis Techniques
Data analysis techniques are statistical methods which were used to analyze data
so that it could be interpreted. The data collected from the respondent was both
quantitative and qualitative in nature. Quantitative data was coded tallied and
analyzed using descriptive statistics such as mean, frequency and percentages.
The result of data analysis was reported in summary form using frequency tables,
bar graphs and pie charts. Qualitative data analysis for the open ended questions
was done using content analysis where ideas were grouped into themes. The
frequencies of different descriptions were generated by categorizing and coding
pieces of data into themes. Frequency distribution and percentages were obtained
using Statistical Package for Social Sciences (SPSS)

29
CHAPTER FOUR
DATA PRESENTATION, ANALYSIS AND DISCUSSIONS
4.1 Introduction
This chapter presents the results of data collected from the field. The findings
have been presented with respect to each of the specific research questions that
guided the study.
4.2 Questionnaire return rate
A total of 634 questionnaires were administered to 355 students in form 3 and
form 4, 245 teachers and 34 principals. Table 4.1 summarizes the questionnaire
return rate.
Table 4.1 Questionnaire return rate
Respondents Sample size
administered
Actual response Percent
Student
Teacher
Principal
355
245
34
317
210
31
89.3
85.7
91.1
Total 634 558 88.0

30
Table 4.1 indicates that the average response rate was 88%. According to Edward,
Roberts, Clarke, Diguiseppi, Pratep, Wentz and Kwan (2000) a questionnaire
return rate of 80% and above is absolutely satisfactory while 60-80% is quite
satisfactory .A rate below 60% is barely acceptable. This response rate obtained
here was considered sufficient to provide reliable response.
4.3 Demographic data for respondents
The data presented in this part was obtained from responses by the teachers,
principals and students in respective questionnaires
4.3.1 Distribution of principals by gender
Figure 4.1 Distributions of principals by gender
Female Male
60
50
40
30
20
10
0
42
58

31
Figure 4.1 shows that out of 31 principals who responded most 18 (58.1%) were
male. This data indicates that principalship in secondary schools in Nyeri South
District is male dominated.
4.3.2 Distribution of principals by years of experience as principal
The study further sought to establish the distribution of the principals by their
years of experience as school heads. Table 4.2 summarizes the data obtained.
Table 4.2 Distribution of principals by years of experience
Experience in years Frequency Percent Cumulative
percent
1 -5
6 – 10
11 – 15
16 – 20
Over 20
4
9
5
11
2
12.9
29.0
16.1
35.5
6.5
12.9
41.9
58.1
93.5
100
Total 31 100.0 100.0
Table 4.2 indicate that a majority of the principals are very experienced as
58.1% had experience of 10 years and beyond. Experience as principal is
significant as it influence how individuals respond to innovation and change
presented by use of ICT in teaching and learning

32
4.3.3 Distribution of teachers by gender
The majority of respondents were male 114 (54.3%) while the minority were
female 46 (45.7%). The data corroborated with the statistics provided by
principals by their data which indicated that there were a total of 618 teachers in
all the 31 schools out of which 324 (52.4%) were male and 294 (47.6%) were
female.
4.3.4 Distribution of teachers by age
Table 4.3 Distribution of teachers by age
Frequency Percent Cumulative
percent
Below 25yrs
25 -30yrs
31-40yrs
41-50yrs
56
50
62
42
26.7
23.8
29.5
20.0
26.7
50.5
80.0
100.0
Total 210 100.0
Pertaining the age of the teachers as shown on table 4.3 the findings indicate that
cumulatively most teachers are 30yrs and below, 106 (50.5%) and only a small
proportion of teachers 42 (20%) was above 40yrs. According to Muchiri (2008)
younger teachers are more open to use of ICT than most but not all older teachers.

33
4.3.5 Distribution of teachers by teaching subject
Teachers were asked to indicate their main teaching subjects. Analysis of their
responses are summarized by table 4.4
Table 4.4 Distribution of teachers by their teaching subject
Frequency Percent Cumulative
percent
Languages
Mathematics
Applied
Sciences
Humanities
15
40
20
123
12
7.1
19.0
9.5
58.6
5.7
7.1
26.2
35.7
94.3
100.0
Total 210 100 100
Table 4.4 shows that the majority of teachers 123 (58.6%) were science oriented
while minority 12.(5.7%) were humanities oriented. This indicated that there was
unequal distribution of teachers teaching various disciplines. For the purpose of
this study, it is reassuring to note that all the departments in secondary school
curriculum were represented.

34
4.3.6 Distribution of students by gender
Figure 4.2 Distribution of students by gender.
Figure 4.2 shows that the majority of students are female, 181 (57%).This
indicates that schools in Nyeri South District are female students dominated;
probably there being low boy child participation rate in education.
4.3.7 Distribution of students by class
Of the Students who were sampled the majority were in form 3 198 (62.5%)
while the rest 119 (34.5%) were in form 4
4.3.8 Distribution of students by age
When asked to indicate their age at the time of study, students’ responses were as
summarized in table 4.5

35
Table 4.5 Distribution of students by their age
Age
(Years)
Frequency Percent Cumulative
percent
14 – 16
17 – 20
Total
70
247
317
22.1
77.9
100.0
22.1
100.0
Table 4.5 shows that the majority of the students were within the school going age
bracket of 17- 20 yrs at 77.9%
4.4 Responses pertinent to extent of ICT integration in teaching and learning
process
The study was guided by five research objectives and the findings from the field
are reported as per questions 4.4.1, 4.4.2, 4.4.3 and 4.4.4
4.4.1 Research question 1: What is the extent of accessibility of computer and
related peripheral to support e-learning?
Principals, teachers and students were asked several questions on various aspects
to determine the extent of access to computer and the related peripherals and their
response were as described:-

36
Regarding the presence of electricity connection all the 31 (100%) secondary
schools in Nyeri South District were reported to have electricity. Electricity
connectivity is a major enabling factor for ICT integration in teaching and
learning.
When asked to rate power outage (blackouts) in their schools on a likert scale of
always, often, and never, all the 31 (100%) principals ranked power outages as
sometimes there were blackouts . In connection to power outages 14 (45.2%)
schools reported to have installed standby power back-up generators while 17
(54.8%) reported to have no power back-up installed. This indicates that the
barrier of power supply reliability in most schools still exist and can hamper
effective ICT integration whenever there is power failures. Principals from 8
(25.8%) of the schools indicated they did not have computer labs although the
majority of schools 23 (74.2%) had a computer lab. There was no school that had
more than one computer lab.
Pertaining distribution of desktop computers in the schools, the principals were
asked to give the number of desktop computers in their schools their responses
were as summarized in Table 4.6

37
Table 4.6 Distribution of desktop computers in the schools.
The principals were asked to give the number of desktop computers in their
school and their responses were as summarized in table 4.6
Number of computers Frequency Percent Cumulative
frequency
(0-5) 8 25.8 25.8
(11-15) 6 19.4 45.2
More than 20 17 54.8 100
Total 31 100 100.0
Table 4.6 shows that a majority of the schools 54.8% in Nyeri South District
have more than 20 computers with two schools having the highest number of
computers which was 60 , 8 (25.8%) of the school had 0-5 computers suggesting
that in such schools computers were probably used for administrative functions
other than for teaching and learning. Further, the study found that the average
number of computers per school was 20.03 computers with a standard deviation
of 16.91. the high standard deviation which is a measure of dispersion indicate
that there was a wide disparity between the number of desktop computers owned
from one school to another.

38
Student computer ratio (SCR)
The principals were asked to give the number of computers accessible to students
and the total number of students in their schools so as to enable the computation
of number of students per computer. Table 4.7 summarizes the distribution of
computers.
Table 4.7 Number of computers dedicated to students use
Computers Frequency Total
0
10
11
12
20
25
26
30
31
45
60
8
2
2
2
2
3
3
3
2
2
2
0
20
22
24
40
75
78
90
62
90
120
Total 31 621

39
Data obtained from table 4.7 was used in computation of student to computer ratio
(CSR) which is an index useful in determining and comparing access of
computers to students in schools.
Student computer ratio (SCR)
Total Number of students
Computer accessible to students
= 13, 345
621
= 21.4895
≈ 22 students for every computer
The computation from the school data that was collected indicated that the
students to computer ratio (SCR) was 21.4895 translating to about 22 students
per computer (22:1) Although this ratio was significantly lower than the
government estimate GOK (2006) of (150:1) there is still a great disparity
between the findings and the situation in developed countries. A recent survey on
technology access and use by European School Net (2012) which sampled 31
countries (EU27, Croatia, Iceland Norway and Turkey) found that there was
about 3 to7 student per computer in the European Union (EU). This comparison
clearly indicates that a SCR of 22:1 is still high as the lower the ratio the better
the access of computers to students in schools.

40
Connectivity of computers to the internet
Principals were asked to indicate the type of internet connectivity in their schools
the summary of the findings are in Figure 4.3
Figure 4.3 Types of internet connectivity used by secondary schools
The findings indicated that 51.6% of schools had internet connectivity while
48.4% did not have. Most of the schools connected to the internet had wireless
access while only one school (3%) had fixed connectivity using Very Small
Aperture Terminal (VSAT). The principal from the school that had installed
VSAT connection indicated that it was very reliable as it utilizes satellite
transmissions and therefore very appropriate for a remote locations. Most schools
No Connectivity Wireless Dial Up VSAT
60
50
40
30
20
10
0
48
39
10
3

41
connected to the internet had more than 10 computers connected indicating that
they were probably for teaching and learning purpose.
Cost of internet connectivity per month
Principals were asked to give the cost of internet connectivity in their schools, the
summary of the findings are in table 4.8
Table 4.8 Cost of internet connectivity per month
Cost of connectivity per
month (Kshs)
Frequency Percent Cumulative
percent
0 (No internet) 15 48.4 48.4
1000 2 6.5 54.8
3000 2 6.5 61.3
4000 3 9.7 71
4500 2 6.5 77.4
5000 5 16.1 93.5
6000 2 6.5 100
Total 31 100 100
Table 4.8 shows that school in Nyeri South District are spending a substantial
amount of their budgets on internet connectivity with most schools spending
about Kshs 5,000 per month
42
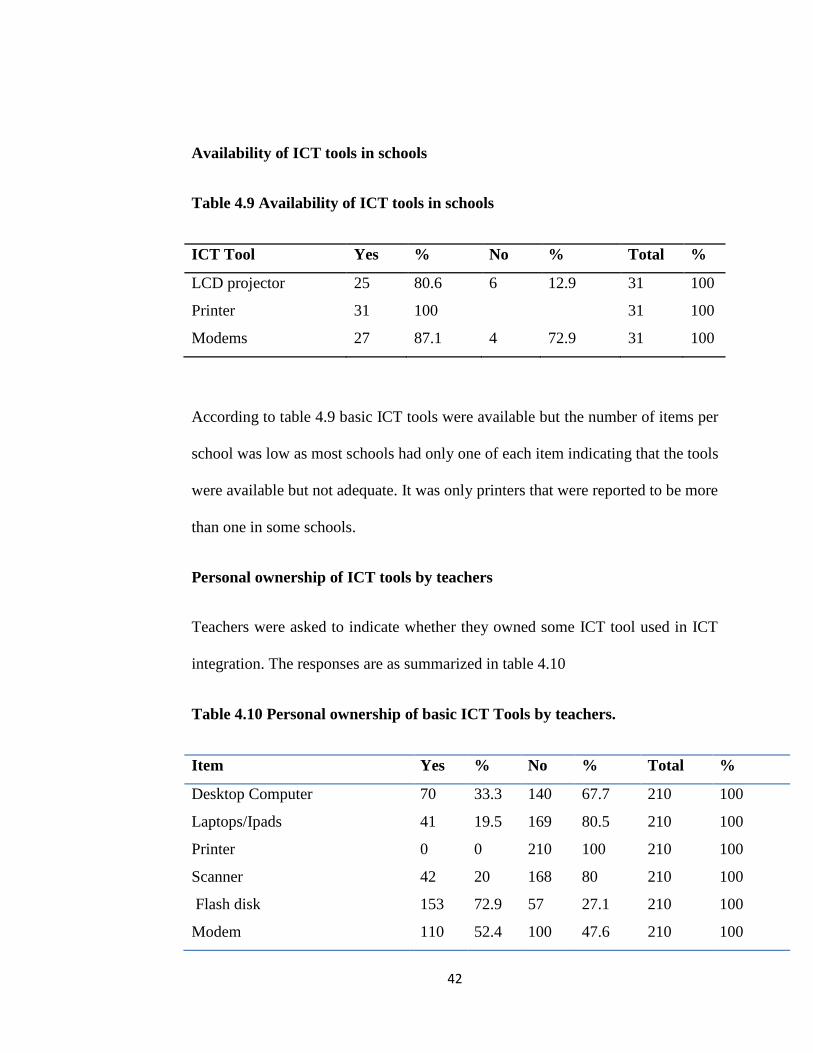
Availability of ICT tools in schools
Table 4.9 Availability of ICT tools in schools
ICT Tool Yes % No % Total %
LCD projector
Printer
Modems
25
31
27
80.6
100
87.1
6
4
12.9
72.9
31
31
31
100
100
100
According to table 4.9 basic ICT tools were available but the number of items per
school was low as most schools had only one of each item indicating that the tools
were available but not adequate. It was only printers that were reported to be more
than one in some schools.
Personal ownership of ICT tools by teachers
Teachers were asked to indicate whether they owned some ICT tool used in ICT
integration. The responses are as summarized in table 4.10
Table 4.10 Personal ownership of basic ICT Tools by teachers.
Item Yes % No % Total %
Desktop Computer
Laptops/Ipads
Printer
Scanner
Flash disk
Modem
70
41
0
42
153
110
33.3
19.5
0
20
72.9
52.4
140
169
210
168
57
100
67.7
80.5
100
80
27.1
47.6
210
210
210
210
210
210
100
100
100
100
100
100

43
Table 4.10 shows that teachers have in their possession varied ICT tools as
technology continues to permeate in the teaching and learning activities. The
distribution of personal ownership of basic ICT tools is varied but seems to be
influenced by cost whereby most items that are cheap are more prevalent for
instance flash disks72.9%, modems52.4% than those which are relatively
expensive laptops/Ipads19.5%, printers 0%.
4.4.2 Research Question 2:- What is the level of teachers and students
expertise in ICT Integration in teaching and learning process?
Principals, teachers and students were asked several questions on their expertise.
The questions and their responses were as follows
Principals level of ICT training
Principals were asked to indicate their level of ICT training and their responses
were as shown in table 4.11

44
Table 4.11 Principals level of ICT training
Level of training Frequency Percentage
No training 12 38.9
Proficiency 16 51.6
Diploma 3 9.7
Total 31 100
Table 4.11 shows that the majority of the principals 16 (51.6%) had proficiency
level of training (workshop, seminar, apprenticeship) only 3(9.7%) had higher
level training on ICT being holders of Diplomas in ICT. Twelve principals
(38.9%) have not received any form of training. Proper training on ICT is
essential for all principals as being leaders, they form key change agents. They
also influence individual school ICT policy and financing.

45
Teachers level of ICT Training
Teachers were asked to indicate their level of ICT training, their response is as
summarized in figure. 4.4.
Figure 4.4 Teachers level of ICT training
Training in ICT
Training in ICT
DiplomaNo TrainingProficiency
Pe
rce
nt
100
80
60
40
20
0
20
78
Figure 4.4 show that the majority of teachers 80.5% reported to have had some
ICT training. Most of them indicating that they had received proficiency training
of between 1 – 2 weeks

46
Table 4.12 Training of computers in TTC or University
Frequency Percent
Yes
No
Total
90
120
210
42.9
57.1
100
Teachers were further asked whether they had received any training on ICT in
Teacher’s Training College (TTC) or University as shown in tables 4.12. Majority
of the teachers 120 (57.1%) indicated they had not received such training.
Table 4.13 Integration of ICT during training in TTC or University
Frequency Percent
Yes
No
Neutral
Total
39
51
120 (Excluded)
210
43.3
56.6
-
100
Out of those who had received ICT training in the TTC/University they attended,
only 39 (43.3%) as shown in table 4.13 had received ICT integration related
training

47
Table 4.14 Relevance of training to teaching tasks
Frequency %
Relevant
Slightly relevant
Neutral
Total
10
29
171(Excluded)
210
25.6
74.4
-
100
When those who reported to have trained on ICT integration in the
TTC/Universities were further asked to rate their ICT integration training in terms
of equipping them with skills in their subjects like lesson planning, lesson
delivery and lesson presentation as shown in table 4.14. Most of the respondents
74.4% indicated it was slightly relevant while 25.6% indicated it was just
relevant. The findings of the study echoed those obtained by Kiptalam and
Rodrigues (2010) who found that majority of teachers did not receive any prior
ICT training during the formative years at the Teacher’s Training College or
university before joining the teaching profession. About 55% of teachers stated
that they did not receive any ICT training at all in TTC or University they
attended whereby 51% of this teachers had taken self-initiative to undergo ICT
training over the past three years they had been employed in the teaching
profession.

48
Table 4.15 Level of teacher ICT competency
Item V. Good % Good % Average % Weak % Poor % Total %
i. Connecting computer cables to electricity
and switching on and off a computer
ii. Operating with Word processor
iii. File management e.g. opening, renaming
or saving
iv. Information browsing and downloading
v. Email communication
vi. Networking/communicating with others
e.g twitter/Facebook
vii. Attaching files to email
viii. Printing hardcopy document
ix. Use of presentation application
x. Technology management eg.
Troubleshooting
xi. Operating using access and excel
180
82
11
111
82
56
97
111
69
56
84
85.7
39.0
5.2
52.9
39
26.7
46.2
52.9
32.9
26.7
40
15
101
33
57
72
72
44
57
58
14
14
7.1
48.1
15.7
27.1
34.3
34.3
21.0
27.1
27.6
6.7
6.7
15
14
87
29
30
29
28
29
40
84
99
7.1
6.7
41.4
13.8
14.0
13.8
13.3
13.8
19.0
40
47.1
13
13
27
15
13
30
43
13
6.2
6.2
12.9
7.1
6.2
14.3
20.5
6.2
13
26
26
13
13
6.2
12.4
12.4
6.2
6.2
210
210
210
210
210
210
210
210
210
210
210
100
100
100
100
100
100
100
100
100
100
100

49
Teachers level of ICT competency
To establish the level of teachers competency or confidence on some skills
relating to ICT integration in teaching ,teachers were asked to rate themselves on
a likert scale of very good ,good, average, and weak. Skills that were tested
included teacher’s ability to connect cables to a computer and switch the
computer on or off, operating with Word application which included typing skills
and composing document, file management which is a skill on maintaining digital
files so as to organize information to be stored, operating with internet including
skills on attaching files to emails, operating with access and excel application.
Excel application are useful in spreadsheet where statistical computation can be
done. This may be useful to a teacher during student examination analysis while
access application are useful in production of database and can be used to store
student details. Troubleshooting comprise skills on systematic search for source
of a problem so that it can be solved
The level of teacher’s ICT competency as shown in table 4.15 was analyzed in
terms of level of confidence expressed by teachers whereby those who rated
themselves as either good or very good in a given skill were regarded to have high
confidence or competency in that skills, while those rating themselves from
average to poor were regarded as having low confidence with their skills. Most
teachers expressed low confidence on file management 20.2%, troubleshooting
33.4% using excel and access47.1% while they had high competency or

50
confidence on skills to do with switching ON and OFF a computer 92.8% and in
using word application87.1% as well as browsing for internet80%.
Teachers ability to choose appropriate software applications
The teachers were give three questions to fill in whereby each required them to
choose a suitable computer application to perform the task.
Table 4.16 Teachers ability to choose appropriate software
Task Able % Not able % Total %
Ability to use graphical presentation
Ability to type exams
Ability to analyze results
36
120
23
17.1
57.1
11
174
90
187
82.1
42.9
89.0
210
210
210
100
100
100
Table 4.17 illustrates that greatest ability by teachers was demonstrated in typing
exams 120 (57.1%) This probably indicate that teachers could have had
experience on typing exams for their students but did not seen to have had much
experience for the other two abilities tested.

51
Table 4.17 Attitude of teachers towards ICT integration
Item SA % A % U % D % SD % TOTAL %
Negatively stated
i. Computers are difficult to
understand
ii. Anything a computer can do I
can just do as well
iii. Challenge of solving problem
using computer dose not appeal
to me
iv. ICT integration is best for some
subjects
v. Computers are for younger
generation
15
44
96
44
29
7.1
21
45.7
21
13.8
43
28
15
58
28
20.5
13.3
7.1
27.6
13.3
58
15
43
69
28
27.6
7.1
20.5
32.9
13.3
28
97
43
69
86
13.3
46.2
20.5
32.9
41.0
66
26
13
39
39
31.4
12.4
6.2
18.6
18.6
210
210
210
210
210
100
100
100
100
100
positively stated
vi. Computer can help to learn
thing easily
vii. Policy of ICT integration
should be encouraged
viii. All students/teachers should
have an opportunity to learn
ICT at schools
ix. ICT integration will improve
education standards
x. Computers will relieve teachers
routine duties
152
140
97
140
42
72.4
66.7
46.2
66.7
20
43
42
14
70
26
20.5
20
6.7
33.3
12.4
15
71
100
7.1
33.8
47.6
28
15
29
13.3
7.1
13.8
13
13
6.2
6.2
210
210
210
210
210
100
100
100
100
100

52
Attitude of teachers towards ICT integration
To determine the attitude of teachers towards ICT integration teachers were
asked to rate some statements provided in a likert scale of Strongly agree (SA)
agree (A) undecided (U) disagree (D) and strongly disagree (SD) from table 4.17
for the positively stated statements, majority of teachers responded as either
strongly Agree (SA) or Agree (A) while for those negatively stated statements
they responded as either Disagree (D) or Strongly Disagree (SD).
The opinion of the teachers was further sought regarding value of ICT integration
whereby teachers were asked to indicated in an open ended question the
importance computers have had in their class teaching. Most teachers indicated
that they found ICT to be useful as they had made revision easy through accessing
questions in digital format and that setting exams has been improved using
computer application together with the fact that internet research has improved
their lesson notes, language teachers also indicated benefit from computer
dictionary. In general, most teachers expressed positive attitudes and interests
towards ICT integration

53
Students level of ICT training
Students were asked if they had received any training in computers, their
responses was as shown in figure 4.5
Fig 4.5 Students level of ICT training
Figure 4.5 shows that the majority of the students had received ICT training 185
(58.4%). most students indicated that they had been taught computers in their
school by their computer teachers. This findings indicate that while some schools
had embraced technology, a significant number of schools 41.6% were yet to
prioritize training of their students on digital literacy.
41.6%
58.4%
No
Yes

54
Table 4. Table 4.18 Level of student`s competency in some ICT
tasks relating to learning
Item V. Good % Good % Average % Weak % Poor % Total %
i. Connecting computer cables to electricity
and switching on and off a computer
ii. Operating with Word processor
iii. Information browsing and downloading
iv. Email communication
v. Attaching files to email
vi. Use of spreadsheet to plot graphs
vii. Operating using access and excel
viii. Use of presentation application
ix. Networking/communicating with others
e.g twitter/Facebook
215
116
101
46
37
69
85
101
118
67.8
36.6
31.9
14.5
11.7
21.8
26.8
31.9
37.2
37
16
17
72
81
54
11.7
5.0
5.4
22.7
25.6
17.0
49
66
120
87
55
64
48
65
97
15.5
20.8
37.9
27.4
17.4
20.2
15.1
20.5
30.6
16
70
32
33
48
103
87
87
16
5.
0
22.1
10.1
10.4
15.1
32.5
27.4
27.4
5.0
49
47
79
96
81
97
64
32
15.5
14.8
24.9
30.3
25.6
30.6
20.2
10.1
317
317
317
317
317
317
317
317
317
100
100
100
100
100
100
100
100
100
18 Level of student`s competency in some ICT tasks relating to learning

55
Level of students competency in some ICT tasks relating to learning
To determine the competency or confidence of the learners on some ICT skills
students were asked to rate themselves on a likert scale of very good, good,
average, weak and poor. Skills tested included, skill on connecting cables to a
computer and switching the computer on or off, operating with word, skills on
internet use including browsing and downloading information, use of spreadsheets
and presentation application like PowerPoint demonstration as well as students
skills in networking or communicating with their colleague on facebook and
The level of student competency as shown on table 4.18 was analyzed in terms of
level of confidence expressed by students whereby those students who rated
themselves as either good or very good in a given skill were regarded to have high
confidence in that skill while those rating themselves as from average to poor
were regarded to have low competence hence low confidence in the performance
of such tasks.
Majority of the students demonstrated greater confidence on two operations
connecting computer cable to the electricity and switching ON and OFF a
computer 79.5% and networking e.g. Facebook and twitter 54.3%. In all the other
skills tested, Majority of students demonstrated low level of confidence or
competency whereby a majority of them rated themselves on a level between
average and poor.

56
This indicates that more need to be done in terms of improving the skills of the
student hence enhancing their confidence in application of the skills in their
learning activities.

57
Attitude of students towards ICT integration
Table 4.19 Attitude of students towards ICT Integration
Item SA % A % U % D % SD % TOTAL %
NEGATIVELY STATED
i. Computers are difficult to
understand
ii. Computer usage would promote
immorality
iii. Boys are better in computers than
girls
32
49
53
10.1
15.5
16.7
62
138
19.6
43.5
16
32
5.0
10.1
141
81
78
44.5
25.6
24.6
82
33
154
25.9
10.4
48.6
317
317
317
100
100
100
POSITIVELY STATED
iv. Computer can help to learn thing
easily
v. Computers and ICT should be used in
all subjects
vi. All students should have an
opportunity to learn computers
vii. The internet is as resourceful as
books
viii. ICT makes learning enjoyable
ix. ICT would assist in assisting in
understanding of abstract concepts
251
146
198
153
201
184
79.2
46.1
62.5
48.3
63.4
58
34
135
102
100
116
85
10.7
42.5
32.2
31.5
36.6
26.8
36
17
32
32
11.4
5.4
10.1
10.1
32
16
16
10.1
5
5
16
5
317
317
317
317
317
317
100
100
100
100
100
100

58
Attitude of students towards ICT integration
To determine the attitude of students towards ICT Integration, students were
provided with statements to rate them on likert scale of strongly agree (SA) agree
(A), undecided (U), disagree (D) and strongly disagree (SD) as shown in figure
4.19, whereby just like in the case of teachers, for the positively stated statements,
majority of students responded as either strongly agree (SA) or Agree (A) while
for those negatively stated statements they responded as either Disagree (D) or
Strongly disagree (SD). Student’s opinion was further sought regarding value of
ICT integration in their learning whereby students in an open ended questions
were asked to indicate how computers have influenced the way they learn and
what they learn. Most students indicated that use of computers and related
technology had made their learning enjoyable and that they were able to learn for
more hours without getting bored, they also indicated that computers and
especially the internet has enabled them get access to a lot of information. Others
indicated that they were able to access past papers for revision through web based
platforms. Generally, these indicate that students had high interest on ICT
integration.

59
4.4.3 Research Question 3: In which ways do teachers and students integrate
ICTs in teaching and learning process?
Principals, teachers and students were asked several questions on ways in which
ICT was being integrated in teaching and learning process and their responses
were as follows:
Possession of some ICT facilities by schools
Principals were asked to indicate if their schools possessed some listed basic ICT
facilities that support ICT integration and their responses were as summarized in
table 4.20
Table 4.20 possession of some ICT facilities by schools
Facility Yes % No % Total %
Timetabling software
Result analysis software
Availability of software on specific subjects
Availability of digital curriculum from KIE
School email
LAN
School website
14
21
7
8
22
11
7
45.2
67.7
22.6
25.8
71
35.5
22.6
17
10
24
23
9
20
24
54.8
32.3
77.4
74.6
29
64.5
77.4
31
31
31
31
31
31
31
100
100
100
100
100
100
100
The Findings as summarized by Table 4.20 indicated that only result analysis
software and external email address are possessed by a majority of the schools.

60
All the other facilities despite being essential are owned by a minority of the
schools
Availability of computer teachers in schools
Principals were asked to give the number of computer teachers in the school, their
response indicated that 19 (61.3%) school had each one computer teacher in their
school. Twelve school (38.7%) had no computer teacher. All principals in the
schools that reported to have a computer teacher indicated that the computer
teachers offered technical assistance to the other teachers on ICT integration.
However, when teachers were asked to rate technical assistance as a potential
challenge the majority 64.3% rated it as a major challenge suggesting that
something still need to be done to ensure that teachers are assured of technical
assistant as they endeavor to integrate ICT in their work.
Level of ICT usage in the schools
Principal were asked to generally rate on a likert scale of very high, fair, low and
very low their school’s level of ICT usage (e-learning) in teaching and learning
process by both teachers and students as opposed to the traditional methods of
talk, chalk, blackboard, text book and hand written notes. Table 4.21 shows the
summary of their responses

61
Table 4.21 Principal’s rating of ICT usage in their schools
Level of ICT
usage
Frequency Percent Cumulative
percent
Very high
Fair
Low
Very low
2
6
13
10
6.5
19.4
41.9
32.3
6.5
25.8
67.7
100.0
Total 31 100 100.0
Table 4.21 show that cumulatively 23 (74.5%) of the principals rated their
school’s level of ICT usage as between low and very low, further when both
principals and students in an open ended question were asked to indicate in
which groups of subjects ICT were being utilized in their schools, most indicated
that ICT were being generally utilized in all subject in examination analysis but
classroom application of ICT was more frequent in the teaching of sciences and
mathematics subjects than in any other subject.

62
Use of the internet by teachers in preparing learning materials
Figure 4.6 Teachers use of the internet in preparing learning materials.
As shown in figure 4.6 the majority of teachers 126 (60%) indicated that they did
not make use of the internet in preparing the teaching .
60.0%
40.0%
No
Yes

63
Figure 4.7 Sources of internet access by teachers
Out of those teachers that were using the internet as shown by figure 4.7 most of
them 33.8% indicated that they accessed the internet through their mobile phone
these indicated that mobile phones or smart phones have become useful tools to
access internet and download information by teachers, cyber café were least used
at 6.2% probably due to the fact that most cyber cafes are usually concentrated in
urban setups
Cyber Cafe At Home
Using Modem Via Mobile Phone
At School
Percent
40
30
20
10
0
6
13
26
34
21

64
Average hours per week that teachers make use of internet or computers in
teaching and learning.
Table 4.22 Average hours per week of Internet or computers use by teachers
As shown in table 4.22, when asked the number of average hours that they used
computers or the internet the majority of teachers, 185 (88.1%) indicated less than
5 hours per week while only 20 9.5% indicated a range between 11-20 hours per
week. This indicates that teachers in Nyeri South District spend most of their
teaching time using traditional method as opposed to technology enhanced
methods that would require computer or access to the internet
Hours Frequency % Cumulative %
Less than 5 185 88.1 88.1
5-10 20 9.5 97.6
11-20 5 2.4 100
Total 210 100 100

65
Table 4.23 Frequency of using ICT by teachers in some basic teaching roles
Task Always % Often
(once/twice a
week
% Sometimes
(once/twice a
month
% Never % Total %
i. Information search/ browsing for
lesson notes
ii. Preparing of schemes of work
iii. Preparation of records of work
iv. Preparation of lesson plan (lesson
planning)
v. Keeping students records
vi. Use of digitalized lesson notes
vii. Preparing class assignment or
exercise
viii. Preparing of typed exams (opener
and timely exams)
ix. Preparation and issuing of
handouts/ printouts as lesson
notes
x. Analysis of exams
xi. Lesson presentation using
projectors (in classroom)
xii. Lesson presentation using
projectors (in computer labs)
58
29
14
45
28
14
44
15
43
14
14
27.6
13.8
6.7
21.4
13.3
6.7
21.0
7.1
20.5
6.7
6.7
29
71
29
44
43
59
44
72
85
71
72
44
13.8
33.8
13.8
21.0
20.5
28.1
21.0
34.3
40.5
33.8
34.3
21.0
97
85
55
41
83
48
56
68
82
57
15
70
45.2
40.5
26.2
19.5
39.5
20.0
26.7
32.4
39.0
27.1
7.1
33.3
26
54
97
111
39
81
96
26
28
39
109
82
12.4
25.7
46.2
52.9
18.6
38.6
45.7
12.4
13.3
18.6
51.9
39.0
210
210
210
210
210
210
210
210
210
210
210
210
100
100
100
100
100
100
100
100
100
100
100
100

66
Frequency of using ICT by teachers in their basic operations relating to
teaching
To determine exactly how and the frequency or intensity with which teachers
make use of ICT in their work, the teachers were asked to rate their frequency of
using ICT on a likert scale of often, sometime and never against some teaching
related tasks. Some of the tasks included, sourcing for lesson notes, preparation of
scheme of works, keeping of students records, setting and analyzing of
examination and lesson delivery in class. Summary of their responses is shown in
table 4.23
As shown in table 4.23 most of teachers did not use ICT in performance of the
following tasks: Preparing records of work 46.2%, using digitized notes at 38.6%,
preparing class assignment at 45.7% and lesson presentation in class using
projectors 51.9%. The only activity that most teachers reported to had used ICT
either often or for sometimes in browsing internet for notes 46.2%, typing exams
34.3% ,preparing teaching handouts 85% and analyzing student exams 33.8%.The
findings acted as a confirmation of the data from principal’s observation that the
level of ICT integration in most teaching and learning activities were very low
compared to traditional methods.

67
Number of average hours of accessing computers during classes in a week
Table 4.24 Students’ average numbers of hours spend in accessing computers
during classes in a week
Number of computer access in hours Frequency Percent
No access
1 -2
2-5
5-7
Total
180
98
35
4
317
56.8
30.9
11.0
1.3
100
Data from table 4.24 indicate that the majority of the students had no access to
computers during classes 180 (56.8%) This reveals that something needs to be
done as it is an indication that schools are not tapping onto the learning
opportunities availed by both synchronous (online) and asynchronous (offline)
learning using computers.

68
Table 4.25 Frequency in use of various ICT facilities by students for the purpose of learning
Task Always % Often (once/twice
a week
% Sometimes
(once/twice a
month
% Never % Total %
i. Finding information via
internet through browsing
ii. Finding information from
e-library e.g. Encarta
iii. Communicating with
others students via
email/text messaging
iv. Chatting and networking
e.g. Facebook/twitter
v. Downloading music
vi. Playing games
vii. Use education software
which are subject specific
e.g. physics and
geography
viii. Watch VCD or DVD on
education issues
53
22
17
33
68
-
39
17
16.7
6.9
5.4
10.4
21.5
-
12.3
5.4
53
47
86
107
-
53
31
79
16.7
14.8
27.1
33.8
-
16.7
9.8
24.9
49
66
86
64
103
137
118
142
15.5
20.8
27.1
20.2
32.5
43.2
37.2
44.8
162
182
128
113
146
127
129
79
51.1
57.4
40.4
35.6
46.1
40.1
40.7
24.9
317
317
317
317
317
317
317
317
100
100
100
100
100
100
100
100

69
Frequency in use of various ICT facilities by students for the purpose of
learning
To determine exactly how and the frequency with which students make use of
ICT, students were asked to rate their frequency of using ICT on a likert scale of
often, sometimes and never against some tasks including, browsing internet for
information, use of e-library, chatting and networking with other students, playing
games and music for leisure and use of subject specific software. The student
responses were summarized in table 4.25
Table 4.25 indicates that most students sometimes watch VCD or DVD on
educational issues and play games while most have never done all the other
activities for learning purposes. This reveals that there is a very low level of ICT
utilization in regard to learning by the students
Students rating of their ICT integration
Students were asked to rate their ICT usage in their learning as a percentage,
against tradition methods their responses were as summarized in table 4.26

70
Table 4.26 Student general rating of themselves in terms of using ICT in
their learning compared to the traditional methods
Students ICT usage in % Frequency Percentage
0
1-4
5-24
25-49
50-70
Above 70
Total
17
32
87
133
15
33
317
5.4
10.1
27.4
42
4.7
10.4
100
From table 4.26, cumulatively a majority of students 84.9% indicate that they
utilize ICT at a percentage of between 0-49. Only a small number 33 (10.4%)
rated themselves at a score of beyond 70% level of ICT usage in their learning,
this clearly indicate that traditional methods of learning are more commonly used
by students in their learning process as opposed to e-learning
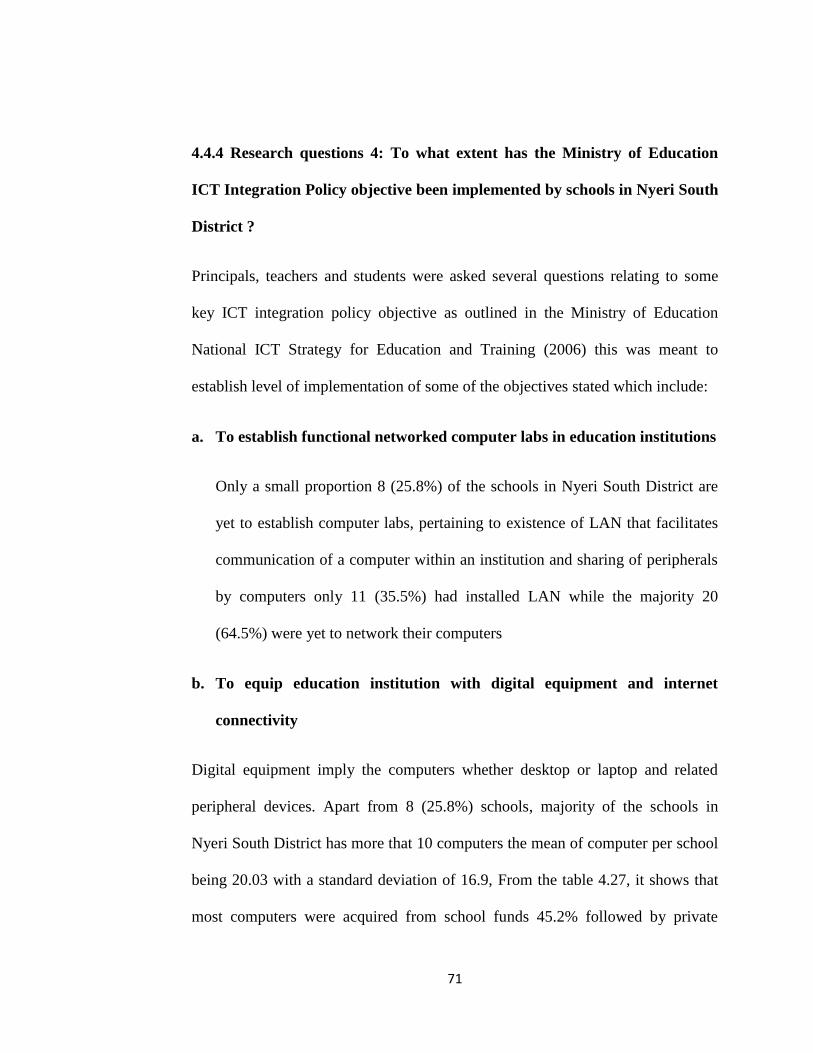
71
4.4.4 Research questions 4: To what extent has the Ministry of Education
ICT Integration Policy objective been implemented by schools in Nyeri South
District ?
Principals, teachers and students were asked several questions relating to some
key ICT integration policy objective as outlined in the Ministry of Education
National ICT Strategy for Education and Training (2006) this was meant to
establish level of implementation of some of the objectives stated which include:
a. To establish functional networked computer labs in education institutions
Only a small proportion 8 (25.8%) of the schools in Nyeri South District are
yet to establish computer labs, pertaining to existence of LAN that facilitates
communication of a computer within an institution and sharing of peripherals
by computers only 11 (35.5%) had installed LAN while the majority 20
(64.5%) were yet to network their computers
b. To equip education institution with digital equipment and internet
connectivity
Digital equipment imply the computers whether desktop or laptop and related
peripheral devices. Apart from 8 (25.8%) schools, majority of the schools in
Nyeri South District has more that 10 computers the mean of computer per school
being 20.03 with a standard deviation of 16.9, From the table 4.27, it shows that
most computers were acquired from school funds 45.2% followed by private

72
donors 25.8 and government donation is least at 9.7%. This underscores the role
of PTA and private donors in acquisition of computer and by extension the related
peripherals.
Table 4.27 Means by which schools acquired computers
Means of acquisition Frequency Percent Valid
percent
Cumulative
percent
School funds
Government donation
Private donors
All the above named sources
Total
14
3
8
6
31
45.2
9.7
25.8
19.4
100
45.2
9.7
25.8
19.4
100
3.2
12.9
51.6
100
30 (98.6%) of the schools had laptop computer each, other peripheral devices
like LCD projectors, printers and modems were also found to be available in
schools although the number was not adequate, 48.4% of the schools in Nyeri
South District are yet to be connected to the internet
c. To stimulate ICT integration in education in various regions
Integration of ICT in teaching and learning process in Nyeri South is still very
low as majority of the principals 74.2% rated their schools ICT usage as very low
and further most students rated their ICT at between 25 – 50%. Relating to

73
computer studies in secondary schools the findings obtained indicate that
computer studies was being offered in 16 (51.6%) of the schools and out of those
schools offered computer studies it was only 4 (12.9%) of the schools that the
subject was examinable at K.C.S.E. These findings were congruent with the
studies carried out on ICT integration including Ayere et al (2010) that indicate
that since 1999 when the government declared that all secondary schools should
introduce computer studies ,schools have been struggling to introduce computer
studies and that schools that are offering computer have limited the number of
students doing computer studies as they consider it a specialty or elective subject
whereas it is an essential or core subject just like mathematics and languages
d. To develop educational software to meet local education requirement
in teaching and learning
When asked to indicate whether they possessed some basic software only
14(45.2%) indicated they had time tabling software 21 (61.7%) had result analysis
software and software on specific subject were owned by only 7 (22.6%) while
digital curriculum from KIE was available in 8 (25.8%) of the schools. Many
teachers and principals indicated the need to avail more relevant educational
software and e-content for use in teaching and learning
e. To build basic ICT capacity in ICT for all stakeholders in education
80.5% of teachers, 58.4% of students and 61% of principals reported to have had
some ICT training, however, most teachers rated themselves between average and

74
poor on some essential integration skills like file management, using excel and
access application. Student only demonstrated greater confidence in switching on
and off a computer and in networking though use of Facebook and twitter but they
demonstrated low confidence in all the other skills tested. When asked on best
strategies to increase ICT integration in teaching and learning, both teachers and
principals under score the need for capacity building of teachers through in
service training, seminars, workshops and refresher courses for teachers who were
trained a long time ago.
f. To stipulate minimum hardware specifications adequate for education use
Specification for ICT equipment is important so as to ensure that schools acquire
the right equipments that can perform the required ICT functions as well as
ensure that schools do not become a dumping grounds for obsolete gadgets.
Principals were asked to indicate the model of computers in their schools. All the
principals indicated that their schools had Pentium 4 computers, Pentium 4
computers are of higher sophistication than Pentium 2 or 3. They also support
higher processor speed and storage capacity in a computer, there was however no
evidence of clear school policy on specification of computer or related peripherals
in the schools in Nyeri South District
g. To promote public and private sector investment in education subsector
There was evidence of private sector involvement in ICT investment in education
as 25.8% of schools in Nyeri South District reported to have received their

75
computer from non governmental organization NGOs, private companies and
from computer for schools Kenya (CFSK). When school principals were asked to
comment whether their schools had adequate funds to purchase ICT equipments
all the principals indicated that their schools had inadequate funds owing to the
fact that they had many other demanding needs, this under scores the need for
intensified private sector and government support to schools.

76
Challenges facing ICT integration in secondary schools
Table 4.28 Rating of various computer challenges by teachers
ICT related challenges Major % Minor % Not a
change
% Total %
i. Insufficient No of computers
ii. Inadequate/lack of skills in ICT
iii. Inadequate copies of software on specific
subject
iv. Insufficient teacher time
v. Inadequate technical assistance
vi. Slow speed of www
vii. Lack of administrative assistance
viii. Lack of adequate computer lab
ix. Lack of interest in teachers in ICT use
x. Lack of policy or proper strategy on ICT in
schools
xi. Technophobia
xii. Loss of data due to virus attack
141
100
156
142
114
121
72
72
111
98
85
126
67.1
47.6
74.3
67.6
54.3
57.6
34.3
34.3
52.9
46.7
40.5
60.0
56
82
40
68
55
49
112
42
84
54
97
28
26.7
39.0
19.0
32.4
26.2
23.3
53.3
20.0
40.0
25.7
46.2
13.3
13
28
14
41
40
26
96
15
58
28
56
6.2
13.3
6.7
19.5
19.0
12.4
45.7
7.1
27.6
13.3
26.7
210
210
210
210
210
210
210
210
210
210
210
210
100
100
100
100
100
100
100
100
100
100
100
100

77
Challenges facing the implementation of ICT integration in secondary
schools
To establish the challenges or barriers to ICT integration in Nyeri South District,
Teachers were asked to rate on a likert scale of major, minor or not a challenge a
number of potential challenges. Their responses were as summarized in table
4.28. Table 4.28 indicate that most teachers were of the opinion that lack of
adequate computer laboratory was not a challenge to ICT integration 45.7% while
technophobia(fear of working with computers) was a minor challenge to a small
majority 53.3%.All the other ten challenges listed were rated as major challenges
by most of the teachers. Teachers also added that the conservative nature of some
of them whereby most teachers are traditionally used to do telling than serious
enquiry was a potential inhibiting factor to ICT integration as well as the fact that
there is little pressure and rewards mechanisms in their schools to challenge the
status quo. Generally, the findings implied that despite the efforts expended
towards ICT integration policy by the government as well as individual schools,
obstacles to the implementation were still to a large extent in existence.

78
CHAPTER FIVE
SUMMARY OF RESEARCH FINDINGS, CONCLUSIONS AND
RECOMMENDATIONS
5.1 Introduction
This chapter presents summary of the study, research findings, conclusions drawn
and the recommendations for the study and suggestions for further research
5.2 Summary of the study
The purpose of the study was to find the extent of information communication
technologies integration in the teaching and learning process in secondary schools
in Nyeri South District. The objectives of the study were:- To determine the
extent of accessibility of computers to teachers and students , to determine the
level of teachers’ and students’ expertise in ICT integration , to determine the
ways in which ICT is integrated in teaching and learning process and to
determine the level of implementation of the Ministry of Education policy on
ICT integration . Literature reviewed on ICT integration laid the background for
the study. The main data collection method used was questionnaire administered
to teachers, principals and students in form 3 and form 4 . An observation
checklist was used as a confirmatory tool
The study employed descriptive survey design. 355 students, 245 teachers were
sampled for the study while all 34 principals in all the 34 secondary schools in

79
Nyeri South District, were purposively included for the study. Research
instruments were appraised by my supervisor to enhance validity. Test- retest
method was used to determine instrument reliability where two schools were
sampled .The coefficient of reliability of the instrument were 0.93,0.96 and 0.82
for the principals questionnaire ,teachers and students respectively the responses
from the questionnaires were included in the main study. Data collected from the
respondents was both quantitative and qualitative in nature. Quantitative data was
analyzed using descriptive statistics such as frequencies and percentage while
qualitative data for open ended questions was coded and transcribed per research
question item. The data was analyzed and summarized to identify the main
research finding and there after conclusions and recommendations were made
5.3 Summary of research findings
The summary of the research findings has been presented as per research
objectives in the study.
Extent of accessibility to computers and related peripherals
The study established that most schools in Nyeri South District were equipped to
some extent with computer and related peripherals as all schools were connected
to electricity and 54.8% of the schools had installed a standby generator, most of
the schools 74.2% had at least one computer laboratory and 54.8 % of the schools
had installed 20 or more computers accessible to students. The computer student
ratio (CSR) for secondary school in Nyeri South District stood at 22 students per

80
1 computer (22:1).The study also established that the average number of
computers per school was 20.03 with standard deviation of 16.91. In regard to
internet connectivity, 51.6% of schools were connected to the internet. Basic ICT
tools were widely available in most schools, including printers laptops, modems
and LCD projectors. In almost all schools apart from printers and modems the
school owned only one of each item.
Level of expertise in ICT integration
A majority of all the school community (teachers, students and principals)
reported to have received some ICT training. It was further established that most
teachers and principals had ICT literacy training of between 1-2 weeks duration
.however, when tested on their skills to operate with various applications most
teachers and students alike demonstrated low level of confidence in areas like
using access and excel, technology management and file management indicating
that there is still capacity building gaps that should be addressed.
Ways in which teachers and students integrate ICT in teaching and learning
process
The study revealed that 60% of teachers in Nyeri South District do not use the
internet or computers to prepare learning materials .Further, 88.1% of the
teachers who use computers or the internet spend less than 5 hours per week in
using the internet or computer for teaching and learning purpose. This indicates
that most teachers spend most of their time using tradition methods like text

81
books, chalkboards, and handwritten notes as opposed to technology enhanced
methods.
The majority of the students had no access to computers during their learning
while most of those accessing the computers for learning purposes spend less than
2 hours per week. This clearly indicates that schools in Nyeri South District are
yet to fully tap on the vast opportunities for learning using ICT. On regards to
intensity or frequency in which teachers made use of ICT in performing basic
teaching and learning roles, it emerged that the majority of teachers had never
used ICT in performance of the following task;. Preparing records of work ,using
digitalized notes and lessons presentation in class using projectors for the
students, most indicated to have used ICT for sometimes in playing games 43.2%
and for watching DVD and VCD on educational issues but most had never used
ICT for finding information via internet, communication or networking with them
or using specific subject software for learning purposes.
Indeed when asked to rate themselves in terms of utilizing ICT in their learning
vis a vis traditional methods of text books and handwritten notes, cumulatively
84.9% rated themselves at a percentage of below 50% implying that most
students felt they were more traditional users of learning methods than technology
users.

82
Level of implementation of ICT integration policy
Most ICT integration objectives have only been implemented partially. The main
objective of the policy was to increase ICT integration in teaching and learning
which is still very low in the District. The implementation of ICT integration in
education is faced by various challenges including inadequate relevant e-content,
insufficient teachers time, insufficient number of computers and lack of internet
connection. These challenges need to be addressed.
5.4 Conclusion
From the research findings it is clear that schools in Nyeri South District had
installed computers and related peripherals. However they were not adequate for
full ICT integration in the teaching and learning process due to the fact that in
most schools some ICT equipments were very few for instance desktop and
laptops computers and LCD projectors. The majority of teachers and students
alike reported to have had some form of ICT training however, they demonstrated
low level of confidence in performance of several skills. Generally there is low
extent of ICT integration by both teachers and students and the implementation of
ICT integration policy was hampered by various challenges that need to be
addressed.
5.5 Recommendations of the study
The following are the recommendations of the study:-

83
a. School authorities need to create more facilitation for more ICT
integration not only in the school but also in the classrooms including
ensuring that all the classes have appropriate infrastructure like sockets for
ICT equipments as well as replacing blackboards with whiteboard or smart
boards so as to reduce dusty classrooms and improver projection of the
work from the computer
b. Teacher’s training colleges and universities should not only incorporate
and strengthen ICT integration training in their teacher education
programs but should also ensure that such training are based on equipping
the student teachers with skills on actual integration of ICT in their
respective disciplines.
c. Head teachers, policy makers and other education stakeholders in Nyeri
South District should develop strategies concerning increasing the use of
ICT in teaching and learning through addressing the various challenges
identified that are inhibiting full implementation of ICT integration
d. There is still need for more intensified government as well as private
sector support to secondary school towards acquisition of and
maintenance of ICT equipments and facilities especially multimedia
computers and broadband internet,
e. There is also need for a curricula that is not reliant on text book and
course coverage but one that allow room for deep enquiry which is

84
supported by ICT as well as need to avail more relevant digital content for
use in secondary schools
5.5 Suggestion for further research
The following are the suggestions for further research:
a) Similar study should be done in other regions for comparison
purposes and in particular enable a clear assessment of e-readiness
of secondary schools in Kenya
b) Further research be undertaken on new pedagogical models that
involve technology use and the conditions under which teachers
and students are motivated to adopt technology in teaching and
learning.
c) Evidence based study is necessary to establish the real impact of
ICT integration in education especially in relation to improvement
in learning and performance in education.
110

85
REFERENCES
Aydin C. and Tasci D (2005) measuring readiness for e-learning; Reflections
from emerging country [electronic version] education Technology and Society
vol. 8 pp 224-257
Ayere A, Odera and Agak J. 2010 E-learning in secondary schools in Kenya: a
case of NEPAD E-Schools. Education Research and Reviews Vol 5 (pp 216-223)
http//www.academicjournals.org/errrs
Allen M.W (2003) Guide to e-learning; Building interactive, fun and effective
learning for any company John Wiley and Sons, New Jersey.
Best and Kahn (2005) Research in Education University of Illinois, Chicago.
Blurton C (1999) New directions in Education World communication and
information 1999-2000 Paris UNESCO
Borg W.R and Gall M.P (1989) Educational Research and Introduction (5th
Edition) Newyork Longman
Brassford F.D. Brown Al and cooking Eds (1999) How people learn: Brain mind
experience and school: committee and development in science of learning
National Research Council, National Academic press.
Cuban (2001) Oversold and under used computers in the classroom
London,Havard University Press.

86
Duplessis A. (2010). Teachers perception about their own and their school
readiness for computer implementation: South Africa Case Study, Turkish Online
Journal of Education TOJET Technology Vol 11 issue 3
Edwards , P, Roberts, I Clark M Diguisepp, Prataps Wentz and Kwan (2002)
Increasing response rate to postal questionnaires; a systematic review, British
Medical Journal 324, 1183-1185
Fagerlind A and Saha L.J (1997) Evaluation And National Development New
Delhi Educational and Professional Publishers Ltd.
GoK (2006) National information and Communication Technology (ICT) Strategy
for education and training. Government Printers , Nairobi.
Hash (2008) Software for local need. www.whiteafrican.com local software for
local/need.html –
Hodkison W,C 2006 Revisiting the concept of ICT as ‘tool’: Exploring of
epistemological and ontological underpinnings of a conceptual framework paper
for ITFORUM 13-17 arch (2006) http://itcoeuga.rdu/paper88/hodikison-
williams2006 pdf
Irura (2008) Diffusion of Communication Technologies (ICTs) in the education
sector in Kenya;A case study of secondary schools in Nairobi province.
Unpublished PhD thesis Moi University.

87
ITU (2001) Country case studies – Indonesia http://www/itu.int/itu-
d/ict/cs/Indonesia/index
Jhurree V. (2005) Technology Integration in Education in Developing Coutries:
Guidline to policy makers. International Educational Journal 2005 Mauritius, 6(4),
467-483 ISSN 1443-1475 Shania Research Press http://iej.cjb.net
Kashorda M (2007) Emerging Trends in Information and Communication
Education in Kenyan Universities. Strathmore university press, Nairobi.
Kiptalam G. K, Rodrigues A.J(2010) Internet utilization, a case of connected rural
and urban secondary schools in Kenya, international journal of computing and
ICT, Research Vol. 4 No. 1 PP49-63, http://www.jer/org/vol4-number//article6pdf
Kombo and Tromp (2006) Proposal and thesis writing Don Bosco Printing Press
Makuyu Kenya
Kozma R.B,Kozma (2005) National policies that connect ICT-based education
reform to economic and social development.Human technology. Vol No 2 PP117-
156
Retrieved from http;//www.human technology.jfufi/archives/abstract/kozma
05.html.
Ministry of Education Science and Technology (2005) Kenya Education Sector
Support Programme. (2005-2010) Government printer, Nairobi (9th
May 2005
Draft)

88
Muchiri K.A 2008 The use of ICT in enhancing teaching and learning in public
primary teacher training colleges in Kenya MED project submitted at University
of Nairobi
Mugenda O.M and Mugenda A.G (1999) Research methods: Quantitative and
Qualitative approaches: Nairobi Acts Press
Mugenda O.M and Mugenda A.G (2003) Research methods: Quantitative and
Qualitative approaches: Nairobi Acts Press
Muriithi P. (2005) A framework for integrating ICT in Teaching and learning
process in Secondary Schools in Kenya. Master of Science thesis submitted at
University of Nairobi school of Computing and informatics.
National ICT Policy (2006) Ministry of Information and Communication
http://www.information.go.ke/docs/ict%20policy pdf
Ndiku L (2003) The problems encountered by Schools and personnel in the
implementation of Computeruse in secondary schools in Uasin Gishu district
unpublished Med thesis Nairobi University.
Ogula P.A (1998) A Handbook on Educational Research,Nairobi – New Kemit
Teeche Educational Series.
Pascopella A (2001) laptop or text book District Administrator 37(11) 54-56

89
Pelgram and Law (2003) ICT in education around the world: treds problems and
prospect (UNESCO-IIEP, Paris)
Russel G. Finger G. & Russel in (2000) information technology skills of Australia
Teachers;Implication for Teacher Education Journal of information
Technologyfor Teacher Education,9(2) 149-166.-
SAIDE (2003)The use of computers in schools:Report on research into use of
computers for teaching and learning in 21 schools in South Africa.
Johannesburg//196.35.72.162/saide/us/B4A3e7 D95D5A/pdf
School Net (2012) European schoolnet survey, benchmarking access, use and
altitude to technology in European school www.europenschoolnet.eun.org
School Net Africa (2003) Prepairing a workforce for the evolving information
Economy;A survey on ICT access and use in Kenyan Secondary Schools. A
research report by school net Africa (SNA Kenya)
Schultz T.W (1971) Investiment in Human capital. New York The free press
Specialist Schools and Academies trust 2006 Strength of Goibei Girls High
School Retrived from http:/www.ictregister.net/schooldetail.phpid=518
Srivastava L. (2002) ICTs for Education and Building Human Capital: Visions of
the information society. Retrieved from http://www/itu.int/vision
Tracy L (1995) The Internet Companion. Newyork. Addison Wesley

90
UNESCO (2002) Information and Communication Technologies in teachers
Education: A planning guide http://www.unesco.org
UNESCO (2005) from the information society to knowledge society Paris France
UNESCO Publishing
UNESCO (2008) Educational Policy and reforms Retrieved:
http://www.Unesco.org/new/en/education/themes/planning/reforms.
Wikimedia Kenya (2012) Nyeri pilot project Report .Retrieved from
http;//Wikimedia.or.ke/Nyeri Report.
Wims & Lawler M (2007) Investing in Educational Institutions in developing
countries: an evaluation of their impact in Kenya .University college of Dublin:
Ireland

91
APPENDICES
APPENDIX I
TRANSMITTAL LETTER
Gatama S. Njenga
University of Nairobi,
Department of Educational
Administration and Planning
P.O. Box 30197 Nairobi.
Date: ………………….
Dear respondent,
REF: REQUEST TO FILL THE QUESTIONNAIRE FOR EDUCATIONAL
RESEARCH PURPOSE
I am a post graduate student at University of Nairobi pursuing a Master of
Education Course. Currently am carrying out a research on ;
EXTENT OF INFORMATION COMMUNICATION TECHNOLOGY
INTEGRATION IN TEACHING AND LEARNING PROCESS IN
SECONDARY SCHOOLS IN NYERI SOUTH DISTRICT
It is my request that you will respond honestly to all the items in the
questionnaires attached .
I look forward to your cooperation.
Thank you very much for your assistance.
Yours sincerely,
Gatama S. Njenga

92
APPENDIX II
QUESTIONNAIRE FOR TEACHERS
Section A: demographic information
1. Indicate your Gender Male [ ] Female [ ]
2. Indicate your age
Below 25 years [ ] 25-30 [ ] 31-40 [ ]
41-50 [ ] 51-60 [ ] Above 60 [ ]
3. Which are your teaching subjects
………………….,……………………………
4. Have you received any training in computer Yes [ ] No [ ]
(a) If yes describe your level of computer literacy
Level of ICT Qualification
Title of
training
received
Name of
institution
duration
1 Proficiency e.g. seminar ,
apprenticeship, workshop
2 Certificate e.g. KNEC, ICDL or
Equivalent
3 Diploma
4 Degree
5 Any other
(specify)………………….
(b) Did your training above include ICT integration in teaching your subject
areas or how to incorporate ICT tools in the teaching context?
……………………

93
5. Did you receive any ICT training from the TTC or University you studied?
Yes [ ] No [ ]
(a) If yes did the ICT training cover integration of ICT in teaching specific
subject area? Yes [ ] No [ ]
6. How relevant can you rate the training in terms of equipping you with skills
on lesson planning, lesson delivery and preparation using ICT tools?
Very relevant [ ] Relevant [ ] Slightly relevant [ ] Not Relevant [
]
7. How can you rate yourself against the following computer operations
Level of ICT Competency V. Good Good Average Weak Poor
Connecting computer cables to electricity
and switching ON or OFF a computer
Operating with Word processor
File management e.g opening, renaming
or saving
Information browsing and downloading
Email communication
Networking/communicating with others
e.g twitter and facebook
Attaching files to email
Printing hard copy documents from a
computer
Use of presentation software e.g
PowerPoint
Technology management e.g.
troubleshooting (fixing basic faults)
Operation using Access and Excel
packages

94
Section B: ICT Access, Usage and Attitude Factors
8. Which amongst the following software application can you appropriately
choose to perform the task described below? (Ms Access, Ms Excel, Ms
Word, Ms PowerPoint)
i. Classroom graphical presentation in form of slides…..................................
ii. Typing your examinations……………………………
iii. Analyzing results in your subjects (mean, totals, grades, graphs
etc)………….
10. Indicate using a tick (√) if you have the following
Email address [ ] Facebook account [ ]
Twitter handle account [ ] Skype account [ ]
11. Indicate if you own the following
a) Laptop, I pad Yes [ ] No [ ] d) Flash disc Yes [ ] No [ ]
b) Desktop computerYes [ ] No [ ] e) Scanner Yes [ ] No [ ]
c) Printer Yes [ ] No [ ] f) Modem Yes [ ] No [ ]
12 Do you use the internet to prepare teaching and learning materials? Yes [ ] No
[ ]
Where do you mainly access the internet?(check using (√) where appropriate
At school [ ] Via mobile phone [ ] Using a Modem [ ] At home [ ]
Cyber café [ ] Any other form indicate………………………
13. On average how many hours per week do you use computers/internet on
teaching
and learning related tasks ……………………………………………..………….
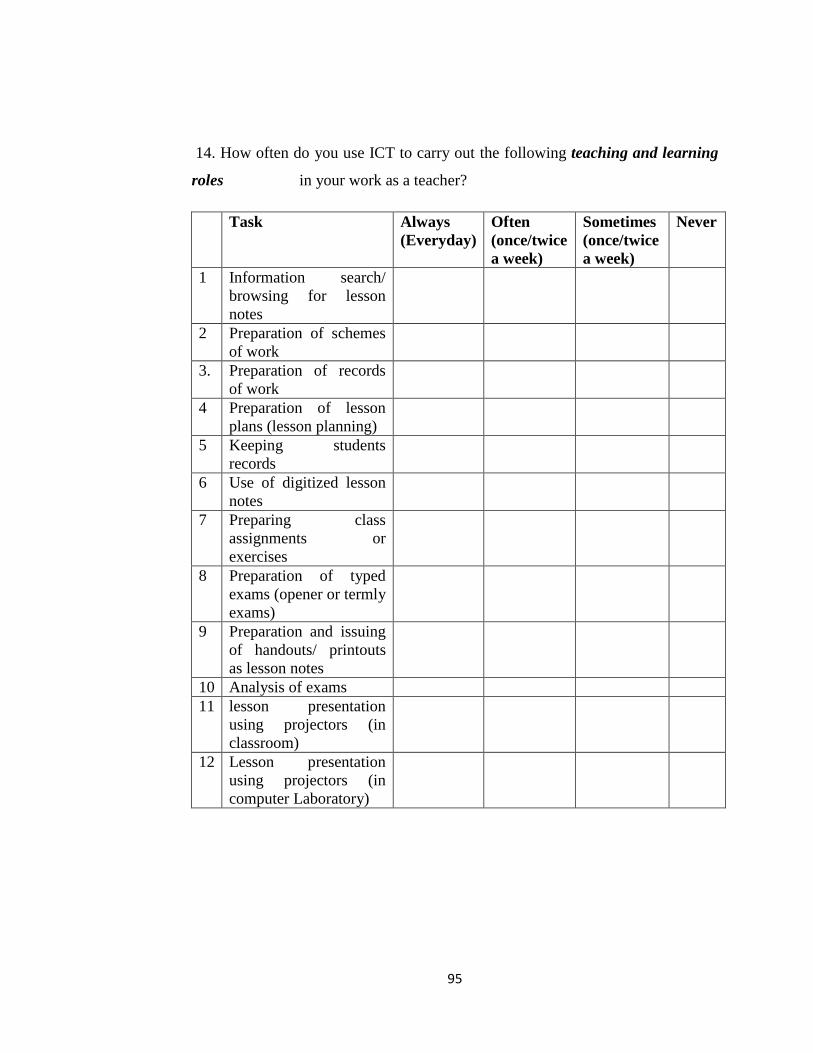
95
14. How often do you use ICT to carry out the following teaching and learning
roles in your work as a teacher?
Task Always
(Everyday)
Often
(once/twice
a week)
Sometimes
(once/twice
a week)
Never
1 Information search/
browsing for lesson
notes
2 Preparation of schemes
of work
3. Preparation of records
of work
4 Preparation of lesson
plans (lesson planning)
5 Keeping students
records
6 Use of digitized lesson
notes
7 Preparing class
assignments or
exercises
8 Preparation of typed
exams (opener or termly
exams)
9 Preparation and issuing
of handouts/ printouts
as lesson notes
10 Analysis of exams
11 lesson presentation
using projectors (in
classroom)
12 Lesson presentation
using projectors (in
computer Laboratory)

96
15. What is your frequency of usage of the following ICT resources as a teaching
and learning tool?
Task Always
(Everyday)
Often
(once/twice
a week)
Sometimes
(once/twice
a week)
Never
1 Software use in specific
subject area
2 Use of social network to
collaborate with others
e.g. colleague teacher
(facebook, twitter)
4 Use of VCD or CD Rom
for educational purpose
e.g KIE Digital
Curriculum
5 Use of/ allowing student
access to TV program
for educational purpose
6 Use of radio for
educational purpose e.g.
KIE media tapes
8 Use of email for
educational purposes
16. Describe any importance computers have had in your in class teaching (how
you teach, what you teach) …………………………………………………….
17. How can you rate the following potential challenges on ICT implementation
policy in your school
ICT related Challenges A major
challenge
A minor
challenge
Not a
challenge
Insufficient no. of computers
Inadequate lack of skills on ICTs
Not enough copies of software for
specific subject
Insufficient teacher time
Lack of/ inadequate technical assistance
Slow speed of www
Lack of administrative assistance
Lack of adequate computer lab
Lack of interest in teachers on ICT use

97
lack of policy or proper strategy on ICT
usage in schools by ministry
Technophobia (fear to encounter ICT
challenges before students)
Loss of data e.g. due to Virus attack
18. Indicate any other challenges relating to ICT integration in your
school………..
19. In the table below indicate your level of agreement or disagreement by
ticking(√)
against; Strongly Agree (SA), Disagree(D), Agree(A), Strongly
Disagree(SD)
and Undecided (U)
SA A U D SD
1. Computers can help to learn things easily
2. Computers are difficult to understand
3. Knowing how to use computers will help me do
well in my career
4. The policy of ICT integration in teaching and
learning all subject should be encouraged
5. All students and teachers should have an
opportunity to learn about computers at school
6. Anything that a computer can be able to do I can
just do as well
7. ICT integration will improve education standards
8. The challenge of solving problem with
computers does not appeal to me
9. ICT integration is best suited for some subjects
like sciences and not all subjects like humanities
10. Computers will relieve teachers of routine duties
11. Computers are for the younger generation
12. Male teachers are better than female teacher in
computers
20. In which ways do you think ICT integration in teaching and learning can be
improved in regard to;
i. Access of student and teachers to computers and other ICT………………….

98
ii. Teacher ICT skills and training………………………
iii. ICT usage in classroom teaching in specific subjects………………………….
***THANK YOU VERY MUCH***

99
APPENDIX III
QUESTIONNAIRE FOR LEARNERS/ STUDENTS
SECTION A: demographic information
1. Indicate your gender Male [ ] Female [ ]
2. Indicate your age below 13 [ ] 14-16 [ ] 17-20 [ ]
3. Indicate your form III [ ] IV [ ]
4. Have you received any training on computer use? Yes [ ] No [ ]
a. If yes, who taught you about computers?.............................................
SECTION B: ICT Access, usage and attitude factors
5. How well can you do each of these tasks using a computer?
Task V. Good Good Average Weak Poor
Connecting computer cables to electricity
and switching ON or OFF a computer
Operating with Word processor
Information browsing and downloading
Email communication
Attach files to e-mail address
Use spreadsheet to plot gaps
Operation with Ms Access and Ms Excel
Use presentation software e.g.
PowerPoint
Networking / communicating with other
students or friend e.g. facebook & twitter
6. Are you able to access computer during classes? Yes [ ] No [ ]

100
7. How often do you make use of the following ICT facilities?
Always Often Sometimes Never
1 Finding information via
internet through browsing
2 Finding information from e-
library e.g. Encarta
3. Communication with other
student via email /text
messaging
4 Chatting and networking e.g.
facebook and twitter
5 Downloading music
6 Playing games
7 Use education software which
are subject specific e.g.
physics, geography
8 Watch VCD or DVD on
education issues
16 Other usage (Specify)……..
8. List the subjects that you are taught in your school using computers and
related ICTs e.g. LCD Projectors?
Subject How/ areas it is taught using
computers and related ICT
Frequency
Always Sometimes Rarely
9. Do you look for information on the internet?
Yes [ ] No [ ]
10. How many hours per week do you use computer/internet in learning
a) When schools are in session…………………..

101
b) During holidays…………………………
11. Indicate using a tick (√) if you have the following:
E-mail address [ ] Facebook name [ ]
Twitter handle account [ ] Skype name [ ]
12. In which specific ways do you make use of the computers and related ICTs for
learning purposes? Describe
………………………………………………………
13. Describe how computers have influenced your learning (how you learn and
what you
learn)?………………………………………………………………………
14. How can you generally rate yourself in terms of ICT usage in the learning
process against the traditional learning methods (notes and textbooks)?
0 % [ ] 1-4 [ ] 5-24 [ ] 25-49[ ] 50-70 [ ] above 70[ ]
Tick (√) as appropriate in the table below
SA A U D SD
1. Computers can help to learn things easily
2. Computers are difficult to understand
3. Computers and related ICT should be used in
learning of all subjects
4. All students should have opportunities to learn
about computers in school
5 Computer usage would promote immorality in
schools
6 The internet is as resourceful as books can be
7 ICTs can make learning enjoyable
8 ICTs would assist in understanding of abstract
concept e.g. sciences
9. Boys are better in computers than girls

102
APPENDIX IV
QUESTIONNAIRE FOR THE PRINCIPAL
Section a: demographic information
1. Please indicate your gender Male [ ] Female [ ]
2. Indicate your experience as a secondary school principal in the whole of your
teaching career in years ……………………………………………..
3. Are you trained in ICT? Yes [ ] No [ ]
(a) If yes, describe your level of computer literacy
Level of ICT Qualification Title of training
received
Name of
institution
Duration of
training
Proficiency level e.g. workshop,
seminar, apprenticeship
Certificate e.g KNEC, or
equivalent
Diploma
Degree
Any Other (specify)……………
4. How many teachers are in your school?.............................
5. How many students are in your school?..............................
Section B: ict Access, Usage and Attitude Factors
6. Is the school connected to electricity? YES [ ] NO [ ]
7. If YES above, How can you rate power outage (loss of power) in your school
against;
Always [ ] Often [ ]
Sometimes [ ] Never [ ]

103
8. Does your school have back-up power supply e.g a generator Yes [ ] No [ ]
9. Does the school have a computer lab Yes [ ] No [ ] How many
computer labs are there? One [ ] Two [ ] More than two
(indicate)…….
10. How many desktop computers (PCs) are there in the
school?...................................
11. What is the model (Pentium) of the PCs named in the question above? (if all
are not of the same model indicate the quantity against each model)
P1 [ ] P2 [ ] P3 [ ] P4 [ ]
12. How were the computers in the school acquired? Tick using (√) and give the
number
Means of acquisition Number of computers
1. From school funds (PTA, school fees) [ ]
2. Government donations (MoE, ESP) [ ]
3. From private donations (NGOs, Companies, CFSK) [ ]
4. Any other means ( Indicate) ………………………..
13. How many computers are accessible to: a) Students……….b)
Teachers……….
14. Is the school connected to the internet Yes [ ] No [ ]
a. If yes, give the type of connectivity VSAT[ ] Dial up[ ] Wireless[ ]
b. Who is your ISP provider …………………………………………
c. What is the estimate average cost of internet connectivity per month? ……
d. How many computers are connected to the internet? .......................

104
15. Is computer studies offered in your school? Yes [ ] No [ ]
a. If yes, how many students are doing computers?
16. Do you have a policy of computer literacy for all students? Yes [ ] No [
]
17. In which ways have you improved access for teachers to ICT tools or
encouraged the use of ICT in your
school?……………………………………………
18. Do you have a policy or a strategy to ensure ICT integration in your school in
all the subjects? (Specify vision and policy) …………………………………..
19. Indicate whether the following ICT tools are available in your school and give
the quantity; Tick if available then indicate quantity
Tool quantity Tool Quantity
Laptop [ ] [ ] LCD projector [ ] [ ]
Modems [ ] [ ] Printer (specify) [ ] [ ]
20. In which group of subjects are ICT utilized in your school and in which ways?
Specify in which area
Maths ……………………………………………………………………
Languages ……………………………………………………………………
Humanities ……………………………………………………………………
Applied ……………………………………………………………………
Computers
studies………………………………………………………………..
Sciences ……………………………………………………………………

105
21. Do you have the following?
1. Timetabler software Yes [ ] No [ ]
2. Results Analysis software Yes [ ] No [ ]
3. School Website Yes [ ] No [ ]
4. School email Yes [ ] No [ ]
5. Software on specific subjects (specify)……………………
6. Digitized curriculum e.g. from KIE (specify) ………………….
22. Are the computers in your school networked under the following?
(LAN) -Intra school Yes [ ] No [ ]
23. Does your school have a computer teacher? Yes [ ] No [ ]
If yes how many computer teachers or coordinators are there in your school?
One [ ] Two [ ] More than two (indicate) …………..
24. How can you generally rate the level of ICT usage in teaching and learning
activities in your school vis-a-vis the traditional methods (talk, chalk,
textbooks)
Very High [ ] Fair [ ] Low [ ] Very low [ ]
25. Do you think secondary schools have adequate funding to purchase ICT
equipment Yes [ ] No [ ] give seasons for your answer ……………
26. In which ways do you think ICT usage in teaching and learning can be
improved……………….

106
27. What can you comment about the cost and maintenance of computers and
related ICTs and the adequacy of financing sources in your school.
………………………………………………………………………………….
28. What future plans do you have for ICT implementation in your school?
………………………………………………………………………….
*****THANK YOU****

107
APPENDIX V
Observation Schedule
Observation task What to observe Remarks
1. Check if electricity is installed Switches, wiring
2. Check if internet is connected Routers, internet mast,
telephone lines
3. Check existence of computer laboratory
a) confirm if building is specially made/
improvised
b) confirm if furniture is specially made
/improvised
c) get the number of the following:
i) Computers in the lab
ii) LCD projector
iii) Any other ICT tool
d) Confirm the computer specification
Get to physical location
Inside observation
Inside observation
Physical count
Physical count
Physical count
From one of the computers in
the lab switched ON
4. Check school policy and future Plan on ICT
integration
ICT Policy and strategy on the
school strategic plan
5. Check if computer lab is used in the learning of
other subjects other than computer studies
Computer lab
bookings/scheduling
6. Check if computer studies is offered as a
subject
From school master timetable
7. Check if timetabler software is used If master time table is manual
or computer print out
8. Check if student analysis software is used
Check one of the internal
student performance analysis if
manual or computer print-out
9. Check if teachers use ICT in teaching activities
and related roles.
Handouts, lesson notes in
digital format, schemes of
work, typed exams, printed
lesson plan

108
Appendix VI
RESEARCH AU THORIZATION PERMIT

109
APPENDIX VII
SECONDARY SCHOOLS IN NYERI SOUTH DISTRICT
CHINGA WARD KARIMA WARD
1. CHINGA BOYS 1. GATUGI GIRLS SEC
2. CHINGA GIRLS 2. GATUGI MIXED SEC
3. GATHERA SEC 3. IRINDI SEC
4. KARIKO SEC 4. KAGUMO MIXED SEC
5. KIAGUTHU SEC. 5. KARIMA BOYS
6. KIAMUYA SEC 6. OTHAYA BOYS
7. MUCHARAGE SEC 7. WITIMA SEC
8. MUIRUNGI SEC
9. MUMBUINI SEC
10. ST.MARY KARUTHI SEC
IRIA-INI WARD MAHIGA WARD
1. GATHUMBI SEC 1. BIRITHIA SEC
2. GITUNDU SEC 2. GAKUYU MAHIGA SEC
3. IHURIRIO SEC 3. GITUGI SEC
4. KAIRUTHI SEC 4. KAGONYE SEC
5. KIAHAGU SEC 5. KENYATTA BOYS
6. KIHURI SEC 6. KIHOME SEC
7. MARIA GORETI (RURUGUTI) GIRLS 7. MAHIGA GIRLS
8. OTHAYA BOYS 8. MUNYANGE SEC
9. THUNGURI (IRIA-INI) GIRLS

110
APPENDIX VIII
MAP OF NYERI SOUTH DISTRICT