Embed Size (px)
Citation preview

238
CHAPTER NO. VII- CO-OPERATIVE MOVEMENT IN
AHMEDNAGAR
7.1- INTRODUCTION- According to the 2001 census, 742 million out of the total
population of 1027 million lived in rural areas, across six lack villages. India is a nation
wherein more than 72% of Indians living in rural areas are basically poor and they are
suffers from scarcity of safe drinking water and sanitary facilities and children from
malnutrition.1 By way of the uplift of vast proportion of rural population; the objective of
complete development of the country cannot be achieved. In fact, the real growth of
Indian economy lies in the setting free of rural masses from acute poverty, unemployment
and socio-economic backwardness. To implement poverty alleviation and health
programmes successfully, the co-operatives have to play a major role with the help of
government to encourage employment, enterprises and local business. Co-operative
movement has been recognized as an effective instrument for sustainable development of
the rural economy. The need of the hour is to implement creative solutions for ushering in
a revolution that can push forward these villages and make them economically viable
units to serve as an engine of growth. This is even more necessary for a rapid
development of the rural economy to have innovative solutions. Significantly, rural India
needs various facilities such as crediting, processing, marketing, warehousing,
infrastructure facilities (irrigation, electricity, roads, communication, etc.) technology etc.
Role of the co-operative movement in sustaining rural economy in the context of
economic reforms certain changing indicators which are dynamic have to be considered.
The impact of the co-operative movement visualizes through changes in socio-economic
condition which are helpful for the sustainable development of the rural area of
Ahmednagar district of Maharashtra State. Proper assessment of local nature and human
resources are essential for better planning as each region has some resources to support
sustainability. It always expected that sustainability in rural economy should be achieved
but it is not so easy to fulfill all the norms of sustainability. There are some aspects
which need attention in the area of sustainable rural economy. Co-operatives have a big
role in it, as co-operatives have channel to fulfill the requirements of the rural area.
1. Kaul Sushila, “Implications of Globalization on Development of Dairy Co-operatives in India”, Indian Agricultural Statistical
Research Institute, New Delhi, India. P.1.

239
Majority of the population lives in rural area in Ahmednagar, the farming is the
main business of this mass, the agriculturists were illiterate and distressed by poverty,
struggling with the massive debt. Most of the villages of the district need of basic social
infrastructure like-all weather roads, drinking water, regular electricity, basic education,
primary health care, etc.
In fact, in every economic activities like production, distribution, exchange and
consumption co-operative movement have an important role to play. In the era of
privatization, liberalization and globalization (LPG) qualitative techniques,
continuousness in services, increasing financial strength, application of modern
technology, continuous training to the employees to cope with needs of changing
requirements etc. are necessary for long term survival. In the globalize context survival of
the fittest become important feature in each field including co-operatives. For a
sustainable rural development co-operatives have a key role to play by promoting savings
by encouraging and channeling investment. Co-operative institutions have to face global
competition and for this each co-operative institution must have to increase its strength
with the help of providing extensive services as per member‟s requirement. For
strengthening the co-operative movement it is necessary to increase profit by providing
new services to the members and to tap other fields to widen activities is also necessary.

240
Table No. 7.1 Progress of Various Types of Co-operative Societies in Ahmednagar District.
(Membership and Rs. in Thousands)
Types of Societies 1996-97 1997-98 1998-1999 1999-00 2000-01 2001-02 2002-03 2003-04 2004-05 2005-06
Agricultural Credit Societies-
1.ADCC Bank Ltd.
2.PACS
3.Agricultural Service Societies
4.LAMPS Co-op. Societies
5.Grain Banks
6.Other
1211
01
1172
01
37
0
0
1220
(0.74)
01
1181
01
37
0
0
1253
(2.70)
01
1214
01
37
0
0
1267
(1.11)
01
1228
01
37
0
0
1266
(-0.07)
01
1227
01
37
0
01
1294
(2.21)
01
1253
01
38
0
01
1314
(1.54)
01
1273
01
38
0
01
1320
(0.45)
01
1279
01
38
0
01
1322
(0.15)
01
1281
01
38
0
01
1324
(0.15)
01
1283
01
38
0
01
Non-Agril. Credit Societies-
1.Urban Banks
2.Urban Credit Societies
3.Employees Societies
4.Other
783
18
559
206
0
869
(10.98)
21
641
207
0
946
(8.86)
21
713
212
0
1032
(9.09)
22
797
213
0
1054
(2.13)
22
820
212
0
1141
(8.25)
22
906
213
0
1243
(8.94)
23
1006
214
0
1263
(1.61)
23
1029
211
0
1275
(0.95)
23
1042
210
0
1245
(-2.35)
24
1009
212
0
Marketing Societies-
1.District Marketing Societies
2.Primary Marketing Societies
3.Other
46
01
44
01
48
(4.34)
01
46
01
48
(0.0)
01
46
01
48
(0.0)
01
46
01
51
(6.25)
01
48
02
51
(0.0)
01
50
0
53
(3.92)
01
52
0
53
(0.0)
01
52
0
58
(9.43)
01
56
01
57
(-1.72)
01
56
0
Production Societies-
3646 3867
(6.06)
4100
(6.02)
4193
(2.26)
4380
(4.46)
4497
(2.67)
4724
(5.04)
4724
(0.0)
4724
(0.0)
4291
(-9.16)
Social Services Co-op. Societies
1334 1390
(4.19)
1496
(7.62)
1519
(1.53)
1686
(10.99)
1730
(2.61)
1865
(7.80)
1950
(4.55)
2100
(7.69)
2410
(14.76)
Total- 7020 7394
(5.32)
7843
(6.07)
8059
(2.75)
8437
(4.69)
8713
(3.27)
9199
(5.57)
9310
(1.20)
9479
(1.81)
9285
(-1.60) Source- District Social and Economic Analysis, Ahmednagar District, 2008. Percentage in brackets shows the growth rate.
241
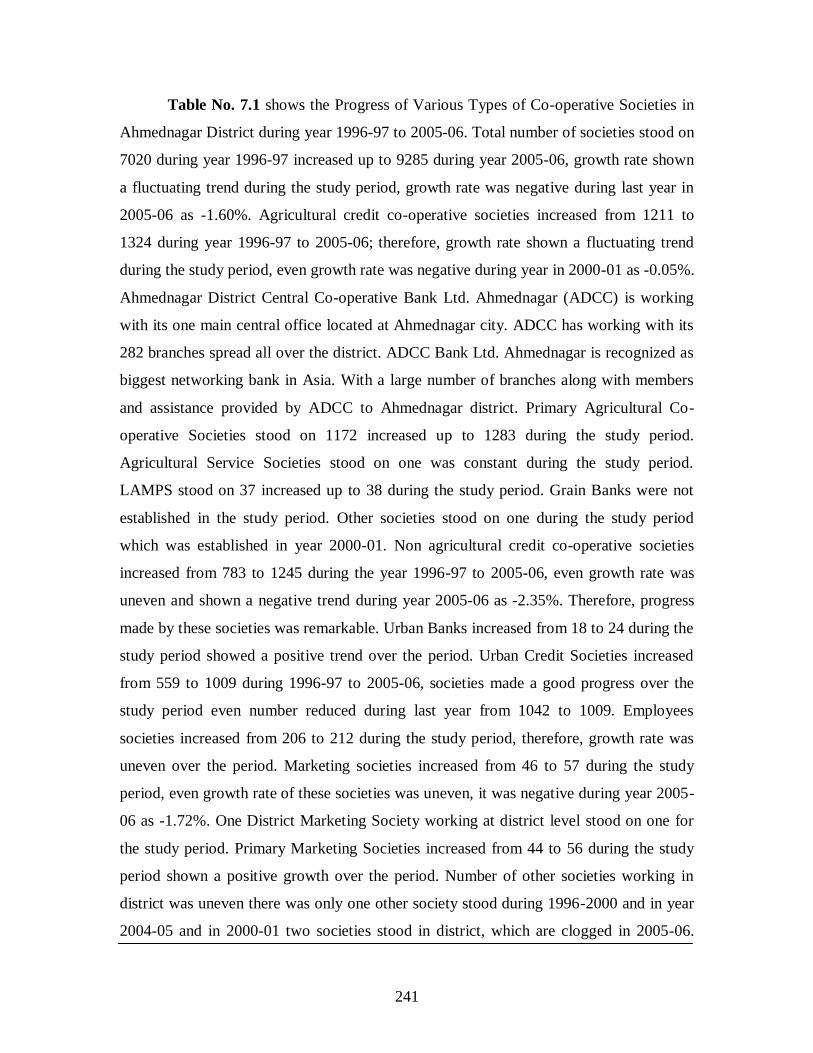
Table No. 7.1 shows the Progress of Various Types of Co-operative Societies in
Ahmednagar District during year 1996-97 to 2005-06. Total number of societies stood on
7020 during year 1996-97 increased up to 9285 during year 2005-06, growth rate shown
a fluctuating trend during the study period, growth rate was negative during last year in
2005-06 as -1.60%. Agricultural credit co-operative societies increased from 1211 to
1324 during year 1996-97 to 2005-06; therefore, growth rate shown a fluctuating trend
during the study period, even growth rate was negative during year in 2000-01 as -0.05%.
Ahmednagar District Central Co-operative Bank Ltd. Ahmednagar (ADCC) is working
with its one main central office located at Ahmednagar city. ADCC has working with its
282 branches spread all over the district. ADCC Bank Ltd. Ahmednagar is recognized as
biggest networking bank in Asia. With a large number of branches along with members
and assistance provided by ADCC to Ahmednagar district. Primary Agricultural Co-
operative Societies stood on 1172 increased up to 1283 during the study period.
Agricultural Service Societies stood on one was constant during the study period.
LAMPS stood on 37 increased up to 38 during the study period. Grain Banks were not
established in the study period. Other societies stood on one during the study period
which was established in year 2000-01. Non agricultural credit co-operative societies
increased from 783 to 1245 during the year 1996-97 to 2005-06, even growth rate was
uneven and shown a negative trend during year 2005-06 as -2.35%. Therefore, progress
made by these societies was remarkable. Urban Banks increased from 18 to 24 during the
study period showed a positive trend over the period. Urban Credit Societies increased
from 559 to 1009 during 1996-97 to 2005-06, societies made a good progress over the
study period even number reduced during last year from 1042 to 1009. Employees
societies increased from 206 to 212 during the study period, therefore, growth rate was
uneven over the period. Marketing societies increased from 46 to 57 during the study
period, even growth rate of these societies was uneven, it was negative during year 2005-
06 as -1.72%. One District Marketing Society working at district level stood on one for
the study period. Primary Marketing Societies increased from 44 to 56 during the study
period shown a positive growth over the period. Number of other societies working in
district was uneven there was only one other society stood during 1996-2000 and in year
2004-05 and in 2000-01 two societies stood in district, which are clogged in 2005-06.

242
Production societies stood on 3646 increased up to 4291 during 1996-97 to 2005-06,
except year 2005-06 as growth rate was negative as -9.16% and during 2003-05 growth
rate was zero, for remaining period growth was positive and remarkable. Social Services
Co-operative Societies increased from 1334 to 2410 during 1996-97 to 2005-06, growth
showed a fluctuating trend over the period even the growth rate was positively increasing
over the study period.
Co-operative sector in Ahmednagar district have contributed a great portion of the
rural economy. Co-operation in Ahmednagar district has been practiced for more than
hundred years. Co-operatives have now providing several services in increasing trend
including various sectors and requirement of the rural society. Present changing scenario
in the context of economic reforms period have created new challenges in front of co-
operatives, to meet the recent challenges co-operatives must prepare themselves to
compete, so it needs due consideration. It is observed that out of the various factors,
government support and timely and adequate financial support is highly essential to reach
the needs of these sectors. There is a hard line competition has exists in the development
of the co-operative societies and made it difficult to cop up with this competition.

243
Table No. 7.2 - Financial Position of All Types of Co-operative Societies in Ahmednagar District. (Membership and Rs. in Thousands)
Items 1996-97 1997-98 1998-1999 1999-00 2000-01 2001-02 2002-03 2003-04 2004-05 2005-06
1. No. of Co-op. Societies-
2. Membership (000’)-
3. Paid-up Share Capital
Govt. Share Capital-
4. Owned Funds-
5. Deposits-
6. Working Capital-
7. Loans Disbursed-
8. Purchase Price-
9. Sale Price-
10. Profit/Loss-
Societies in Profit
Profit Amount-
Societies in Loss-
Loss Amount-
No Profit/Loss Societies-
7020
1853
1925837
98124
2656118
6122512
25587431
8355648
2997367
34851793
3855
311423
3144
586211
21
7394
(5.32)
1956
2075941
89324
1986167
12235271
32932246
19346173
4132119
4151352
4157
3973224
3178
493551
59
7843
(6.07)
2062
3012759
89367
2923392
19218622
41682551
31157344
19216653
19785471
3431
1781066
4339
596729
73
8059
(2.75)
2145
3604321
33455
3570866
21065461
47434381
33858434
22535428
23962114
3497
2013572
4468
842791
94
8437
(4.69)
2316
4113562
21645
6521847
32148315
61760449
51861791
23797422
24681355
3749
2762821
4570
1426229
118
8713
(3.27)
2423
4526827
25193
9078416
32816314
68910699
39925012
26354852
27153711
3948
2944138
4624
1693728
141
9199
(5.57)
2570
5463235
24900
12042055
42974711
80250509
40030938
9278865
12369661
4159
2903739
4868
1754185
172
9310
(1.20)
2737
5604388
35455
12609873
48486667
79081313
46254787
9371654
12493357
4209
2967260
4926
1792836
175
9479
(1.81)
3029
6027718
22855
8102068
36054386
80936826
35350059
9512228
1255823
4422
30266052
4876
1828693
181
9285
(-1.60)
2989
6087995
23085
8183089
51041469
84153816
87675242
43537592
71621583
4333
30417382
4776
1846979
176
Source- District Social and Economic Analysis, Ahmednagar District, 2008.

244
Table No. 7.2 shows the Financial Position of All Types of Co-operative
Societies in Ahmednagar District during year 1996-97 to 2005-06. Number of co-
operative societies increased from 7020 to 9285 during year 1996-97 to 2005-06 in
Ahmednagar District. Growth rate showed a fluctuating trend over the period, which was
-1.60% during year 2005-06. Membership increased from 1853 thousands in 1996-97
increased up to 2989 thousands during 2005-06, it has showed increasing trend over the
study period which indicate that the number of peoples are engaged in increasing trend in
co-operation, it is a win of co-operative thoughts and principles under which it is making
progress. Paid up share capital of the co-operatives societies increased during the study
period from Rs.1925837 thousands to Rs.6087995 thousands during 1996-97 to 2005-06,
which showed a positively increasing trend over the period. Therefore, government
contribution to paid up share capital showed a decreasing trend over the period as it was
reduced from Rs.98124 thousands to Rs.23085 thousands during the same period, growth
rate was declining and negative during the same period indicating that after introducing
economic reforms to Indian economy government have changed their policy of catering
services and financial assistance to co-operative societies. Owned funds of co-operative
societies increased from Rs.2656118 thousands to Rs.8183089 thousands during the
study period, therefore, growth rate shown a fluctuating trend which was recorded
negative during year 1997-98, for remaining years it was positive. Deposits collected by
the co-operatives during the study period increased from Rs.6122512 thousands to
Rs.51041469 thousands during 1996-97 to 2005-06, even growth was uneven which
fluctuated during year2004-05. However, co-operatives have made a remarkable progress
not only in collecting deposits but confidence of rural masses also. Working capital of the
co-operatives has increased with a considerable range along with continuous increasing
trend over the study period. Working capital increased from Rs.25587431 thousands to
Rs.84153816 thousands during 1996-97 to 2005-06. Loans disbursed by co-operatives
increased from Rs.8355648 thousands to Rs.87675242 thousands during the study period,
therefore, growth showed a fluctuating trend over the period. Loans disbursement showed
fluctuating trend due to several reasons i.e. weak recovery performance, lack of funds,
natural calamities, etc. Purchase price of co-operative societies increased from
Rs.2997367 thousands to Rs.43537592 thousands during the study period, therefore,

245
growth was uneven and reduced during year 2000-01. Selling price of the various
consumers good and services and production of co-operatives increased from
Rs.34851793 thousands to Rs.71621583 thousands during the study period, therefore,
growth fluctuated during year 2000-01 as well as purchasing and selling performance was
quite weak during period 2000-03 compare to other study period. Profit and loss indicates
the performance of any institution. Number of co-operative societies earned profit
increased from 3855 to 4333; therefore, growth in number showed a fluctuation during
year 1998-99 as the societies decreased from 4157 to 3431 even after this reduction
numbers showed a positively increasing trend. Profit earned by co-operative societies
during the study period increased from Rs.311423 thousands to Rs.30417382 thousands
during the study period. However, profit earned by the co-operatives showed uneven
progress over the period. Societies in loss increased from 3144 to 4776 during the study
period, it is observed from the table that number of societies increased in a positive trend
which is bad sign for the co-operative movement which is working for the uplift of the
poorer and neglected laborers, farmers, and tenant and for the weaker sections of the rural
society. Loss amount of co-operatives increased from Rs.586211 thousands to
Rs.1846979 thousands during the same period. Therefore, growth fluctuated during year
1997-98 downwards but afterwards it was showed a increasing trend over the period,
which is a biggest shortcoming of the co-operative movement. Co-operative societies
which have did not occurred loss or profit they are neutral or not mentioned their audit
report are also increased from 21 to 176 during the study period.
It is quite necessary that co-operative societies should maintain their expenditure
for that they must improve their operating performance, recovery of overdues and
increase their internal resources for financial sound position.

246
Table No. 7.3 - Financial Position of Maharashtra State Agricultural & Rural Development Bank Ltd. in Ahmednagar Dist.
(Membership & Rs. in Thousands)
Items 1996-97 1997-98 1998-1999 1999-00 2000-01 2001-02 2002-03 2003-04 2004-05 2005-06
1. No. of Branches-
2. Membership (000’)
a)Societies-
b) Personal Members-
3. Paid-up Share Capital-
4. Reserve & Other Funds-
5. Deposits-
6. Working Capital-
7. Loans Outstanding
Short Term-
Medium Term-
Long Term-
8. Loans Disbursed
Short Term-
Medium Term-
Long Term-
9. Loans Overdues
Short Term-
Medium Term-
Long Term-
14
632
60096
60600
0
9200
682100
0
0
542600
0
0
88000
0
0
72500
14
632
59948
59980
0
10005
713560
0
0
534500
0
0
0
0
0
80010
14
557
60009
59244
0
9552
667856
0
0
491547
0
0
21000
0
0
102963
14
632
59293
54554
0
14135
655241
0
0
427135
0
0
2339
0
0
109269
14
632
58919
50484
0
3281
592000
0
0
365900
0
0
1955
0
0
122300
14
632
58919
50400
21060
10295
564800
0
0
0
0
0
325000
0
0
122315
15
632
58931
44469
12460
1300
187000
0
0
0
0
0
266582
0
0
137350
15
632
59345
41364
12436
6855
950100
0
0
243119
0
0
243119
0
0
157387
14
632
58931
39198
12436
6311
1245621
0
0
466168
0
466168
0
0
0
0
14
632
58928
37051
12427
6332
1248625
0
447413
0
0
447413
0
0
41952
0
Note- Agricultural Co-operative Societies including PACS, ASS and LAMPS.
Source- District Social and Economic Analysis, Ahmednagar District, 2008.

247
Table No. 7.3 shows the Financial Position of Maharashtra State Agricultural &
Rural Development Bank Ltd. in Ahmednagar District (MSARDB) during period 1996-
97 to 2005-06. Number of branches of MSARDB stood on 14 in year 1996-97 increased
up to 15 in 2002-03 and 2003-04 and stood constant on 14 numbers for 2004-05 and
2005-06. Membership of MSARDB stood constant during the study period as on 632
thousand, personal members decreased from 60096 thousand to 58928 thousand during
the study period. Paid-up share capital decreased from Rs.60600 thousands to Rs. 37051
thousands during 1996-97 to 2005-06, share capital showed decreasing trend due to
membership which decreased over the period. Reserve and other funds of the bank
showed nil or zero for first five years of the study and afterwards shown a fluctuating and
decreasing trend over the period. It is resulted as a decrease in the business of the bank.
Deposits showed decrease as it was Rs.9200 thousand during year 1996-97 decreased up
to Rs.6332 thousands during 2005-06. Therefore, growth was uneven and shown a
fluctuating trend over the study period. Working capital increased from Rs.682100
thousands to Rs.1248625 thousands during 1996-97 to 2005-06, growth of working
capital showed a fluctuating trend over the period. Loans outstanding regarding to short
term loans was nil or zero for the study period, medium term loans was also nil except
last year of study 2005-06 when it was Rs.447413 thousands, long term loans showed
highly fluctuations over the period. Amount of loans overdues for short term was nil as
there was no short term loans disbursed in study period, medium term was nil for first
nine year and for last year it was Rs.41952 thousands, long term loans overdues amount
in year 1996-97 was 72500 thousand increased up to Rs.157387 thousands during year
2003-04 and for last two year amount was zero.

248
Table No. 7.4 - Financial Position of Ahmednagar District Central Co-operative Bank Ltd. (ADCC).
(Membership & Rs. in Thousands)
Items 1996-97 1997-98 1998-1999 1999-00 2000-01 2001-02 2002-03 2003-04 2004-05 2005-06
1. No. of Branches -
2. No. of Members
a) Societies-
b) Personal Members-
3. Share Capital -
4.Reserve & Other Funds
5. Deposits -
6. Working Capital-
7. Issued Loans -
Short Term-
Medium Term-
Long Term-
8. Outstanding Loans –
Short Term-
Medium Term-
Long Term-
9. Loans Overdues-
Short Term-
Medium Term-
Long Term-
289
4614
1584
188866
492358
6288691
8532087
988252
119572
1107824
4703830
1196095
288266
603631
171502
74994
289
4665
1582
261111
55614
7615020
10065828
763180
642138
8128
4948876
1600898
257944
551536
188048
73337
289
4779
1577
317139
652529
9186106
12443835
4384371
1943245
217725
6145745
1943245
217725
1011820
199176
84741
289
4863
1575
375631
785165
10419801
14100318
1654300
478881
23363
7448566
1954737
186712
706176
221425
75765
289
5103
1575
425426
916013
13218626
17361747
1701501
629343
17049
8987290
2063336
164163
981927
139448
66992
289
5275
1574
462779
1180019
13902783
18700241
1778538
398133
199931
10309579
1166193
1318870
868450
148186
113217
289
5400
1573
490888
1380317
16142395
20161989
1526688
1274959
177024
10481971
2010792
1304562
1111331
165173
139786
289
5541
1486
552528
1715305
18472498
22460943
818170
667850
151813
227435
2130182
1295363
1401512
179815
199949
289
1122
565247
1938986
18129076
21981327
1261192
1261192
1708094
19564
1697704
3370277
1097512
754843
219175
144584
286
5665
940
593647
2113211
19760278
24410839
2235454
1151393
41037
8485707
2679209
12816625
871593
197380
149156
Note- Non-Agricultural Co-operative Societies includes Urban Banks, Employers Credit Societies and Other Urban Credit Societies.
Source- District Social and Economic Analysis, Ahmednagar District, 2008.

249
Table No. 7.4 shows the Financial Position of Ahmednagar District Central Co-
operative Bank Ltd. (ADCC) during the study period from 1996-97 to 2005-06. Number
of branches stood on 289 during year 1996-97 was constant up to 2004-05 and in last
year decreased up to 286 during year 2006-07. Number of members of ADCC societies
stood on 4614 in 1996-97 increased up to 5665 during year 2005-06, therefore, growth of
numbers of member societies was uneven during the study period. Personal members
stood on 1584 in 1996-97 decreased up to 940 in 2005-06, therefore, there was great
uneven growth, it is resulted due to loan practices, members are enrolled who have taken
loan from the banks, and as usual during 2005-06 government packages reduced the
members of the bank. Share capital increased from Rs.188866 thousands to Rs.593647
thousands during the same period, growth was positively increasing except last year
2005-06 when it was showed a decrease. Reserve and other funds increased from
Rs.492358 thousands to Rs.2113211 thousands during the study period. It showed that
the bank is having good returns of the business. Deposits increased from Rs.6288691
thousands to Rs.19760278 thousands during 1996-97 to 2005-06, growth of deposits over
the study period was positively increasing and shows the confidence of depositors on
bank. Working capital of the banks increased from Rs.8532087 thousands to
Rs.24410839 thousands during the study period, as growth showed positively increase is
an evidence of increasing business and efficiency. Short term loans issued increased from
Rs.988252 thousands to Rs.2234454 thousands during the same period, medium term
loans increased from Rs.119572 thousands to Rs.1151393 thousands during 1996-97 to
2005-06 and long term loans decreased from Rs.1107824 thousands to Rs.41037
thousands during the study period. Short term loans outstanding increased from
Rs.4703830 thousands to Rs.8485707 thousands during the study period, medium term
loans increased from Rs.1196095 thousands to Rs.2679209 thousands during the same
period and long term loans increased from Rs.288266 thousands to Rs.12816625
thousands during the same period. Table revealed that the outstanding loans increased
over the study period, Ahmednagar district is known as drought-prone, agriculturist
suffers a lot due to inadequate production and income and unable to pay loans in time
leads to increase outstanding loans, due to government package peoples also waits for
government assistance against loans. Amount of short term loans overdues increased
250
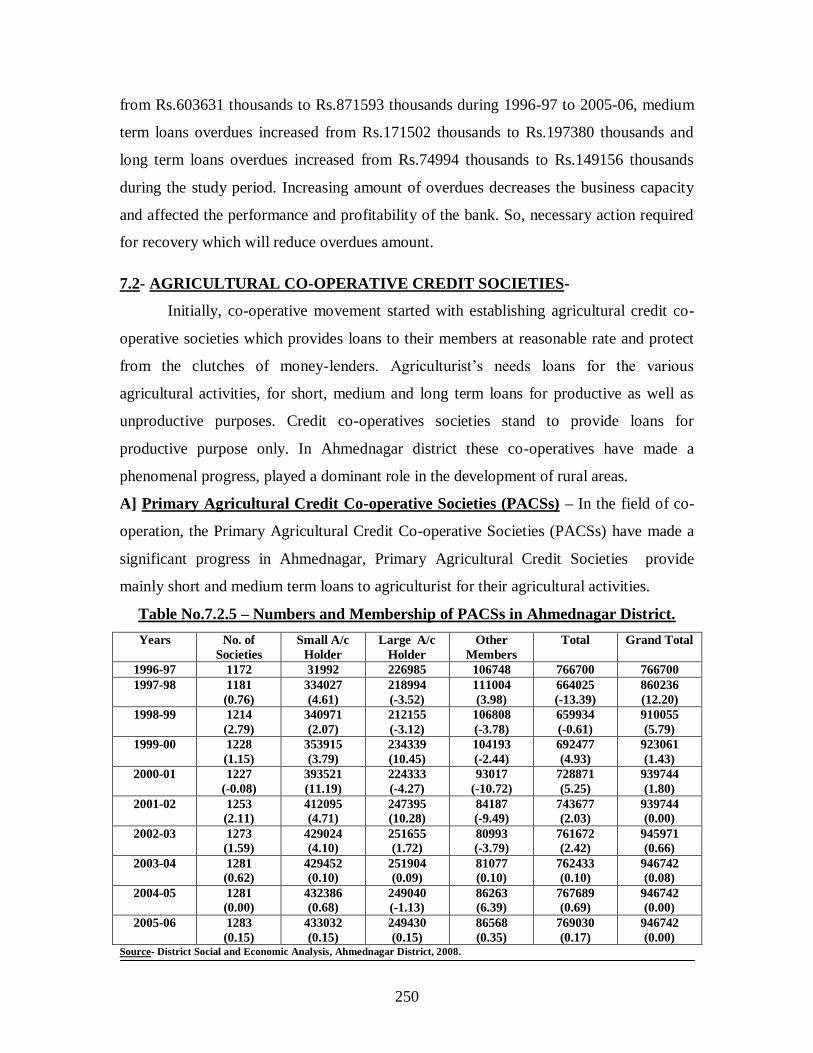
from Rs.603631 thousands to Rs.871593 thousands during 1996-97 to 2005-06, medium
term loans overdues increased from Rs.171502 thousands to Rs.197380 thousands and
long term loans overdues increased from Rs.74994 thousands to Rs.149156 thousands
during the study period. Increasing amount of overdues decreases the business capacity
and affected the performance and profitability of the bank. So, necessary action required
for recovery which will reduce overdues amount.
7.2- AGRICULTURAL CO-OPERATIVE CREDIT SOCIETIES-
Initially, co-operative movement started with establishing agricultural credit co-
operative societies which provides loans to their members at reasonable rate and protect
from the clutches of money-lenders. Agriculturist‟s needs loans for the various
agricultural activities, for short, medium and long term loans for productive as well as
unproductive purposes. Credit co-operatives societies stand to provide loans for
productive purpose only. In Ahmednagar district these co-operatives have made a
phenomenal progress, played a dominant role in the development of rural areas.
A] Primary Agricultural Credit Co-operative Societies (PACSs) – In the field of co-
operation, the Primary Agricultural Credit Co-operative Societies (PACSs) have made a
significant progress in Ahmednagar, Primary Agricultural Credit Societies provide
mainly short and medium term loans to agriculturist for their agricultural activities.
Table No.7.2.5 – Numbers and Membership of PACSs in Ahmednagar District.
Years No. of
Societies
Small A/c
Holder
Large A/c
Holder
Other
Members
Total Grand Total
1996-97 1172 31992 226985 106748 766700 766700
1997-98 1181
(0.76)
334027
(4.61)
218994
(-3.52)
111004
(3.98)
664025
(-13.39)
860236
(12.20)
1998-99 1214
(2.79)
340971
(2.07)
212155
(-3.12)
106808
(-3.78)
659934
(-0.61)
910055
(5.79)
1999-00 1228
(1.15)
353915
(3.79)
234339
(10.45)
104193
(-2.44)
692477
(4.93)
923061
(1.43)
2000-01 1227
(-0.08)
393521
(11.19)
224333
(-4.27)
93017
(-10.72)
728871
(5.25)
939744
(1.80)
2001-02 1253
(2.11)
412095
(4.71)
247395
(10.28)
84187
(-9.49)
743677
(2.03)
939744
(0.00)
2002-03 1273
(1.59)
429024
(4.10)
251655
(1.72)
80993
(-3.79)
761672
(2.42)
945971
(0.66)
2003-04 1281
(0.62)
429452
(0.10)
251904
(0.09)
81077
(0.10)
762433
(0.10)
946742
(0.08)
2004-05 1281
(0.00)
432386
(0.68)
249040
(-1.13)
86263
(6.39)
767689
(0.69)
946742
(0.00)
2005-06 1283
(0.15)
433032
(0.15)
249430
(0.15)
86568
(0.35)
769030
(0.17)
946742
(0.00) Source- District Social and Economic Analysis, Ahmednagar District, 2008.

251
Table No.7.2.5 shows the progress of numbers and membership of Primary
Agricultural Co-operative Societies (PACS) in Ahmednagar district during 1996-97 to
2005-06. Number of societies increased from 1172 to 1283 from year 1996-97 to 2005-
06, growth rate showed a fluctuating trend over the period, during 2000-01 number of
societies decreased by one number therefore overall growth rate was positive in economic
reforms period. Small account holders of PACS increased from31992 to 433032 during
1996-97 to 2005-06, even growth rate was uneven. Large account holders increased from
226985 to 249430 during 1996-97 to 2005-06, growth rate was fluctuating and shown
negative growth during 1996-97 to 1998-99 and in year 2000-01 and 2004-05. Other
members decreased from 106748 to 86568 during the same period along with fluctuating
growth rate trend. Total members decreased from 766700 to 769030 during the same
period, growth rate showed that total numbers decreased during year 1996-97 to 1998-99,
-13.39% and -0.61%, respectively. Grand total members increased from 766700 to
946742 during 1996-97 to 2005-06 while growth rate showed decreasing trend from
12.20% to 0.08% and stood constant for last two years. Membership is the factor which
leads to the increase in share capital, shares granted to those persons who take loans,
registration, death of members and mass enrolment resulted into the uneven increase.
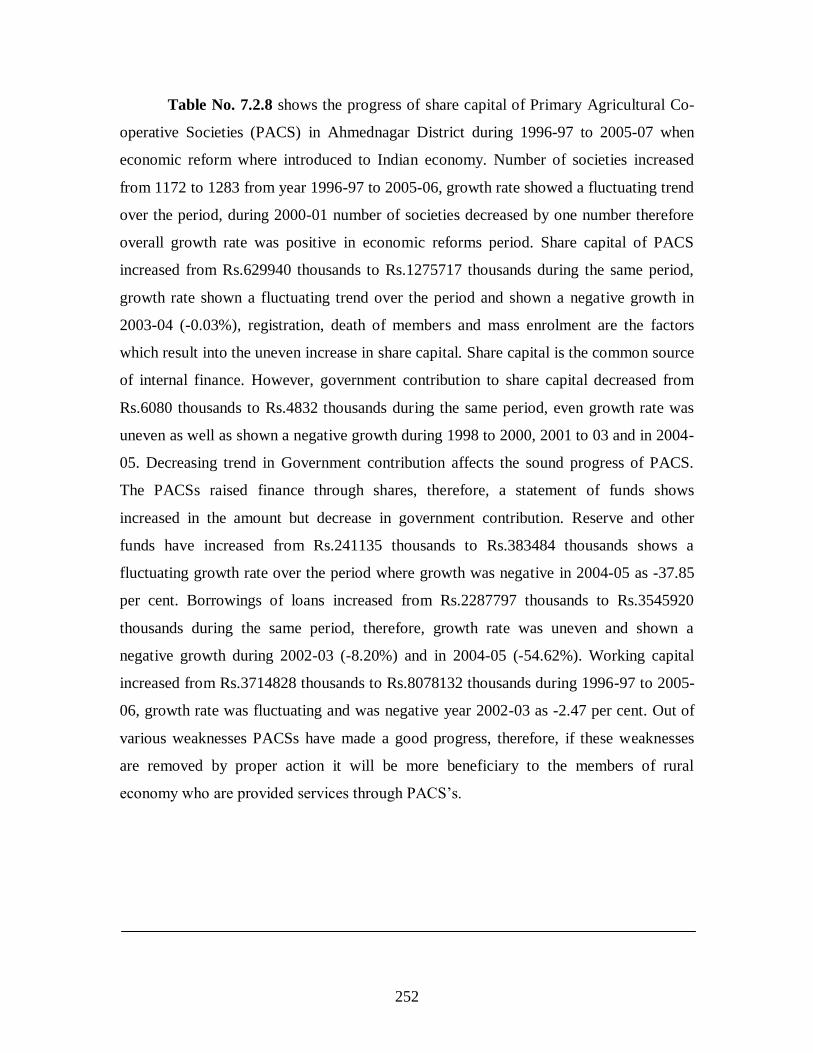
Table No. 7.2.8- Share Capital of PACS in Ahmednagar District. (Rs. in Thousands)
Years No. of
Societies
Share
Capital
of which
Govt.
Reserve &
Other Funds
Borrowings
Loans
Working
Capital
1996-97 1172 629940 6080 241135 2287797 3714828
1997-98 1181
(0.76)
759590
(20.58)
6873
(12.38)
258959
(7.39)
2897848
(26.66)
4625171
(24.50)
1998-99 1214
(2.79)
785167
(3.36)
6540
(-4.28)
284181
(9.74)
3579910
(23.53)
5233709
(13.15)
1999-00 1228
(1.15)
916788
(16.76)
6177
(-5.55)
336043
(18.24)
4465050
(24.72)
6532908
(24.82)
2000-01 1227
(-0.08)
1009672
(10.13)
6761
(9.45)
355322
(5.73)
4583808
(2.66)
7136691
(9.24)
2001-02 1253
(2.12)
1187848
(17.64)
6259
(-7.42)
388615
(9.37)
4630904
(1.02)
7181743
(0.63)
2002-03 1273
(1.59)
1202100
(1.20)
6147
(-1.79)
457297
(17.67)
4251187
(-8.20)
7004089
(-2.47)
2003-04 1281
(0.62)
1201678
(-0.03)
6676
(8.60)
599129
(31.01)
7260629
(78.79)
7359470
(5.07)
2004-05 1281
(0.00)
1264869
(5.25)
4762
(-28.66)
372315
(-37.85)
3294608
(-54.62)
7946050
(7.97)
2005-06 1283
(0.15)
1275717
(0.85)
4832
(1.47)
383484
(2.99)
3545920
(7.62)
8078132
(1.66)
Source- District Social and Economic Analysis, Ahmednagar District, 2008.
252
Table No. 7.2.8 shows the progress of share capital of Primary Agricultural Co-
operative Societies (PACS) in Ahmednagar District during 1996-97 to 2005-07 when
economic reform where introduced to Indian economy. Number of societies increased
from 1172 to 1283 from year 1996-97 to 2005-06, growth rate showed a fluctuating trend
over the period, during 2000-01 number of societies decreased by one number therefore
overall growth rate was positive in economic reforms period. Share capital of PACS
increased from Rs.629940 thousands to Rs.1275717 thousands during the same period,
growth rate shown a fluctuating trend over the period and shown a negative growth in
2003-04 (-0.03%), registration, death of members and mass enrolment are the factors
which result into the uneven increase in share capital. Share capital is the common source
of internal finance. However, government contribution to share capital decreased from
Rs.6080 thousands to Rs.4832 thousands during the same period, even growth rate was
uneven as well as shown a negative growth during 1998 to 2000, 2001 to 03 and in 2004-
05. Decreasing trend in Government contribution affects the sound progress of PACS.
The PACSs raised finance through shares, therefore, a statement of funds shows
increased in the amount but decrease in government contribution. Reserve and other
funds have increased from Rs.241135 thousands to Rs.383484 thousands shows a
fluctuating growth rate over the period where growth was negative in 2004-05 as -37.85
per cent. Borrowings of loans increased from Rs.2287797 thousands to Rs.3545920
thousands during the same period, therefore, growth rate was uneven and shown a
negative growth during 2002-03 (-8.20%) and in 2004-05 (-54.62%). Working capital
increased from Rs.3714828 thousands to Rs.8078132 thousands during 1996-97 to 2005-
06, growth rate was fluctuating and was negative year 2002-03 as -2.47 per cent. Out of
various weaknesses PACSs have made a good progress, therefore, if these weaknesses
are removed by proper action it will be more beneficiary to the members of rural
economy who are provided services through PACS‟s.
253
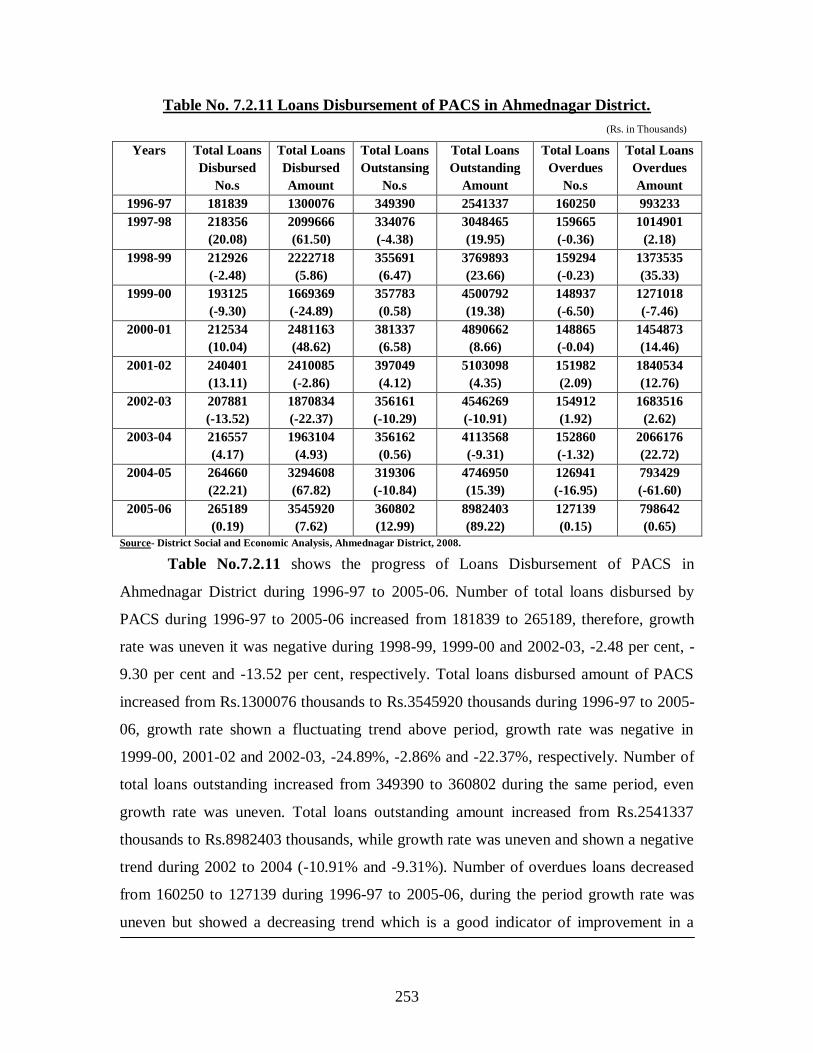
Table No. 7.2.11 Loans Disbursement of PACS in Ahmednagar District.
(Rs. in Thousands)
Years Total Loans
Disbursed
No.s
Total Loans
Disbursed
Amount
Total Loans
Outstansing
No.s
Total Loans
Outstanding
Amount
Total Loans
Overdues
No.s
Total Loans
Overdues
Amount
1996-97 181839 1300076 349390 2541337 160250 993233
1997-98 218356
(20.08)
2099666
(61.50)
334076
(-4.38)
3048465
(19.95)
159665
(-0.36)
1014901
(2.18)
1998-99 212926
(-2.48)
2222718
(5.86)
355691
(6.47)
3769893
(23.66)
159294
(-0.23)
1373535
(35.33)
1999-00 193125
(-9.30)
1669369
(-24.89)
357783
(0.58)
4500792
(19.38)
148937
(-6.50)
1271018
(-7.46)
2000-01 212534
(10.04)
2481163
(48.62)
381337
(6.58)
4890662
(8.66)
148865
(-0.04)
1454873
(14.46)
2001-02 240401
(13.11)
2410085
(-2.86)
397049
(4.12)
5103098
(4.35)
151982
(2.09)
1840534
(12.76)
2002-03 207881
(-13.52)
1870834
(-22.37)
356161
(-10.29)
4546269
(-10.91)
154912
(1.92)
1683516
(2.62)
2003-04 216557
(4.17)
1963104
(4.93)
356162
(0.56)
4113568
(-9.31)
152860
(-1.32)
2066176
(22.72)
2004-05 264660
(22.21)
3294608
(67.82)
319306
(-10.84)
4746950
(15.39)
126941
(-16.95)
793429
(-61.60)
2005-06 265189
(0.19)
3545920
(7.62)
360802
(12.99)
8982403
(89.22)
127139
(0.15)
798642
(0.65)
Source- District Social and Economic Analysis, Ahmednagar District, 2008.
Table No.7.2.11 shows the progress of Loans Disbursement of PACS in
Ahmednagar District during 1996-97 to 2005-06. Number of total loans disbursed by
PACS during 1996-97 to 2005-06 increased from 181839 to 265189, therefore, growth
rate was uneven it was negative during 1998-99, 1999-00 and 2002-03, -2.48 per cent, -
9.30 per cent and -13.52 per cent, respectively. Total loans disbursed amount of PACS
increased from Rs.1300076 thousands to Rs.3545920 thousands during 1996-97 to 2005-
06, growth rate shown a fluctuating trend above period, growth rate was negative in
1999-00, 2001-02 and 2002-03, -24.89%, -2.86% and -22.37%, respectively. Number of
total loans outstanding increased from 349390 to 360802 during the same period, even
growth rate was uneven. Total loans outstanding amount increased from Rs.2541337
thousands to Rs.8982403 thousands, while growth rate was uneven and shown a negative
trend during 2002 to 2004 (-10.91% and -9.31%). Number of overdues loans decreased
from 160250 to 127139 during 1996-97 to 2005-06, during the period growth rate was
uneven but showed a decreasing trend which is a good indicator of improvement in a

254
sound financial health of these societies. Overdues amount Rs.993233 thousands
decreased up to Rs.798642 thousands during the same period, growth rate shown a
fluctuating trend therefore, it is a good sign which is essential to increase efficiency,
stability and profitability.
B] Agricultural Services Societies (ASSs) - These co-operative provides all necessary
support and assistance to agriculturist members in their agricultural activities. these
services are quite necessary for increasing production and productivity in result income
of the members which helps to uplift their standard of living.
Table No.7.2.6- Membership of Agricultural Services Societies in Ahmednagar
(Rahuri Taluka)
Years No. of
Societies
Small A/c
Holder
Large A/c
Holder
Other
Members
Total Grand
Total
1996-97 01 270 400 742 1412 46972
1997-98 01
(0.0)
270
(0.0)
400
(0.0)
742
(0.0)
1412
(0.0)
46972
(0.0)
1998-99 01
(0.0)
270
(0.0)
400
(0.0)
742
(0.0)
1412
(0.0)
67195
(43.05)
1999-00 01
(0.0)
270
(0.0)
400
(0.0)
742
(0.0)
1412
(0.0)
67195
(0.0)
2000-01 01
(0.0)
270
(0.0)
400
(0.0)
742
(0.0)
1412
(0.0)
67195
(0.0)
2001-02 01
(0.0)
270
(0.0)
400
(0.0)
742
(0.0)
1412
(0.0)
67886
(1.02)
2002-03 01
(0.0)
270
(0.0)
400
(0.0)
742
(0.0)
1412
(0.0)
70297
(3.52)
2003-04 01
(0.0)
270
(0.0)
400
(0.0)
742
(0.0)
1412
(0.0)
70297
(0.0)
2004-05 01
(0.0)
276
(2.22)
400
(0.0)
742
(0.0)
1441
(2.05)
70297
(0.0)
2005-06 01
(0.0)
276
(0.0)
400
(0.0)
765
(3.09)
1441
(0.0)
70297
(0.0)
Source- District Social and Economic Analysis, Ahmednagar District, 2008.
Table No.7.2.6 shows the Membership of Agricultural Services Societies (ASS)
in Rahuri Taluka of Ahmednagar District during 1996-97 to 2005-06. Number of ASS
stood in district during the same period was constant on number one. Small account
holders of this society stood on 270 increased up to 276 during the same period, which
are increased from 270 to 276 during 2003-04 to 2004-05 even growth rate was constant
for other years except year 2004-05 (2.22%). Large account holders stood on 400 was
constant during 1996-97 to 2005-06. Other members of the society increased from 742 to

255
765 during the same period, growth rate increased only during 2005-06 (3.09%) and
number from 742 to 765. Total members of ASS increased from 1412 to 1441 during the
same period, membership shown increase during 2004-05 even growth rate was constant
and increased during 2004-05 as 2.05 per cent. Grand total of the society increased from
46972 to 70297 during 1996-97 to 2005-06, growth rate showed a fluctuating trend over
the period, during 1998-99 growth rate increased by 43.05 per cent then it was increased
in 2001-02 and in 2002-03 by 1.02 per cent and 3.52 per cent.
Table No.7.2.9- Share Capital of Agricultural Services Societies in Ahmednagar
(Rahuri Taluka) (Rs. in Thousands)
Years No. of
Societies
Share
Capital
of which
Govt.
Reserve &
Other Funds
Borrowings
Loans
Working
Capital
1996-97 01 266 50 195 961 1011
1997-98 0
(0.0)
266
(0.0)
50
(0.0)
209
(7.18)
961
(0.0)
1099
(8.70)
1998-99 01
(0.0)
266
(0.0)
50
(0.0)
228
(9.09)
1096
(14.04)
995
(-9.46)
1999-00 01
(0.0)
266
(0.0)
50
(0.0)
809
(254.82)
1086
(-0.91)
1646
(65.42)
2000-01 01
(0.0)
266
(0.0)
50
(0.0)
821
(1.48)
1086
(0.0)
N.A.
(--)
2001-02 01
(0.0)
266
(0.0)
50
(0.0)
266
(-67.60)
961
(-11.51)
1350
(--)
2002-03 01
(0.0)
266
(0.0)
50
(0.0)
280
(5.26)
961
(0.0)
1465
(8.51)
2003-04 01
(0.0)
266
(0.0)
50
(0.0)
292
(4.28)
0
(--)
3804
(59.65)
2004-05 01
(0.0)
266
(0.0)
50
(0.0)
292
(0.0)
961
(--)
4007
(5.33)
2005-06 01
(0.0)
266
(0.0)
50
(0.0)
292
(0.0)
0
(--)
4213
(5.14)
Source- District Social and Economic Analysis, Ahmednagar District, 2008.
Table No.7.2.9 shows the progress of Agricultural Services Societies (ASS) in
Rahuri Taluka of Ahmednagar District during 1996-97 to 2005-06. Number of ASS stood
in district during the same period was constant on number one. Share capital of the
societies was also constant for the study period, as it stood on Rs.266 thousands for
complete study period along with constant growth rate zero. Same thing happened with
government contribution which stood constant for whole period as Rs.50 thousands.
Reserve and other funds of the society increased from Rs.195 thousands to Rs.292
thousands during the same period; therefore, growth rate was uneven, growth was

256
negative during year 2001-02 (-67.60%), it was highest in 1999-00 (254.82%) and
constant for last two years. Borrowings of loans of societies shown a fluctuating trend
over the period, therefore, numbers at the end was constant stood on 961. Working
capital increased from Rs.1011 thousands to Rs.4213 thousands during the same period,
even growth rate was uneven and was negative in 1998-99 (-9.46%) and was highest
during year 2002-03 as 59.65 per cent.
Table No.7.2.12- Loans Disbursement of ASSs in A’Nagar Dist. (Rahuri Taluka)
(Rs. in Thousands)
Years Total Loans
Disbursed
No.s
Total Loans
Disbursed
Amount
Total Loans
Outstansing
No.s
Total Loans
Outstanding
Amount
Total Loans
Overdues
No.s
Total Loans
Overdues
Amount
1996-97 00 00 34 163 34 163
1997-98 00 00 32
(-5.88)
162
(-0.61)
32
(-5.88)
162
(-0.61)
1998-99 00 00 32
(0.0)
162
(0.0)
32
(0.0)
162
(0.0)
1999-00 00 00 31
(-3.12))
156
(3.70)
31
(-3.12)
156
(3.70)
2000-01 00 00 31
(0.0)
156
(0.0)
31
(0.0)
156
(0.0)
2001-02 00 00 31
(0.0)
149
(-4.87)
31
(0.0)
149
(-4.87)
2002-03 00 00 31
(0.0)
149
(0.0)
31
(0.0)
149
(0.0)
2003-04 00 00 31
(0.0)
149
(0.0)
31
(0.0)
149
(0.0)
2004-05 00 00 31
(0.0)
483
(224.16)
31
(0.0)
149
(0.0)
2005-06 00 00 31
(0.0)
147
(-69.56)
31
(0.0)
147
(-1.34) Source- District Social and Economic Analysis, Ahmednagar District, 2008.
Table No.7.2.12 shows the progress of Loans Disbursement of Agricultural
Service Societies (ASSs) in Ahmednagar District during 1996-97 to 2005-06. There is
only one ASSs is working in Rahuri Taluka of Ahmednagar district. It is found that
during the study period of 1996-97 to 2005-06 there were no loans distributed by the
ASS. Therefore, during the same period total loans outstanding numbers are decreased
from 34 to 31, this is happened in year 1997-98, 34 to 32 and in 1999-00 32 to 31, growth
rate shown a decreasing trend which was decreased in year 1997-98 (-5.88%) and in
1999-00 (-3.12%). Total loans outstanding amount also decreased from Rs.163 thousands
to Rs.147 thousands during the same period, even growth showed a decreasing trend in
1997-98 2001-02 and 2005-06, -0.61 per cent, -4.87 per cent and -69.56 per cent,
257
respectively. Number of total loans overdues decreased from 34 to 31 whereas growth
rate decreased during year 1997-98 and 1999-00, -5.88 per cent and -3.12 per cent,
respectively. Amount of total loans overdues also decreased from Rs.163 thousands to
Rs.147 thousands during 1996-97 to 2005-06, growth rate shown a decreasing trend
expect year 1999-00 when growth rate was increased by 3.70% and decreased during
1997-98, 2001-02 and 2005-06, -0.61%, -4.87% and -1.34%, respectively. During the
study period loan disbursement procedure was completely stopped and much attention
was given to recovery of outstanding loans which reflected in reduction of overdues.
C] Large Sized Adivasi Multipurpose Societies (LAMPS) -
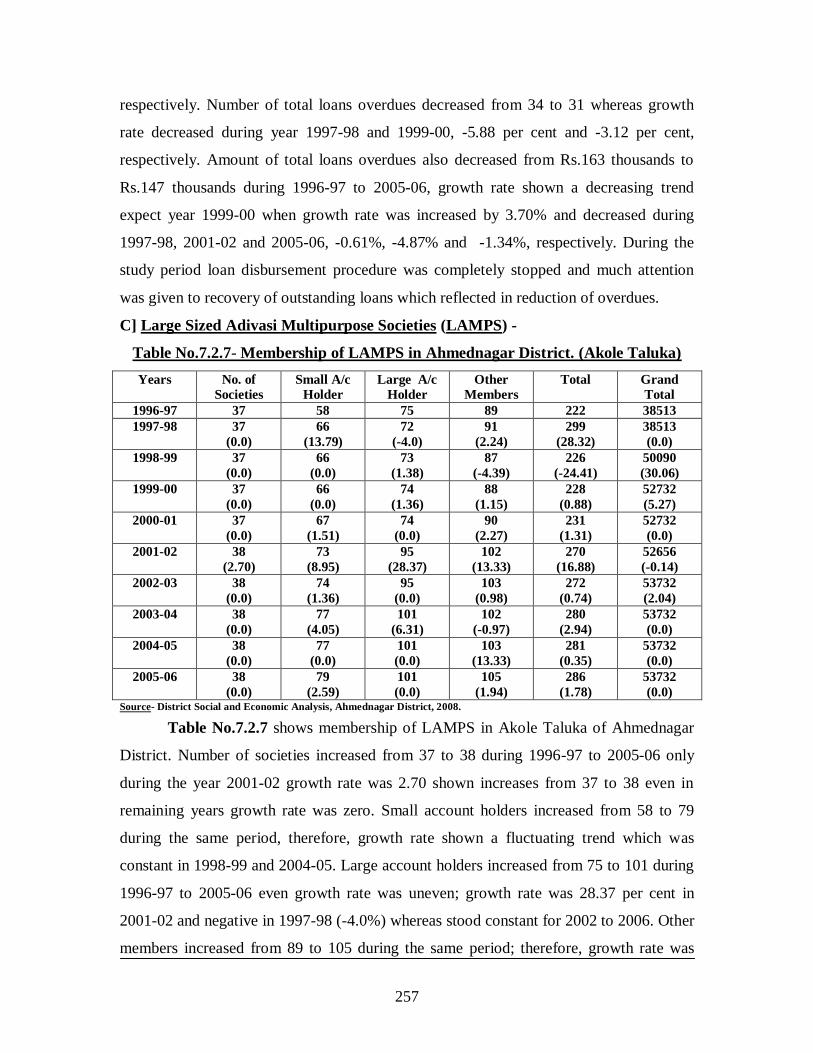
Table No.7.2.7- Membership of LAMPS in Ahmednagar District. (Akole Taluka)
Years No. of
Societies
Small A/c
Holder
Large A/c
Holder
Other
Members
Total Grand
Total
1996-97 37 58 75 89 222 38513
1997-98 37
(0.0)
66
(13.79)
72
(-4.0)
91
(2.24)
299
(28.32)
38513
(0.0)
1998-99 37
(0.0)
66
(0.0)
73
(1.38)
87
(-4.39)
226
(-24.41)
50090
(30.06)
1999-00 37
(0.0)
66
(0.0)
74
(1.36)
88
(1.15)
228
(0.88)
52732
(5.27)
2000-01 37
(0.0)
67
(1.51)
74
(0.0)
90
(2.27)
231
(1.31)
52732
(0.0)
2001-02 38
(2.70)
73
(8.95)
95
(28.37)
102
(13.33)
270
(16.88)
52656
(-0.14)
2002-03 38
(0.0)
74
(1.36)
95
(0.0)
103
(0.98)
272
(0.74)
53732
(2.04)
2003-04 38
(0.0)
77
(4.05)
101
(6.31)
102
(-0.97)
280
(2.94)
53732
(0.0)
2004-05 38
(0.0)
77
(0.0)
101
(0.0)
103
(13.33)
281
(0.35)
53732
(0.0)
2005-06 38
(0.0)
79
(2.59)
101
(0.0)
105
(1.94)
286
(1.78)
53732
(0.0) Source- District Social and Economic Analysis, Ahmednagar District, 2008.
Table No.7.2.7 shows membership of LAMPS in Akole Taluka of Ahmednagar
District. Number of societies increased from 37 to 38 during 1996-97 to 2005-06 only
during the year 2001-02 growth rate was 2.70 shown increases from 37 to 38 even in
remaining years growth rate was zero. Small account holders increased from 58 to 79
during the same period, therefore, growth rate shown a fluctuating trend which was
constant in 1998-99 and 2004-05. Large account holders increased from 75 to 101 during
1996-97 to 2005-06 even growth rate was uneven; growth rate was 28.37 per cent in
2001-02 and negative in 1997-98 (-4.0%) whereas stood constant for 2002 to 2006. Other
members increased from 89 to 105 during the same period; therefore, growth rate was

258
fluctuating. Total members of LAMPS increased from 222 to 286 from 1996-97 to 2005-
06, shown a fluctuating growth rate which was negative in 1998-99 (-24.41%). Grand
total of these societies increased from 38513 to 53732 during the same period of
economic reform, growth shown a fluctuating trend over the period which was negative
in 2001-02 (-0.14%) and shown increase in 1999-00 and 2002-03, 5.27 per cent and 2.04
per cent, respectively, and constant for other years showing zero growth rate.
Table No.7.2.10- Share Capital of LAMPS in Ahmednagar Dist. (Akole Taluka)
(Rs. in Thousands)
Years No. of
Societies
Share
Capital
of which
Govt.
Reserve &
Other Funds
Borrowings
Loans
Working
Capital
1996-97 37 6967 714 678 19925 36690
1997-98 37
(0.0)
7547
(8.32)
648
(-9.24)
1627
(139.97)
32806
(64.64)
50774
(38.38)
1998-99 37
(0.0)
8376
(10.98)
504
(-22.22)
473
(-70.92)
41468
(26.40)
58532
(15.28)
1999-00 37
(0.0)
8414
(6.45)
452
(-10.31)
388
(-17.97)
41035
(-1.04)
65902
(12.60)
2000-01 37
(0.0)
10301
(22.39)
966
(113.71)
417
(7.47)
55580
(35.44)
82670
(25.43)
2001-02 38
(2.70)
12440
(20.76)
828
(-14.28)
529
(26.85)
66343
(19.36)
98425
(19.05)
2002-03 38
(0.0)
12570
(1.04)
825
(-0.36)
545
(3.02)
76894
(15.90)
115310
(17.15)
2003-04 38
(0.0)
12610
(0.31)
815
(-1.21)
839
(53.94)
77060
(0.21)
121470
(5.34)
2004-05 38
(0.0)
16700
(32.43)
620
(-23.92)
502
(-40.16)
90764
(17.78)
127963
(5.34)
2005-06 38
(0.0)
22898
(37.11)
6820
(10.00)
845
(68.32)
58901
(-35.10)
137786
(7.66)
Source- District Social and Economic Analysis, Ahmednagar District, 2008.
Table No.7.2.10 shows the progress of share capital of LAMPS in Akole Taluka
of Ahmednagar district during 1996-97 to 2005-06. Number of societies increased from
37 to 38 during 1996-97 to 2005-06 only during the year 2001-02 growth rate was 2.70
per cent showed increase from 37 to 38 even in remaining year‟s growth rate was zero.
Share capital of these societies increased from Rs.6967 thousands to Rs.22898 thousands
during the same period, therefore, growth rate shown a fluctuating trend over the period.
Contribution of government to share capital also increased from Rs.714 thousands to
Rs.6820 thousands during the same period; however, growth rate was uneven and
negative except years 2000-01 and 2005-06, 113.71 per cent and 10.00 per cent,
259
respectively. Reserve and funds increased from Rs.678 thousands to Rs.845 thousands
during 1996-97 to 2005-06; therefore, growth showed a fluctuating trend it was negative
for 1998 to 2000 and in 2004-05. Borrowings loans increased from Rs.19925 thousands
to Rs.58901 thousands during the same period, growth was uneven, it was shown
negative growth during 1999-00 (-1.04%) and in 2005-06 (-35.10%). Working capital of
the societies increased from Rs.36690 thousands to Rs.137786 thousands during the same
period which shown a fluctuating trend in growth rate therefore growth rate was positive
over the period.
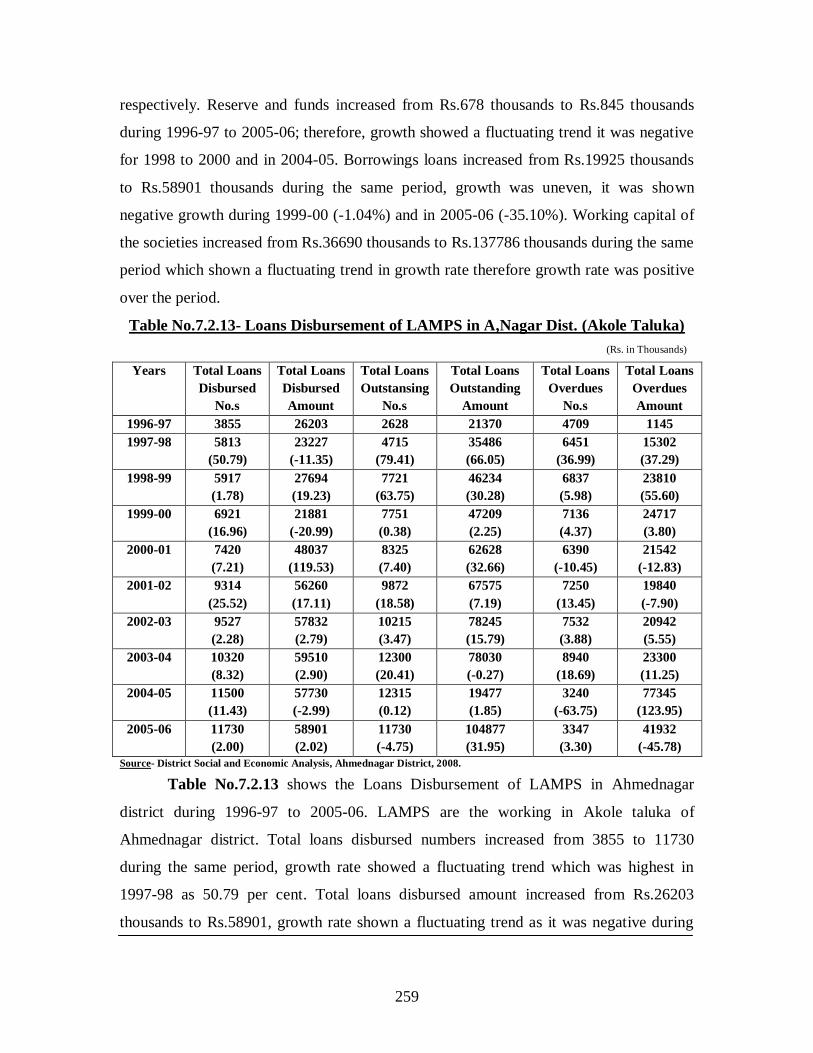
Table No.7.2.13- Loans Disbursement of LAMPS in A,Nagar Dist. (Akole Taluka)
(Rs. in Thousands)
Years Total Loans
Disbursed
No.s
Total Loans
Disbursed
Amount
Total Loans
Outstansing
No.s
Total Loans
Outstanding
Amount
Total Loans
Overdues
No.s
Total Loans
Overdues
Amount
1996-97 3855 26203 2628 21370 4709 1145
1997-98 5813
(50.79)
23227
(-11.35)
4715
(79.41)
35486
(66.05)
6451
(36.99)
15302
(37.29)
1998-99 5917
(1.78)
27694
(19.23)
7721
(63.75)
46234
(30.28)
6837
(5.98)
23810
(55.60)
1999-00 6921
(16.96)
21881
(-20.99)
7751
(0.38)
47209
(2.25)
7136
(4.37)
24717
(3.80)
2000-01 7420
(7.21)
48037
(119.53)
8325
(7.40)
62628
(32.66)
6390
(-10.45)
21542
(-12.83)
2001-02 9314
(25.52)
56260
(17.11)
9872
(18.58)
67575
(7.19)
7250
(13.45)
19840
(-7.90)
2002-03 9527
(2.28)
57832
(2.79)
10215
(3.47)
78245
(15.79)
7532
(3.88)
20942
(5.55)
2003-04 10320
(8.32)
59510
(2.90)
12300
(20.41)
78030
(-0.27)
8940
(18.69)
23300
(11.25)
2004-05 11500
(11.43)
57730
(-2.99)
12315
(0.12)
19477
(1.85)
3240
(-63.75)
77345
(123.95)
2005-06 11730
(2.00)
58901
(2.02)
11730
(-4.75)
104877
(31.95)
3347
(3.30)
41932
(-45.78)
Source- District Social and Economic Analysis, Ahmednagar District, 2008.
Table No.7.2.13 shows the Loans Disbursement of LAMPS in Ahmednagar
district during 1996-97 to 2005-06. LAMPS are the working in Akole taluka of
Ahmednagar district. Total loans disbursed numbers increased from 3855 to 11730
during the same period, growth rate showed a fluctuating trend which was highest in
1997-98 as 50.79 per cent. Total loans disbursed amount increased from Rs.26203
thousands to Rs.58901, growth rate shown a fluctuating trend as it was negative during
260
years 1997-98, 1999-00 and in 2004-05, -11.35%, -20.99% and -2.02%, respectively.
Total loans outstanding numbers increased from 2628 to 11730 during 1996-97 to 2005-
06, growth rate was uneven which was negative during year 2005-06 (-4.75%) and
highest during 1997-98 (79.41%). Total loans outstanding increased from Rs.21370
thousands to Rs.104877 thousands, therefore, growth rate shown a fluctuating trend
where it was negative during 2003-04 as (-0.27%). Number of total loans overdues of the
society decreased from 4709 to 3347 during the same period, growth rate was uneven and
negative during years 2000-01 and 2004-05, -10.45 per cent and -63.75 per cent,
respectively. Total loans overdues amount increased from Rs.1145 thousands to
Rs.41932 thousands during the same period, therefore, growth rate shown a fluctuating
trend where it was negative during 2000-01, 2001-02 and 2005-06, -12.83%, -7.90% and
-45.78%, respectively. Overdues amount shown a high increase in year 2004-05 where
growth rate was 123.95 per cent and amount stood on Rs.77354 thousnads, afterwards it
reduced to Rs.41932 thousands and growth rate reduced by -45.78 per cent, therefore, the
amount of overdues is quite high and need some deliberate action to overcome on it.
7.3- NON- AGRICULTURAL CREDIT CO-OPERATIVE SOCIETIES-
The co-operative movement which was started as a credit movement for the rural
masses could not remain confined to those areas only. It soon realized that like Germany,
non- agricultural credit societies could also be established in the urban areas for the
purpose of providing cheaper credit to small traders, employers, artisans and the middle
class men. Thus, the co-operative movement also spread to the urban and semi-urban
areas and co-operative societies were formed by the different groups of people in these
areas. In Ahmednagar district non-agricultural co-operative credit societies have made a
considerable progress after independence and in study period from 1996-97 to 2005-06.
These provides finance to promote development through the given loans for self-
employment, trades, small scale industries, etc. they also provide special attention to the
weaker sections and neglected sectors of the economy. Loans given by the banks are the
most effective tool in the hands of the bank for the quick development of the region.
Credit co-operatives advanced loans against personal security, collateral security of
moveable and immovable property, marketable commodities, warehouse receipts, gold-
261
silver ornaments, constructed houses, government securities, approved shares,
debentures, fixed deposits, etc.
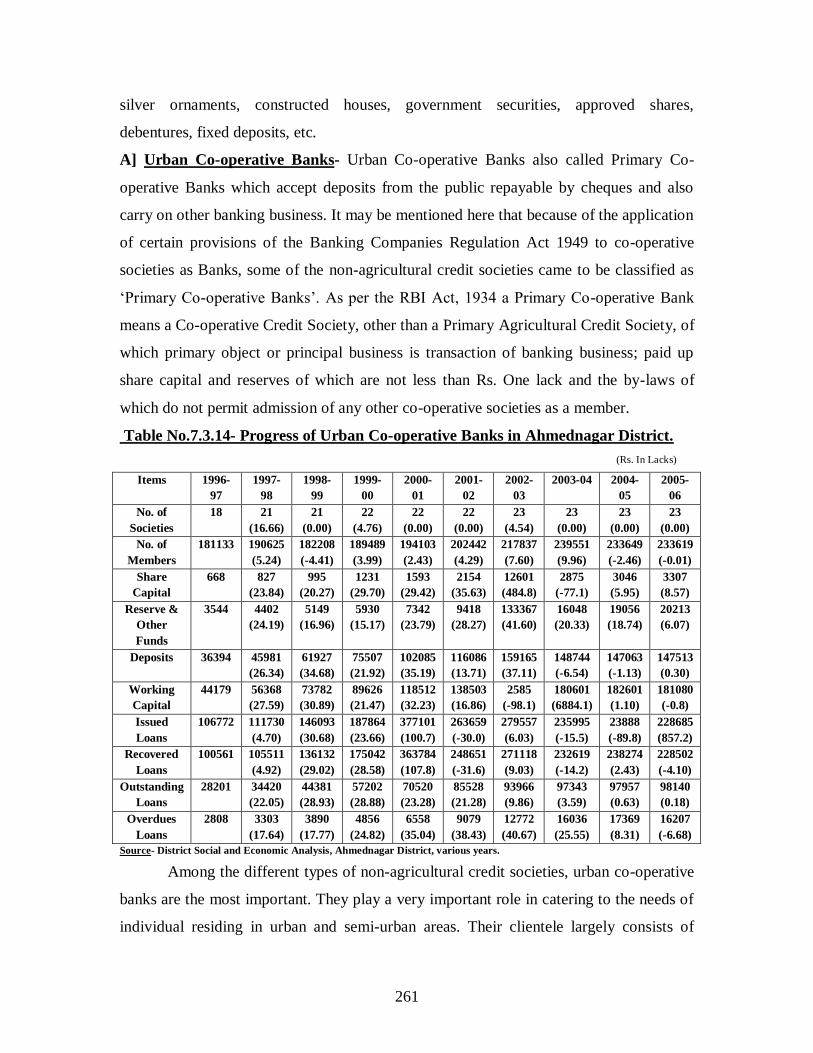
A] Urban Co-operative Banks- Urban Co-operative Banks also called Primary Co-
operative Banks which accept deposits from the public repayable by cheques and also
carry on other banking business. It may be mentioned here that because of the application
of certain provisions of the Banking Companies Regulation Act 1949 to co-operative
societies as Banks, some of the non-agricultural credit societies came to be classified as
„Primary Co-operative Banks‟. As per the RBI Act, 1934 a Primary Co-operative Bank
means a Co-operative Credit Society, other than a Primary Agricultural Credit Society, of
which primary object or principal business is transaction of banking business; paid up
share capital and reserves of which are not less than Rs. One lack and the by-laws of
which do not permit admission of any other co-operative societies as a member.
Table No.7.3.14- Progress of Urban Co-operative Banks in Ahmednagar District.
(Rs. In Lacks)
Items 1996-
97
1997-
98
1998-
99
1999-
00
2000-
01
2001-
02
2002-
03
2003-04 2004-
05
2005-
06
No. of
Societies
18 21
(16.66)
21
(0.00)
22
(4.76)
22
(0.00)
22
(0.00)
23
(4.54)
23
(0.00)
23
(0.00)
23
(0.00)
No. of
Members
181133 190625
(5.24)
182208
(-4.41)
189489
(3.99)
194103
(2.43)
202442
(4.29)
217837
(7.60)
239551
(9.96)
233649
(-2.46)
233619
(-0.01)
Share
Capital
668 827
(23.84)
995
(20.27)
1231
(29.70)
1593
(29.42)
2154
(35.63)
12601
(484.8)
2875
(-77.1)
3046
(5.95)
3307
(8.57)
Reserve &
Other
Funds
3544 4402
(24.19)
5149
(16.96)
5930
(15.17)
7342
(23.79)
9418
(28.27)
133367
(41.60)
16048
(20.33)
19056
(18.74)
20213
(6.07)
Deposits 36394 45981
(26.34)
61927
(34.68)
75507
(21.92)
102085
(35.19)
116086
(13.71)
159165
(37.11)
148744
(-6.54)
147063
(-1.13)
147513
(0.30)
Working
Capital
44179 56368
(27.59)
73782
(30.89)
89626
(21.47)
118512
(32.23)
138503
(16.86)
2585
(-98.1)
180601
(6884.1)
182601
(1.10)
181080
(-0.8)
Issued
Loans
106772 111730
(4.70)
146093
(30.68)
187864
(23.66)
377101
(100.7)
263659
(-30.0)
279557
(6.03)
235995
(-15.5)
23888
(-89.8)
228685
(857.2)
Recovered
Loans
100561 105511
(4.92)
136132
(29.02)
175042
(28.58)
363784
(107.8)
248651
(-31.6)
271118
(9.03)
232619
(-14.2)
238274
(2.43)
228502
(-4.10)
Outstanding
Loans
28201 34420
(22.05)
44381
(28.93)
57202
(28.88)
70520
(23.28)
85528
(21.28)
93966
(9.86)
97343
(3.59)
97957
(0.63)
98140
(0.18)
Overdues
Loans
2808 3303
(17.64)
3890
(17.77)
4856
(24.82)
6558
(35.04)
9079
(38.43)
12772
(40.67)
16036
(25.55)
17369
(8.31)
16207
(-6.68)
Source- District Social and Economic Analysis, Ahmednagar District, various years.
Among the different types of non-agricultural credit societies, urban co-operative
banks are the most important. They play a very important role in catering to the needs of
individual residing in urban and semi-urban areas. Their clientele largely consists of
262
persons of small industrialists, artisans, traders, merchants, hawkers, salaried and
professional classes. Providing loan is the most important function of the co-operative
credit movement.
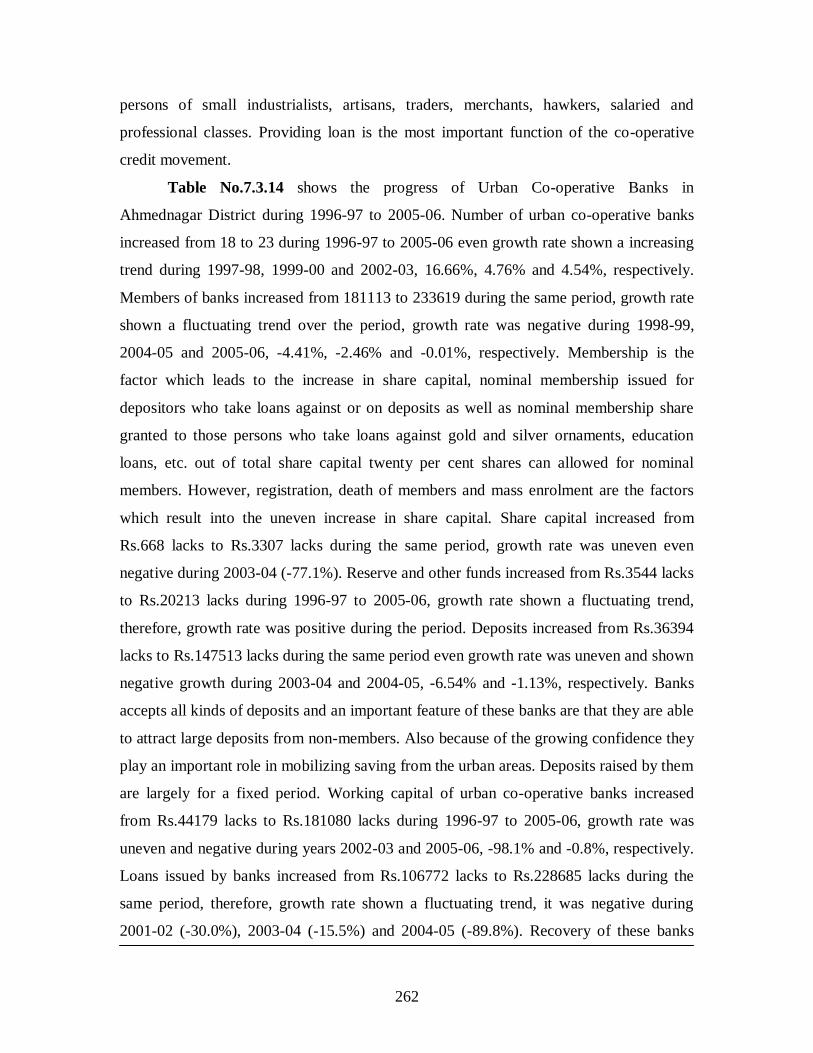
Table No.7.3.14 shows the progress of Urban Co-operative Banks in
Ahmednagar District during 1996-97 to 2005-06. Number of urban co-operative banks
increased from 18 to 23 during 1996-97 to 2005-06 even growth rate shown a increasing
trend during 1997-98, 1999-00 and 2002-03, 16.66%, 4.76% and 4.54%, respectively.
Members of banks increased from 181113 to 233619 during the same period, growth rate
shown a fluctuating trend over the period, growth rate was negative during 1998-99,
2004-05 and 2005-06, -4.41%, -2.46% and -0.01%, respectively. Membership is the
factor which leads to the increase in share capital, nominal membership issued for
depositors who take loans against or on deposits as well as nominal membership share
granted to those persons who take loans against gold and silver ornaments, education
loans, etc. out of total share capital twenty per cent shares can allowed for nominal
members. However, registration, death of members and mass enrolment are the factors
which result into the uneven increase in share capital. Share capital increased from
Rs.668 lacks to Rs.3307 lacks during the same period, growth rate was uneven even
negative during 2003-04 (-77.1%). Reserve and other funds increased from Rs.3544 lacks
to Rs.20213 lacks during 1996-97 to 2005-06, growth rate shown a fluctuating trend,
therefore, growth rate was positive during the period. Deposits increased from Rs.36394
lacks to Rs.147513 lacks during the same period even growth rate was uneven and shown
negative growth during 2003-04 and 2004-05, -6.54% and -1.13%, respectively. Banks
accepts all kinds of deposits and an important feature of these banks are that they are able
to attract large deposits from non-members. Also because of the growing confidence they
play an important role in mobilizing saving from the urban areas. Deposits raised by them
are largely for a fixed period. Working capital of urban co-operative banks increased
from Rs.44179 lacks to Rs.181080 lacks during 1996-97 to 2005-06, growth rate was
uneven and negative during years 2002-03 and 2005-06, -98.1% and -0.8%, respectively.
Loans issued by banks increased from Rs.106772 lacks to Rs.228685 lacks during the
same period, therefore, growth rate shown a fluctuating trend, it was negative during
2001-02 (-30.0%), 2003-04 (-15.5%) and 2004-05 (-89.8%). Recovery of these banks

263
increased from Rs.100561 lacks to Rs.228502 lacks during 1996-97 to 2005-06,
therefore, growth rate shown a fluctuating trend as growth rate was negative during 2001-
02, 2003-04 and 2004-05, -31.0%, -15.5% and -89.8%, respectively. Outstanding loans
increased from Rs.28201 lacks to Rs.98140 lacks during the same period, even growth
rate was uneven and showed outstanding amounts have increasing over the period.
Overdues loan amount also increased from Rs.2808 lacks to Rs.16207 lacks during 1996-
97 to 2005-06, therefore, growth rate shown a fluctuating trend over the period whereas
during last year of study it reduced with -6.68 per cent growth rate other year overdues
amount have increased.
Table No.7.3.15- Progress of Employees Credit Societies & Others in A’Nagar Dist.
(Rs. In Lacks)
Items 1996-
97
1997-
98
1998-
99
1999-
00
2000-
01
2001-
02
2002-
03
2003-04 2004-
05
2006-
06
No. of
Societies
01 01
(0.0)
01
(0.0)
01
(0.0)
01
(0.0)
01
(0.0)
01
(0.0)
01
(0.0)
01
(0.0)
01
(0.0)
No. of
Members
10139 10407
(2.6)
10833
(4.09)
10850
(0.1)
10640
(-1.9)
10582
(-0.5)
10345
(-2.24)
10090
(-2.46)
9891
(-1.97)
9778
(-1.14)
Share
Capital
308 451
(46.3)
607
(34.5)
831
(36.7)
891
(7.3)
891
(-0.04)
773
(-13.1)
881
(13.8)
902
(2.43)
935
(3.66)
Reserve &
Other Funds
170 209
(23.1)
289
(38.1)
345
(19.2)
1115
(223.1)
583
(-47.2)
10431
(78.9)
980
(-5.08)
1019
(3.97)
1146
(12.4)
Deposits 3668 4325
(17.9)
5225
(20.8)
6575
(25.8)
7920
(20.4)
8968
(13.2)
12684
(41.4)
11743
(-7.41)
12613
(7.40)
12974
(0.28)
Working
Capital
4568 5378
(17.7)
6534
(21.5)
8708
(33.2)
10129
(16.3)
114551
(13.08)
884
(-92.2)
14121
(1496.3)
14985
(6.12)
1991
(-86.7)
Issued Loans 3438 3227
(8.4)
5697
(52.8)
7464
(31.0)
7889
(5.68)
8395
(6.41)
8856
(5.49)
10418
(17.64)
11826
(13.5)
12593
(6.48)
Recovered
Loans
3102 3446
(11.0)
4564
(32.4)
5597
(22.6)
6883
(22.9)
7385
(7.29)
8561
(15.2)
9786
(14.30)
10511
(7.40)
11646
(10.7)
Outstanding
Loans
3284 3566
(8.5)
4698
(31.7)
6566
(39.7)
7571
(15.3)
8581
(13.33)
8875
(3.43)
9507
(7.12)
10822
(13.8)
11769
(8.74)
Overdues
Loans
3.13 3.23
(3.1)
5.87
(81.7)
6.28
(6.3)
7.75
(23.4)
8.84
(14.06)
9.32
(5.43)
11.79
(26.50)
8.97
(-23.9)
9.19
(2.45) Source- District Social and Economic Analysis, Ahmednagar District, various years.
Table No.7.3.15 shows the progress of Employees Credit Societies & Others in
Ahmednagar District during 1996-97 to 2005-06. Number of societies stood during year
1996-97 as 01 stood constant during 2005-06. Number of members decreased from
10139 to 9778 during the same period, growth rate shown a fluctuating trend, however,
after year 2000-01 growth rates showed a negative growth up to 2006-07. Share capital

264
increased from Rs.308 lacks to Rs.935 lacks during 1996-97 to 2005-06, even growth rate
was uneven and shown negative growth during 2001-02 and 2002-03, -0.04% and -
13.1%, respectively. Reserve and other funds of the societies also increased from Rs.170
lacks to Rs.1146 lacks, therefore, growth rate shown a fluctuating trend where during
year 2001-02 and 2003-04, -47.2% and -5.08%, respectively. Deposits increased from
Rs.3668 lacks to Rs.12974 lacks during the same period, even growth rate was uneven
and shown a negative trend for year 2003-04 as -7.41 per cent. Working capital decreased
from Rs.4568 lacks to Rs.1991 lacks during 1996-97 to 2005-06, growth rate shown a
fluctuating trend while during year 2002-03 and 2005-06 growth rate was negative as -
92.2% and -86.7%. Loans issued by these societies increased from Rs.3438 lacks to
Rs.12593 lacks during 1996-97 to 2005-06 as growth rate shown a fluctuating but
positive growth during the same period. Recovery of loans increased from Rs.3102 lacks
to Rs.11646 lacks during the same period, growth rate of recovery performance shown a
fluctuating trend therefore, growth rate was positive and showed a good progress.
Outstanding loans of these societies increased from Rs.3284 lacks to Rs.11769 lacks
during 1996-97 to 2005-06, therefore, growth rate shown a fluctuating trend but growth
rate was positive over the period. Overdues loans are also increased during the period
from Rs.3.13 lacks to Rs.9.19 lacks, growth rate showed a fluctuating trend and only
during year 2004-05 it shown a negative growth as -23.9 per cent, therefore, for other
period overdues amount shown a increasing trend over the period. Naturally, increasing
overdues affects the efficiency and profitability of the society, which is a cause to
increase non-performing amount.
Table No.7.3.16- Progress of Employees Credit Societies in Ahmednagar District.
(Rs. In Lacks)
Items 1996-
97
1997-98 1998-
99
1999-
00
2000-
01
2001-
02
2002-
03
2003-
04
2004-
05
2005-
06
No. of
Societies
205
206
(0.48)
211
(2.42)
213
(0.94)
211
(-0.93)
212
(0.47)
213
(0.47)
210
(-1.40)
210
(0.00)
212
(0.95)
No. of
Members
72130 76237
(5.69)
77370
(1.48)
79429
(2.66)
80437
(1.27)
82139
(2.11)
86203
(4.94)
97664
(13.29)
99011
(1.38)
99953
(0.95)
Share
Capital
5125 6712
(31.06)
7875
(17.25)
8162
(3.63)
9973
(22.18)
10493
(5.20)
5512
(-47.4)
13851
(151.2)
14306
(3.28)
56143
(292.4)
Reserve &
Other
Funds
1181 1598
(35.28)
1815
(13.59)
1956
(7.74)
2236
(14.33)
3409
(52.40)
13015
(281.7)
6155
(-52.7)
6276
(1.96)
49746
(692.5)
(Continue…)

265
Deposits 2135 2170
(1.62)
2923
(34.72)
3121
(6.77)
3519
(12.67)
10676
(203.3)
50173
(369.9)
18086
(-63.5)
18218
(0.72)
18391
(0.95)
Working
Capital
15663 17291
(10.30)
19946
(15.35)
21791
(9.25)
39806
(82.66)
46577
(17.00)
11892
(-74.4)
54456
(357.9)
55336
(1.61)
55863
(0.95)
Issued
Loans
5940 12099
(103.65)
13892
(14.82)
15385
(10.74)
48365
(214.3)
35820
(-25.9)
48119
(34.33)
35504
(-26.2)
28458
(-19.8)
28729
(0.95)
Recovered
Loans
5509 10730
(94.75)
12243
(14.10)
13894
(13.49)
30677
(120.7)
32941
(7.38)
46547
(345.1)
32992
(-29.1)
27277
(-17.3)
27537
(0.95)
Outstanding
Loans
11240 12609
(12.18)
14258
(13.08)
15749
(10.45)
33437
(112.3)
36316
(8.01)
37888
(4.32)
38400
(1.35)
39581
(3.07)
407202
(928.7)
Overdues
Loans
185 275
(48.70)
544
(97.55)
836
(53.54)
1719
(105.5)
3419
(98.90)
3025
(-11.5)
979
(-67.6)
1176
(20.12)
1188
(0.95)
Source- District Social and Economic Analysis, Ahmednagar District, various years.
Table No.7.3.16 shows the progress of Employees Credit Societies in
Ahmednagar District during the years 1996-97 to 2005-06. Number of societies increased
from 205 to 212 during the same period, growth rate was uneven and shown a negative
growth in year 2000-01 (-0.93%) and in 2003-04 (-1.40%). Membership increased from
72130 to 99953 during 1996-97 to 2005-06, growth rate shown a fluctuating trend over
the period, therefore, growth rate was positive. Share capital increased from Rs.5125
lacks to Rs.56143 lacks during the same period, even growth rate was uneven and shown
a negative trend during year 2002-03 as -47.4 per cent. Reserve and other funds increased
from Rs.1181 lacks to Rs.49746 lacks during the same period; therefore, growth rate was
uneven and shown negative growth during year 2003-04 as -52.7 per cent. Deposits
increased from Rs.2135 lacks to Rs.18391 lacks during 1996-97 to 2005-06, even growth
rate was uneven which was highest in year 2002-03 as 369.9% and negative in year 2003-
04 as -63.5%. Working capital increased from Rs.15663 lacks to Rs.55863 lacks during
the same period, therefore, growth rate shown a fluctuating trend which was negative
during year 2002-03 (-74.4 per cent). Loans issued by employee‟s credit societies during
1996-97 to 2005-06 increased from Rs.5940 lacks to Rs.28729 lacks, therefore, growth
rate was uneven and negative during 2001-02, 2003-04 and 2004-05, -25.9 per cent, -26.2
per cent and -19.8 per cent, respectively. Recovery of loans increased from Rs.5509 lacks
to Rs.27537 lacks during the same period, growth rate shown a fluctuating trend and
negative for years 2003-04 (-29.1%) and in year 2004-05 (-17.3%), recovery was
incredible during year 2000-01 as 120.7 per cent. Outstanding loans increased from
Rs.11240 lacks to Rs.407202 lacks, even growth rate was uneven and recorded highest in
2000-01 and 2005-06, 112.3 per cent and 928.7 per cent, respectively. Overdues loans

266
amount also increased from Rs.185 lacks to Rs.1188 lacks during the same period,
growth rate shown a fluctuating trend over the period, growth rate showed that overdue
amount reduced during years 2002-03 and 2003-04, -11.5% and -67.6%, respectively.
Table No.7.3.17- Progress of Other (Urban Credit Societies) in Ahmednagar Dist.
(Rs. In Lacks)
Items 1996-
97
1997-
98
1998-
99
1999-00 2000-01 2001-02 2002-03 2003-
04
2004-05 2005-06
No. of
Societies
559 641
(14.66)
713
(11.23)
796
(11.64)
820
(3.01)
906
(10.48)
1006
(11.03)
1029
(2.28)
1042
(1.26)
1009
(-3.60)
No. of
Members
24828
7
295200
(18.89)
329491
(11.61)
355423
(7.87)
369241
(3.88)
446519
(20.92)
487397
(9.15)
593911
(21.85)
604631
(1.80)
605840
(0.20)
Share
Capital
1142 1695
(48.39)
1866
(10.11)
2266
(21.43)
2637
(16.36)
7184
(172.3)
12278
(70.91)
7708
(-37.22)
8045
(4.37)
8061
(0.20)
Reserve
& Other
Funds
726 1986
(173.6)
2617
(31.76)
4339
(65.80)
6116
(40.95)
9514
(55.55)
89722
(842.9)
8683
(-90.32)
12232
(40.86)
12256
(0.20)
Deposits 7935 14858
(87.24)
17803
(19.81)
20822
(16.96)
39506
(89.72)
53301
(34.91)
122958
(130.88)
114173
(-7.14)
132844
(16.35)
133110
(0.20)
Working
Capital
16030 23858
(48.83)
30276
(26.89)
37543
(24.00)
59928
(49.62)
76899
(28.32)
7091
(-90.77)
147556
(1980.)
170160
(15.31)
170510
(0.20)
Issued
Loans
9517 15230
(60.02)
17074
(12.10)
20780
(21.70)
36471
(75.50)
42945
(17.75)
75257
(75.24)
82604
(9.76)
91354
(10.59)
93146
(1.96)
Recovere
d Loans
8272 9014
(8.97)
14722
(63.31)
17469
(18.66)
22970
(31.49)
30751
(33.87)
50079
(62.85)
68903
(37.58)
79126
(14.83)
80678
(1.96)
Outstandi
ng Loans
9942 16158
(62.51)
18510
(14.55)
21821
(17.88)
35321
(61.87)
47515
(34.52)
72692
(53.00)
86394
(80.84)
98655
(14.19)
111089
(12.60)
Overdues
Loans
1215 2244
(84.64)
2887
(28.67)
4045
(40.08)
9982
(146.7)
17728
(77.59)
24586
(38.68)
18639
(-24.59)
18737
(0.53)
18325
(-2.19)
Source- District Social and Economic Analysis, Ahmednagar District, various years.
Table No.7.3.17 shows the progress of Other (Urban Credit Societies) in
Ahmednagar District during the years 1996-97 to 2005-06. Number of societies increased
from 559 to 1009 during the same period, growth rate shown a fluctuating trend over the
period as it was negative during year 2005-06 as -3.60 per cent. Membership increased
from 248287 to 605840 during 1996-97 to 2005-06, growth rate was fluctuating but
positive. Share capital increased from Rs.1142 lacks to Rs.8061 lacks, whereas growth
rate was uneven and negative during year 2003-04 as -37.22 per cent and recorded
highest in year 2001-02 as 172.3 per cent. Reserve and other funds increased from Rs.726
lacks to Rs.12256 lacks during 1996-97 to 2005-06, growth rate was uneven and was
negative during 2003-04 as -90.32 per cent. deposits increased from Rs.7935 lacks to
Rs.133110 lacks during the same period, growth rate shown a fluctuating trend as it was
negative for year 2003-04 (-7.14%), growth rate showed that deposits mobilized

267
positively except year 2003-04, which was highest in 2002-03 as 130.88 per cent.
Working capital increased from Rs.16030 lacks to Rs.170510 lacks during the same
period, growth rate showed fluctuating trend and shown negative growth during year
2202-03 as -90.77 per cent. Loans issued increased from Rs.9517 lacks to Rs.93146 lacks
during 1996-97 to 2005-06, which growth shown a fluctuating but positive growth.
Recovery of loans increased from Rs.8272 lacks to Rs.80678 lacks during 1996-97 to
2005-06, growth rate was uneven, therefore, growth was positive all over the period,
recovery performance increases the financial health of the any society, naturally, it is
must to keep this going on. Outstanding loans increased from Rs.9942 lacks to Rs.111089
lacks during the same period, growth rate was fluctuating, therefore, shown a positive
trend for all over the period. Amount of overdues loans increased from Rs.1215 lacks to
Rs.18325 lacks during 1996-97 to 2005-06, growth rate shown a fluctuating trend over
the period, which shown a negative growth during year 2003-04 and 2005-06, -24.59%
and -2.19%, respectively. Overdues loans shown a decreasing trend after year 2003-04,
therefore, much more progress in recovery is essential.
7.4 - MARKETING CO-OPERATIVE SOCIETIES-
Marketing co-operative societies works to control and maintain the price of
essential commodities at reasonable and affordable rates by undertaking procurement and
marketing of the essential goods produced by their members. They work in protecting the
benefits of consumers as well as producer members. Marketing co-operatives
involvement in the market brings stability to market prices and provides direct benefits
removing interference of middlemen and traders.
Marketing Co-operatives are established by agriculturists to undertake
transformation, packing, distribution and marketing of farm products crops as well as
livestock. Primary Marketing Societies provides their members inputs for agricultural
production, including seeds, fertilizers, fuel, and machinery services. Due to a large
number of small agriculturists‟ organization make it as a large business unit in the
market, getting the considerable advantages of economies of scale, that are not available
to its members individually. Aggregate purchase, storage and distribution of inputs for

268
agriculturists and output marketing as advantage of volume discount and utilization of
scale and increases bargaining power.
Table No.7.4.18- Progress of the District Marketing Societies in Ahmednagar.
(Rs. in Thousands)
Years No. of
Societies
No. of Members Working
Capital
Purchasing
Price
Selling Price
1996-97 01 694 N.A. 46440 N.A.
1997-98 01
(0.0)
703
(1.29)
7526
(--)
46900
(0.99)
46173
(--)
1998-99 01
(0.0)
706
(0.42)
8444
(12.19)
50798
(8.31)
33194
(-28.11)
1999-00 01
(0.0)
710
(0.56)
10052
(19.04)
51693
(-2.29)
49956
(50.49)
2000-01 01
(0.0)
713
(0.42)
7757
(-22.88)
3647
(-92.94)
33888
(-32.16)
2001-02 01
(0.0)
713
(0.0)
13794
(77.94)
30774
(743.81)
22437
(-33.79)
2002-03 01
(0.0)
713
(0.0)
14645
(6.17)
3151
(-89.76)
4205
(-81.25)
2003-04 01
(0.0)
713
(0.0)
14659
(0.09)
3171
(0.63)
4295
(2.14)
2004-05 01
(0.0)
713
(0.0)
14952
(1.99)
3179
(0.25)
4970
(15.71)
2005-06 01
(0.0)
713
(0.0)
15027
(0.50)
3210
(0.97)
10091
(103.03) Source- District Social and Economic Analysis, Ahmednagar District, 2008.
Table No.7.4.18 shows the progress of the District Marketing Societies in
Ahmednagar district during 1996-97 to 2005-06. Number of societies stood constant on
one number for 1996-97 to 2005-06, naturally growth rate was zero. Number of members
increased from 694 to 713 during the same period, therefore, growth was uneven and
growth happened during first half from 1996-97 to 2000-01 as 694 to 713, afterwards it
was constant. Working capital increased from Rs.7526 thousands to Rs.15027 thousands
during 1997-98 to 2005-06, even growth rate was uneven and recorded negative for year
2000-01 as -22.88 per cent and for other year it was positive. Purchasing price of district
marketing society during year 1996-97 to 2005-06 decreased from Rs.46440 thousands to
Rs.3210 thousands, growth rate shown a fluctuating trend which was negative during
1999-00, 2000-01 and 2002-03, as -2.29%, -92.94% and -89.76%, respectively. Business
of district marketing society has shown a decreasing trend over the period in economic
reforms. Selling price also decreased from Rs.46173 thousands to Rs.10091 thousands
during 1997-98 to 2005-06, growth shown a fluctuating trend which was negative during
1998-99, 2000-01, 2001-02 and 2002-03, as -28.11%, -32.16%, -33.79%, and -81.25%,

269
respectively. It is observed from table that purchasing price and selling price is declined
during the period shows that district marketing society is failing to do progress.
Table No.7.4.19- Progress of the Primary Marketing Societies in Ahmednagar.
(Rs. in Thousands)
Years No. of
Societies
No. of Members Working
Capital
Purchasing
Price
Selling Price
1996-97 12 26001 67201 345425 N.A.
1997-98 47
(291.66)
29685
(14.16)
124138
(84.72)
382391
(10.70)
382892
(--)
1998-99 47
(0.0)
29608
(-0.26)
139029
(11.99)
489067
(27.89)
520713
(35.99)
1999-00 47
(0.0)
29880
(0.91)
162144
(16.62)
512989
(4.89)
505283
(-2.96)
2000-01 50
(6.38)
30190
(1.03)
161405
(-0.45)
451114
(-12.06)
494342
(-2.16)
2001-02 50
(0.0)
31559
(4.53)
165019
(2.24)
565198
(25.29)
425484
(-13.93)
2002-03 52
(4.00)
31587
(0.08)
172863
(4.75)
365363
(-35.18)
379310
(-10.85)
2003-04 55
(5.77)
31936
(1.10)
174572
(0.98)
369872
(0.95)
114376
(-69.84)
2004-05 57
(3.63)
32734
(2.49)
193369
(10.76)
378973
(2.46)
391666
(242.43)
2005-06 56
(-1.75)
32155
(-1.77)
202608
(4.77)
392178
(3.48)
569689
(45.45)
Source- District Social and Economic Analysis, Ahmednagar District, 2008.
Table No.7.4.19 shows the progress of the Primary Marketing Societies in
Ahmednagar district during 1996-97 to 2005-06. Number of societies increased from 12
to 56 during the same period, therefore, growth rate shown a fluctuating trend, growth
was affected during year 2005-06 as -1.75 per cent, growth rate shown constant growth
during 1998 to 2000 and 2001-02. Number of members increased from 26001 to 32155
during 1996-97 to 2005-06, even growth rate was uneven which was negative during
1998-99 (-0.26%) and 2005-06 (-1.77%). Working capital of primary marketing
societies increased from Rs.67201 thousands to Rs.202608 thousands during the same
period, therefore, growth rate fluctuating and negative for year 2000-01 as -0.45 per cent,
for other year there was positive growth rate. Credit co-operatives provide financing for
both working capital and investment to agriculturists members. Purchasing price
increased from Rs.345425 thousands to Rs.392178 thousands during the same period,
even growth rate was uneven and was negative during 2000-01 and 2002-03, as -12.06%

270
and -35.18%, respectively. Therefore, purchasing price does not shown much more
increase during the study period which is an economic reforms period. Selling price
increased from Rs.382892 thousands to Rs.569689 thousands during 1997-98 to 2005-06,
growth rate shown a fluctuating trend over the period where it was negative during years
1999-00, 2000-01, 2001-02 and 2002-03 and 2003-04, as -2.96%, -2.16%, -13.93%, -
10.85% and -69.84%, respectively. Growth rate showed that for five years growth rate
shown a negative trend besides this selling price increased during the period, therefore,
growth rate was shown a fluctuating trend over the period.
7.5- PRODUCTION CO-OPERATIVES –
Under industrial co-operatives production and processing co-operatives have
studied in present study. These co-operative formed with objectives that capital formation
in rural areas, employment generation, increase production, develop competitive capacity
and to promote entrepreneurship in rural areas. Co-operative helps to overcome on
difficulties like requirement of loans, raw material and marketing of finished production.
Production co-operatives generate more employment as well as additional earnings to
improve living standard of the rural poor.
Table No.7.5.20- Progress of Sugar Co-operative Factories in Ahmednagar District. (Weight in Thousand Metric Tonnes & Rs. In Lacks)
Year/
Items
No. of
Societies
No. of
Members
Share
Capital
Reserve
& Other
Funds
Working
Capital
Weight of
Produced
Sugar
Price of
Produced
Sugar
1996-97 15 210634 615274 113421 6253271 436.20 47961.00
1997-98 18
(20.00)
233746
(10.97)
724681
(17.78)
195496
(72.36)
6377452
(1.98)
462.10
(5.93)
50733.00
(5.78)
1998-99 15
(-16.66)
247123
(5.72)
751435
(3.69)
231766
(18.55)
6975119
(9.37)
521.00
(12.77)
58794.00
(15.89)
1999-00 15
(0.0)
251743
(1.87)
824617
(9.74)
286924
(23.80)
7324522
(5.00)
624.00
(19.77)
71315.34
(21.29)
2000-01 17
(13.33)
284171
(12.88)
914413
(10.89)
352811
(22.96)
9760694
(33.26)
971.00
(55.60)
11652.00
(-83.66)
2001-02 17
(0.0)
298417
(5.01)
995814
(8.90)
428192
(21.36)
10851275
(11.17)
745.17
(-23.27)
89426.00
(667.47)
2002-03 17
(0.0)
312597
(4.75)
1054733
(5.91)
468115
(9.32)
1120744
(-89.37)
432.46
(-41.96)
52841.35
(-40.91)
2003-04 17
(0.0)
314592
(0.63)
1060006
(0.50)
470456
(0.50)
1126347
(0.50)
316.87
(-26.72)
52841.35
(0.00)
2004-05 17
(0.0)
315600
(0.32)
1064203
(0.39)
470987
(0.11)
1128453
(0.18)
356.76
(12.58)
52912.65
(0.13)
2005-06 17
(0.0)
316462
(.027)
1066856
(0.25)
472793
(0.38)
1130724
(0.73)
387.90
(8.72)
52979.97
(0.12) Source- District Deputy Registrar, Co-operative Societies, Ahmednagar, Various Years.

271
Sugar co-operative factories play a major role in Ahmednagar District in the
socio-economic development of rural masses. Sugar co-operative factories in
Ahmednagar district made a phenomenal progress. Ahmednagar is known as a „Sugar
Bowl‟. The first Co-operative Sugar Factory in Maharashtra established in Ahmednagar
at Pravara-Nagar, Loni.
Table No.7.5.20 shows progress of Sugar Co-operative Factories in Ahmednagar
District during year 1996-97 to 2005-06. Number of factories stood on 15 in 1996-97
increased up to 17 during year 2005-06, showed a fluctuating growth trend which was
negative during year 1998-99 as -16.66 per cent and was highest during 1997-98 as 18
even stood constant for further years. Number of members increased from 210634 to
316462 during the same period; therefore, growth rate was fluctuating but positive for
entire period. Share capital increased from Rs.615274 lacks in 1996-97 to Rs.1066856
lacks during year 2005-06, even growth rate was uneven. Reserve and other funds
increased from Rs.113421 lacks to Rs.472793 lacks during the same period. Growth rate
of reserve and other funds showed a fluctuating trend over the period. Working capital of
sugar co-operative factories increased from Rs.6253271 lacks to Rs.1130724 lacks during
year 1996-97 to 2005-06, even growth rate shown a fluctuating trend, growth rate was
negative during year 2003-04 (-89.37%). Weight of produced sugar showed a decreasing
trend from 436.20 thousands metric tones to 387.90 thousands metric tones during year
1996-97 to 2005-06, therefore, growth rate shown a fluctuating trend which was negative
years 2001-02, 2002-03 and 2003-04, -23.27%, -41.96% and -26.72%, respectively. Price
of produced sugar increased from Rs.47961.00 lacks to Rs.52979.97 lacks during 1996-
97 to 2005-06, growth rate shown a fluctuating trend over the period which was negative
during 2000-01 and 2002-03, -83.66 per cent and -40.91 per cent, respectively. Sugar co-
operatives in Ahmednagar district facing the problem of under utilization of their
installed capacities as the capacity of production is high but the production and
productivity of agricultural sector is slow down leads of shortage of sugarcane, increased
use of sugarcane for alternative production of Gur and Khandsari and inadequacy of early
and later growing diversity of sugarcane. Due to these reasons the factories facing
problems of full utilization of capacity which resulted in decrease in profit or loss. Co-

272
operative sugar factories contribute substantially to the economic development of the
country in general and the co-operative sector in particular.
Table No.7.5.21- Progress of Co-operative Agricultural Processing Societies in
Ahmednagar District.
( Rs. In Lacks)
Year/ Items No. of
Societies
No. of
Members
Share Capital Reserve &
Other Funds
Working
Capital
1996-97 9 6520 6596 4273 26190
1997-98 8
(-11.11)
6559
(0.59)
6646
(0.75)
4843
(13.34)
28011
(6.95)
1998-99 9
(12.5)
7121
(8.56)
6889
(3.65)
5615
(15.94)
31116
(11.08)
1999-00 11
(22.22)
7249
(1.79)
7148
(3.76)
5963
(6.19)
32205
(3.50)
2000-01 11
(0.0)
8227
(13.49)
7316
(2.35)
6725
(12.78)
39991
(24.17)
2001-02 10
(-9.09)
6278
(-23.69)
6327
(-13.51)
8059
(19.83)
39328
(-1.65)
2002-03 10
(0.0)
7258
(15.61)
6286
(-0.64)
8301
(3.00)
34281
(-12.83)
2003-04 10
(0.0)
7294
(0.49)
6317
(0.49)
8343
(0.50)
34452
(0.49)
2004-05 10
(0.0)
7304
(0.13)
6348
(0.49)
8390
(0.56)
34567
(0.33)
2005-06 10
(0.0)
7398
(1.28)
6396
(0.75)
8423
(0.39)
34879
(0.90) Source- District Deputy Registrar, Co-operative Societies, Ahmednagar, Various Years.
Table No.7.5.21 shows the progress of Co-operative Agricultural Processing
Societies in Ahmednagar District during 1996-97 to 2005-06. Number of societies stood
on 9 increased up to 10 during the same period, even growth rate was uneven, growth rate
was negative during year 1997-98 (-11.11%) and in 2001-02 (-9.09%), after 2001-02 it
was constant. Number of members increased from 6520 to 7398 during 1996-97 to 2005-
06, therefore, growth showed a fluctuating trend which was negative during 2001-02 (-
23.69%). share capital increased from Rs.6596 lacks to Rs.6396 lacks during the same
period, growth rate shown a fluctuations during the period and negative for 2001-02 and
2002-03, -13.51% and -0.64%, respectively. Reserve and other funds increased from
Rs.4273 lacks to Rs.8423 lacks during 1996-97 to 2005-06, growth rate shown a
fluctuating trend over the period therefore it was positive. Working capital increased
from Rs.26190 lacks to Rs.34879 lacks during the same period, even growth rate was
uneven which was negative during years 2001-02 and 2002-03, -1.65% and -12.83%,
respectively. Progress of agricultural co-operative processing societies in Ahmednagar

273
district in economic reforms showed a stagnant as the wide fluctuations in the prices of
raw materials, inadequate finance, lack of trained management, severe competition from
private sector, irrationality in planning of units are affected the progress.
The progress of co-operative agricultural processing societies are very necessary
as the production produced is required some process before final consumption which is
not only necessary but also increases the price of the commodity. Increased price
benefited to the agriculturists and the processing unit where farmer is one member.
Table No.7.5.22- Progress of Weavers Co-op. Societies in Ahmednagar District.
(Handloom & Powerloom)
(Rs. In Lacks)
Year/
Items
No. of
Societies
No. of
Members
Share
Capital
Reserve
& Other
Funds
Working
Capital
Production Sell
1996-97 11 915 1509 1124 7136 43.29 43.68
1997-98 11
(0.0)
1146
(25.24)
1547
(2.51)
1143
(1.69)
6966
(-2.38)
45.76
(5.70)
44.00
(0.73)
1998-99 14
(27.27)
1145
(-0.08)
3017
(95.02)
1238
(8.31)
13198
(89.46)
47.28
(3.32)
50.26
(14.22)
1999-00 14
(0.0)
1464
(27.86)
2316
(-23.23)
1333
(7.67)
13358
(1.21)
82.60
(74.70)
87.77
(74.63)
2000-01 16
(14.28)
1698
(15.98)
2464
(6.39)
1371
(2.85)
14189
(6.22)
72.14
(-12.66)
75.44
(-14.04)
2001-02 16
(0.0)
1712
(0.82)
2502
(1.54)
1547
(12.83)
16952
(11.47)
75.68
(4.90)
77.94
(3.31)
2002-03 15
(-6.25)
1502
(-12.26)
2273
(-9.15)
1477
(-4.52)
13882
(-18.11)
68.15
(-9.95)
70.39
(-9.68)
2003-04 16
(6.66)
1610
(7.19)
2437
(7.21)
1583
(7.17)
14881
(7.19)
70.19
(2.99)
72.51
(3.01)
2004-05 16
(0.0)
1630
(1.24)
2540
(4.22)
1670
(5.49)
15806
(6.21)
71.55
(1.93)
73.17
(0.91)
2005-06 15
(-6.25)
1610
(-1.22)
2586
(1.81)
1687
(1.01)
15920
(0.72)
71.86
(0.43)
73.59
(0.57) Source- District Deputy Registrar, Co-operative Societies, Ahmednagar, Various Years.
The handloom co-operatives are a caste based activity that involves a large
number of peoples who are interested in promoting standard of living of their members.
These co-operatives also helps to increase earnings usually women and youth are
engaged in this activity more. Priority has been given to these co-operatives in receiving
short term loans and working capital to strengthen them. Weaver‟s co-operative societies
help the weavers to increase their productivity and also market their product. Thus, these
co-operatives generate employment and rises incomes in rural areas.

274
Table No.7.5.22 shows the progress of Weavers Co-operative Societies in
Ahmednagar District (Handloom & Powerloom) during 1996-97 to 2005-06. Number of
societies increased from 11 to 15 during same period, therefore, growth rate was
fluctuating and shown a negative growth during 2002-03 (-6.25%) and 2005-06 (-6.25%).
number of members increased from 915 to 1610 during 1996-97 to 2005-06, even growth
rate was uneven and negative during 1998-99, 2002-03 and 2005-06, as -0.08%, -12.26%
and -1.22%, respectively. Share capital increased from Rs.1509 lacks to Rs.2586 lacks
during the same period, growth rate was fluctuating over the period and negative during
1999-00 (-23.23%) and 2002-03 (-9.15%). Reserve and other funds increased from
Rs.1124 lacks to Rs.1687 lacks during 1996-97 to 2005-06; therefore, growth rate was
uneven and negative for year 2002-03 as -4.52 per cent. Working capital increased from
Rs.7136 lacks to Rs.15920 lacks during same period, which shown a fluctuating growth
rate during the period, where 1997-98 and 2002-03 growth was negative. Production of
co-operative weavers societies increased from Rs.43.29 lacks to Rs.71.86 lacks during
ten years 1996-97 to 2005-06 when economic reforms are implemented in Indian
economy, therefore, growth rate shows that production was fluctuated and recorded
negative during 2000-01 and 2002-03. However, sell increased from Rs.43.68 lacks to
Rs.73.59 lacks during same period showed fluctuating growth rate over the period which
was negative during year 2000-01 and 2002-03, -14.04% and -9.68%, respectively. In the
context of economic reforms growth rate showed that production and sell of weaver‟s co-
operative societies are slowed down for last four years of study period from 2002-03 to
2005-06. Weavers‟ co-operatives found non-viable as table showed that number of
members showed decreasing trend, lack of finance, inadequate working capital, poor
production and sell, severe competition and monopoly of middlemen and traders, etc.
affected the progress; these weaknesses needs prompt action and quick measures to
remove these weaknesses. The National Co-operative Development Corporation is also
catering the needs and strengthening these co-operatives by providing financial aid.

275
Table No.7.5.23- Progress of Co-operative Spinning Mills in Ahmednagar District.
(Rs. In Lacks& Production in Thousand Tonnes)
Year/
Items
No. of
Societies
No. of
Members
Share
Capital
Reserve
& Other
Funds
Working
Capital
No. of
Spindleage
in Prodn.
Produced
Yarn
1996-97 3 8817 13055 1709 45519 322.00 77.34
1997-98 3
(0.0)
5402
(-38.73)
13359
(2.32)
2994
(75.19)
47346
(4.01)
320.00
(-0.62)
80.00
(3.89)
1998-99 3
(0.0)
5041
(-6.68)
13466
(0.80)
3456
(15.43)
52610
(11.11)
320.00
(0.0)
82.00
(2.50)
1999-00 3
(0.0)
5041
(0.0)
13466
(0.0)
3456
(0.0)
52610
(0.0)
320.00
(0.0)
85.13
(3.65)
2000-01 3
(0.0)
5041
(0.0)
13518
(0.38)
3622
(4.80)
54124
(2.87)
287.00
(-10.31)
79.00
(-7.05)
2001-02 3
(0.0)
5063
(0.43)
13725
(1.53)
3974
(9.71)
57218
(5.71)
287.00
(0.0)
77.00
(-2.53)
2002-03 3
(0.0)
5075
(0.0)
13748
(0.16)
4186
(5.33)
59104
(3.29)
285.00
(-0.69)
46.00
(-40.26)
2003-04 2
(-33.33)
5075
(0.0)
13748
(0.0)
4186
(0.0)
59104
(0.0)
285.00
(0.0)
48.00
(4.34)
2004-05 2
(0.0)
5075
(0.0)
13820
(0.52)
4195
(0.21)
59203
(0.16)
285.00
(0.0)
48.00
(0.0)
2005-06 2
(0.0)
5078
(0.06)
14100
(2.02)
4220
(0.59)
59523
(0.54)
285.00
(0.0)
49.00
(2.08) Source- District Deputy Registrar, Co-operative Societies, Ahmednagar, Various Years.
Table No.7.5.23 shows the progress of Co-operative Spinning Mills in
Ahmednagar District during 1996-97 to 2005-06. Number of spinning mills in
Ahmednagar district decreased from 3 to 2 during 1996-97 to 2005-06, growth rate
shown a fluctuating trend which was constant except year 2003-04 as growth rate
reduced by -33.33 per cent. Number of members decreased from 8817 to 5078 during the
same period, even growth rate was uneven which was negative during 1997-98 and 1998-
99, -38.73% and -6.68%, respectively. Share capital increased from Rs.13055 lacks to
Rs.14100 lacks during the same period, therefore, growth rate shown a fluctuating trend
but positive growth. Reserve and other funds increased from Rs.1709 lacks to Rs.4220
lacks during 1996-97 to 2005-06, showed a fluctuating trend which was constant for year
1999-00 and 2003-04. Working capital increased from Rs.45519 lacks to Rs.59523 lacks
during the same period, growth rate shown a fluctuating trend but positive. Number of
spindleage in production decreased from Rs.322 lacks to Rs.285 lacks, growth rate
showed a fluctuating trend which was negative during 1997-98, 2000-01 and 2002-03, as
-0.62%, -10.31% and -0.69%, respectively. For other year‟s spindleage in production was
shown a constant growth. Production of yarn decreased from Rs.77.34 lacks to Rs.49.00

276
lacks during 1996-97 to 2005-06, even growth rate was uneven and negative during 2000
to 2003. Table revealed that Co-operative Spinning Mills in Ahmednagar District during
1996-97 to 2005-06 was not made progress. Table showed that the progress made by
these co-operative was not satisfactory during the study period. Number of societies,
membership, reserve and other funds, working capital as well as production of yarn
showed a very discouraging progress. Inadequate finance, lack of raw material,
accumulation of unsold stock, inefficient management, lack co-operation and private
selfish interests of members are some of the weaknesses of society
Table No.7.5.24- Progress of Co-operative Industrial Estates in A’Nagar District.
(Rs. In Lacks)
Year/ Items No. of
Societies
No. of
Members
Share Capital Reserve &
Other Funds
Working
Capital
1996-97 6 2173 24477 4605 46572
1997-98 6
(0.0)
2608
(20.01)
24488
(0.04)
4816
(4.58)
46753
(0.38)
1998-99 7
(16.66)
2624
(0.61)
24102
(-1.57)
5300
(10.05)
49342
(5.53)
1999-00 7
(0.0)
2640
(0.60)
24890
(3.64)
5875
(10.85)
52291
(5.97)
2000-01 7
(0.0)
2655
(0.58)
25042
(0.61)
1164
(-80.18)
55206
(5.57)
2001-02 7
(0.0)
2668
(0.49)
24791
(-1.00)
1967
(68.98)
58593
(6.13)
2002-03 8
(14.28)
2688
(0.75)
24825
(0.13)
8158
(314.74)
60581
(3.39)
2003-04 7
(-12.50)
2714
(0.96)
25078
(1.02)
8239
(0.99)
61186
(0.99)
2004-05 7
(0.0)
2722
(0.29)
25342
(1.05)
8268
(0.35)
61267
(0.13)
2005-06 7
(0.0)
2786
(2.35)
25621
(1.10)
8334
(0.79)
61454
(0.30) Source- District Deputy Registrar, Co-operative Societies, Ahmednagar, Various Years.
Table No.7.5.24 progress of Co-operative Industrial Estates in Ahmednagar
District during year 1996-97 to 2005-06. Number of societies increased from 6 to 7
during the same period therefore, growth rate showed a fluctuation, it increased in 1998-
99 from 6 to 7 as well as in 2002-03 from 7 to 8, therefore, in 2003-04 societies
decreased by one number from 8 to 7 as growth was -12.5 per cent. Number of members
increased from 2173 to 2786, growth rate was uneven although positive. Share capital
increased from Rs.24477 lacks to Rs.25621 lacks during 1997-98 to 2005-06, therefore,
growth rate was fluctuating and negative for years 1998-99 (-1.57%) and 2001-02 (-
1.00%). Reserve and other funds increased from Rs.4606 lacks to Rs.8334 lacks during

277
the same period, even growth rate was uneven and recorded negative during 2000-01 as -
80.18% and recorded highest in 2002-03 as 314.64%. Working capital increased from
Rs.46572 lacks to Rs.61454 lacks during the same period, growth rate was fluctuating
even positive. Co-operative Industrial Estates in Ahmednagar District during year 1996-
97 to 2005-06 have not made a very good progress. Rural industrialization able to
provide effective remedy for rural employment because farming business has limits to
absorb the increasing population in rural areas. Rural industrialization also benefited
through the turn away urban centralization of industries to rural.
Table No.7.5.25- Progress of Other Co-operative Industrial Societies in A’Nagar.
(Rs. In Lacks)
Year/
Items
No. of
Societies
No. of
Members
Share
Capital
Reserve
& Other
Funds
Working
Capital
Purchase
of Raw
Material
Total
Production
Total
Sell
1996-97 83 16435 5826 2245 36936 23.70 25.73 21.79
1997-98 87
(4.82)
18826
(14.54)
6865
(17.86)
2490
(10.91)
88467
(19.03)
30.15
(27.21)
32.24
(25.30)
23.94
(9.86)
1998-99 93
(6.89)
18683
(-0.76)
5728
(-16.58)
3548
(42.49)
39170
(-55.72)
32.39
(7.43)
39.54
(22.64)
30.23
(26.27)
1999-00 95
(2.15)
19276
(3.17)
5874
(2.54)
3837
(8.14)
41138
(5.02)
36.59
(12.96)
38.27
(-3.21)
38.48
(27.29)
2000-01 89
(-6.31)
18214
(-5.51)
5618
(-4.35)
4137
(7.81)
43853
(6.60)
39.42
(7.73)
45.18
(18.05)
46.27
(20.24)
2001-02 95
(6.74)
21064
(15.64)
6909
(22.98)
4649
(12.37)
43779
(-0.16)
44.60
(13.14)
48.58
(7.52)
51.01
(10.24)
2002-03 100
(5.26)
21968
(4.29)
6981
(1.04)
3691
(-20.60)
50486
(15.32)
47.51
(6.52)
52.99
(9.07)
54.55
(6.94)
2003-04 91
(-9.0)
22077
(0.49)
7016
(0.50)
3709
(0.48)
50738
(0.50)
49.88
(4.98)
55.64
(5.0)
57.27
(4.98)
2004-05 91
(0.0)
22077
(0.0)
7035
(0.27)
3802
(2.50)
50977
(0.47)
52.44
(5.13)
57.86
(3.99)
59.23
(3.42)
2005-06 90
(-1.09)
22060
(-0.07)
7078
(0.61)
3897
(2.49)
51180
(0.39)
53.67
(2.34)
59.32
(2.52)
61.32
(3.52) Source- District Deputy Registrar, Co-operative Societies, Ahmednagar, Various Years.
Table No.7.5.25 shows the progress of Other Co-operative Industrial Societies in
Ahmednagar district during 1996-97 to 2005-06. Number of societies increased from 83
to 90 during the same period, even growth rate was uneven which showed negative
growth during years 2000-01, 2003-04 and 2005-06, as -6.31%, -9.0% and -1.09%,
respectively. Number of members increased from 16435 to 22060 during the same
period, therefore, growth rate was fluctuating and showed negative growth during years
1998-99, 2000-01 and 2005-06, as -0.76%, -5.51% and -0.07%, respectively. Share
capital increased from Rs.5826 lacks to rs.7078 lacks during the same period, growth rate

278
shown a fluctuating trend, therefore, growth was positive. Reserve and other funds
increased from Rs.2245 lacks to Rs.3897 lacks during the same period, growth rate
showed a fluctuating over the period, therefore, growth was positive. Working capital
increased from Rs.36936 lacks to Rs.51180 lacks during 1996-97 to 2005-06 even growth
rate was uneven and negative during years 1998-99 (-55.72%) and in 2001-02 (-0.16%).
Value of purchase of raw materials increased from Rs.23.70 lacks to Rs.53.67 lacks
during the same period, therefore, growth rate was fluctuating but positive. Total
production of other co-operative industrial societies increased from Rs.25.73 lacks to
Rs.59.32 lacks, therefore, growth rate was uneven and negative for year 1999-00 as -
3.21% and for other period it was positive. Total sell increased from Rs.21.79 lacks to Rs.
61.32 lacks during the same period showed a fluctuating growth trend, therefore, growth
was recorded positive during the entire study period along with increasing gross income
in the context of economic reforms. Industrial co-operatives create employment
opportunities and income to enable member‟s standard of living which organize rural
community, seek diversification in a manner that contributes to the welfare of the weaker
sections of the rural economy.
Table No.7.5.26- Progress of Co-operative Milk Societies in Ahmednagar District. (Rs. In Lacks)
Year/
Items
No. of
Societies
No. of
Members
Share
Capital
Reserve
& Other
Funds
Working
Capital
Purchase
Price of
Milk
Selling
Price of
Milk
1996-97 1960 136217 8451 13362 56183 8734.62 8951.13
1997-98 2119
(8.11)
137915
(1.24)
8670
(2.59)
13779
(3.12)
61044
(8.65)
13039.00
(48.78)
11653.20
(30.18)
1998-99 2285
(7.83)
139246
(0.96)
9430
(8.76)
14315
(3.89)
63044
(3.27)
12416.35
(-4.77)
12137.41
(4.15)
1999-00 2353
(2.97)
142539
(2.36)
9865
(4.61)
14892
(4.03)
65791
(4.35)
24117.00
(94.24)
23791.00
(96.01)
2000-01 2562
(8.88)
157995
(10.84)
11974
(21.37)
18379
(23.41)
73841
(12.23)
26421.33
(9.55)
24992.18
(4.97)
2001-02 2716
(6.01)
170302
(7.79)
12833
(7.17)
21375
(16.30)
93821
(27.05)
28317.49
(7.17)
27457.38
(9.86)
2002-03 2874
(5.81)
175993
(3.34)
13915
(8.43)
29058
(35.94)
172335
(83.68)
28604.15
(1.01)
31491.12
(14.69)
2003-04 2975
(3.51)
182102
(3.47)
14476
(4.03)
30229
(4.03)
179283
(4.03)
30320.04
(6.00)
33695.37
(7.00)
2004-05 2975
(0.0)
184112
(1.10)
14645
(1.16)
30867
(2.11)
182563
(1.83)
30812.15
(1.62)
34128.33
(1.28)
2005-06 2975
(0.0)
184320
(0.11)
14773
(0.87)
31712
(2.73)
189745
(3.94)
31532.21
(2.33)
34907.21
(2.28) Source- District Deputy Registrar, Co-operative Societies, Ahmednagar, Various Years.
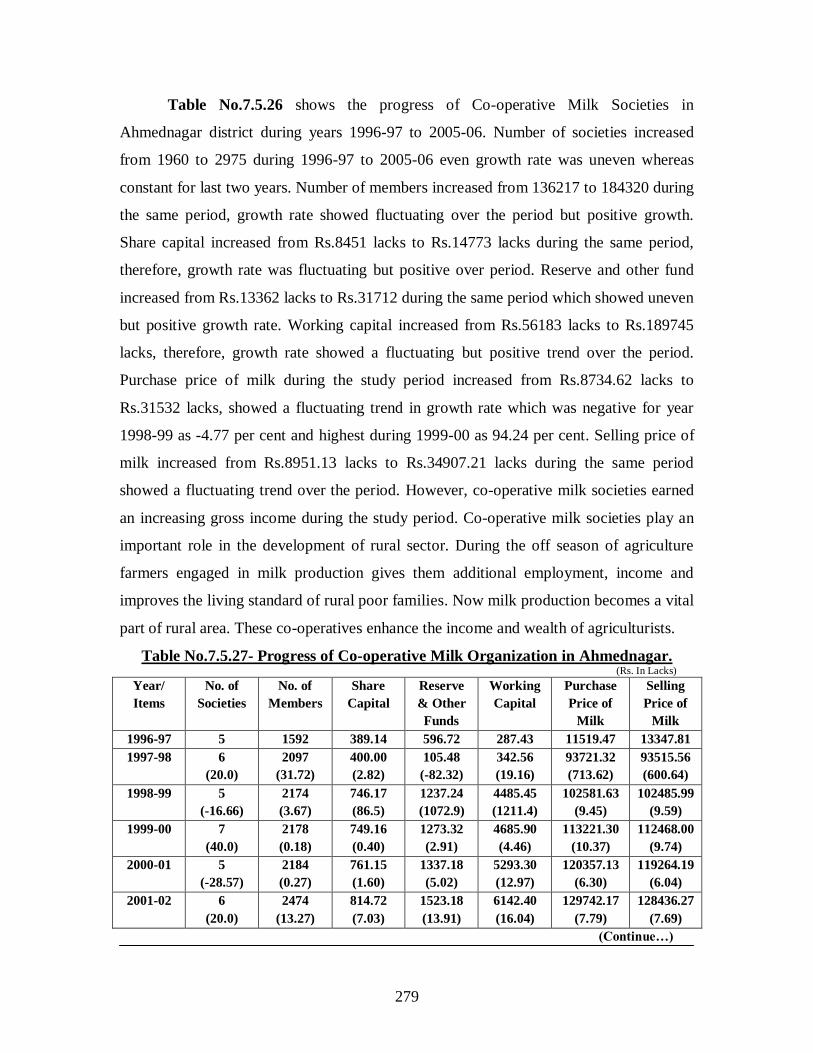
279
Table No.7.5.26 shows the progress of Co-operative Milk Societies in
Ahmednagar district during years 1996-97 to 2005-06. Number of societies increased
from 1960 to 2975 during 1996-97 to 2005-06 even growth rate was uneven whereas
constant for last two years. Number of members increased from 136217 to 184320 during
the same period, growth rate showed fluctuating over the period but positive growth.
Share capital increased from Rs.8451 lacks to Rs.14773 lacks during the same period,
therefore, growth rate was fluctuating but positive over period. Reserve and other fund
increased from Rs.13362 lacks to Rs.31712 during the same period which showed uneven
but positive growth rate. Working capital increased from Rs.56183 lacks to Rs.189745
lacks, therefore, growth rate showed a fluctuating but positive trend over the period.
Purchase price of milk during the study period increased from Rs.8734.62 lacks to
Rs.31532 lacks, showed a fluctuating trend in growth rate which was negative for year
1998-99 as -4.77 per cent and highest during 1999-00 as 94.24 per cent. Selling price of
milk increased from Rs.8951.13 lacks to Rs.34907.21 lacks during the same period
showed a fluctuating trend over the period. However, co-operative milk societies earned
an increasing gross income during the study period. Co-operative milk societies play an
important role in the development of rural sector. During the off season of agriculture
farmers engaged in milk production gives them additional employment, income and
improves the living standard of rural poor families. Now milk production becomes a vital
part of rural area. These co-operatives enhance the income and wealth of agriculturists.
Table No.7.5.27- Progress of Co-operative Milk Organization in Ahmednagar. (Rs. In Lacks)
Year/
Items
No. of
Societies
No. of
Members
Share
Capital
Reserve
& Other
Funds
Working
Capital
Purchase
Price of
Milk
Selling
Price of
Milk
1996-97 5 1592 389.14 596.72 287.43 11519.47 13347.81
1997-98 6
(20.0)
2097
(31.72)
400.00
(2.82)
105.48
(-82.32)
342.56
(19.16)
93721.32
(713.62)
93515.56
(600.64)
1998-99 5
(-16.66)
2174
(3.67)
746.17
(86.5)
1237.24
(1072.9)
4485.45
(1211.4)
102581.63
(9.45)
102485.99
(9.59)
1999-00 7
(40.0)
2178
(0.18)
749.16
(0.40)
1273.32
(2.91)
4685.90
(4.46)
113221.30
(10.37)
112468.00
(9.74)
2000-01 5
(-28.57)
2184
(0.27)
761.15
(1.60)
1337.18
(5.02)
5293.30
(12.97)
120357.13
(6.30)
119264.19
(6.04)
2001-02 6
(20.0)
2474
(13.27)
814.72
(7.03)
1523.18
(13.91)
6142.40
(16.04)
129742.17
(7.79)
128436.27
(7.69)
(Continue…)

280
2002-03 6
(0.0)
2482
(0.32)
1329.16
(63.14)
1698.60
(11.58)
6689.93
(8.90)
184443.85
(42.16)
192145.33
(49.60)
2003-04 12
(100.0)
4964
(99.83)
2658.30
(99.99)
3397.20
(100.0)
13379.85
(100.0)
195514.54
(6.00)
205692.33
(7.05)
2004-05 12
(0.0)
5012
(0.96)
2717.34
(2.21)
3482.12
(2.50)
14390.11
(7.55)
198961.23
(1.76)
201738.21
(-1.92)
2005-06 12
(0.0)
5094
(1.63)
2787.66
(2.57)
3521.01
(1.12)
14681.10
(2.02)
201003.12
(1.02)
203772.40
(1.00)
Source- District Deputy Registrar, Co-operative Societies, Ahmednagar, Various Years.
Table No.7.5.27 shows the progress of Co-operative Milk Organization in
Ahmednagar during year 1996-97 to 2005-06. Number of organizations stood on 5
increased up to 12 during 1996-97 to 2005-06, therefore, growth rate shown a fluctuating
tren whereas it was negative during year 1998-99 as -16.66 per cent, in 2000-01 as -28.57
per cent and stood constant for years 2002-03, 2004-05 and 2005-06. Number of
members increased from 1592 to 4998 during 1996-97 to 2005-06, even growth rate was
uneven but positive. Share capital increased from Rs. 389.14 lacks to Rs.2787.66 lacks
during the same period, growth rate showed a fluctuating trend even positive over the
period. Reserve and other funds increased from Rs.596.72 lacks to Rs.3521.01 lacks
during 1996-97 to 2005-06, even growth rate was uneven and negative for year 1997-98
as -82.32 per cent. Working capital increased from Rs.287.43 lacks to 14681.10 lacks,
growth rate showed a fluctuating trend even positive which was highest during 1998-99
as 1211.40 per cent. Purchase price of milk was Rs.11519.47 lacks during year 1996-97
increased up to Rs.201003.12 during 2005-06, showed a fluctuating however positive
growth rate. Selling price of milk increased from Rs.13347.81 lacks to Rs.201003.12
lacks during the same period, growth rate showed fluctuating trend over the period which
was negative during year 2004-05 as -1.92 per cent, as well as showed a highest growth
during year 1997-98 as 600.64 per cent, overall organization have earned increasing gross
income. Table revealed that the co-operative milk organization made a fairly good
progress; therefore, growth rate was so much satisfactory and showed a fluctuating trend
over the period.
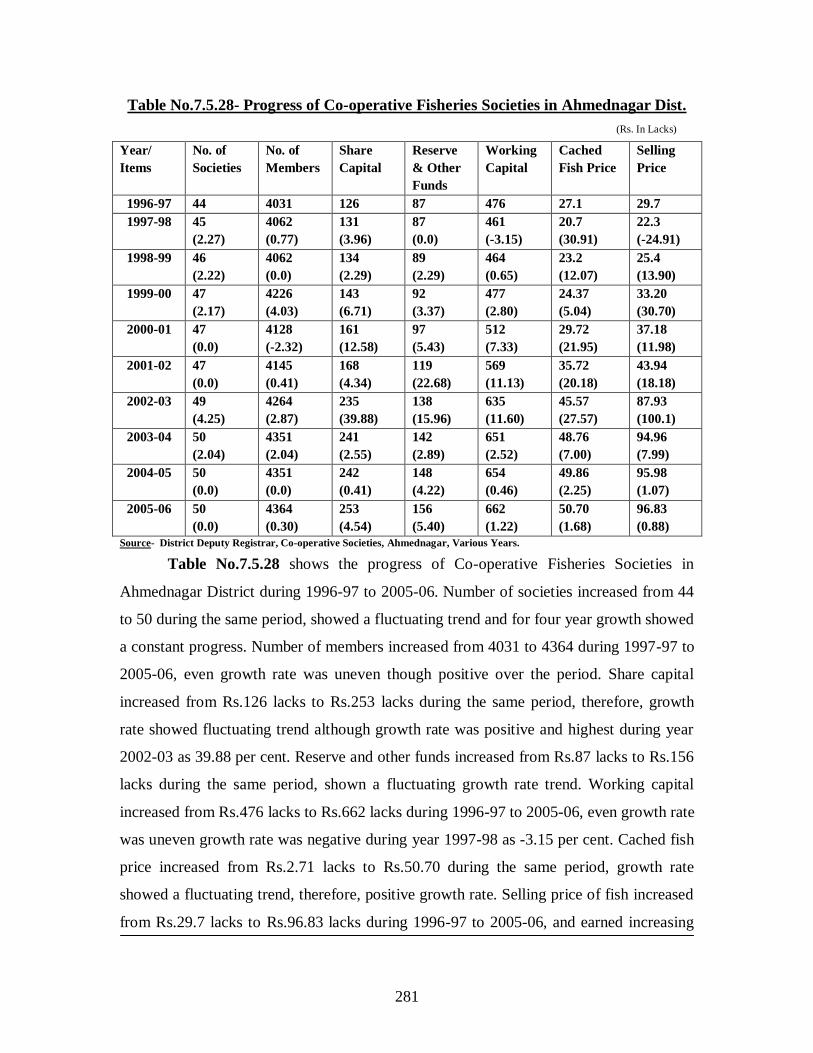
281
Table No.7.5.28- Progress of Co-operative Fisheries Societies in Ahmednagar Dist.
(Rs. In Lacks)
Year/
Items
No. of
Societies
No. of
Members
Share
Capital
Reserve
& Other
Funds
Working
Capital
Cached
Fish Price
Selling
Price
1996-97 44 4031 126 87 476 27.1 29.7
1997-98 45
(2.27)
4062
(0.77)
131
(3.96)
87
(0.0)
461
(-3.15)
20.7
(30.91)
22.3
(-24.91)
1998-99 46
(2.22)
4062
(0.0)
134
(2.29)
89
(2.29)
464
(0.65)
23.2
(12.07)
25.4
(13.90)
1999-00 47
(2.17)
4226
(4.03)
143
(6.71)
92
(3.37)
477
(2.80)
24.37
(5.04)
33.20
(30.70)
2000-01 47
(0.0)
4128
(-2.32)
161
(12.58)
97
(5.43)
512
(7.33)
29.72
(21.95)
37.18
(11.98)
2001-02 47
(0.0)
4145
(0.41)
168
(4.34)
119
(22.68)
569
(11.13)
35.72
(20.18)
43.94
(18.18)
2002-03 49
(4.25)
4264
(2.87)
235
(39.88)
138
(15.96)
635
(11.60)
45.57
(27.57)
87.93
(100.1)
2003-04 50
(2.04)
4351
(2.04)
241
(2.55)
142
(2.89)
651
(2.52)
48.76
(7.00)
94.96
(7.99)
2004-05 50
(0.0)
4351
(0.0)
242
(0.41)
148
(4.22)
654
(0.46)
49.86
(2.25)
95.98
(1.07)
2005-06 50
(0.0)
4364
(0.30)
253
(4.54)
156
(5.40)
662
(1.22)
50.70
(1.68)
96.83
(0.88)
Source- District Deputy Registrar, Co-operative Societies, Ahmednagar, Various Years.
Table No.7.5.28 shows the progress of Co-operative Fisheries Societies in
Ahmednagar District during 1996-97 to 2005-06. Number of societies increased from 44
to 50 during the same period, showed a fluctuating trend and for four year growth showed
a constant progress. Number of members increased from 4031 to 4364 during 1997-97 to
2005-06, even growth rate was uneven though positive over the period. Share capital
increased from Rs.126 lacks to Rs.253 lacks during the same period, therefore, growth
rate showed fluctuating trend although growth rate was positive and highest during year
2002-03 as 39.88 per cent. Reserve and other funds increased from Rs.87 lacks to Rs.156
lacks during the same period, shown a fluctuating growth rate trend. Working capital
increased from Rs.476 lacks to Rs.662 lacks during 1996-97 to 2005-06, even growth rate
was uneven growth rate was negative during year 1997-98 as -3.15 per cent. Cached fish
price increased from Rs.2.71 lacks to Rs.50.70 during the same period, growth rate
showed a fluctuating trend, therefore, positive growth rate. Selling price of fish increased
from Rs.29.7 lacks to Rs.96.83 lacks during 1996-97 to 2005-06, and earned increasing
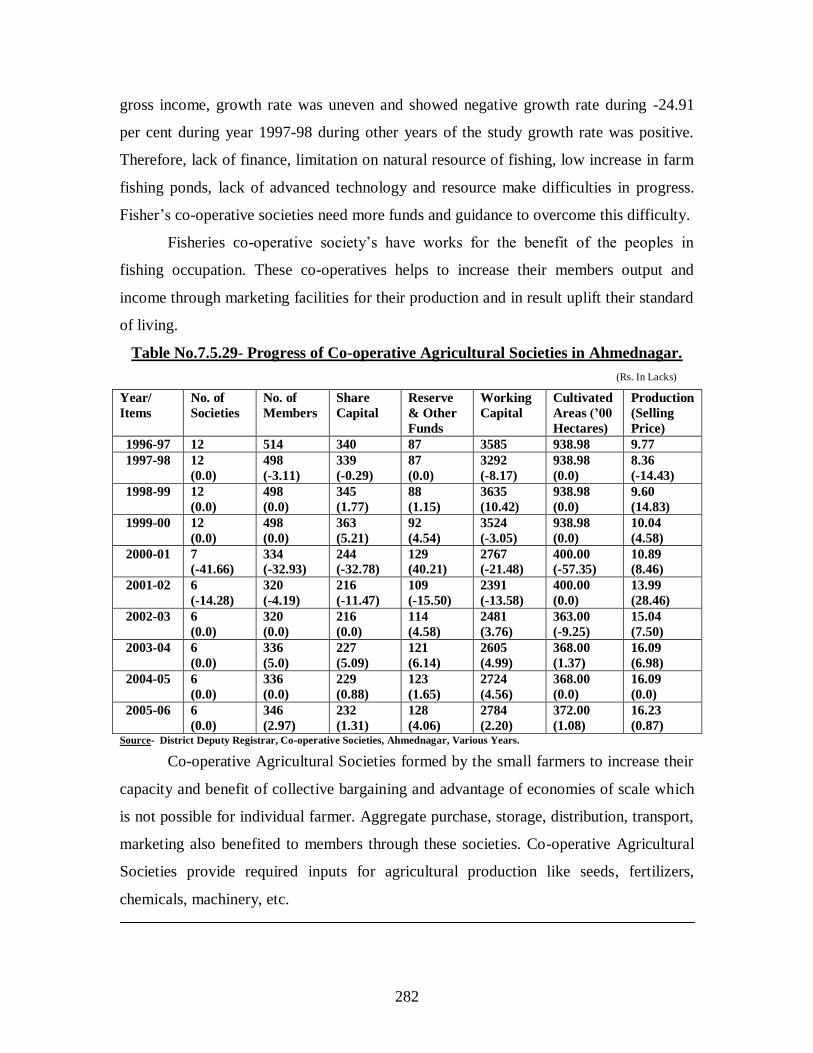
282
gross income, growth rate was uneven and showed negative growth rate during -24.91
per cent during year 1997-98 during other years of the study growth rate was positive.
Therefore, lack of finance, limitation on natural resource of fishing, low increase in farm
fishing ponds, lack of advanced technology and resource make difficulties in progress.
Fisher‟s co-operative societies need more funds and guidance to overcome this difficulty.
Fisheries co-operative society‟s have works for the benefit of the peoples in
fishing occupation. These co-operatives helps to increase their members output and
income through marketing facilities for their production and in result uplift their standard
of living.
Table No.7.5.29- Progress of Co-operative Agricultural Societies in Ahmednagar.
(Rs. In Lacks)
Year/
Items
No. of
Societies
No. of
Members
Share
Capital
Reserve
& Other
Funds
Working
Capital
Cultivated
Areas (’00
Hectares)
Production
(Selling
Price)
1996-97 12 514 340 87 3585 938.98 9.77
1997-98 12
(0.0)
498
(-3.11)
339
(-0.29)
87
(0.0)
3292
(-8.17)
938.98
(0.0)
8.36
(-14.43)
1998-99 12
(0.0)
498
(0.0)
345
(1.77)
88
(1.15)
3635
(10.42)
938.98
(0.0)
9.60
(14.83)
1999-00 12
(0.0)
498
(0.0)
363
(5.21)
92
(4.54)
3524
(-3.05)
938.98
(0.0)
10.04
(4.58)
2000-01 7
(-41.66)
334
(-32.93)
244
(-32.78)
129
(40.21)
2767
(-21.48)
400.00
(-57.35)
10.89
(8.46)
2001-02 6
(-14.28)
320
(-4.19)
216
(-11.47)
109
(-15.50)
2391
(-13.58)
400.00
(0.0)
13.99
(28.46)
2002-03 6
(0.0)
320
(0.0)
216
(0.0)
114
(4.58)
2481
(3.76)
363.00
(-9.25)
15.04
(7.50)
2003-04 6
(0.0)
336
(5.0)
227
(5.09)
121
(6.14)
2605
(4.99)
368.00
(1.37)
16.09
(6.98)
2004-05 6
(0.0)
336
(0.0)
229
(0.88)
123
(1.65)
2724
(4.56)
368.00
(0.0)
16.09
(0.0)
2005-06 6
(0.0)
346
(2.97)
232
(1.31)
128
(4.06)
2784
(2.20)
372.00
(1.08)
16.23
(0.87) Source- District Deputy Registrar, Co-operative Societies, Ahmednagar, Various Years.
Co-operative Agricultural Societies formed by the small farmers to increase their
capacity and benefit of collective bargaining and advantage of economies of scale which
is not possible for individual farmer. Aggregate purchase, storage, distribution, transport,
marketing also benefited to members through these societies. Co-operative Agricultural
Societies provide required inputs for agricultural production like seeds, fertilizers,
chemicals, machinery, etc.

283
Table No.7.5.29 shows the progress of Co-operative Agricultural Societies in
Ahmednagar during year 1996-97 to 2005-06. Number of societies decreased from 12 to
6 during 1996-97 to 2005-06, showed a decreasing growth rate which was -41.66 per cent
during year 2000-01 and -14.28 during 2001-02 for remaining years it was zero. Number
of members decreased from 514 to 346 during the same period, growth rate showed
fluctuating growth where during year 1997-98, 2000-01 and 2001-02 growth rate was
negative as -3.11%, -32.93% and -4.19%, respectively. Share capital decreased from
Rs.340 lacks to Rs.232 lacks during the same period, even growth rate was uneven and
negative for years 1997-98, 2000-01 and 2001-02 as -0.29%, -32.78% and -11.47%,
respectively. Reserve and funds increased funds increased from Rs.87 lacks to Rs.128
lacks during the same period, even growth rate was uneven and negative during year
2001-02 as -15.50 per cent. Working capital decreased from Rs.3585 lacks to Rs.2784
lacks during the same period showed a fluctuating trend whereas during year 1997-98,
1999-00, 2000-01 and 2001-02 growth rate was negative as -8.17%, -3.05%, -21.48% and
-13.58%, respectively. Cultivated areas also decreased from 938.98 hundred hectares to
372.00 hundred hectares during 1996-97 to 2005-06, growth rate in cultivated areas
showed a fluctuating trend over the period which was reduced during year 2000-01 and
2002-03 as -57.35 per cent and -9.25 per cent. Selling price of production during 1996-97
to 2005-06 showed increase from Rs.9.77 lacks to Rs.16.23 lacks, therefore, growth rate
showed a fluctuating trend over the period and recorded negative growth for year 1997-
98 as -14.43 per cent. Table revealed that co-operative agricultural societies in
Ahmednagar districts are suffering from many weaknesses and failing in their
performance.
Table No.7.5.30- Progress of Co-operative Lift Irrigation Societies in Ahmednagar.
(Rs. In Lacks)
Year/ Items No. of
Societies
No. of
Members
Share
Capital
Reserve &
Other
Funds
Working
Capital
Irrigated
Area (’00
Hectares)
1996-97 601 46375 9945 8655 774132 251.55
1997-98 664
(10.48)
56240
(21.27)
11452
(15.15)
10120
(16.92)
859100
(10.97)
398.00
(58.22)
1998-99 704
(6.02)
60654
(7.84)
11798
(3.02)
10216
(0.94)
876176
(1.98)
428.11
(7.56)
(Continue…)

284
1999-00 724
(2.84)
61255
(0.99)
12149
(2.97)
10954
(7.22)
891173
(1.71)
432.00
(1.86)
2000-01 744
(2.76)
62145
(1.45)
13714
(12.88)
12136
(10.77)
922538
(3.52)
443.00
(2.54)
2001-02 829
(11.42)
43712
(-29.66)
14539
(6.01)
19106
(57.43)
941773
(2.08)
484.00
(9.25)
2002-03 888
(7.11)
45291
(3.61)
16355
(12.49)
23704
(24.06)
993898
(5.53)
491.08
(1.44)
2003-04 905
(1.91)
46388
(2.42)
16751
(2.42)
24278
(2.42)
1017989
(2.42)
495.08
(0.81)
2004-05 905
(0.0)
46876
(1.05)
16870
(0.71)
24307
(0.12)
1021242
(0.31)
498.08
(0.60)
2005-06 890
(-1.65)
46882
(0.01)
16893
(0.13)
24356
(0.20)
1022674
(0.14)
496.12
(-0.40)
Source- District Deputy Registrar, Co-operative Societies, Ahmednagar, Various Years.
Table No.7.5.30 shows the progress of Co-operative Lift Irrigation Societies in
Ahmednagar during 1996-97 to 2005-06. Number of societies increased from 46375 to
46882 during the same period, showed a fluctuating trend over the period while during
year 2000-01 growth was negative as -29.66 per cent. Share capital increased from
Rs.9945 lacks to Rs.16893 lacks during the same period, even growth was uneven.
Reserve and other funds increased from Rs.8655 lacks to Rs.24356 lacks during 1996-97
to 2005-06, therefore, growth rate showed a fluctuating but positive trend, growth rate
was highest during year 2001-02 as 57.43 per cent. Working capital increased from
Rs.774132 lacks to Rs.1022674 lacks during the same period, even growth rate was
uneven. Irrigated area increased from 251.55 hundred hectares to 496.12 hundred
hectares during the same period, therefore, growth rate shown a fluctuating trend over the
study period in economic reforms, growth was recorded negative during year 2005-06 as
-0.40 per cent and highest during year 1997-98 as 58.22 per cent.
Co-operative Lift Irrigation societies make available water facility for members
through irrigation facilities for agricultural activities. Water is quite necessary input of
production which increases the production and productivity of land.

285
Table No.7.5.31- Progress of Other Co-operative Societies in Ahmednagar District.
(Livestock Societies)
(Rs. In Lacks)
Year/ Items No. of
Societies
No. of
Members
Share Capital Reserve &
Other Funds
Working
Capital
1996-97 897 13558 3428 1214 17586
1997-98 905
(0.89)
13697
(1.02)
3812
(11.20)
1228
(1.15)
18177
(3.36)
1998-99 907
(0.22)
13715
(0.13)
3818
(0.15)
1259
(2.52)
21520
(18.39)
1999-00 907
(0.0)
15241
(11.12)
4462
(16.86)
1493
(18.58)
22711
(5.53)
2000-01 885
(-2.42)
13942
(-8.52)
5114
(14.61)
1684
(12.79)
26481
(16.60)
2001-02 745
(-15.81)
12198
(-12.50)
4522
(-11.57)
1473
(-12.52)
23196
(-12.40)
2002-03 748
(0.40)
12629
(3.53)
4673
(3.33)
1766
(19.89)
31401
(35.37)
2003-04 749
(0.13)
12709
(0.63)
4703
(0.64)
1778
(0.68)
31601
(0.63)
2004-05 749
(0.0)
12709
(0.63)
4724
(0.44)
1782
(0.22)
31621
(0.06)
2005-06 708
(-5.47)
12102
(-4.77)
4806
(1.73)
1796
(0.78)
31634
(0.04) Source- District Deputy Registrar, Co-operative Societies, Ahmednagar, Various Years.
Table No.7.5.31 shows the progress of Other Co-operative Societies in
Ahmednagar District (Livestock Societies) during year 1996-97 to 2005-06. Number of
societies decreased from 897 to 708 during the same period showed a fluctuating growth
rate over the period where during year 2000-01, 2001-02 and 2005-06 growth was
negative as -2.42%, -15.81% and -5.47%, respectively. Number of members increased
from 13558 to 12102 during 1996-97 to 2005-06, growth rate was uneven and negative
for year 2000-01, 2001-02 and 2005-06 growth was negative as -8.52%, -12.50% and -
4.77%, respectively. Share capital increased from Rs.3428 lacks to Rs.4806 lacks during
the same period, growth rate showed a fluctuating trend which was negative during year
2001-02 as -11.57 per cent. Reserve and other funds increased from Rs.1214 lacks to
Rs.1796 lacks during 1996-97 to 2005-06, even growth rate was uneven and was negative
during year 2001-02 as -12.52 per cent. Working capital increased from Rs.17586 lacks
to Rs.31624 lacks showed a fluctuating growth rate over the period which was negative
during year 2001-02 as -12.40 per cent. Table showed that the progress made by Other
Co-operative Societies in Ahmednagar district (Livestock Societies) during year 1996-97
to 2005-06 was not satisfactory.
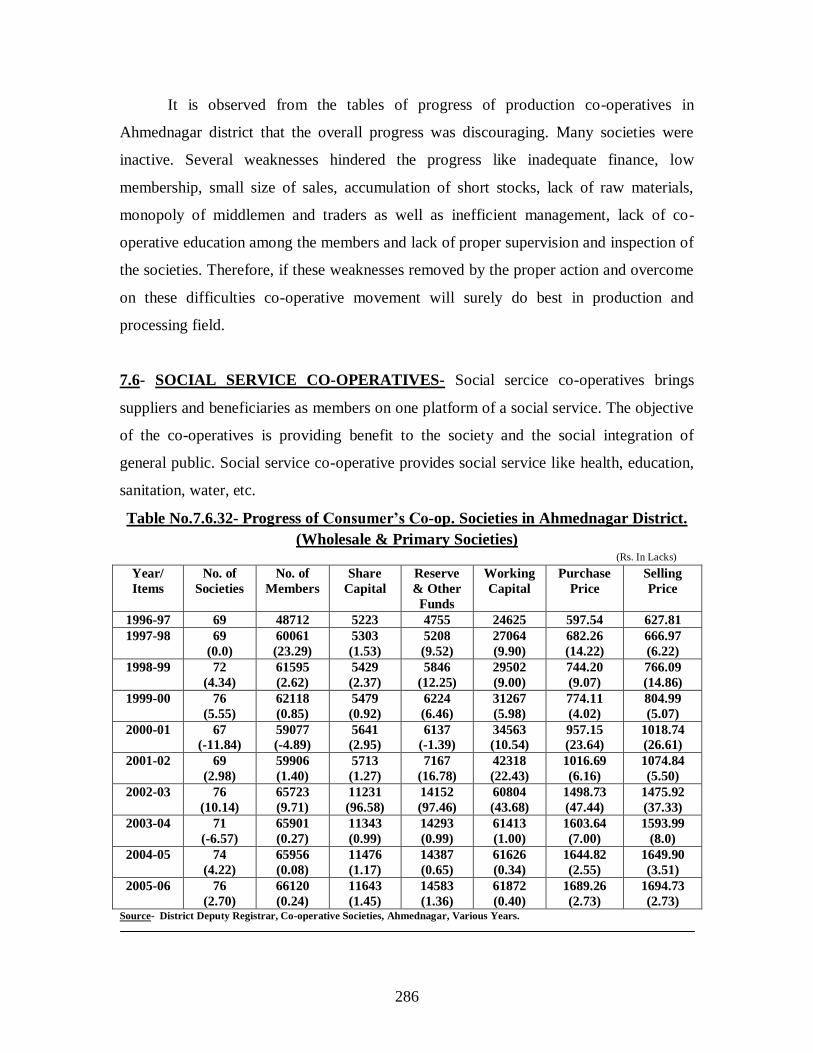
286
It is observed from the tables of progress of production co-operatives in
Ahmednagar district that the overall progress was discouraging. Many societies were
inactive. Several weaknesses hindered the progress like inadequate finance, low
membership, small size of sales, accumulation of short stocks, lack of raw materials,
monopoly of middlemen and traders as well as inefficient management, lack of co-
operative education among the members and lack of proper supervision and inspection of
the societies. Therefore, if these weaknesses removed by the proper action and overcome
on these difficulties co-operative movement will surely do best in production and
processing field.
7.6- SOCIAL SERVICE CO-OPERATIVES- Social sercice co-operatives brings
suppliers and beneficiaries as members on one platform of a social service. The objective
of the co-operatives is providing benefit to the society and the social integration of
general public. Social service co-operative provides social service like health, education,
sanitation, water, etc.
Table No.7.6.32- Progress of Consumer’s Co-op. Societies in Ahmednagar District.
(Wholesale & Primary Societies) (Rs. In Lacks)
Year/
Items
No. of
Societies
No. of
Members
Share
Capital
Reserve
& Other
Funds
Working
Capital
Purchase
Price
Selling
Price
1996-97 69 48712 5223 4755 24625 597.54 627.81
1997-98 69
(0.0)
60061
(23.29)
5303
(1.53)
5208
(9.52)
27064
(9.90)
682.26
(14.22)
666.97
(6.22)
1998-99 72
(4.34)
61595
(2.62)
5429
(2.37)
5846
(12.25)
29502
(9.00)
744.20
(9.07)
766.09
(14.86)
1999-00 76
(5.55)
62118
(0.85)
5479
(0.92)
6224
(6.46)
31267
(5.98)
774.11
(4.02)
804.99
(5.07)
2000-01 67
(-11.84)
59077
(-4.89)
5641
(2.95)
6137
(-1.39)
34563
(10.54)
957.15
(23.64)
1018.74
(26.61)
2001-02 69
(2.98)
59906
(1.40)
5713
(1.27)
7167
(16.78)
42318
(22.43)
1016.69
(6.16)
1074.84
(5.50)
2002-03 76
(10.14)
65723
(9.71)
11231
(96.58)
14152
(97.46)
60804
(43.68)
1498.73
(47.44)
1475.92
(37.33)
2003-04 71
(-6.57)
65901
(0.27)
11343
(0.99)
14293
(0.99)
61413
(1.00)
1603.64
(7.00)
1593.99
(8.0)
2004-05 74
(4.22)
65956
(0.08)
11476
(1.17)
14387
(0.65)
61626
(0.34)
1644.82
(2.55)
1649.90
(3.51)
2005-06 76
(2.70)
66120
(0.24)
11643
(1.45)
14583
(1.36)
61872
(0.40)
1689.26
(2.73)
1694.73
(2.73) Source- District Deputy Registrar, Co-operative Societies, Ahmednagar, Various Years.
287
Consumer‟s co-operatives are playing a significant role in protecting the interest
of consumers. The middlemen treat various malpractices enlarges the gap between the
purchase price and selling price and earn lot of benefits and profit which restricted
through these consumers co-operatives. Duplicate goods, false weights, exorbitant price,
inferior goods and adulteration, spurious medicines, defective items, etc. types of ways
used to earn more profit.
Table No.7.6.32 shows the progress of Consumer‟s Co-operative Societies in
Ahmednagar District (Wholesale & Primary Societies) during 1996-97 to 2005-06.
Number of consumer‟s co-operative societies increased from 69 to 76 in Ahmednagar
district during 1996-97 to 2005-06. Therefore, growth rate showed a fluctuating trend
over the period which was negative during year 2000-01 and 2003-04, as -11.84% and -
6.57%. number of members increased from 48712 to 66120 during the same period, even
growth rate was uneven and negative during year 2000-01 as -4.89 per cent. Share capital
increased from Rs.5223 lacks to Rs.66120 lacks during the same period, growth shown a
fluctuating trend but positive. Reserve and other funds increased from Rs.4755 lacks to
Rs.14583 lacks during 1996-97 to 2005-06, growth rate showed a fluctuating trend and
negative during year 2000-01 as -1.39 per cent. Working capital increased from Rs.24625
lacks to Rs.61872 lacks during the same period, even growth rate was uneven but positive
for the whole study period. Purchasing price of consumer‟s co-operative society in
Ahmednagar district increased from Rs.597.54 lacks to Rs.1689.26 lacks during the same
period, therefore, growth rate showed a fluctuating but positive trend. Selling price
increased from Rs.627.81 lacks to Rs.1694.73 lacks during 1996-97 to 2005-06, even
growth rate was uneven therefore positive during the study period in the context of
economic reforms. Therefore, societies have earned increasing gross income. In the
economic reforms period consumers‟ co-operatives are expected to do much more for the
welfare of society by safeguarding them from the clutches of ruthless exploitation.

288
Table No.7.6.33- Progress of Housing Co-operative Societies in Ahmednagar Dist. (Rs. In Lacks)
Year/ Items No. of
Societies
No. of
Members
Share
Capital
Reserve &
Other
Funds
Working
Capital
No. of
Contracted
Houses
1996-97 552 16753 7374 1494 492336 1197
1997-98 566
(2.53)
17183
(2.56)
7703
(4.46)
2076
(38.95)
504107
(2.39)
791
(-33.91)
1998-99 587
(3.71)
17906
(4.20)
7923
(2.85)
2238
(7.80)
547401
(8.58)
749
(-5.31)
1999-00 586
(-0.17)
18278
(2.07)
8266
(4.33)
2658
(18.76)
561004
(2.48)
710
(-5.20)
2000-01 574
(-2.04)
18096
(-0.99)
8583
(3.83)
2883
(8.46)
647982
(15.50)
711
(0.14)
2001-02 583
(1.56)
18809
(3.94)
8657
(0.86)
3646
(26.46)
708170
(9.28)
525
(-26.16)
2002-03 601
(3.08)
19640
(4.41)
8854
(2.27)
4089
(12.15)
747211
(5.51)
459
(-12.57)
2003-04 603
(0.33)
19902
(1.33)
8972
(1.33)
4144
(1.34)
757105
(1.32)
491
(6.97)
2004-05 621
(2.98)
20143
(1.21)
9131
(1.77)
4278
(3.23)
764890
(1.02)
495
(0.81)
2005-06 638
(2.73)
20766
(3.09)
9565
(4.75)
4354
(1.77)
773621
(1.14)
502
(1.41) Source- District Deputy Registrar, Co-operative Societies, Ahmednagar, Various Years.
Purchasing of land, construction, etc. for building houses is just not possible for a
common poor man which is possible to ensue with a collective action. Out of the various
primary needs house or shelter is one, housing co-operative societies helps to fulfill this
requirement of their member. As per economies of scale individually construction is
more expensive compare to collective constructed houses.
Table No.7.6.33 shows the progress of Housing Co-operative Societies in
Ahmednagar District during 1996-97 to 2005-06. Number of societies increased from 552
to 638 during the same period, growth rate showed a fluctuating trend which was
negative during year 1999-00 as -0.17 per cent and 2000-01 as -2.04 per cent. Number of
members increased from 16753 to 20766 during 1996-97 to 2005-06, even growth rate
was uneven which was negative during year 2000-01 as -0.99%. Share capital increased
from Rs.7374 lacks to Rs.9565 lacks during the same period, growth rate was uneven but
positive. Reserve and other funds increased from Rs.1494 lacks to Rs.4354 lacks during
1996-97 to 2005-06, growth rate shown a fluctuating trend, therefore, it was positive.
Working capital increased from Rs.492336 lacks to Rs.773621 lacks during the same
period, even growth rate was uneven but positive. Number of constructed houses during

289
year 1996-97 were 1197, in year 2005-06 it was 502, therefore, growth rate showed a
fluctuating trend, during the study period growth rate found effected and negative.
Table No.7.6.34- Progress of Co-operative Labor Contract Societies in Ahmednagar. (Rs. In Lacks)
Year/
Items
No. of
Societies
No. of
Members
Share
Capital
Reserve
& Other
Funds
Working
Capital
No. of
Works
in Hand
Price of
Works
Total
Paid
Wages
1996-97 513 35449 3458 1116 120846 1984 3013.82 1498.37
1997-98 528
(2.92)
35382
(-0.18)
3537
(2.28)
1504
(34.76)
131718
(8.99)
2117
(6.70)
3427.43
(13.74)
1643.21
(9.68)
1998-99 592
(12.12)
39814
(12.52)
3724
(5.28)
1609
(6.98)
134942
(2.44)
3314
(56.54)
3991.50
(16.45)
1825.64
(11.07)
1999-00 606
(2.36)
41374
(3.91)
4860
(30.50)
1656
(2.92)
135541
(0.44)
2991
(-9.74)
4156.00
(4.13)
1904.52
(4.32)
2000-01 783
(29.20)
52623
(27.18)
5014
(3.17)
1861
(12.38)
153810
(13.47)
3989
(33.36)
7017.96
(68.84)
3214.48
(68.80)
2001-02 787
(0.51)
53119
(0.94)
5297
(5.64)
1974
(6.07)
166681
(8.36)
2136
(-46.45)
4078.61
(-41.88)
1844.32
(-42.62)
2002-03 838
(6.48)
56104
(5.62)
5898
(11.34)
2339
(18.49)
187854
(12.70)
2589
(21.20)
4536.11
(11.23)
2141.92
(16.10)
2003-04 824
(-1.67)
56665
(0.99)
5957
(1.00)
2362
(0.98)
189733
(1.00)
2774
(7.14)
6171.87
(36.04)
3703.12
(72.95)
2004-05 880
(6.79)
57878
(2.14)
6087
(2.13)
2410
(2.03)
196201
(3.40)
2882
(3.89)
6282.26
(1.79)
3926.32
(6.02)
2005-06 945
(7.38)
58457
(1.00)
6171
(1.35)
2486
(3.15)
199387
(1.62)
2956
(2.56)
6371.32
(1.41)
4183.03
(6.54) Source- District Deputy Registrar, Co-operative Societies, Ahmednagar, Various Years.
Agricultural sector as well as industrial sector needs labor for production. Co-
operative societies of labor provide labor on contract basis for various production
operations in collective mode. It will not only facilitate production sector but laborer also
as they can get more income to their labor through collective bargaining. Insurance,
welfare facilities, various rights keep secured by the collective action.
Table No.7.6.34 shows the progress of Co-operative Labor Contract Societies in
Ahmednagar during 1996-97 to 2005-06. Number of Societies during 1996-97 to 2005-06
increased from 513 to 945, growth rate showed a fluctuating trend which was negative
during year 2003-04 as -1.68%. Number of members increased from 35449 to 58547
during the same period, even growth rate was uneven and shown a negative growth
during 1997-98 as -0.18%. Share capital increased from Rs.3458 lacks to Rs.6171 lacks
during 1996-97 to 2005-06, growth rate showed a fluctuating trend though growth rate
was positive. Reserve and other funds increased from Rs.1116 lacks to Rs.2486 lacks,
growth shown a fluctuating trend over the period, although growth rates shown a positive
trend. No of works in hands during the study period increased from 1984 to 2956 showed

290
good progress, therefore, growth rate was uneven and shown negative growth during year
1999-00 as -9.74% and in 2001-02 as -46.45%. Price of works stood on Rs.3012.82 lacks
in 1996-97 increased up to Rs.6371.32 lacks during year 2005-06, therefore, growth
showed a fluctuating trend which was negative during 2001-02 as -41.88%. Total paid
wages increased from Rs.1498.37 lacks to Rs.4183.03 lacks during the same period, even
growth rate was uneven and negative during year 2001-02 as -42.62%, growth rate was
remarkable during years 2003-04 and 2000-01, as 72.95% and 68.80%, respectively.
Table No.7.6.35- Progress of Co-operative Transportation Societies in Ahmednagar. (Rs. In Lacks)
Year/ Items No. of
Societies
No. of
Members
Share Capital Reserve &
Other Funds
Working
Capital
1996-97 7 1142 1410 3380 18732
1997-98 11
(57.14)
1349
(18.12)
1498
(6.24)
3839
(13.58)
19438
(3.76)
1998-99 11
(0.0)
1547
(14.67)
1636
(9.21)
4187
(9.06)
21762
(11.95)
1999-00 13
(18.18)
1622
(4.84)
1665
(1.77)
4312
(2.98)
22156
(1.81)
2000-01 14
(7.69)
1714
(5.67)
1732
(4.02)
4653
(7.90)
26204
(18.27)
2001-02 17
(21.42)
1871
(9.16)
2623
(51.44)
6373
(36.96)
29525
(12.67)
2002-03 21
(23.53)
2096
(12.02)
2661
(1.44)
7607
(19.36)
30937
(4.78)
2003-04 23
(9.52)
2319
(10.64)
2943
(10.59)
8415
(10.62)
34222
(10.61)
2004-05 23
(0.0)
2319
(0.0)
2987
(1.49)
8564
(1.77)
34678
(1.33)
2005-06 24
(4.34)
2406
(3.75)
3141
(5.15)
8685
(1.41)
35132
(1.31) Source- District Deputy Registrar, Co-operative Societies, Ahmednagar, Various Years.
A small agriculturist who is marginal does not have the means of transportation
necessary for delivering its produce to the market or besides the small volume of its
production farmer puts it in an unfavorable bargaining position with respect to
intermediaries and wholesalers, a co-operative act as an assimilator and collecting the
output of its small members for delivering it in large aggregate quantities through the
marketing channels to get more benefits for these small farmer members who do not have
resources and exploited through the intermediaries.
Table No.7.6.35 shows the progress of Co-operative Transportation Societies in
Ahmednagar district during 1996-97 to 2005-06. Number of societies increased for 7 to
24 during 1996-97 to 2005-06; therefore, growth rate was fluctuating and constant during
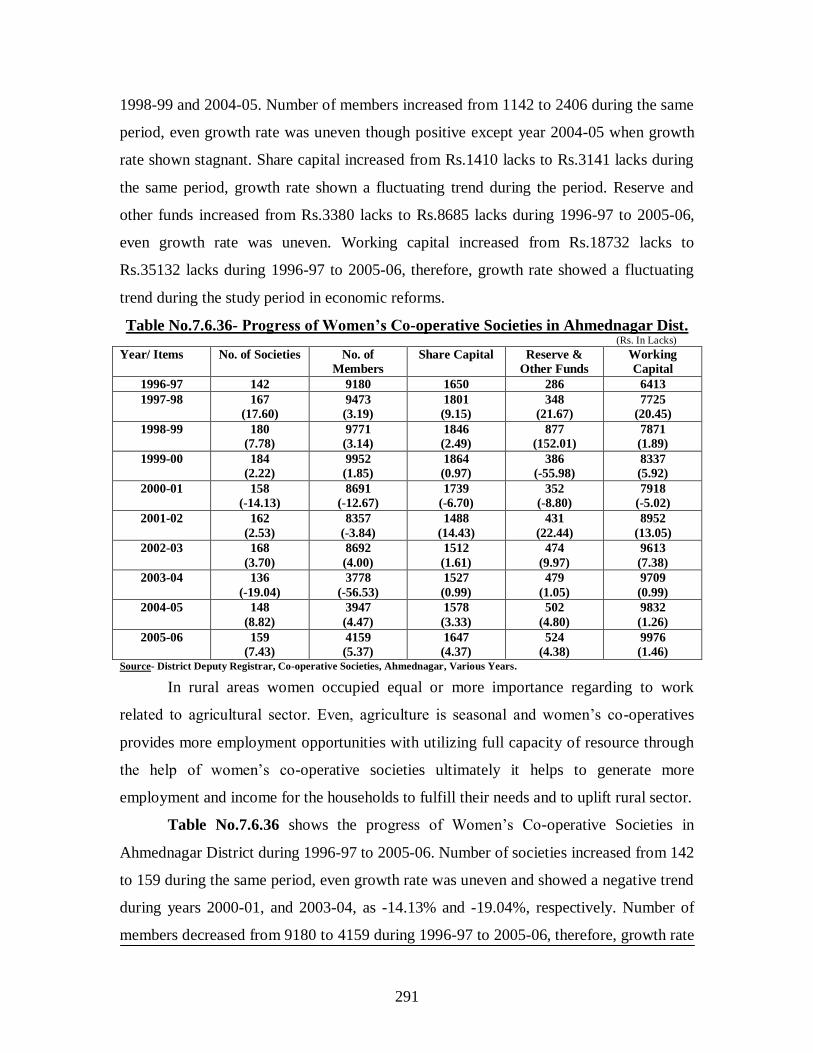
291
1998-99 and 2004-05. Number of members increased from 1142 to 2406 during the same
period, even growth rate was uneven though positive except year 2004-05 when growth
rate shown stagnant. Share capital increased from Rs.1410 lacks to Rs.3141 lacks during
the same period, growth rate shown a fluctuating trend during the period. Reserve and
other funds increased from Rs.3380 lacks to Rs.8685 lacks during 1996-97 to 2005-06,
even growth rate was uneven. Working capital increased from Rs.18732 lacks to
Rs.35132 lacks during 1996-97 to 2005-06, therefore, growth rate showed a fluctuating
trend during the study period in economic reforms.
Table No.7.6.36- Progress of Women’s Co-operative Societies in Ahmednagar Dist. (Rs. In Lacks)
Year/ Items No. of Societies No. of
Members
Share Capital Reserve &
Other Funds
Working
Capital
1996-97 142 9180 1650 286 6413
1997-98 167
(17.60)
9473
(3.19)
1801
(9.15)
348
(21.67)
7725
(20.45)
1998-99 180
(7.78)
9771
(3.14)
1846
(2.49)
877
(152.01)
7871
(1.89)
1999-00 184
(2.22)
9952
(1.85)
1864
(0.97)
386
(-55.98)
8337
(5.92)
2000-01 158
(-14.13)
8691
(-12.67)
1739
(-6.70)
352
(-8.80)
7918
(-5.02)
2001-02 162
(2.53)
8357
(-3.84)
1488
(14.43)
431
(22.44)
8952
(13.05)
2002-03 168
(3.70)
8692
(4.00)
1512
(1.61)
474
(9.97)
9613
(7.38)
2003-04 136
(-19.04)
3778
(-56.53)
1527
(0.99)
479
(1.05)
9709
(0.99)
2004-05 148
(8.82)
3947
(4.47)
1578
(3.33)
502
(4.80)
9832
(1.26)
2005-06 159
(7.43)
4159
(5.37)
1647
(4.37)
524
(4.38)
9976
(1.46) Source- District Deputy Registrar, Co-operative Societies, Ahmednagar, Various Years.
In rural areas women occupied equal or more importance regarding to work
related to agricultural sector. Even, agriculture is seasonal and women‟s co-operatives
provides more employment opportunities with utilizing full capacity of resource through
the help of women‟s co-operative societies ultimately it helps to generate more
employment and income for the households to fulfill their needs and to uplift rural sector.
Table No.7.6.36 shows the progress of Women‟s Co-operative Societies in
Ahmednagar District during 1996-97 to 2005-06. Number of societies increased from 142
to 159 during the same period, even growth rate was uneven and showed a negative trend
during years 2000-01, and 2003-04, as -14.13% and -19.04%, respectively. Number of
members decreased from 9180 to 4159 during 1996-97 to 2005-06, therefore, growth rate
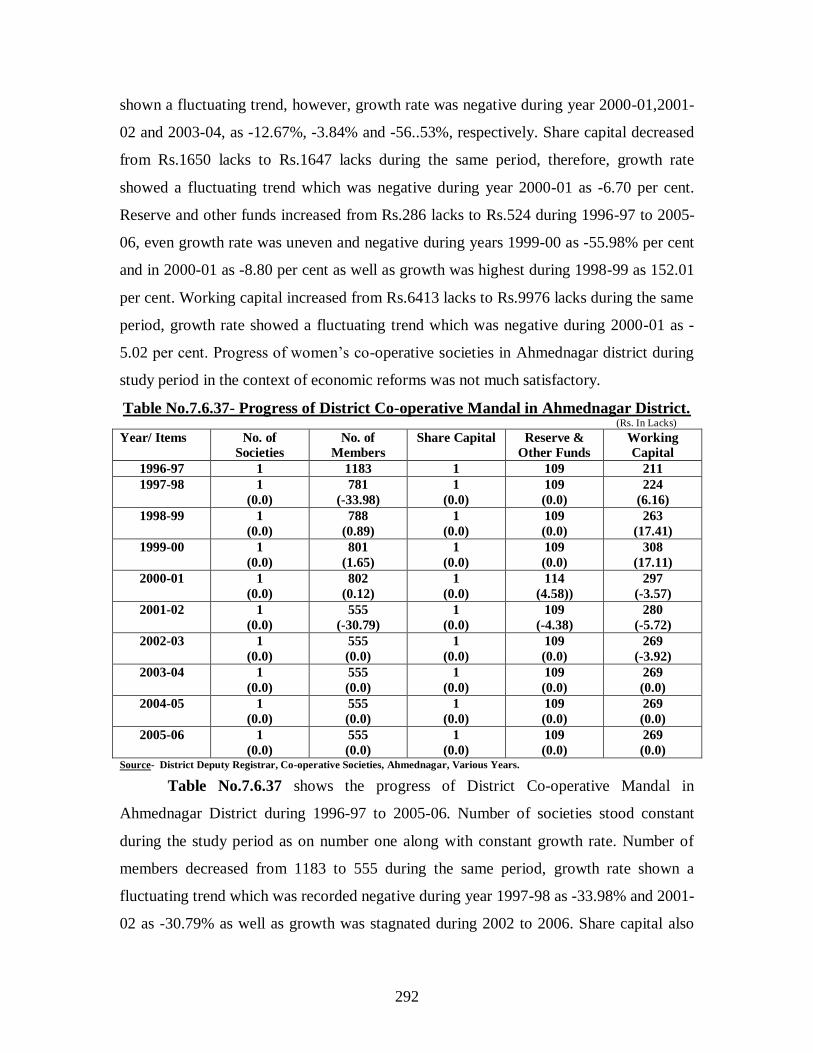
292
shown a fluctuating trend, however, growth rate was negative during year 2000-01,2001-
02 and 2003-04, as -12.67%, -3.84% and -56..53%, respectively. Share capital decreased
from Rs.1650 lacks to Rs.1647 lacks during the same period, therefore, growth rate
showed a fluctuating trend which was negative during year 2000-01 as -6.70 per cent.
Reserve and other funds increased from Rs.286 lacks to Rs.524 during 1996-97 to 2005-
06, even growth rate was uneven and negative during years 1999-00 as -55.98% per cent
and in 2000-01 as -8.80 per cent as well as growth was highest during 1998-99 as 152.01
per cent. Working capital increased from Rs.6413 lacks to Rs.9976 lacks during the same
period, growth rate showed a fluctuating trend which was negative during 2000-01 as -
5.02 per cent. Progress of women‟s co-operative societies in Ahmednagar district during
study period in the context of economic reforms was not much satisfactory.
Table No.7.6.37- Progress of District Co-operative Mandal in Ahmednagar District. (Rs. In Lacks)
Year/ Items No. of
Societies
No. of
Members
Share Capital Reserve &
Other Funds
Working
Capital
1996-97 1 1183 1 109 211
1997-98 1
(0.0)
781
(-33.98)
1
(0.0)
109
(0.0)
224
(6.16)
1998-99 1
(0.0)
788
(0.89)
1
(0.0)
109
(0.0)
263
(17.41)
1999-00 1
(0.0)
801
(1.65)
1
(0.0)
109
(0.0)
308
(17.11)
2000-01 1
(0.0)
802
(0.12)
1
(0.0)
114
(4.58))
297
(-3.57)
2001-02 1
(0.0)
555
(-30.79)
1
(0.0)
109
(-4.38)
280
(-5.72)
2002-03 1
(0.0)
555
(0.0)
1
(0.0)
109
(0.0)
269
(-3.92)
2003-04 1
(0.0)
555
(0.0)
1
(0.0)
109
(0.0)
269
(0.0)
2004-05 1
(0.0)
555
(0.0)
1
(0.0)
109
(0.0)
269
(0.0)
2005-06 1
(0.0)
555
(0.0)
1
(0.0)
109
(0.0)
269
(0.0) Source- District Deputy Registrar, Co-operative Societies, Ahmednagar, Various Years.
Table No.7.6.37 shows the progress of District Co-operative Mandal in
Ahmednagar District during 1996-97 to 2005-06. Number of societies stood constant
during the study period as on number one along with constant growth rate. Number of
members decreased from 1183 to 555 during the same period, growth rate shown a
fluctuating trend which was recorded negative during year 1997-98 as -33.98% and 2001-
02 as -30.79% as well as growth was stagnated during 2002 to 2006. Share capital also

293
stood constant during the same period as only Rs.1, growth rate was naturally constant on
zero. Reserve and other funds which was stood on Rs.109 lacks during year 1996-97 also
stood same during year 2005-06, therefore, growth rate shown a fluctuating trend during
the same period as it was increased during 2000-01 from Rs.109 lacks to Rs.114 lacks,
growth rate was 4.58% and decreased during 2001-02 from Rs.114 lacks to Rs.109 lacks,
growth rate shown a negative trend as -4.38%. working capital increased from Rs.211
lacks to Rs.269 lacks during the same period, growth rate was uneven and shown a
negative trend during years 2000-01, 2001-02 and 2002-03, as -3.57%, -5.72% and -
3.92%, respectively. Growth rate of working capital was constant during 2002-03 to
2005-06 for last four years of study period on Rs.269 lacks. Table revealed that the
progress is stagnated over the period.
Table No.7.6.38- Progress of Other Co-operative Societies in Ahmednagar District.
(Rs. In Lacks)
Year/ Items No. of
Societies
No. of
Members
Share Capital Reserve &
Other Funds
Working
Capital
1996-97 50 95365 29416 189143 698357
1997-98 48
(-4.0)
105879
(11.02)
32417
(10.20)
349116
(84.57)
1347882
(93.00)
1998-99 53
(10.41)
107918
(1.92)
33129
(2.19)
408132
(16.90)
1475118
(9.44)
1999-00 53
(0.0)
108448
(0.49)
33961
(2.51)
411942
(0.93)
1589131
(7.73)
2000-01 89
(67.92)
110469
(1.86)
38725
(14.02)
418594
(1.61)
1634518
(2.85)
2001-02 111
(24.72)
112072
(1.45)
39317
(1.52)
420135
(0.36)
1724158
(5.48)
2002-03 160
(44.14)
133792
(19.38)
41462
(5.45)
913795
(117.50)
3052914
(77.06)
2003-04 174
(8.75)
133792
(0.0)
45540
(9.83)
1003689
(9.83)
3353244
(9.83)
2004-05 179
(2.87)
134371
(0.43)
46270
(1.60)
1009786
(0.60)
3398398
(1.34)
2005-06 186
(3.91)
134886
(0.38)
46880
(1.31)
1018442
(0.85)
3427542
(2.62) Source- District Deputy Registrar, Co-operative Societies, Ahmednagar, Various Years.
Agro-based co-operative societies and other service so-operative societies also
play an important role in the development of rural economy. Agricultural sector do not
provides full time work to farmer so people depending on agriculture can effectively use
their rest time in active work for more income which helps to increase employment,
income.

294
Table No.7.6.38 shows the progress of Other Co-operative Societies in
Ahmednagar District during 1996-97 to 2005-06. Number of societies increased 50 to
186 during the same period, growth rate showed a fluctuating trend which was negative
during year 1997-98 as -4.0 per cent, constant during 1999-00 and recorded highest
during year 2000-01 as 67.92 per cent. Number of members increased from 95365 to
134886 during the same period, even growth rate was uneven although positive. Share
capital increased from Rs.29416 lacks to Rs.46880 lacks during 1996-97 to 2005-06,
growth rate shown a fluctuating trend over the period however growth rate was positive.
Reserve and other funds increased from Rs.189143 lacks to Rs.1018442 during the same
period, growth rate was uneven and shown highest growth during year 2002-03 as 117.50
per cent and in 1997-98 as 84.57 per cent. Working capital increased from Rs.698357
lacks to Rs.3427542 lacks during the same period, growth rate shown a fluctuating trend
but positive over the period, which was highest during 1997-98 as 93.00% and in 2002-
03 as 77.06%. Other Co-operative Societies in Ahmednagar district during 1996-97 to
2005-06 showed fairly good progress in the context of economic reforms.
Table No.7.6.39- Audit Position of Co-operative Societies in Ahmednagar District.
Years ‘A’ Audit
Class
‘B’ Audit
Class
‘C’ Audit
Class
‘D’ Audit
Class
Non-
Classified
Non-
Audited
Total
Co-op. Stys
1996-97 860 1140 1011 105 0 3904 7020
1997-98 870
(1.16)
1188
(4.21)
1067
(5.54)
114
(8.57)
0 4155
(6.43)
7394
(5.32)
1998-99 882
(1.38)
1235
(3.95)
1194
(11.90)
103
(-9.65)
0 4429
(6.59)
7843
(6.07)
1999-00 903
(2.38)
1282
(3.80)
1321
(10.63)
99
(-3.88)
0 4454
(0.56)
8059
(2.75)
2000-01 926
(2.54)
1310
(2.18)
1436
(8.70)
112
(13.13)
0 4653
(4.46)
8437
(4.69)
2001-02 912
(-1.51)
1331
(1.60)
1596
(11.14)
137
(22.32)
0 4737
(1.74)
8713
(3.27)
2002-03 858
(-5.92)
1349
(1.35)
1834
(14.91)
147
(7.30)
0 5011
(5.78)
9199
(5.57)
2003-04 1017
(18.53)
1494
(10.74)
1798
(-1.96)
120
(-18.36)
0 4881
(-2.59)
9310
(1.20)
2004-05 908
(-10.71)
1449
(-3.01)
1896
(5.56)
175
(45.83)
0 5051
(3.48)
9479
(1.81)
2005-06 888
(-2.20)
1427
(-1.51)
1869
(-1.42)
164
(-6.28)
0 4937
(-2.25)
9285
(-2.04)
Source- District Social and Economic Analysis, Ahmednagar District, 2008.

295
Table No.7.6.39 shows the progress of Audit Position of Co-operative Societies
in Ahmednagar District during year 1996-97 to 2005-06. Total co-operative societies
increased from 7020 to 9285 during 1996-97 to 2005-06, therefore, growth rate shown a
fluctuating trend over the period, growth rate was negative during year 2005-06 as -2.04.
Number of non-audited co-operative societies increased from 3904 to 4937, growth rate
shown a fluctuating trend over the period, which was negative 2003-04 and 2005-06, -
2.59 and -2.25, respectively. Number of non-classified societies stood constant on zero
during the same period. „A‟ audit class obtained co-operative societies increased from
860 to 888 during 1996-97 to 2005-06 showed a fluctuating growth rate which was
negative during 2001-02, 2002-03, 2004-05 and 2005-06, -1.51, -5.92, -10.71 and -2.20,
respectively. Out of total societies only 9.56 per cent societies are laying in „A‟ class. „B‟
audit class obtained co-operative societies increased from 1140 to 1427 during the same
period, growth rate showed a fluctuating trend, it was negative during year 2005-06 (-
1.42). Out of total societies „B‟ class societies have obtained 15.36 per cent. Number of
societies obtained „C‟ audit class were 1011 during 1996-97 increased up to 1869 during
2005-06, growth rate was uneven which showed negative growth during year 2003-04 (-
1.96) and in 2005-06 (-1.42), therefore, „C‟ societies have 20.13 per cent to total
societies. Co-operative societies obtained „D‟ audit class increased from 105 in 1996-97
to 164 in 2005-06, showed a fluctuating growth rate as in year 1998-99 (-9.65), 1999-00
(-3.88), 2003-04 (-18.36) and in year 2005-06 (-6.28) growth rate was negative. „D‟
societies were 1.76 per cent to total co-operative societies. Table showed that the
progress was uneven and „C‟ class obtained societies are more, then „B‟, “A‟ and „D‟
societies ranks.
Table No.7.6.40- Number of License-Holder Moneylenders and Issued Loans.
(Rs. in Thousands)
Year License-Holder No.
of Moneylenders
Loans Issued to
Businessmen
Loans Issued to
Others
Total (3+4)
(1) (2) (3) (4) (5)
1996-97 35 4545 5891 10436
1997-98 41
(17.14)
7937
(74.63)
6790
(15.26)
14727
(41.11)
1998-99 43
(4.87)
752
(-90.52)
24541
(261.42)
25293
(71.74)
(Continue…)

296
1999-00 29
(-32.55)
516
(-31.38)
17715
(-27.81)
18231
(-27.92)
2000-01 17
(-41.38)
368
(-28.87)
11703
(-33.93)
12071
(-33.78)
2001-02 24
(41.17)
791
(95.38)
6317
(-46.02)
7108
(-41.11)
2002-03 16
(-33.33)
9214
(1064.85)
3725
(-41.02)
12939
(82.03)
2003-04 37
(131.25)
10418
(13.06)
3915
(5.10)
14333
(10.77)
2004-05 39
(5.40)
5729
(-45.00)
4110
(4.98)
9839
(-31.35)
2005-06 62
(58.97)
9475
(65.38)
5515
(34.18)
14990
(52.35) Source- District Social and Economic Analysis, Ahmednagar District, 2008.
Table No.7.6.40 shows number of license-holder moneylenders and loans issued
by them during year 1996-97 to 2005-06 in Ahmednagar district. Number of license
holder moneylenders increased from 35 to 62 during the same period, even growth rate
shown a fluctuating trend during the same period, growth rate was negative during years
1999-00, 2000-01 and 2002-03, as -32.55%, -41.38% and -33.33%, respectively. Growth
rate was highest during year 2003-04 when license-holder moneylenders increased from
16 to 37 with 131.25% growth rate and during year 2005-06 from 39 to 62 with 58.97 %
growth rate. Loans issued to businessmen by license-holder moneylenders increased from
Rs.4545 thousands to Rs.9475 lacks during the same period, even growth rate was
uneven and recorded negative during years 1998-99, 1999-00,2000-01 and 2004-05, as -
90.52%, 31.38%, -28.87% and -45.00%, respectively. Growth rate of loans issued to
businessmen was recorded highest during year 2002-03 as 1064.85 per cent. Loans issued
to others increased from Rs.5891 lacks to Rs.5515 lacks during 1996-97 to 2005-06,
therefore, growth rate showed fluctuating trend over the period, growth rate showed a
negative trend during 1999-00, 2000-01,2001-02 and 2002-03, as -27.81%, -33.93%, -
46.02% and -41.02%, respectively. Total loans issued by license-holder moneylenders
during the study period showed increase from Rs.10436 lacks to Rs.14990 lacks,
therefore, growth rate showed a fluctuating trend which was negative during year 1999-
00, 2000-01, 2001-02 and 2004-05, as -27.92%, -33.78%, -41.11% and -31.35%,
respectively. As well as total loans issued was highest for 2002-03 as 82.03%, 1998-99 as
71.74% and 2005-06 as 52.35%. Table shows that the number of license-holder
moneylenders and loans issued by them during year 1996-97 to 2005-06 in Ahmednagar
district shown a fairly good progress which is indicated that they are still in good position

297
and compete with other institutional financing institutions like co-operatives and
commercial banks.
7.7- SUMMARY-
The task of surviving and sustainable development would become more difficult
if proper action is not exercise. Hence, the active co-operatives are improving their
business efficiency and customer services by adopting and implementing a rational and
creative policy of mobilization of funds and lending. Co-operative is considered as an
engine of growth. Co-operative has spread in all areas creating awareness, interest, zeal
and encouragement in rural areas. Co-operative not only provides services but it helps
farmers to in raising productivity, technical assistance, increases employment generation,
increases competitiveness and bringing about poverty reduction especially in rural areas.
Co-operative functions are integrated with national economy. It raises confidence of rural
masses achieving success. Co-operatives secure equalities and social security to their
members. The co-operative movement in Ahmednagar district have made considerable
progress in credit as well as in non- credit sector. Co-operatives have spread nearly in
every field of economy; co-operative processing, co-operative marketing, co-operative
milk, housing and industrial co-operatives. However, the co-operative movement in
Ahmednagar district was uneven during the study period in the context of economic
reforms. There are different reasons are responsible, co-operative serving in different
sector have different activities and causes for uneven progress, therefore, if these
weaknesses are properly identified and proper remedy applied for them it will remove.