Embed Size (px)
Citation preview

59
2CHAPTER
Income Inequality and Structural Change
Inequality is considered by some to be of little social con-cern. As long as poverty is minimized, it is argued, there should be no principled objection to the unbridled gains of the very rich. In some hands, this argument becomes one of active advocacy: that the concentration of wealth should be cultivated to generate savings, investment and growth.1 Yet the fact that high levels of inequality are often found in the poorest countries exposes the weakness of this argu-ment. Evidence suggests, in fact, a two-way causal relation-ship between poverty and inequality. There are additional important grounds for a concern with inequality. The inter-national human rights framework commits governments to uphold equality in civil and political rights and to take steps progressively to achieve this. Furthermore, some notion of equity is central to the construction of socially inclusive states and the realization of substantive citizenship.2
High levels of inequality are often found in the poorest countries, and evidence suggests a two-way causal relationship between poverty and inequality
Easing inequality has, however, been marginal to the pov-erty reduction agenda of the international development community in recent years. Apart from a commitment to eliminate gender disparities in primary and secondary edu-cation, the Millennium Development Goals (MDGs) do not explicitly focus on inequalities, despite the affi rmation of the principles of equality laid out in the Millennium Dec-laration. More recently, several reports3 have underscored the intrinsic value of equality as well as its relevance for achieving growth and reducing poverty. But the view artic-ulated in the World Bank’s World Development Report 2006
emphasizes equality of opportunities as opposed to outcomes. This argument justifi es unequal outcomes if the processes that generate them are “fair”,4 and advocates interventions only to protect those who fall below an absolute thresh-old of need. Such a view results in a weak redistributive agenda that shies away from any serious consideration of wealth and income redistribution now, emphasizing instead investments in opportunities that might produce a more equitable future.5
This chapter examines the causes, patterns and dynam-ics of inequality, with a particular focus on inequalities of income and wealth, often referred to as vertical inequali-ties. Inequalities among groups (horizontal inequalities) or based on factors that determine identity, such as ethnicity and gender, will be dealt with in chapters 3 and 4. In this and subsequent chapters, emphasis is placed on both the intrinsic and instrumental value of redistributive policies and processes that lead to equitable outcomes.
Based on extensive analysis of country case studies, the chapter demonstrates that increases in inequality are linked to a range of economic policies that have dominated the development agenda in recent decades. These include fi nancial liberalization, regressive taxation, privatization in the context of weak regulation, public expenditure poli-cies that fail to protect the poor during crisis or adjustment periods, and labour market policies that lead to precarious forms of fl exibility, informalization and an erosion of mini-mum wages and union bargaining power.6 Other causes of rising inequality include disparities in educational attain-ment, technological change and employment policies that widen wage gaps between skilled and unskilled workers; rural-urban wage differentials in the process of structural change; inequality in asset ownership (including land); and unequal access to credit and basic production inputs, particularly in the agricultural sector.
COMBATING POVERTY AND INEQUALITY
60
Increases in inequality are linked to a range of economic policies that have dominated the development agenda in recent decades
Chapter 1 has argued that the overall structure of employ-ment, and the distribution of employment across sectors, has signifi cant implications for the well-being of a popula-tion and for poverty reduction. Continuing this line of rea-soning, this chapter discusses the importance of structural change, changing global intersectoral terms of trade and macroeconomic policies for the evolution of inequality. It argues that despite the importance of structural change in determining levels of inequality, there is no single pat-tern that holds for all countries across time. Instead, as the case studies illustrate, (i) redistributive policies can mod-erate inequalities even at early stages of industrialization, and (ii) rapidly industrializing economies with a previ-ously egalitarian income distribution may experience rising in equalities in the absence of corrective measures. Further-more, (iii) most low-income agrarian societies that have not yet experienced sustained growth and industrialization, and whose public policies lack a redistributive focus, gener-ally have high levels of inequality; and (iv) the growing dominance of the fi nancial and technological sectors in national economies, especially in contexts where economic policies favour market liberalization and less redistribution, increases inequality.
This chapter also shows that structural change – in terms of the changing roles of agriculture, industry and services in an economy – and the global terms of trade among these sectors are closely related. In the short run, global terms of trade have a direct effect on inequality in a liberalized economy. For instance, a fall in global commodity prices tends to drive up inequality in agrarian economies by low-ering the relative incomes of commodity producers. A tech-nology bubble raises incomes at the top. High interest rates are, in general, bad for debtors and good for creditors; they thus raise inequality since the latter are almost invariably richer than the former. This underscores the importance of
global governance of fi nancial and commodity markets and the management of global monetary policy.
Reducing inequality has value in its own right, and also yields substantial benefi ts in terms of both poverty reduction and growth. There are a number of mutually supportive redistributive policies that governments can adopt, including:
land reform, especially in highly unequal economies • where the poor depend substantially on land for their livelihoods;fi scal reforms that improve tax administration, • prevent tax evasion and avoidance, and limit opposition to progressive taxation and redistribution (see also chapters 8 and 10);income-generating employment opportunities • (as discussed in chapter 1); andexpenditure-related policies that enhance the welfare • of the poor (such as the range of social policies discussed in Section two of this report).
Reducing inequality has value in its own right and also yields benefi ts in terms of both poverty reduction and growth
In sum, four key messages are highlighted in this chapter.Income inequality is on the rise, partly as a result • of neoliberal economic policies adopted in the 1980s and 1990s.Growth and equity can be mutually reinforcing, • but only when supported by well-thought-out economic and social policies. Such policies should pay particular attention to the needs of small farmers.Successful implementation of redistributive policies • calls for a stronger state role.Global forces are now a major factor in the movement • of inequality within and between countries, and should be managed more deliberately to avoid negative repercussions for the poorest countries.

SECTION ONE – CHAPTER 2 – INCOME INEQUALITY AND STRUCTURAL CHANGE
61
The chapter is organized as follows.
Section 1 discusses why inequality matters in the fi ght against poverty.
Section 2 reviews the evidence for trends in inequality globally.
Section 3 examines the links between structural change and global intersectoral terms of trade in contributing to inequality. It also discusses how both domestic structural change and external forces affect inequality in a number of countries representing different patterns and stages of development.
Section 4 concludes with a discussion of redistributive policies that governments can adopt to create wealthier, more equitable societies.
1. Income Equality and Poverty Reduction
As noted above, equity has intrinsic value and is central to the achievement of human rights and citizenship. One dimension of inequality – related to income and wealth – is closely linked to poverty. At the most basic level, the distribution of income within a country has a direct impact on the welfare of its people. A more equal distribution of national income means that aggregate welfare (where the welfare of each individual is given equal weight) is higher for any given level of average per capita income, and poverty is lower.
While greater equality is often considered to come at the expense of growth, lower inequality can contribute to greater economic effi ciency
While greater equality is often considered to come at the expense of growth, there is also evidence that under some circumstances, and with appropriate institutional arrangements, lower inequality can contribute to greater economic effi ciency. The development of the Scandi-navian countries is illustrative here. Through a process known as the Meidner-Rehn mechanism,7 political com-mitment to egalitarian economic outcomes constrained business from competing on the basis of wage costs, which were consequently higher than those of their international competitors. Companies were therefore forced to raise labour productivity in order to stay competitive.8 This policy preceded the advance of the region from the mid-dle to the top of the European (and world) income scales. A similar effect was seen in the United States during the New Deal of the 1930s and the golden age of economic growth. For the European region as a whole, there is evi-dence that countries with lower inequality have better employment performance.9 In other words, business can absorb technological change at a faster pace in societies that systematically reduce disparities in pay structures, encouraging an increase in productivity and raising per capita incomes faster than the global average.
High levels of inequality inhibit development
At the same time, a growing body of evidence points to the negative relationship between high levels of inequality (often considered to be a Gini coeffi cient more than 0.4) and improvements in economic and social well-being.10 High levels of income inequality are dysfunctional for development for a number of reasons.11
First, high levels of inequality make it harder to • reduce poverty through growth. With high levels of inequality, growth tends to be concentrated in certain sectors, with those who are not linked to these growth sectors being excluded from the benefi ts. Such exclusion, in turn, lowers the potential for growth, particularly in a context of poverty, by constraining the productive capacity of the poor and thus their potential contribution to growth. Under such circumstances, a large proportion of the workforce (the poor) have

COMBATING POVERTY AND INEQUALITY
62
limited productive capacities for reasons that include inadequate nutrition and ill health, low levels of education or skills, a lack of employment opportunities or limited access to productive assets, such as land and credit. Furthermore, the economic exclusion of a signifi cant proportion of the population contributes to their social and political exclusion through processes of disempowerment and lack of recognition or representation.Second, high levels of inequality can also retard • growth by translating into lower effective aggregate demand in the economy. In highly unequal societies, the poor are more likely to be locked into a subsistence economy and have limited disposable income for the purchase of manufactured goods. This limits the size of the domestic market and hinders the potential for industrialization that is an important driver of growth.Third, high levels of inequality have negative • implications for the building of inclusive states that have the capacity to implement redistributive and progressive economic and social policies. High levels of inequality may also undermine the realization of civil, political, economic and social rights, and the exercise of substantive citizenship. Inequality is often a factor in rising levels of crime and social unrest, which are inimical to growth. In extreme cases, especially where inequality is manifested along ethnic lines, it can lead to war and the failure of the state (see chapter 3).Fourth, without deliberate policy interventions, • high levels of inequality tend to be self-perpetuating. They lead to the development of political and economic institutions that work to maintain the political, economic and social privileges of the elite. In highly unequal societies, the poor have little political infl uence; in the absence of meaningful representation to change underlying structures that perpetuate inequalities, they may become locked into poverty traps from which it is diffi cult to escape. Finally, even under conditions of rapid growth, • inequality is likely to be reinforced by the distribution of the externalities of growth. For example, the poor are most likely to bear directly the burden of environmental degradation arising from rapid
industrialization. Only when the fruits of growth are distributed equitably – either directly as income or socially through the provision of infrastructure and other public goods – is the statistical fact of a rising gross domestic product (GDP) experienced as an improvement in overall living conditions and well-being.
Only when the fruits of growth are distributed equitably is the statistical fact of a rising GDP experienced as an improvement in well-being
2. Global Trends in Inequality
The global income gap remains daunting
Economic growth is important in facilitating structural change that is poverty reducing.12 An assessment of the per capita incomes of major regions and countries from 1960–2006 illustrates the persistence of the global income gap and how little real and sustained economic growth has occurred for most developing economies, in terms of substantially improved per capita GDP. Although most countries in the developing world experienced episodes of growth during this period,13 that growth has not been sustained in most cases. Nor has it generated decent jobs. The income gap (in terms of per capita GDP) between rich and poor countries has not lessened.14 Figure 2.1 provides evidence on real per capita incomes (in constant 2000 US dollars) across some major country groupings for 1960–2006, illustrating the persistently large income gap between rich and poor countries. Indeed, the differ-ences in per capita incomes in 1960 were so large that even quite rapid growth in some regions over the subsequent four and half decades has not made the gap more respectable.

SECTION ONE – CHAPTER 2 – INCOME INEQUALITY AND STRUCTURAL CHANGE
63
Thus, while the per capita income of the fastest grow-ing developing region – East Asia – increased more than tenfold over this period (compared to an increase of less than threefold for the United States), in 2006, the average income in the United States was still 15 times that of East Asia. For other developing regions, per capita income gaps were even larger and are, in some cases, growing. Thus, the per capita GDP in 1960 of countries currently in the euro zone was 34 times that of South Asia; by 2006, this had increased slightly to 36 times. For sub-Saharan Africa, the widening gap is much starker. In 1960, the per capita income of countries now in the euro zone area was 15 times that of sub-Saharan Africa; by 2006, the difference was 38-fold.
FIGURE 2.1: Per capita income in 2000 US dollars
0
5000
10000
15000
20000
25000
30000
35000
40000
1960 1970 1980 1990 2000 2006
�Euro area
�United States
�East Asia and the Pacific
�Latin America and the Caribbean
�Middle East and the North Africa
�South Asia
�Sub-Saharan Africa
Source: Calculated from World Bank World Development Indicators online.
Income inequality has increased
in the majority of countries around
the world
Countries vary widely in the nature of their income distri-bution. The Gini coeffi cient – the most commonly used measure of income inequality – ranges from 0.20 in Slo-vakia to 0.74 in Namibia,15 on a scale where 0 represents perfect equality and 1 represents total inequality. In gen-eral, the variance in income inequality among developing countries is much higher than that among rich countries. Countries with per capita incomes of $20,000 or more have coeffi cients within the range of 0.25–0.45,16 whereas for many low-income countries they are more than 0.50. High inequality is thus a feature of underdevelopment.
Most developing countries experienced little real and sustained economic growth, in terms of substantially improved per capita GDP, over the past 45 years
In many developing countries, extreme inequalities are driven by highly skewed distribution in the ownership of land. A high level of inequality (see table 2.1), such as that found in many Latin American countries, is diffi -cult to transform without radical land reform. Conversely, more egalitarian land distribution creates a strong base for maintaining lower levels of inequality in the process of development. The initial structure of an economy – whether based on capital-intensive extractive industries or labour-intensive manufacturing, for example – also affects the level of income inequality likely to be found as well as the ease with which policies for income redistribution can be implemented.

COMBATING POVERTY AND INEQUALITY
64
TABLE 2.1: Landholding patterns in selected countries and regions
Country Year Distribution of landholding by percentile groups of agricultural households
Landless population
as % of rural population
(1988)
Lowest 20% Second 20% Third 20% Fourth 20% Highest 20%
South America
Bolivia 1978 5.8 5.8 5.8 9.3 73.3 10
Ecuador 1987 1.0 1.6 4.2 9.6 83.6 23
Peru 1984 3.3 3.3 3.3 17.1 73.0 19
Central America and the Caribbean
El Salvador 1985 5.1 5.1 5.1 10.6 74.1 41
Guatemala 1979 0.8 1.6 3.3 4.2 90.1 21
Honduras 1980–81 2.9 2.9 3.8 11.4 79.0 26
South Asia
Bangladesh 1983–84 2.3 5.4 12.5 23.6 56.2 20
India 1976–77 4.1 4.1 6.3 20.3 65.2 30
Nepal 1982 2.6 2.6 7.7 19.8 67.3 18
Southeast Asia and the Pacifi c
Indonesia 1976–77 3.0 6.2 11.3 24.0 55.5 15
Thailand 1978 4.0 8.3 16.3 24.2 47.2 15
Philippines 1981 3.2 8.1 11.6 20.4 56.7 34
Near East
Egypt 1984 11.2 11.2 11.2 11.2 55.2 25
Morocco 1981–82 6.8 6.8 6.8 21.6 58.0 15
West and Central Africa
Cameroon 1984 3.6 9.3 15.0 21.6 50.5
Ghana 1984 7.8 8.7 7.8 18.6 58.0
Southern Africa
Mozambique 1998Smallholders accounted for 95% of cultivated land, with the remaining 5% occupied by
state farms, cooperatives, private farms and joint ventures
South Africa 1994Smallholders held 13% of the land area, with 67,000 commercial farmers owning 86%
of the agricultural land
Zimbabwe 1993One million smallholders in communal lands owned 50% of agricultural land; 13,335 large
and medium commercial farms controlled 37% of the best agricultural land
Source: Ghimire 2001.

SECTION ONE – CHAPTER 2 – INCOME INEQUALITY AND STRUCTURAL CHANGE
65
The development experience of the fi rst wave of East Asian states demonstrates that rising inequality in the early stages of development is not inevitable. In the case of the Republic of Korea and Taiwan Province of China, radical land reforms that preceded industrialization, the use of labour-intensive technologies during the early stages of industrialization, and investments in human capital that helped balance out opportunities available in urban and rural settings and across income groups were important factors in preventing the growth of inequality. High levels of growth without ris-ing inequality were also seen in Singapore and Hong Kong, China, both city-states where agriculture was insignifi cant but where governments implemented basic social (particu-larly housing) policies to support the growth process.
Over the past two decades of economic liberalization, it has been much harder for countries to achieve high growth rates without increases in inequality
Over the past two decades of economic liberalization, it has been much harder for countries to achieve high growth rates without increases in inequality. Recent studies point to the fact that inequality has increased in the majority of countries throughout the world. One recent study17 found that income inequality increased in 30 out of a sample of 49 countries between the 1990s and the 2000s. It remained unchanged in six countries and in only 13 countries did it decrease. A similar result has been presented in a recent study by the International Labour Organization (ILO). It found that, between 1990 and 2000, “more than two-thirds of the 85 countries for which data are available experi-enced an increase in income inequality, as measured by the Gini index”.18 Of the 20 advanced countries in the sample, inequality decreased in only four, while of the 21 transition countries in the sample, inequality decreased in only three. Among the developing countries studied, patterns of change tend to vary by region. In Asia, inequality decreased in only
two out of eight countries. Signifi cantly, India and China were among the countries that experienced an increase in inequality. In Latin America, inequality declined in six out of 15 countries for which data were available. It was only in the Middle East and North Africa and in sub-Saharan Africa that more countries experienced a decline rather than an increase in inequality. However, even though inequality decreased in these regions, the resulting level of inequality remained high (a Gini coeffi cient of more than 0.40) in most of the countries studied.
The gap is growing between wage
earners and those who derive their
income from profi ts
A broad pattern of growing income inequality under eco-nomic liberalization, refl ected in rising Gini coeffi cients, is supported by data on other dimensions of inequality. An important indicator in this regard is the functional distribu-tion of income – that is, the distribution of income between wages (income from labour) and profi ts (income from capi-tal). This provides a general indication of how well wage earners are faring relative to employers and others who derive their income from the ownership of capital, such as productive equipment and fi nancial assets. Typically, indus-trialized countries have only a small sector of self-employed producers, and the bulk of total income derives from either wages or profi ts. As a result, the share of wages in GDP is closely correlated with changes in overall income inequal-ity as determined by a summary measure such as the Gini coeffi cient. Thus a rise in the share of wages in GDP is likely to mean a reduction in overall inequality, since wage earners tend to be at the lower end of income distribution, while the opposite is true of those who derive their incomes from profi ts. A rise in the share of wages also usually refl ects a tight labour market and the increased bargaining strength of workers.
In developing countries, the picture is less clear-cut, since there is often a large informal sector consisting of self-employed petty producers or service-providers whose meagre incomes place them at the bottom of the income

COMBATING POVERTY AND INEQUALITY
66
scale. Yet their incomes are usually recorded in national statistics as profi t or a return on the assets used to engage in economic survival activities. In this context, there is no simple interpretation of what a change in the share of wages in GDP means in terms of overall inequality. For example, if an increase in the share of non-wage income is largely due to an increase in average incomes in the infor-mal sector, then this would be a desirable change from a distributional standpoint. Nevertheless, even in countries with high levels of informality, an analysis of the change in the wage shares that is confi ned to only the formal sector of the economy can provide useful information on trends in inequality. A change in wage shares within the formal sec-tor can be interpreted in the same way as an overall change in the wage share of advanced economies. For instance, a decline in the wage share in the manufacturing sector of a developing country does tell us that the bargaining strength of workers is weakening, either because of an excess supply of labour relative to demand, the strengthened power of employers due to increased exit options as a result of glo-balization, or the suppression of labour unions or collective bargaining mechanisms.
Between 1980 and 2000, the average wage share of national income fell by 10 points in the euro zone, a clear sign of redistribution from labour to capital
A study commissioned by UNRISD,19 based on panel data for 25 member countries of the Organisation for Economic Co-operation and Development (OECD) over the period 1973–2003, found that the wage share of national income fell or remained constant in 23 cases. These falls were quite large in some cases. Between 1980 and 2000, the aver-age labour share fell by 10 points in the euro zone20 – one of the largest decreases and a clear sign of redistribution
from labour to capital. The study also found evidence of a strong and persistent link between functional and personal income distribution. In the sample of 25 countries, 17 of the 18 countries that experienced an increase in inequality in the functional distribution of income also experienced a simultaneous increase in inequality in the personal distri-bution of income.
The same phenomenon appears to have been at work in some developing countries. Bearing in mind the diffi cul-ties in interpreting changes in the functional distribution of income in developing countries, it is still signifi cant to note the fi ndings from a recent ILO study.21 The study, which covered 29 advanced, 33 developing and 11 tran-sition economies, concluded that three-quarters of them witnessed a decline in the wage share of national income. The fastest decrease – of more than 13 per cent – was found in Latin America. The advanced economies and Asia also experienced signifi cant declines. Wage shares fell in Asia by over nine percentage points during the period 1985–2002, and by the same amount in advanced economies over the period 1980–2005.
3. Inequality, Structural Change and Global Intersectoral Terms of Trade
How should these changing patterns of inequality among and within countries in a globalized economy be explained? Is there a common global pattern and, if so, what does this tell us about global economic governance? To answer these questions, this section examines global, regional and national datasets on economic inequality developed by the University of Texas Inequality Project.22 These datasets are a unique resource, providing consistent and reliable meas-ures of pay inequality for a large number of countries from the early 1960s to the early years of the twenty-fi rst century. These measures suggest certain broad patterns and relation-ships between economic inequality and structural change (see box 2.1).
SECTION ONE – CHAPTER 2 – INCOME INEQUALITY AND STRUCTURAL CHANGE
67
BOX 2.1: A methodology for measuring income inequality
The measures of inequality derived from the University of Texas Inequality Project (UTIP) can be applied to many sources of data
and do not require recourse to micro-level datasets derived from sample surveys. The resulting measures are often comparable
both through time and across countries.a The method is summarized in Conceição et al. (2001) and is based on the work of
Theil (1972), who argued that an inequality measure computed from grouped data provides a consistent lower-bound estimate of
inequality for the entire population. Relatively coarse disaggregation is suffi cient to capture the major movements of inequality in the
whole distribution.
Income distributions are approximate statistical fractals (that is, they produce similar patterns at different scales and from different
points of observation), so that observation of the entire distribution, or even of a statistically representative portion of it, is not
necessary in order to observe change with reasonable accuracy most of the time. All that is required is to observe an important part of
the distribution (say, the manufacturing sector) on a consistent basis over time. Since this part is linked organically to other parts that
may not be observed, such as agriculture and services, movements in the observed part are usually – but not always – representative
of movements in the shape of the entire distribution. Changes in the structure of incomes often occur because of changes in the
relative positions of major industrial groupings (a rise of industry over agriculture, for instance, or of fi nance over industry) or in the
relative position of different geographic areas, differentially affected by demographic change, climate or war. Thus, after a certain
point, further disaggregation adds little useful information.
The inequality measures developed by the UTIP are also broadly consistent with conventional, survey-based income inequality
measures, or can be made so by statistical adjustment after allowing for conceptual differences between pay and income and for the
many different kinds of inequality that are reported in the survey-based literature (for example, income, expenditure, gross or net of
tax, household or personal).b The dataset on which the UTIP measures are based covers more than a hundred countries over three or
four decades. Measures of inequality may also be calculated both within and among regions inside many countries. In some countries,
inequality measures can be computed on a monthly basis.
However, it is important to note that the UTIP approach has its limitations. Of these, perhaps the most important is that the work
is statistical and comparative; it cannot be substituted for detailed case-by-case analysis. The UTIP data are also largely focused
on pay, aggregated by sector and region. Pay is associated with jobs, not with households, and the datasets lack information on
the characteristics of the workers or their families. For this reason, the UTIP studies are not well suited to an analysis of the social
welfare consequences of political and economic change, nor of the effects of such change on gender or ethnicity, except where these
attributes are associated with the distribution of jobs. Finally, the data are entirely pretransfer, and shed no light on the post-transfer
distribution of income. However, transfer payments are very limited outside of the OECD region. Within that region, the scale of
transfers is closely correlated with the equality or inequality of pay structures, so that the inequality rankings found in the UTIP data
would not change much if post-transfer income were included.
Notes: a Galbraith and Kum 2005, 2003. b Galbraith and Kum 2005, 2003. Source: Galbraith 2008.

COMBATING POVERTY AND INEQUALITY
68
Early development thinking held that inequality
rose in the early stages of development, and
then declined
An important strand of early development thinking held that an inverted-U shaped curve described the relation-ship between the level of development and the degree of in equality in the distribution of income. The Kuznets curve23 summarized a process whereby inequality increased in the initial stages of development but then reversed itself as development proceeded. Kuznets identifi ed the transi-tion from agriculture to industry as the prime mover of a process of increasing inequality in the early stages of economic development, simply because towns and cities are always richer on average than the country-side around them. However, as economic development matured, the weight of agriculture in the whole economy would shrink, and ultimately urban phenomena would come to dominate the evolution of inequality. At that point, Kuznets argued, the dynamics of factory life, includ-ing the rise of labour unions and democratic politics, would cause inequality to decline.
The Kuznets curve describes a process of structural change (or intersectoral transition) specifi c to the history of economic development in the United States, the United Kingdom, much of Europe, and Japan. The process has been repeated elsewhere – but not everywhere. In mineral-rich countries dominated by extractive industries, or in post-industrial soci-eties dominated by services such as technology and fi nance, different patterns would be expected. Kuznets’ enduring mes-sage is not that a single curve should be found in the history of all countries in all periods, but that the essence of under-standing inequality lies in understanding the intersectoral transitions, or structural changes, that produce it.
Figure 2.2 shows an augmented Kuznets curve,24 which suggests that for large agrarian societies in the process of industrialization, of which China is the leading example today, the rural-to-urban transition still drives the rise in inequality. In only a few other industrializing countries does the agrarian population remain suffi ciently large for the intersectoral transition out of agriculture to dominate
the picture; most developing countries, especially outside Africa, are over the hump of the inverted-U (if the hump exists) and on the downward-sloping portion of the curve.
FIGURE 2.2: Stylized augmented Kuznets curve
Inequality
Income
Brazil
China
Korea
Denmark
USA
Kuwait
Source: Galbraith 2008.
Among the highest income countries, notably the United States, the United Kingdom and Japan, a different dynamic takes over.25 The most advanced economies have procycli-cal movements of inequality, because their highest income sectors, services in technology and fi nance, enjoy their greatest income growth in boom times, whether driven by domestic investment or by exports. This is also true of small economies dominated by services such as fi nance and real estate, of which Hong Kong, China is a prominent modern example. Meanwhile, the world is speckled with mono-line producers (that is, countries dependent on a single commodity, such as oil) where distribution is driven by the peculiar characteristics of an extractive economy. They are characterized by high per capita income, a low-wage (often immigrant) manual workforce and high inequality.
Global intersectoral terms of trade are
a key determinant of inequality
Intersectoral transitions (structural changes between agricul-ture, industry and services) within countries, and the global

SECTION ONE – CHAPTER 2 – INCOME INEQUALITY AND STRUCTURAL CHANGE
69
terms of trade between these sectors, are closely connected. We would therefore expect global intersectoral terms of trade to infl uence inequality within countries, even in the absence of signifi cant structural change. Thus, a boom in commodity prices will tend to reduce inequality in a country with an important agricultural sector, simply because it tends to raise the relative income of farmers; whereas a fall in commodity prices will depress incomes in such a country. A cartel action to increase the price of oil gives producers resources to redis-tribute or invest (for example, into construction); mean-while, it may raise the cost of production and consumption in other countries, increasing unemployment among indus-trial workers and squeezing the incomes of the middle classes in wealthier countries.
In a world of globalized fi nancial and commodities markets, these effects will be global: they should show up everywhere (or almost everywhere) at once, and they do.26 From the early 1960s onwards, patterns in the expansion or contraction in the level of inequality have tended to be found during the same time period within countries around the world. These patterns have four phases, as illustrated in fi gure 2.3.
FIGURE 2.3: Global patterns of inequality over time, 1963–2002
19
63
19
66
19
69
19
72
19
75
19
78
19
81
19
84
19
87
19
90
19
93
19
96
19
99
20
02
0.5
0.4
0.3
0.2
0.1
0
-0.1
-0.2
-0.3
UTIP-UNIDO Log(T)
Source: Kum 2008.
Four phases of inequalityThe fi rst phase, which occurred from the fi rst observed year (1963) until around 1971, was a period of relative stability, with no common movement in the measures of inequality.
The second phase, from 1972 until around 1980, was a period of moderate decline in inequality in much of the world. This period coincided with the collapse of the glo-bal fi nancial framework of the Bretton Woods era, and the subsequent infl ationary boom, abetted by large-scale com-mercial bank lending at negative real interest rates.
The third phase is one of sharply rising inequality, begin-ning around 1982 and continuing to the end of the century. It was associated with the calamity of the global debt crisis, initially most severe in Latin America and Africa, followed by the collapse of communist governments in Central and Eastern Europe, and fi nally by a wave of deregulation and liberalization in Asia in the 1990s. The specifi c experience of countries and regions varies, but they share several com-mon characteristics: collapsing imports; a shrinking fi scal base and therefore public sector retrenchment; trade liber-alization; de-industrialization; and the simultaneous decline of both the civil service and the industrial working class. Globalization eventually brought fi nancial investment to some countries, stimulating the rise of new sectors – most notably real estate, insurance and banking – accompanied by global pay scales and a rise in speculation. The over-all pattern almost exactly resembles that found in another major study27 that examined inequality among countries, unweighted by population. This should not come as a sur-prise: events that increase the gap between rich and poor people within countries should also, in principle, broaden the gap between rich and poor countries, since the latter are just unbalanced collections of the former.
The pattern has exceptions. India and China, for example, avoided the global rise in inequality in the 1980s, arguably because they had not liberalized their fi nancial markets, and were therefore relatively unaffected by the debt cri-sis. While inequality in China had started to rise from low levels during the 1980s, the sharp and problematic rise in inequality dates from the crisis of 1989. In India, the rise in

COMBATING POVERTY AND INEQUALITY
70
inequality started with the liberalization reforms of 1992.28 These exceptions help to confi rm the hypothesis that a major driver in the movement of inequality in the age of globalization is not idiosyncratic national policy or even structural change within countries, but global forces affect-ing intersectoral terms of trade.
The fourth phase, beginning in 2001, is again one of declining inequality. It coincides with the marked relaxa-tion of credit conditions that followed the attacks of 11 September 2001 in the United States and a repudiation of the Washington consensus policies (the reform package promoted by Washington, DC– based institutions such as the International Monetary Fund/IMF, the World Bank and the United States Treasury Department) associated with adverse growth and social development in many coun-tries. These changes appear to have permitted both higher growth and some abatement of the extreme increases in inequality that had affl icted the developing world for the previous 20 years. The commodities boom during this period also benefi ted low-income agrarian countries. The dramatic onset of the global economic crisis in 2008 has undoubtedly brought an abrupt end to this brief period of declining inequality. Low-income agrarian economies now face sharply reduced growth, a contraction of output, rising unemployment and a renewed rise in poverty.
Most low-income agrarian economies
are highly unequal
If the global element in rising inequality in the 1980s and 1990s had not existed, there would have been no increase in economic inequality on average around the world. Indeed, given the Kuznets forces affecting inequality in the process of economic development, inequality in most countries and on average would have declined. Figure 2.4 illustrates this calculation, separating out member coun-tries of the OECD and non–OECD countries to show how global forces affect each group. The fi gure also illustrates a core fact: high-income industrialized countries enjoy mark-edly more equality, on average, than low-income develop-ing countries.
FIGURE 2.4: Inequality within countries, with and without the global effect
-3
-2.5
-3.5
-4
-4.5
1963 1968 1973 1978 1983 1988 1993 1998
-3
-2.5
-3.5
-4
-4.5
1963 1968 1973 1978 1983 1988 1993 1998
Actual values
After global effect removed
Non-OECD OECD
UTIP
-UNI
DO L
og(T
)UT
IP-U
NIDO
Log
(T)
Non-OECD v. OECD
Non-OECD v. OECD
Source: Galbraith and Kum 2003.
The high inequality of most low-income agrarian socie-ties may be puzzling. However, particularly in the tropics, agricultural arrangements are frequently descended directly from feudal land tenure systems or from slavery. Such arrangements differ from the historical cases examined by Kuznets, such as the United Kingdom and nineteenth-century North America, or from the East Asian economies after land reform, where small freeholders predominated. Except in some parts of Africa, low-income agrarian econo-mies with egalitarian income structures are rare, and in the past century have tended to emerge only after violent

SECTION ONE – CHAPTER 2 – INCOME INEQUALITY AND STRUCTURAL CHANGE
71
revolution, as in China (1949), Cuba (1959) and Viet Nam. Even in these countries, however, inequality is rising (albeit from very low levels) with more liberal economic reforms.
High-income industrialized countries enjoy markedly more equality, on average, than low-income developing countries
Without these countries, it is doubtful whether the inverted-U shaped curve would have a low-income upward-sloping component at all in recent decades. Figure 2.5 illustrates the relationship between the share of agricul-ture in total employment and inequality in manufacturing pay for a selection of developed and developing countries. The positive relationship is strong and consistent: the higher the population in agriculture, the higher the level of inequality.
FIGURE 2.5: Inequality in manufacturing pay and the share of agriculture in employment in selected countries, 1979–2003
Average share of employment in agriculture, 1979–2003
0.10
0.09
0.08
0.07
0.06
0.05
0.04
0.03
0.02
0.01
0.00
0.0 0.1 0.2 0.3 0.4 0.5 0.6 0.7
PERIDN
THA IND
BOL
PHL
BRACHL
VEN
ARGIRL
SGP
JPN
PRT
CRI COL
USA ESP MEX
KORCAN HUN
GBR
HKG SVKITA
TWN
AUT
NLD FIN
SWE
Ineq
ualit
y in
man
ufac
turin
g pa
y –
Thei
l’s T
sta
tistic
(ave
rage
val
ue)
Source: Galbraith 2008, from data in Kum (2008).
Global forces now shape the movement
of inequality within countries
Taken together, the issues outlined above paint a complex picture, yet one with regular features. For any given coun-try, the movement of inequality can be said to depend on three factors:
the position of the country on an augmented Kuznets • curve, refl ecting previous processes of structural change;the current process of structural change and growth in • income; andthe country’s integration into the global economy, and • thus the external impact of changes in intersectoral terms of trade.
In sum, in most cases, structural change in the process of economic development tends to reduce inequality. Excep-tions exist, two of which are:
low-income post-revolutionary agrarian societies in the • process of urbanization, industrialization and transition to market capitalism; andhigh-income post-industrial societies as they • move towards economies dominated by services in technology and fi nance.
Likewise, crises and shocks that periodically disrupt the processes of economic development tend to raise inequality. Structural change in the process of economic development is relatively slow, whereas the impact of shock and crisis is rapid and highly visible in the data (although such events have been relatively rare to date, at least at a global level).
For this reason, changes in relative prices (or the terms of trade) between sectors tend to dominate the actual move-ment of economic inequality. Commodity booms generally benefi t lower income developing countries, while fi nancial bubbles and interest rate shocks generally benefi t high-income groups within fi nancialized economies, at least in relative terms. Since oil and grain prices and interest rates are set in global markets, it is not surprising that the move-ment of economic inequality should now be largely a com-mon global phenomenon, operating in much the same way (though certainly not symmetrically) in most of the world.
COMBATING POVERTY AND INEQUALITY
72
How structural change and global forces
affect inequality: Country examples
Based on the arguments and framework developed above, the remainder of this section highlights key features of the development experience of a number of countries. These cases illustrate the relationship between different stages and patterns of structural change, exposure to external economic forces and inequality.
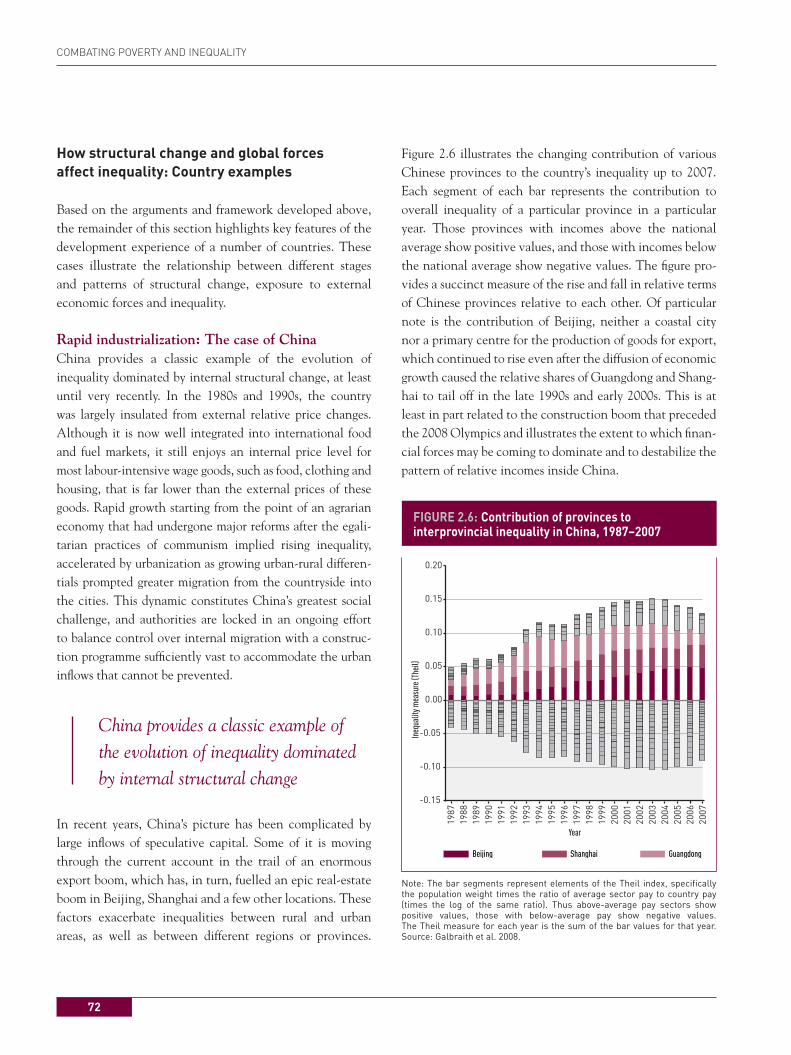
Rapid industrialization: The case of ChinaChina provides a classic example of the evolution of in equality dominated by internal structural change, at least until very recently. In the 1980s and 1990s, the country was largely insulated from external relative price changes. Although it is now well integrated into international food and fuel markets, it still enjoys an internal price level for most labour-intensive wage goods, such as food, clothing and housing, that is far lower than the external prices of these goods. Rapid growth starting from the point of an agrarian economy that had undergone major reforms after the egali-tarian practices of communism implied rising inequality, accelerated by urbanization as growing urban-rural differen-tials prompted greater migration from the countryside into the cities. This dynamic constitutes China’s greatest social challenge, and authorities are locked in an ongoing effort to balance control over internal migration with a construc-tion programme suffi ciently vast to accommodate the urban infl ows that cannot be prevented.
China provides a classic example of the evolution of inequality dominated by internal structural change
In recent years, China’s picture has been complicated by large infl ows of speculative capital. Some of it is moving through the current account in the trail of an enormous export boom, which has, in turn, fuelled an epic real-estate boom in Beijing, Shanghai and a few other locations. These factors exacerbate inequalities between rural and urban areas, as well as between different regions or provinces.
Figure 2.6 illustrates the changing contribution of various Chinese provinces to the country’s inequality up to 2007. Each segment of each bar represents the contribution to overall inequality of a particular province in a particular year. Those provinces with incomes above the national average show positive values, and those with incomes below the national average show negative values. The fi gure pro-vides a succinct measure of the rise and fall in relative terms of Chinese provinces relative to each other. Of particular note is the contribution of Beijing, neither a coastal city nor a primary centre for the production of goods for export, which continued to rise even after the diffusion of economic growth caused the relative shares of Guangdong and Shang-hai to tail off in the late 1990s and early 2000s. This is at least in part related to the construction boom that preceded the 2008 Olympics and illustrates the extent to which fi nan-cial forces may be coming to dominate and to destabilize the pattern of relative incomes inside China.
FIGURE 2.6: Contribution of provinces to interprovincial inequality in China, 1987–2007
-0.15
-0.10
-0.05
0.00
0.05
0.10
0.15
0.20
19
87
19
88
19
89
19
90
19
91
19
92
19
93
19
94
19
95
19
96
19
97
19
98
19
99
20
00
20
01
20
02
20
03
20
04
20
05
20
06
20
07
Year
Ineq
ualit
y m
easu
re (T
heil)
Beijing Shanghai Guangdong
Note: The bar segments represent elements of the Theil index, specifi cally the population weight times the ratio of average sector pay to country pay (times the log of the same ratio). Thus above-average pay sectors show positive values, those with below-average pay show negative values. The Theil measure for each year is the sum of the bar values for that year. Source: Galbraith et al. 2008.

SECTION ONE – CHAPTER 2 – INCOME INEQUALITY AND STRUCTURAL CHANGE
73
Dualism and industrial crisis: Brazil and MexicoIn most of Latin America, by contrast, large-scale urbani-zation, globalization and, specifi cally, the internationali-zation of fi nance occurred decades ago. In the 1980s and 1990s, countries found themselves affl icted by the (closely related) scourges of negative growth and adverse terms-of-trade shocks as well as by the debt crisis, all of which increased inequality. In Mexico and Brazil, the debt crisis and resulting industrial slump were associated with a sharp rise in inequality,29 as the collapse of import-substituting industries diminished the unionized working class. It is rea-sonable to infer that import-substituting industrialization had worked to reduce the (very high) inequalities associ-ated with traditional Latin American economic dualism, and that the later shift towards an export-oriented growth model would again be characterized by a more unequal income structure. However the short-term movement of inequality during the transition between these two mod-els was clearly governed by the same forces that generated macroeconomic and industrial crises in the fi rst place.
In the 1980s and 1990s, Latin American countries found themselves affl icted by negative growth and adverse terms of trade as well as by the debt crisis, all of which increased inequality
The experience of Mexico and Brazil during this period also illustrates the simple relationship between wage ine-quality in industry and the rate of economic growth. As long as economic growth is suffi ciently rapid to absorb the natural rise in the labour force, inequality in pay structures tends to be stable or decline. When growth falls short of that threshold, inequality tends to increase.30 For countries in the latter situation, combating rising inequality is, in large part, a matter of restoring stable internal growth and thus absorbing the growing labour force into productive employment. But as long as such countries remain exposed
to external fi nancial shocks, more stable global fi nancial governance must also be part of the solution.
The experience of Mexico during the peso crisis in 1995 demonstrates the connection between external fi nance and economic inequality for many developing countries. A position on the periphery of the global economy implies important trading relations with much richer countries, and therefore a duality in the productive economy at home – between producers who sell to the external market and those who sell to domestic consumers. Workers in the former tend to be better paid than those in the latter, simply because industries with rich customers who earn hard cur-rency can afford to pay a premium for labour. The former are also much better insulated against a currency crisis. When the peso crisis hit Mexico in 1995, export sectors were able, for the most part, to simply translate their dollar earnings into peso wages at the new exchange rate. Those who produced for the domestic economy, as manufacturers or as service providers, could not do this, and their rela-tive wages fell instantly as the peso collapsed. In addition, their markets subsequently dried up, since consumers were forced to pay more for imported staples (such as corn) that were now available only at a dramatically higher peso price. There was a sharp rise in inequality in pay in the Mexican manufacturing sector following the 1995 peso crisis.31
Transition economiesIn the industrialized economies of Central and Eastern Europe, the combination of a large manufacturing sector and a communist political regime produced low inequality until the system collapsed in 1989. It is worth noting, how-ever, that the collapse of communist regimes in Hungary, Poland, Yugoslavia and the Soviet Union was not unre-lated to economic pressure. All were deeply indebted to the West at a time of depressed prices for primary com-modities and exceptionally high real interest rates. These pressures exacerbated the underlying ineffi ciencies of the communist system, prompting efforts at reform that even-tually opened the door to regime change. At that point, de-industrialization and price liberalization, leading to a very rapid move towards world price levels, combined to drive inequality up dramatically.

COMBATING POVERTY AND INEQUALITY
74
The case of the Russian Federation has been analysed using data for the years 1990–2000.32 The dramatic increase in inequality came in 1992, with the implemen-tation of shock therapy, starting with price liberalization. This resulted in the sudden collapse in the real wages of both agricultural and manufacturing workers as well as of non-commercial sectors, such as health and education, previously supported by the state. Energy and fi nance con-sequently became the leading sectors of the new Russian Federation, with Moscow rising as a world city in a country otherwise mired in post-communist stagnation. The situ-ation became so extreme by the end of the century that the lightly populated western Siberian oil and gas regions of Tiumen and Khanty-Mansy had become major drivers of the inequality of Russian incomes overall. Meanwhile, the confl ict-affected regions of the southern Caucasus had fallen far below the rest of the country in reported rela-tive income. Figure 2.7 provides a schematic view of the interprovincial shifts in the Russian Federation during the disastrous transition decade.
FIGURE 2.7: Contributions of three provinces to interprovincial inequality in the Russian Federation, 1990–2000
Ineq
ualit
y m
easu
re (T
heil)
-0.08
-0.06
-0.04
-0.02
0
0.02
0.04
0.06
0.08
0.1
0.12
0.14
1990 1991 1992 1993 1994 1995 1996 1997 1998 1999 2000
Tiumen Khanty-Mansy Moscow
Source: Galbraith, Krytynskaia and Wang 2004.
Financialized economiesIn the United States, inequality rose from the early 1980s under the demand shock of tight monetary policy and a high dollar – a backward movement on a downward sloping Kuznets curve. This movement was repeated in the recession of the late 1980s. Inequality in pay, particularly in manufac-turing, then declined through much of the following decade as the economy recovered and eventually produced very high levels of employment. Figure 2.8 illustrates the close relation-ship between inequality in the structure of manufacturing pay in the United States and the rate of unemployment.
FIGURE 2.8: Monthly manufacturing pay inequality and unemployment in the United States, 1953–2003
3
4
5
6
7
8
9
10
11
.012
.014
.016
.018
.020
.022
.024
.026
.028
1955 1960 1965 1970 1975 1980 1985 1990 1995 2000
Inequality in 17 manufacturing sectors (Theil Index)
Unemployment (%)
Note: Recessions indicated by grey lines.Source: Galbraith 2009.
In the last years of the decade of the 1990s, rapid growth in the United States was driven by a technology bubble. This produced increasing inequality – represented as a move up an upward-sloping segment of the Kuznets curve – as the country moved through the transition from an industrial economy to one largely centred on technology and fi nance.33 The effect of this increase in inequality on household incomes was greatly exacerbated by the dramatic appreciation of capital asset valuations on the reported income of a very small number of very rich people. If the effects of rising income in just fi ve counties – New York (Manhattan), New York; Santa Clara, San Francisco and San Mateo counties in California; and King County in Washington – are removed

SECTION ONE – CHAPTER 2 – INCOME INEQUALITY AND STRUCTURAL CHANGE
75
from the data, about half of the rise in between-county inequality in household incomes in the United States in the last years of the 1990s would not have occurred.34 Removing the income growth of just 15 counties neutralizes the entire increase in between-county inequality. Figure 2.9 illustrates this fi nding, and shows that the rise (and occasional decline) in income inequality in the United States is substantially due to changing valuations on the stock market, specifi cally the technology-rich NASDAQ.
FIGURE 2.9: Between-county measure of income inequality and the log of the NASDAQ stock index in the United States, 1969–2005
0.015
0.02
0.025
0.03
0.035
0.04
0.045
19
69
19
71
19
73
19
75
19
77
19
79
19
81
19
83
19
85
19
87
19
89
19
91
19
95
19
93
19
97
19
99
20
01
20
03
20
05
Betw
een-
coun
ty in
com
e in
equa
lity
- Th
eil's
T S
tatis
tic (1
yea
r lag
)
4
4.5
5
5.5
6
6.5
7
7.5
8
8.5
9
Natu
ral l
og o
f NAS
DAQ
mon
thly
clo
se
Between-county measure of income inequality Log of the NASDAQ stock index
Note: Dotted line indicates hypothetical change in inequality 1993–1999 under the counterfactual of average national income growth in fi ve counties: New York (Manhattan), New York; Santa Clara, San Mateo, and San Francisco counties in California; and King County in Washington. Source: Galbraith and Hale 2008.
Financialization, or the growing dominance of the fi nancial sector in national economies, is strongly linked to neoliberal economic policy reform, which gained strength in the 1980s and 1990s and tended to favour national fi nancial and politi-cal centres (Buenos Aires, Moscow, São Paulo, Shanghai and Beijing) at the expense of the hinterlands. In the wake of a fi nancial crisis or stabilization policies, such as Brazil’s Real Plan, the share of the fi nancial sector in an economy is likely to shrink and overall inequality among sectors and regions to fall. Figure 2.10 illustrates this pattern for the case of Brazil, which at the peak of neoliberal policies channelled an extraordinary share of national income into the fi nancial sector. Notwithstanding the small absolute size of the sector,
it would be reasonable to see the diversion of resources into banking as a principal motor of total income inequality in Brazil. Using monthly data for the case of Argentina, fi gure 2.11 shows that the fi nancial crisis in 2002 triggered a pro-cess in which inequality – at least within the formal sector – was reduced in the post-crisis years.
FIGURE 2.10: Contribution of sectors to economic inequality in Brazil, 1996–2003
-0.200
-0.100
0.000
0.100
0.200
0.300
1996 1997 1998 1999 2000 2001 2002 2003
Cont
ribut
ion
to T
heil
Wholesale and retail trade Financial intermediationReal estate Civil service, defense and social securityHotels and restaurants Manufacturing industriesConstruction EducationOther collective, social and personal services UtilitiesAgriculture Transport, storage and communicationsHealth and social services Mining Fishing International and extraterritorial organizations
Source: Galbraith et al. 2007.
FIGURE 2.11: Monthly measure of interprovincial inequality in Argentina, 1994–2006
Thei
l's T
Sta
tistic
0.05
0.05
0.04
0.04
0.03
0.03
0.02
0.02
0.01
0.01
0.00
Ju
l-9
4
Fe
b-9
5
Se
p-9
5
Ap
r-9
5
No
v-9
6
Ju
n-9
7
Ja
n-9
8
Au
g-9
8
Ma
r-9
9
Oct-
99
Ma
y-0
0
De
c-0
0
Ju
l-0
1
Fe
b-0
2
Se
p-0
2
Ap
r-0
3
No
v-0
3
Ju
n-0
4
Ja
n-0
5
Ag
o-0
5
Ma
r-0
6
�Overall Theil �Average July94-Nov99 �Average Dec99-Nov01
Source: Galbraith et al. 2007.

COMBATING POVERTY AND INEQUALITY
76
Some countries have avoided rising inequality Even though rising inequality was characteristic of the period under discussion (the 1980s and 1990s), it was not observed everywhere. In Northern Europe, notably in Scan-dinavia, historically among the most egalitarian regions in the world, measures of inequality remained steady through-out the 1980s and at least into the early 1990s. The Nordic experience relates in part to the strong tradition of unioni-zation, centralized pay bargaining, and (in the case of Norway) the collective management of resources gleaned from the oil boom. Meanwhile, in parts of Southeast Asia, especially Singapore and Indonesia, inequality appears to have declined throughout the early 1990s. In parts of Latin America, notably Brazil and Argentina, inequality appears to have peaked with the crises of 1993 and 2002, respec-tively, and to have declined with the stabilizing growth experienced in subsequent years.35
4. Redistributing Wealth and Income: Implications for Policy
Poverty is far more than relative deprivation of material goods; it may be accompanied by hunger, malnutrition, ill-health and morbidity, shortened life expectancy, illiteracy, social exclusion and a constant struggle for survival.36 Given the relationship between poverty and inequality presented in this chapter, policies to reduce inequality are important instruments for reducing poverty. Moreover, higher levels of income inequality tend to undermine civil, political, economic and social rights, as well as the realization of sub-stantive citizenship and inclusive states.
Make deliberate policy choices to ensure that
growth and equity reinforce one another
In the 1990s, the view gained ground among some in the international development community that high growth rates were suffi cient to alleviate poverty, espe-cially if there were no changes in income distribution.
One highly publicized World Bank paper37 argued that growth was good for the poor and that countries pursuing Washington consensus policies enjoyed faster growth in average incomes. This argument implies that governments need not follow deliberately pro-poor growth policies and that what matters most is the income level of the poor, rather than equality. However, there is a growing body of evidence suggesting that:
there is no trade-off between equity and growth;• an unequal income distribution is not immutable and • can be affected by economic and social policies;equity can make growth more inclusive and • pro-poor; andequity can also serve as an important agent of • economic growth.38
Recognition that equity and growth can be mutually rein-forcing still leaves open the question about the necessary economic and social policies to produce such an outcome. While current research disputes the simplistic view of trade-offs between equity and growth, it does not suggest that the virtual cycle of growth and equity is automatic. The pos-sibility of a negative impact of one on the other suggests a need for deliberate policy choices and design to ensure that equity has a positive impact on growth, and vice versa.
Deliberate policy choices and design are needed to ensure that equity has a positive impact on growth, and vice versa
Research has shown that the posited positive relationship between growth and poverty reduction based on cross-section regressions across countries merely described an average relationship around which there were signifi cant disparities. A recent study39 shows that one-sixth of the 285 cases (consisting of different periods of time in different countries) used in a World Bank study40 that downplayed the role of redistributive policies in poverty reduction in favour of growth, proved to be exceptions to the rule.

SECTION ONE – CHAPTER 2 – INCOME INEQUALITY AND STRUCTURAL CHANGE
77
These were cases in which growth failed to reduce poverty or where poverty decreased without signifi cant growth. An examination of these cases highlights the central role played by redistributive policies. At different periods of time in the Nordic countries, as well as in developing coun-tries such as Colombia, El Salvador and Peru, strong redis-tributive policies meant that poverty decreased by more than was predicted in the study. In the case of developing countries, land reform was a prominent aspect of these poli-cies. Conversely, in cases where poverty either increased or decreased less than predicted, there was a reversal or weak-ening of these same redistributive policies. Other studies,41 including some from the World Bank itself, have shown that in countries with high levels of inequality, poverty is reduced more slowly in response to higher growth. Simi-larly, periods of highest growth were not necessarily the ones in which poverty reduction was the greatest. Even in countries with fast growth and poverty reduction, regional pockets of poverty and deprivation have persisted. This suggests that growth alone is insuffi cient to reduce poverty and that redistributive policies to change the distribution of income and assets are important.
Redistributive policies that countries can adopt include those that:
provide the poor with greater access to productive • assets, such as land, and reform inequitable tenancy arrangements;stimulate investment in irrigation and rural roads, • create public works programmes for infrastructure development and increase access to credit; initiate fi scal reforms to improve tax administration, • prevent tax evasion and avoidance, and limit opposition to progressive taxation and redistribution; generate employment opportunities; • enhance the welfare of the poor through sound • social policies; and help create a stable global economic environment • that responds to the needs of poor countries.
Chapter 1 has discussed strategies for improving employ-ment opportunities, and Section two of the report will examine social policies and tax strategies for redistributive
and socially inclusive outcomes. The remainder of this chapter will highlight a number of issues related to fi scal redistribution, land reform, improving the livelihoods of small farmers, and global economic governance.
Strengthen the role of the state
in fi scal redistribution
Successful implementation of redistributive policies calls for a stronger state role. Fiscal redistribution, which entails both progressive taxation and patterns of expenditure that improve the welfare of the poor, has occurred only to a very limited extent in developing countries. In contrast to many industrialized countries where fi scal redistribution brings about a drop in the Gini coeffi cient of 10–15 per cent, it is at most a few percentage points in most developing countries. As chapter 8 argues, the main obstacle to fi scal redistribu-tion is the low tax base, due to the large proportion of the population with low incomes and to the presence of a large informal sector that is outside the tax net. Nevertheless, it remains true that tax revenues are typically even below this structurally determined level for several reasons. The fi rst is a weakness in tax administration and consequent tax evasion and avoidance, which tends to be widespread. The second is the presence of generous tax concessions. And a third is the trend in the era of increasing globalization towards lowering rates of income and corporate taxation. This, together with a parallel trend towards reliance on indirect taxes, such as value added tax, reduces the progres-sivity of the tax system. Given these facts, there appears to be room to increase both the yield and the progressivity of the tax system through fi scal reforms, such as tightening tax administration and resisting trends towards more regressive forms of taxation.
Turning to the expenditure side, the picture is less bleak. An increasing number of countries are introducing social programmes for the poor, such as cash transfer schemes and public works programmes. Despite their limitations, some of these programmes have been large enough in scale to have a perceptible impact on poverty reduction, as chap-ter 5 will show. In this regard, universal social protection
COMBATING POVERTY AND INEQUALITY
78
programmes tend to have a greater potential for redistri-bution and quality control than targeted programmes. Improving the poor’s access to education, health care and other social services, as described in chapter 6, also helps to reduce inequalities and poverty. It enhances the capa-bilities of the poor and the effi ciency or skill levels of the labour force in general, in addition to reducing the burden of disease. Public works programmes, which have gained prominence in many low-income countries as strategies for tackling poverty, should be focused not only on job creation, but also on the building of local infrastructure, since this will yield signifi cant positive externalities for the affected local communities.
Refocus on land reform
The primary target for production-oriented public expen-ditures should be agricultural and rural development, since they have the greatest impact on poverty reduction. A central redistributive issue here is land reform. In countries with a high degree of inequality in land ownership – and concomitant high landlessness – well-implemented redis-tributive land reforms can yield gains in terms of reduced poverty and inequality as well as increased output. The redistributive benefi ts of land reform will come not only from the increased asset base and incomes of previously landless and marginal farmers, but also from ending exploi-tation based on market and non-market power previously wielded by landlords. In addition, the more balanced level of land ownership that will emerge will yield external ben-efi ts to local communities, since cooperative communal projects to strengthen the local economy are more likely to develop. Potential gains in production will also come from the well-known inverse relationship between farm size and productivity. Provided land reforms are accompanied by effective programmes of support to small farmers, these productivity gains can by very signifi cant. Smallholders in agrarian economies where land is not a severe constraint can benefi t from investments in rural infrastructure and seedlings, extension services and credit.
Despite the success of land reforms in Japan, the Repub-lic of Korea and Taiwan Province of China in the early
post-war period, and in several other countries since then, land reform largely disappeared from the national and international policy agenda in the 1980s. There was a revival of interest in the issue in the mid-1990s, sparked by the emergence of land-based confl icts in countries such as Brazil, Mexico and Zimbabwe, as well as by the salience of the issue in the aftermath of the overthrow of dictatorships in Bolivia, Indonesia, the Philippines and South Africa. Although it has reappeared on the policy agenda, the sub-stance of discussions on land reform has taken a very dif-ferent form. In line with neoliberal thinking, the focus has been on market-based reform and no longer on the redis-tribution of land ownership. A key aspect of this approach dictates that any transfers of ownership should be market-based (willing seller, willing buyer), ruling out expropria-tion or compulsory purchase. In addition, it focuses on increasing access to land through tenancy reform rather than through ownership. Some of these tenancy reforms reverse the outcomes of previous land reforms by remov-ing ceilings on land ownership and tenancy. A driving force is the promotion of capitalist agriculture, as refl ected in moves towards the privatization of communal land and the encouragement of large-scale farming, spearheaded by multinationals. There has been surprisingly little debate on how this new approach compares to earlier approaches in terms of potential benefi ts, despite the obvious signifi cance of this issue for redistributive policies. It would be timely and benefi cial to open such a debate.
Look after the best interests of small farmers
Globalization has led to the growth of worldwide produc-tion chains for traditional export crops as well as a range of fl oricultural and horticultural products that have increased export opportunities for smallholders in developing coun-tries. But this development does not obviate the need for a strong state role in increasing the capacity of small farm-ers to respond to these new opportunities. Emerging global production chains are dominated by large multinational corporations that enjoy considerable market power; this opens up the possibility of unfair contracts with low returns and wages for the small farmers and workers involved.
SECTION ONE – CHAPTER 2 – INCOME INEQUALITY AND STRUCTURAL CHANGE
79
It also creates a new responsibility for governments to regu-late the terms under which poor farmers are incorporated into these production systems. In addition, some of these new export opportunities are in specialized niche markets that are very demanding in terms of the quality standards that must be met. This severely curtails the number of developing countries that can fi nd a foothold in these mar-kets without extension and marketing services provided by the state.
The growing dominance of multinational corporations in global agriculture is also shifting research priorities away from harnessing advances in biotechnology for the devel-opment of crops with higher yields that are better adapted to local ecological conditions, which could be of immense benefi t to poor farmers. Instead, attention has shifted to bio-tech applications that could raise profi ts in large-scale com-mercialized agriculture. At the same time, publicly funded crop research programmes of the type that produced the green revolution have been declining both internationally and nationally. It is important from the standpoint of redis-tributive and poverty reduction policies that these issues be faced seriously with a view to framing counter-measures.
Advocate for reforms in the governance
of the global economy
Not only should all possible redistributive policies be con-sidered on their own merit; they should also be placed in the context of globalization and overall development strategies. As explained earlier, income distribution and poverty reduction are as much the outcome of a chosen development strategy and global dynamics as of deliber-ate decisions about how much redistribution and what type of redistributive policies a country adopts. Given the importance of global economic forces in determining both growth and income inequality in developing countries, and in the wake of the economic crisis, special attention must be given to reform in the governance of globalization. The goal must include the creation of a global economic envi-ronment that is compatible with growth and poverty reduc-tion in poor countries.
Key elements of this reform should include greater stability in the international monetary system and in global commodity markets; stronger support for the development of least devel-oped countries; and the restoration of greater policy space and autonomy to developing countries42 (see chapter 10). Greater stability is required to avert a replay of the scenario in which developing countries have seen their development and poverty reduction efforts periodically nullifi ed by fi nancial crises and extreme fl uctuations in commodity prices, includ-ing those of food. Stronger support for the least developed countries is required, entailing the reduction of vulnerability to commodity price and interest rate shocks, more access to rich country markets, increased fi nancial assistance, and phas-ing out of agricultural subsidies in rich countries that impact adversely on poor countries. Similarly, greater policy space and autonomy are essential because the combined straightjacket of restrictive multilateral rules, neoliberal policy conditional-ity, and global fi nancial market discipline has clearly blocked the adoption of more promising paths to development.
Chapter 1 has shown that deeper economic liberalization and restrictive monetary policy have not always been the optimal path. Several of the countries that have benefi ted from globalization, such as those in East Asia, and now China, India and Viet Nam, have followed heterodox poli-cies that involved controlled rather than all-out liberaliza-tion of trade and investment policies and of capital markets. These countries maintained a measure of import protec-tion, adopted selective industrial policies and retained con-trols over foreign direct investment fl ows and the capital account. In fact, there are few examples of countries that have prospered from unfettered liberalization.
Developing countries need alternative monetary policies to expand domestic markets, maintain competitive exchange rates and improve access to credit. They also need fi scal pol-icies that will support greater public investment, which is essential for improving private sector productivity and mar-ket access by building new roads and providing better trans-portation. Unskilled labour is the most abundant factor of production in developing countries, so making maximum use of it, through labour-intensive production strategies, is an effi cient strategy to raise growth and reduce inequalities.

COMBATING POVERTY AND INEQUALITY
80
Notes
1 Forbes’s (2000) econometric study concludes that inequality
is good for growth.
2 Maxwell 2001; Thomson 2003; Anderson and O’Neil 2006.
3 World Bank 2006; UNDP 2005; UNDESA 2005; UNRISD 2005.
4 Anderson and O’Neil 2006.
5 Razavi 2006.
6 Cornia 2004.
7 Meidner and Rehn 1951.
8 Huber and Stephens 2001.
9 Galbraith and Garcilazo 2004.
10 Cornia 2004; Shorrocks and van der Hoeven 2005.
11 This section draws on Lee (2009).
12 This section is based on Ghosh (2008).
13 Hausmann et al. 2004.
14 Ghosh 2008.
15 Ferreira and Ravallion 2008.
16 Ferreira and Ravallion 2008.
17 Ferreira and Ravallion 2008.
18 ILO 2008b:9.
19 Giovannoni 2008.
20 Euro zone refers to member countries of the European Union
which use the euro as their national currency.
21 ILO 2008b.
22 Galbraith (2009) and Atkinson and Brandolini (2001) are critical
of widely used datasets on inequality, which are based on limited
sample surveys.
23 Kuznets 1955.
24 Galbraith 2009. The essential features of this curve were fi rst
discussed by Conceição (2001).
25 Galbraith 1998, 1989.
26 Galbraith and Kum 2003.
27 Milanovic 2007.
28 Galbraith, Roy Chowdhury and Shrivastava 2004.
29 Calmon et al. 2000.
30 Calmon et al. 2000.
31 Calmon et al. 2000.
32 This dataset was developed by Krytynskaia from original
sources in Goskomstat, and reported in Galbraith, Krytynskaia
and Wang (2004).
33 Galbraith 1998, 1989.
34 Galbraith and Hale 2008.
35 Galbraith et al. 2007.
36 This section draws on Lee (2009).
37 Dollar and Kraay 2002.
38 The World Bank strongly supported this position
in its World Development Report 2006.
39 Donaldson 2008.
40 Dollar and Kraay 2002.
41 Cornia 2004; Shorrocks and van der Hoeven 2005.
42 UNCTAD 2004.