Embed Size (px)
Citation preview

CHAPTER III
PROFILE OF THE MARINE PRODUCTS EXPORTS
Introduction
Fisheries sector plays very important role in national economy.
The marine fisheries sector in India has witnessed a phenomenal growth during
the last five decades both quantitatively and qualitatively1. India has huge
potential for development of coastal aquaculture and is a world leader after
China, contributing to about 5.2% of the total production in 2003(FAO 2005).
With a vision to develop marine products exports, the Marine Products Export
Development Authority has been trying to bring in technically and economically
feasible technologies to Indian entrepreneurs.
Fishing has a big market industry in India. India by virtue of its
water resources has seen a revolution in this fishing industry mainly after
independence.2 America had started buying marine products from India in the
forties. A few years later, Japan and Europe emerged as potential markets and
India was a major supplier of raw material. However, the cost of raw material
1. Srinath,(2003) “An Appraisal of the exploited Marine Fishery Resources of India”, Status of Exploited Marine Fishery Resources of India, Central Marine Fisheries Research Institute, Kochi, pp.1.
2. http://countrystudies.us/india/107.htm
62
increased as much as 80-85% of the selling price which spelt disaster. The main
reason behind this phenomenon was that the market players failed to enter the
value added sector. Besides, the firms failed to explore the potential growth in the
purchasing power of the domestic consumers. Instead their strategy was to make
easy money through raw material supplies.
By the turn of the 21st century, the buoyancy was lost and the
problems facing the industry had taken away the attraction for entry of new firms.
Very few firms have survived the rough period. Many have even failed to have an
exit plan. All this elicits interest in the following study of two marine export
firms in Calicut, Baby Marine Exports (a family business) and Uniroyal Marine
Exports Ltd. (a public limited company), the former started in 1977 and the latter
in 1994. It has been an uphill task for the firms in this industry to keep pace with
globalisation. Indian Planning Commission recognized the need to support the
development of fisheries and aquaculture with the necessary infrastructure,
harvesting activities with well-equipped fishery vessels, shore-based facilities,
cold chains and transport for marketing linkages up to retail outlets3.
While attempts must be made to overcome the world market
challenges, it would make immense commercial sense for marine food producers
to focus more on the domestic market which shows definite signs of expanding.
According to reports on internal disposal pattern, over four-fifth of the country's
fish catch is marketed as fresh or chilled, and forms staple food for the coastal
population and inland landing centres, while close to six per cent of the catch is
3. Sasikala, 2008, Marine Industry in Kozhikode – A Case Study”, Conference on Global Competition & Competitiveness of Indian Corporate, Department of Science and Humanities, National Institute of Technology, Calicut.

63
used for drying and curing. Frozen fish production accounts for about five per
cent and a similar quantum is used for reduction into fish meal. Changing
lifestyles have also created demand for ‘ convenience foods' that are value-added
fishery products of different descriptions covering extruded products, battered
and breaded products, surimi and derivatives, pickles and curried products in
restorable packing.4
Global Fisheries
In 1950, the newly founded Food and Agriculture Organization
(FAO) of the United Nations began collection of global statistics. Fisheries in the
early 1950s were at the onset of a period of extremely rapid growth, both in the
Northern Hemisphere and along the coast of the countries of what is now known
as the developing world. Everywhere that industrial-scale fishing (mainly
trawling, but also purse seining and long-lining) was introduced, it competed with
small-scale, or Throughout the 1950s and 1960s, this huge increase of global
fishing artisanal fisheries. This is especially true for tropical shallow waters effort
led to an increase in catches so rapid that their trend (10–100 m), where artisanal
fisheries targeting food fish for local exceeded human population growth,
encouraging an entire genera-consumption, and trawlers targeting shrimps for
export, and dis-tion of managers and politicians to believe that launching more
boats carding the associated by-catch, compete for the same resource5. Would
4. Chandrashekhar, 2010, http://www.thehindubusinessline.com/2010/12/20/stories/ 2010122050371100.htm
5. Pauly, D. 1997 Small-scale Fisheries in the Tropics: Marginality, Marginalization, and Some Implications for Fisheries Management, American Fisheries Society, Bethesda.
64
automatically lead to higher catches. The first collapse with global repercussions
was that of the Peruvian anchoveta in 1971–1972, which is often perceived as
having been caused by an El Niño event.
However, much of the available evidence, including actual catches
(about 18 million tonnes6) exceeding officially reported catches (12 million
tonnes), suggest that overfishing was implicated as well. But attributing the
collapse of the Peruvian anchoveta to ‘environmental effects’ allowed business as
usual to continue and, in the mid-1970s, this led to the beginning of a decline in
total catches from the North Atlantic. The declining trend accelerated in the late
1980s and early 1990s when most of the cod stocks off New England and eastern
Canada collapsed, ending fishing traditions reaching back for centuries7. Despite
these collapses, the global expansion of effort continued8
and trade in fish
products intensified to the extent that they have now become some of the most
globalised commodities, whose price increased much faster than the cost of living
index9.
In 1996, FAO published a chronicle of global fisheries showing
that a rapidly increasing fraction of world catches originate from stocks that are
6. Castillo, S. & Mendo, J. 1987 The Peruvian Anchoveta and its Upwelling Ecosystem: Three Decades of Change ICLARM Stud. Rev. 15, 109–116, Manila, Philippines.
7. Myers, R. A., Hutchings, J. A. & Barrowman, N. J. 1997 Why do fish stocks collapse? The example of cod in Atlantic Canada. Ecol. Applic. 7, 91–106.
8. Garcia, S. M. & Newton, C. 1997, Global Trends: Fisheries Management (ed. Sissenwine, M. P.) Am. Fish. Soc. Symp. 20, 3–27 (American Fisheries Society, Bethesda, MD,).
9. Sumaila, U. R. 1998, Proc. Expo ‘98 Conf. Ocean Food Webs Econ. Product., Lisbon, 1-3 July (eds Pauly, D., Christensen, V. & Coelho, L.) ACP-EU Fish. Res. Rep. 5, 87 (ACP-EU, Brussels.

65
depleted or collapsed, that is, ‘senescent’ in FAO’s parlance10. Yet global catches
seemed to continue, increasing through the 1990s according to official catch
statistics. This surprising result was explained recently when massive over-
reporting of marine fisheries catches by one single country, the People’s Republic
of China was uncovered11. Correcting for this showed that reported world
fisheries landings have in fact been declining slowly since the late 1980s, by
about 0.7 million tonnes per year12.
The period of the Second World War saw massive catch increases
in fisheries, particularly in the 1960s. However, crashes due to over- fishing
began to be reflected in global catch trends in the 1970s, and intensified in the
1980s and 1990s. In response, the industrialized countries of the Northern
Hemisphere, where over- fishing- induced catch declines appeared first, moved
their efforts toward deeper waters, and toward the south to the coasts off
developing countries, and beyond into the Southern Hemisphere, all the way to
Antarctica. In the first decade of the 21st century, the global expansion of
fisheries is completed and global catches, which peaked in the late 1980s,
continue to decline, and the collateral damage to marine ecosystems and
biodiversity continues to increase.
10. Grainger, R. J. R. & Garcia, S. M. 1996, Chronicles of Marine Fishery Landings (1950-1994). Trend Analysis and Fisheries Potential FAO Fish. Tech. Pap. 359 (Food and Agriculture Organization of the United Nations, Rome,).
11. Watson, R. & Pauly, D. 2001, Systematic distortions in world fisheries catch trends. Nature
424, 534–536.
12. Daniel Pauly, etal, 2002, Towards sustainability in world fisheries, Fisheries Centre, University of British Columbia, Nature Publishing Group, VOL 418, 8 August. www.nature.com/nature.
66
Several factors act to prevent the public in developed countries
from realizing the depth of the crisis fisheries are over- reporting by China the
fact that FAO combines declining fisheries catches with strongly increasing
aquaculture production increased consumption, in developed countries, of marine
products from developing countries and widespread denial by governments of the
magnitude of their problems. In this study, the scientific developments which
have led to a fisheries science being captured by fishing industry interests are
summarized and the outlines of a new fisheries conservation science" focused on
the maintenance of the ecosystems of fish populations are briefly sketched.13
Fisheries in Developing Countries
Economically healthy fisheries are fundamental not only to the
restoration of fish stocks but also to improved livelihoods, exports, fish food
security, and economic growth. Marine fishing operations are only part of the
$400 billion global marine industry, but economically healthy catch operations
underpin the sustainability of supply and profitability of processing and
distribution activities, a major source of employment, particularly in developing
countries. “For each person employed at sea another three people are employed
on shore,” noted Willmann. “Fish is the main animal protein for over 1 billion
people. It provides livelihoods for over 200 million people and 90% of these
people are in developing countries”14.
13. Daniel Pauly, http://www.mendeley.com/research/global-fisheries-brief-review
14. Sunken Billions, 2008, World Bank, FAO Harp on Marine Fisheries, Friday, October 10, http://wow.gm/africa/gambia/article/2008/10/10/world-bank-fao-harp-on-marine-fisheries.

67
Indian Marine Fisheries Scenario
India is blessed with rich marine fisheries resources. According to
the Ministry of Agriculture, Government of India, more than six million people
depend on marine fisheries for livelihood. Coastal Indian states like Andhra
Pradesh, Orissa, Kerala, Tamil Nadu, Karnataka, and West Bengal are major
centers of marine product exports from India. The processing plants for freezing
and canning of marine exports are mostly situated in these states. Frozen shrimp
is the most important export item in this sector and it accounts for more than 60
percent of India’s total exports of marine products. Shrimp cultivation and
exports have generated significant employment in India. Shrimp cultivation and
processing have created direct employment of about 300, 000 people and indirect
employment to over 700, 000 in the country.
India, geographically seventh largest country, is situated in the
south Asia, bounded by the Indian Ocean in the south, the Bay of Bengal in east
and the Arabian Sea in the west. India is one of the most popular democracies in
the world, borders china, Nepal and Bhutan to the north east, Pakistan to the west
and Bangladesh to the east. India is dissipated on an area of total 3287,590 sq km
with a 29, 731, 90 and 31, 44, 00 land and water area respectively. The nation is
enjoying federal republic political framework, where there are 28 states and 7
union territories. India's GDP raises to $2.965 trillion with a growth rate of 8.5%.
Apart from exporting textile goods and petroleum products, India has also
stepped up in the export of jewelers & gems, engineering goods, chemicals and

68
leather to its worldwide clients and earns more than $ 140.8 billion export
revenue. USA, UAE, China and UK are the major exporting nations.15
Indian fisheries is thus at cross roads now, there are problems of
stagnation of total yield, dwindling catches in certain high value fishes, reduced
earnings, increased costs of operation, resource depletion and in certain cases
over exploitation. Fish constitutes an important part of the staple diet and a major
source of animal protein in many parts of the world. Since 1985, developing
countries have been producing a major and increasing share of the world supply
of fish both capture fisheries and aquaculture has become the world’s fastest
growing food production system, with an average growth rate of 12% per annum
over last decade. The sustainability of capture fisheries has now become a global
issue. Given the current trends in price, demand and trade, economic incentives
for an increased investment in both capture fisheries and aquaculture will remain
high16.
Coastal environment plays a vital role in nation's economy by
virtue of the resources, productive habitats and rich biodiversity. Fishery plays an
important role in the Indian economy. It supports about one million fishermen.
It continues to be a thrust area of India’s development programmed due to its
vital contributions to employment generation, food security and foreign exchange
earnings. India, which ranks seventh in world fish production contributes about
15. http://www.indianindustry.com/indian-economy/
16. Ahmed. et al (1997), “A brief for fisheries policy research in developing countries” International Food policy research research institute, pp 5-6.

69
6-7 per cent of global fish production in recent years.17 Fish production in India
reached a level of about 6.40 million metric tons in 2003 – 2004 from 0.75
million metric tons in 1950-51, recoding 751 per cent increase.18 On an average
about 53 per cent of total fish production in India is from marine sector and her
share in world export of fishery products is 2.40 per cent in terms of Us $
realization.19 It is estimated that export of fishery products contributes 2.14 per
cent of the total foreign exchange in India.20
In India with a long coast line of 8129 Kms, two million sq. kms
of Exclusive Economic Zone and 1.2 million hectors of brackish water bodies,
offers vast potential for development of fisheries. Against an estimated fishery
potential of 3.9 million tones from marine sector, only 2.6 million tones are
tapped. Fishing efforts are largely confined to the inshore waters through
artisanal, traditional, mechanised sectors. About 90% of the present production
from the marine sector is from within a depth range of up to 50 to 70 meters and
remaining 10% from depths extending up to 200 meters. While 93% of the
production is contributed by artisanal, mechanised and motorised sector, the
remaining 7% is contributed by deep sea fishing fleets confining their operation
mainly to the shrimp grounds in the upper East Coast21.
17. Editorials, “Associations Related to Indian Fisheries Sector”, Fishing Chimes, Vol.23, No.3, June 2003, p.5.
18. Fishing Chimes, Vol.24, No. 7, October, 2004, p.31.
19. Siddhartha Roy, Statistical Outline of India 2003-2004, Tata Services Ltd., Mumbai, 2004,p.88.
20. Siddhartha Roy, op.cit., p.86.
21. India Seafood Resources, 2007, Marine Product Export Development Authority, Kochi.
70
Fish Production in the World and in India
Approximately 50 million people worldwide depend on fishing for
all or most of their family earnings, while another 150 million depend on fish
processing and the fleet servicing industry. More than 10 million work on 2.5
million small-scale fishing vehicles and account for 50% of the world’s catch
(FAO 2001). Fish production in the world rose from 23.50 million tonnes in
1950-51 to 140.48 million tonnes in 2003-04. Correspondingly, fish production
in India has touched 6.40 million tonnes in 2003-04 from a mere 0.75 million
tonnes in 1950-1951. The total fish production of our country stood at 6.87
million tonnes in 2006-07. The share of India in global fish production has grown
gradually from about 2.66% during the 1960s and 1970s to 4.56% in 2003-04.22
Table1 shows growth in fish production in India has been at a faster rate than in
the world; mainly due to increasing contribution from inland fisheries.
22. Ganesh Kumar and Datta, 2008, Impact of Science and Technology on Indian Fisheries Sector, S&T for Rural India and Inclusive Growth, India, Science and Technology. P.3 http://www.nistads.res.in/indiasnt2008/t6rural/t6rur11.htm

71
TABLE 3.1
FISH PRODUCTION IN WORLD AND INDIA, 1950-51 TO 2003-04
(MILLION TONNES)
Year World % change India % change India’s share
1950-51 23.50 - 0.75 - 3.19
1960-61 43.60 85.53 1.16 54.67 2.66
1970-71 66.20 51.83 1.76 51.72 2.66
1980-81 72.30 9.21 2.44 38.64 3.37
1990-91 98.26 35.91 3.84 57.38 3.91
2000-01 129.00 32.35 5.66 47.40 4.39
2003-04 140.48 8.90 6.40 13.07 4.56
2006-07* -- -- 6.87 -- --
Source: Economic survey 2006-07, *Annual Report 2006-07 Provisional Estimates
Contribution to Indian Economy and Prospects of Fisheries Growth
With fisheries sector comprising marine fisheries, freshwater and
brackish water aquaculture and inland fisheries consisting of tanks and reservoir,
the potentiality of this sector as a whole remains to be fully tapped and it remains
a sector of much promise. The fisheries sector in particular is more complex
enterprise that functions under integrated network of natural resources, other
enterprises with forward and backward linkages with fisheries and other socio-
political variables. The major functions of fisheries enterprises, viz. production,
transportation, storage and processing involve value addition from labour, capital
and management, which significantly influence the rapid economic development
of the country.
72
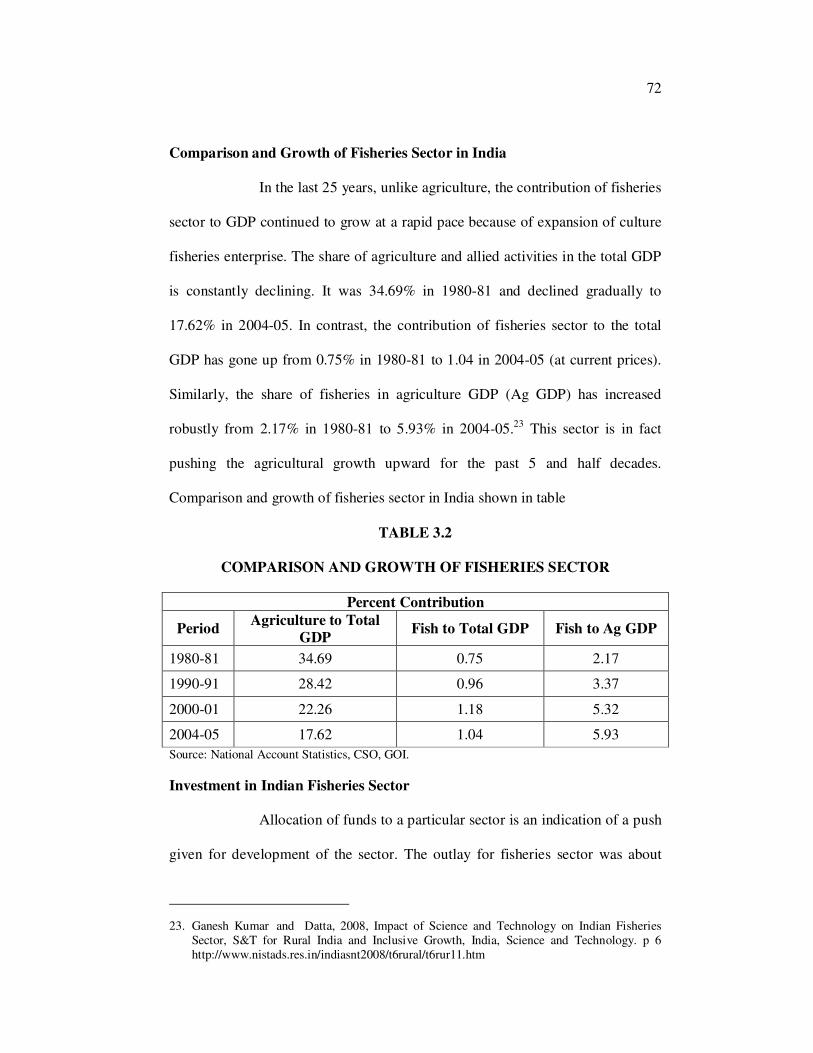
Comparison and Growth of Fisheries Sector in India
In the last 25 years, unlike agriculture, the contribution of fisheries
sector to GDP continued to grow at a rapid pace because of expansion of culture
fisheries enterprise. The share of agriculture and allied activities in the total GDP
is constantly declining. It was 34.69% in 1980-81 and declined gradually to
17.62% in 2004-05. In contrast, the contribution of fisheries sector to the total
GDP has gone up from 0.75% in 1980-81 to 1.04 in 2004-05 (at current prices).
Similarly, the share of fisheries in agriculture GDP (Ag GDP) has increased
robustly from 2.17% in 1980-81 to 5.93% in 2004-05.23 This sector is in fact
pushing the agricultural growth upward for the past 5 and half decades.
Comparison and growth of fisheries sector in India shown in table
TABLE 3.2
COMPARISON AND GROWTH OF FISHERIES SECTOR
Percent Contribution
Period Agriculture to Total
GDP Fish to Total GDP Fish to Ag GDP
1980-81 34.69 0.75 2.17
1990-91 28.42 0.96 3.37
2000-01 22.26 1.18 5.32
2004-05 17.62 1.04 5.93
Source: National Account Statistics, CSO, GOI.
Investment in Indian Fisheries Sector
Allocation of funds to a particular sector is an indication of a push
given for development of the sector. The outlay for fisheries sector was about
23. Ganesh Kumar and Datta, 2008, Impact of Science and Technology on Indian Fisheries Sector, S&T for Rural India and Inclusive Growth, India, Science and Technology. p 6 http://www.nistads.res.in/indiasnt2008/t6rural/t6rur11.htm

73
5.13 in the Ist Five Year Plan and it went to 2060.54 crores in the X plan shown in
Table 3.3.
TABLE 3.3
INVESTMENT ON FISHERIES DEVELOPMENT
(Rs. in crores)
Plan Total Agriculture Fisheries I 1960 294 5.13
II 4600 529 12.26
III 7500 1068 28.27
IV 15902 2728 82.68
V 39322 4302 151.24
VI 97500 6609 371.14
VII 218730 12793 546.54
VIII 434100 22467 1232.82
IX 859200 42462 2070.00
X 1525639 58933 2060.54 Source: Planning Commission GoI 2001 & ICAR Report 2005-06.
Its share in the total plan outlay was hovering from 0.26% in I
Plan to 0.52% in IV Plan and decreasing thereafter continuously and it received
only 0.14% of total outlays in X Plan; in spite of that the sector has been growing
at an annual growth rate of about 5% in the last 21/2 decades. Similarly, its share
in agricultural outlay has increased from 1.74% in I Plan to 5.62% in VI Plan and
it is slowly declining sine then and is about 3.50% in X plan.
However, the status of fisheries sub-sector is better, when
compared to that of agricultural sector as a whole. Because, the percent allocation
to agricultural sector in the total plan outlay started decling from IV Five Year
Plan onwards and is continuously decreasing further, which is a great concern for
the sector's overall growth. It's share in I Plan was about 15.00% and it went upto

74
17.16% in IV plan and is now only 3.86% in X Plan.24 Considering the general
importance given to agricultural sector, the preference received by the fisheries
sub-sector in the plan outlays is still reasonable.
The marine fisheries sector occupies an important place in the
socio-economic development of India. Recognized as a powerful income and
employment generator, it stimulates the growth of a number of subsidiary
industries, is a source of cheap and nutritious food and an instrument of
livelihood for a large section of coastal population of the country. More than 6.0
million fishermen and fish farmers in the country depend on fisheries and
aquaculture for their livelihood. The marine fisheries sector, which began as a
subsistence operation by employing exclusively traditional crafts during the pre-
independence days has today attained the status of capital intensive industry.
Export of marine products plays a vital role in fisheries development in India by
providing employment and income to millions engaged in fisheries, aquaculture,
processing and allied activities. Due to its high importance a modest attempt has
been made here to view the export performance of marine fisheries sector and
identify its potentials for further development.25
Fish Trade
Recent trends and developments in fish trade and marketing have
prompted the need for a reassessment of investment opportunities and credit
24. Ganesh Kumar and Datta, 2008, Impact of Science and Technology on Indian Fisheries Sector, S&T for Rural India and Inclusive Growth, India, Science and Technology. p11 http://www.nistads.res.in/indiasnt2008/t6rural/t6rur11.htm
25. Neogy Rajyasri, 2010, “Export Performance of Marine Fisheries Sector in India-An Appraisal” , Advances in Management, (Approved for inclusion in Cabell's Directory and Research Papers in Economics RePEc) Vol. 3 (12), Dec., pp.60-65.

75
needs of the fishery industry in the Asia and Pacific Region. Unlike the industrial
fisheries of the developed world, fishery industries in the developing countries of
Asia and the Pacific depend heavily on the artisanal sector for production and
supply of raw materials and on small- to medium-scale fishing operations. While
high value species are mostly processed for export, most of the medium and low
value species, which form the bulk of the landings, are marketed fresh or are
processed for the domestic market.26
Rapid macro-economic developments in the economies of the
region and changes in the expectations of consumers have led to a diversification
of product forms even in the domestic markets and value addition has become
one of the main features of the fish processing industry. Changing consumer
preferences, in favour of easy-to-prepare processed fishery products, brought
about by changing lifestyles, as well as a general increase in consumer
purchasing power, have increased the demand for such value-added fishery
products.27 At the same time, the increasing consciousness and demand of
consumers for quality fishery products has necessitated additional investments to
cater to such demand. Initial investigations show favourable financial returns for
value-added production of fishery products and indicate encouraging prospects.
There is certainly scope to take advantage of such potential and for financially
viable business opportunities. In this regard, the need for promotional efforts to
introduce new and improved value-added fishery products through co-ordinated
efforts between financial, marketing and fisheries institutions must be addressed.
26. Report, Government of India, 2004, No.30012/1/2003-FY (T-I), “Comprehensive Marine Fishing Policy”, Ministry of Agriculture Department of Animal Husbandry & Dairying, New Delhi.
27. Ibid.

76
Such investments would not only cater to a vacuum in the
domestic market, but would also help the impoverished coastal and inland fishing
communities and the processors to enjoy better incomes and improved
employment prospects. Value addition of under-utilized or low value species
would also assist in improving their use for direct human consumption rather than
for reduction for animal feed use. Value addition and utilization of often
discarded by-catch would contribute towards a more sustainable use of scarce
fisheries resources.28
History of Marine Products Exports
Till the end of 1960, export of Indian marine products mainly
consisted of dried items like dried fish and dried shrimp. Although frozen items
were present in the export basket from 1953 onwards in negligible quantities, it
was only since 1961 the export of dried marine products was overtaken by export
of frozen items leading to a steady progress in export earnings. With the
devaluation of Indian currency in 1966 the export of frozen and canned items
registered a significant rise. Frozen items continued to dominate the
trade. Markets for Indian products also spread fast to developed countries from
the traditional buyers in neighboring countries.29
Marine Products Trade
Trade in marine products can play an important role in promoting
economic development especially in the less developed countries (LDCs). The
28. Report, 1997, Workshop On Financing Value-Added Production And Marketing Of Fishery Products In Asia And The Pacific Kuala Lumpur, Malaysia, FAO Of The United Nations, Rome.Www.Fao.Org/docreP/006/W9250E/W9250E00.
29. www.mpeda.com/inner_home.asp?pg=publications/exportreview/trends.htm
77
export of marine products can play for imports of capital goods, technology,
manufactured products and other essential commodities for a sustained growth of
developing countries. Many developing countries have a comparative advantage
in the production of marine products and export of these goods is the main source
of foreign exchange earnings. In an export led growth model of trade it would be
to the advantage of the developing countries to specialize in production of those
goods where they have comparative advantage and to exploit the surplus
production to earn the valuable foreign exchange. Such a policy will led to use
trade as an engine of growth, as well as in ensuring rational allocation of
resource. India, which is predominantly a fisheries economy, is no exception in
this regard.
With significant rise in shrimp exports particularly to US, the
country's marine products exports during the current fiscal year is likely to reach
$2.3 billion, having crossed $ 2 billion in the first three quarters of 2010-11.
Export realisations have achieved a major milestone in spite of several negative
factors including recession and the weakening of Euro because of political unrest
in some countries. During the nine months exports are ahead by 6.60% in
volume, 18.92% in value and 24.70% in US dollar realisation compared to the
same period last year.30 In a reversal of trend, US is back as the prominent
consumer of Indian shrimps and has helped in recording growth even as some
markets like European Union show a decline.
Frozen Shrimp continued to be the major export item accounting
for 48.61% of the total dollar earnings. Shrimp exports during the period
30. Ibid.

78
increased by 12.54% in volume, 33.94% in rupee value and 40.72% dollar value
respectively. Export of frozen shrimp to US has registered a tremendous growth
of 88.12% in volume and 149.05% in US $ terms. Fish, the principal export item
in volume terms and the second largest export item in value term, accounted for a
share of about 36.01% in quantity and 18.33% in dollar earnings showed a
decline of 3.36% in quantity when compared to the last year. Export to China has
declined considerably both in terms of quantity and value. India's marine exports
include black tiger shrimp, fresh water prawn shrimp, fresh sail fish, frozen
versatile fish, frozen skip jack and frozen squid.31
Tamil Nadu Fisheries Scenario
Tamil Nadu has an important maritime state in the South East
Coast of India endowed with rich marine and inland fishery resources. Tamil
Nadu has immense potentials of commercially important pelagic and demersal
fishes in the inshore, off-shore and deep sea fishing regions offering great scope
for a variety of marine products. Tamil Nadu is one among the coastal States in
India in the east coast having a coastal line of 1076 kms. The State has 13 coastal
districts with 591 fishing villages consisting of 8.38 lakh fishery population, of
which 2.81 lakh fishermen are actively engaged in fishing activity. Marine
fishery resources comprise of 0.19 million sq.kms of Exclusive Economic Zone
(EEZ) and a Continental Shelf of 41,412 sq.kms. The State shares 9.4 per cent of
EEZ in the Country.32
31. http://www.financialexpress.com/news/seafood-exports-to-reach-2.3-bn/753514/0
32. http://www.tnstat.gov.in/publications.html

79
The annual marine fish catch is estimated at 3.93 lakh tonnes and
the State became the major exporter of marine products. Turning to Inland
fishery, the fishery population was estimated at 2.61 lakh. Under Fish Farmers’
Development Agency Programme, about 5000 hectares are being utilized for
water aquaculture. For the development of Inland fisheries, there are 8 Fish Seed
Production Centres functioning in the State. Presently, the total brackish water
area spread over 56000 hectares is used for aquaculture production and beyond
this, shrimp culture is being undertaken in 6066 hectares in the State. The State
ranks eighth in fish production in the Country. The fisheries sector of the State
provides employment opportunities and generates income and stimulates growth
of subsidiary industries besides assuring nutritive food security. An amount of
Rs.101.80 crore is expected to be spent under fisheries sector during 2009-10 and
an outlay of Rs.112.65 crore is approved for 2010-11.33
Tamil Nadu Geographical Coverage
Tamil Nadu is bounded by Karnataka and Andhra Pradesh in the
north and Kerala in the west. The coastal eastern and southern boundaries are
lapped by the waters of the Bay of Bengal and the Indian Ocean respectively. The
eastern and western tips of the state are defined by the Point Calimere and
Mudumalai wildlife sanctuaries while the northern extreme is Pulicat lake and the
southernmost tip is Cape Comorin or Kanniyakumari - the Land's End of India.
With an area of 130,058 sqkm and population over 55 million, Tamil Nadu is the
11th largest state in India. The Union Territory of Pondicherry is a small enclave
33. Statistical Hand Book, 2011, Animal Husbandry, Fisheries and Forest, Department of Economics and Statistics, Government of Tamil Nadu, p.62. http://www.tnstat.gov.in/publications.html;

80
in the district of South Arcot. Traditionally, the land of Tamils has been divided
into 5 major physiographic divisions - the Kurinji or mountainous region, the
Mullai or forest region, the Palai or arid region, the Marudham or the fertile
plains and the Neidhal or coastal region.34
Tamil Nadu has a wealth of flora and fauna and some of its major
wildlife sanctuaries like Mudumalai and Anaimalai (Indira Gandhi W.S) are
situated in the hills of the Western ghats which is the habitat of elephants, tigers,
bisons and a variety of monkey and deer. Of the 3000 and more plant species
found in Tamil Nadu, a majority are found in the mixed deciduous forests of this
region. One of the most noteworthy flowers is the Kurinji of Kodaikkanal which
blooms once in 12 years. Cinchona from which quinine - a drug for treating
malaria - is extracted and eucalyptus grow abundantly in the Nilgiris.
Forests of medicinal herbs are found in Palani hills and
Courtallam. Palmyrah trees grow by the thousands in Tirunelveli and its products
are used as raw materials for several cottage industries. Rubber is the main
plantation crop in Kanniyakumari and the more exotic sandalwood grows, though
not in very large numbers, in the Javadhu hills of Vellore district. The perennial
river of the state is the Cauveri which originates in Coorg in the neighbouring
Karnataka. The fertile Coromandel plains are irrigated by the Kaveri and its delta
in Thanjavur - Nagapattinam region is known as the granary of Tamil Nadu. The
other rivers in the state are the Palar, Pennar, Vaigai and Tamiraparani. The arid,
34. http://www.indiatourism.com/Tamil Nadu-tourism/Tamil Nadu-geography.html

81
desert-like land in the state is confined to a small area in Tirunelveli district and
is known as the Palai.35
The coastal Tamil Nadu comprises the Coromandel coast which
has its northern half and the Fisheries coast which is the southern half. Mylapore,
Poompuhar and Mamallapuram were the famous ancient ports on the
Coromandel from where merchant ships sailed to Rome, Greece and the Far East.
There are mangrove forests at Pichavaram and prominent bird sanctuaries at
Pulicat Lake and Vedanthangal, though the latter is not on the coast itself. Once
famous for its pearls, the Fisheries coast is a major tourist attraction since it has
some of the most important pilgrim centres in India36.
Fisher folk Welfare Schemes in Tamil Nadu
With a view to improve the economic conditions of the fisher folk,
the State implements many Welfare Schemes to the members who have enrolled
in the Cooperative Societies. In order to alleviate the sufferings and also to uplift
them, there are 1366 Co-operative Societies inclusive of marine fishermen (550
Nos.), Marine Fisherwomen (384 nos.), Inland Fishermen (315 Nos), Inland
Fisherwomen (84 Nos.), other types (21 Nos.), District Fishermen Federation (11
Nos.) and Tamil Nadu Fisheries Federation (one number) functioning in the
State.37 In these Societies 5.62 lakh of fishing population were enrolled as
35. Ibid.
36. http://www.indiatourism.com/Tamil Nadu-tourism/Tamil Nadu-geography.html
37. Statistical Hand Book, 2011, Animal Husbandry, Fisheries and Forest, Department of Economics and Statistics, Government of Tamil Nadu, p.64. http://www. tnstat.gov.in/publications.html

82
members in the State. In addition to this, the following other schemes are also
implemented in the State shown in Table 3.4.
TABLE 3.4
FISHERFOLK WELFARE MEASURES
S. No.
Category Total (Nos.)
Total Members (Lakhs)
1 Marine Fishermen Cooperative Societies 550 3.21
2 Marine Fisherwomen Cooperative Societies 384 1.43
3 Inland Fishermen Cooperative Societies 315 0.77
4 Inland Fisherwomen Cooperative Societies 84 0.13
5 Other types of Societies 21 0.07
6 District Fishermen Cooperative Federation 11 0.01
7 Tamil Nadu State Apex Fisheries Cooperative Federation 1 0.01
Total 1366 5.62
Source: Policy Note on Fisheries, 2009-10, Govt. Tamil Nadu.
Marine Fishery Resources Potential in Tamil Nadu
Tamil Nadu is endowed with one of the largest and richest fisheries
in India. The State has 1.9 lakh sq. m of EEZ covering the three coastal zones
already described, besides 21 coral islands in the Gulf of Mannar, with rich
habitats of corals, coastal lagoons (Pulicat lake and Muthupet swamp) and
estuaries. There are 5 major rivers, 51 reservoirs and innumerable tanks. These
natural resources harbour a variety of finfish, shellfish and aquatic plants. The
unique topography of Tamil Nadu with the Gulf of Mannar and Kanyakumari in
the south, and Pulicat Lake, which is the second largest lagoon in the country, in
the north, has resulted in an abundance of endemic species and a large number of
high value potential resources. They include spiny lobsters, crabs, flower
shrimps, coral fish, sea bass, groupers, sea breams, mullets, gastropods (abalones,

83
chanks) pearl oysters. Nearly one-third of the seaweed resources of the Indian
Ocean are found along the coast of Tamil Nadu, particularly the Gulf of Mannar
(CASI, 2000)38.
Commencing from the early survey of 1927-28 with “Lady
Goschen” and with the valuable work done by the shore fishing Survey Stations
at Madras, Cuddalore, Mallipattinam, Rameswaram and Cape Comorin and also
exploratory Fishing Stations of the Government of India at Tuticorin and Madras,
there is a fund of information available on the Fishing grounds off the Tamil
Nadu Coast. Important fishing grounds have been located opposite to Pulicat,
Ennore, Madras, Sadras, Cuddaloare, Portonovo, Tranquebar, Nagapattinam,
Point Calimere, Adirampattinam, Pamban, Rameswaram, Tuticorin, Cape
Comorin and Colachel. Wadge Bank is the richest fishing ground in the Tamil
Nadu Coast. South of Cape Comorin about 88 kms.39. Tamil Nadu District wise
coastal length shown in Table 3.5.
38. Ibid.
39. Ibid, p.77.

84
TABLE 3.5
DISTRICT WISE COASTAL LENGTH OF TAMIL NADU
S. No. Name of the District
Coramandal Chennai
point calimere
Palk Bay
Gulf of Mannar
West Coast (Kanyakumari -
Neerodi) Total
1 Chennai 19.0 0 0 0 19
2 Thiruvallur 27.9 0 0 0 27.9 3 Kanchipuram 87.2 0 0 0 87.2 4 Villupuram 40.7 0 0 0 40.7
5 Cuddalore 57.5 0 0 0 57.5
6 Nagapattinam 124.9 63.0 0 0 187.9 7 Thanjavur 0 47.2 0 0 47.2 8 Thiruvarur 0 45.1 0 0 45.1
9 Pudukottai 0 42.8 0 0 42.8
10 Ramanathapuram 0 95.8 141.0 0 236.8 11 Tuticorin 0 0 163.5 0 163.5
12 Tirunelveli 0 0 48.9 0 48.9 13 Kanyakumari 0 0 11.5 60 71.5
Total 357.2 93.9 364.9 60 1076.0 Source: CMFRI, 2009-2010.
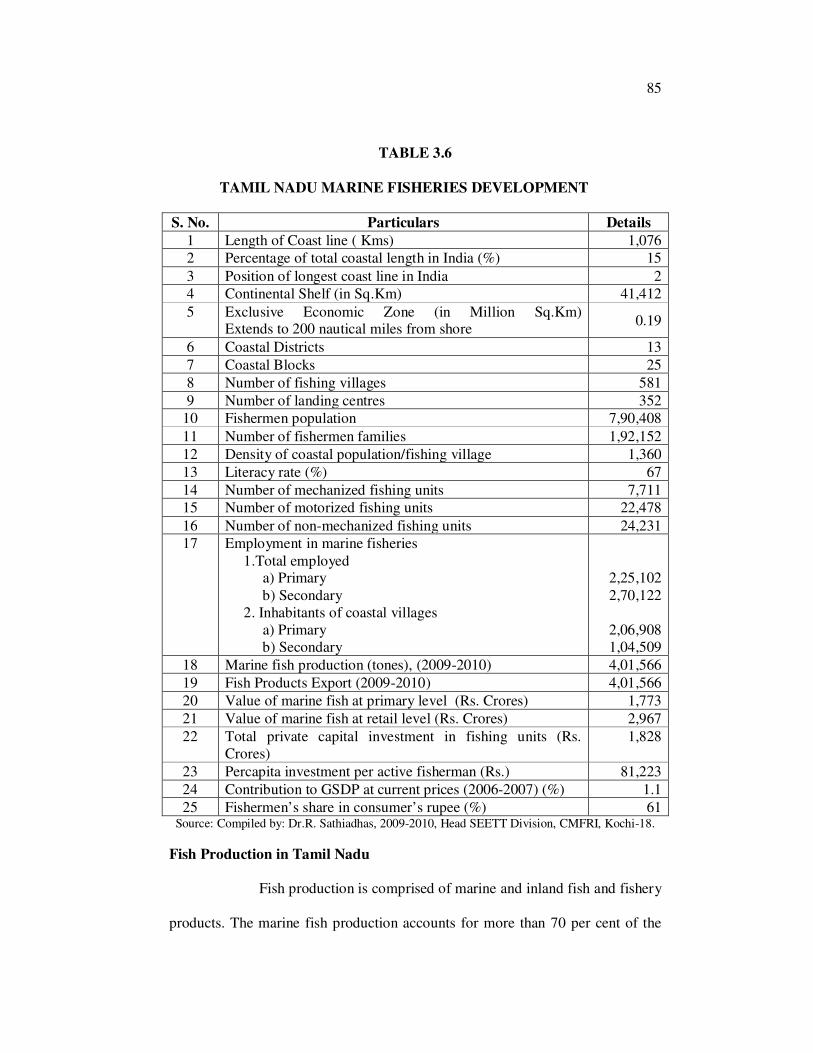
Tamil Nadu Marine Fisheries Development
The coastline of Tamil Nadu has a length of about 1076 kms
constitutes about 15% of the total coastal length of India and stretches along the
Bay of Bengal, Indian Ocean and Arabian Sea40. Tamil Nadu has the second
longest coast line in India41 and Exclusive Economic Zone of 200 miles from the
coast42. Tamil Nadu is the third largest marine fish producing State in the
Country43. The State has a fishermen population of about 7, 90,408lakhs, and
export of marine products from the State during 2009-2010 amounted to 401566
metric tons.44 Tamil Nadu marine fisheries development shown in Table 3.6.
40. Ramesh, ENVIS Center for Coastal Zone Management and Coastal Shelterbelts, Institute for Ocean Management, Anna University, Chennai.
41. Ibid, p.8.
42. Sreenivasan.R, 1984, Report on Export Potential Survey of Marine Products Tamil Nadu., MPEDA, Cochin, pp.1.
43. Ibid., p.38.
44. Sathiadhas, 2009-2010, Head SEETT Division, CMFRI, Kochi-18.
85
TABLE 3.6
TAMIL NADU MARINE FISHERIES DEVELOPMENT
S. No. Particulars Details 1 Length of Coast line ( Kms) 1,076 2 Percentage of total coastal length in India (%) 15
3 Position of longest coast line in India 2 4 Continental Shelf (in Sq.Km) 41,412
5 Exclusive Economic Zone (in Million Sq.Km) Extends to 200 nautical miles from shore
0.19
6 Coastal Districts 13
7 Coastal Blocks 25
8 Number of fishing villages 581
9 Number of landing centres 352 10 Fishermen population 7,90,408
11 Number of fishermen families 1,92,152
12 Density of coastal population/fishing village 1,360
13 Literacy rate (%) 67
14 Number of mechanized fishing units 7,711 15 Number of motorized fishing units 22,478
16 Number of non-mechanized fishing units 24,231 17 Employment in marine fisheries
1.Total employed a) Primary b) Secondary 2. Inhabitants of coastal villages a) Primary b) Secondary
2,25,102 2,70,122
2,06,908 1,04,509
18 Marine fish production (tones), (2009-2010) 4,01,566
19 Fish Products Export (2009-2010) 4,01,566
20 Value of marine fish at primary level (Rs. Crores) 1,773
21 Value of marine fish at retail level (Rs. Crores) 2,967
22 Total private capital investment in fishing units (Rs. Crores)
1,828
23 Percapita investment per active fisherman (Rs.) 81,223
24 Contribution to GSDP at current prices (2006-2007) (%) 1.1
25 Fishermen’s share in consumer’s rupee (%) 61 Source: Compiled by: Dr.R. Sathiadhas, 2009-2010, Head SEETT Division, CMFRI, Kochi-18.
Fish Production in Tamil Nadu
Fish production is comprised of marine and inland fish and fishery
products. The marine fish production accounts for more than 70 per cent of the

86
total fish production in the State. The rest accounts for inland fish production.
The fish production in the State had marginally improved from 5.58 lakh tonnes
in 2007-08 to 5.63 lakh tonnes in 2008-09. The total consumption of fish had
been increased due to the rise of population, rapid urbanization and change in the
consumption pattern. In order to meet out the increasing demand for fish, the
State had set up ‘Fisheries Development Mission’ and Tamil Nadu Fisheries
Development Corporation (TNFDC) and enhanced the fish production and
thereby to generate employment and income and sustain livelihood.
The Fisheries Development Mission was implemented in selected
pockets of five coastal districts viz. Ramanathapuram, Nagapattinam, Thanjavur,
Pudukottai and Thoothukudi during 2008-09. The scheme was being
implemented at an estimated cost of Rs.20.00 lakhs in the State. Further, in order
to conserve the fishery resources, the State had imposed a fishing ban during the
breeding season for a period of 45 days from April 15 to May 29 in the East
Coast region and June 15 to July 29 in the West Coast. The Government had
provided Rs.200/- per family during fishing ban period. During 2008-09, a sum
of Rs.719.97 lakhs was being disbursed to 143994 fishermen families.45
Fish Export in Tamil Nadu
The State dominates high potential for fish culture and it is one of
the leading exporters of fish in the country. The processed fish is being exported
through Chennai and Tuticorin ports. Among the two ports, the Chennai Port
occupies 4th rank in the quantity of exports and 2nd rank in the value of fish
45. Statistical Hand Book, 2011, Animal Husbandry, Fisheries and Forest, Department of Economics and Statistics, Government of Tamil Nadu, pp 62-63. http://www.tnstat.gov.in/publications.html
87
exports whereas Tuticorin port ranks 6th position both in the quantity of export
and value of fish exports. The state shared 13.41 per cent of quantity exported
and 23.79 per cent of the value of fish exported in the country during 2007-08.
Tamil Nadu is well ahead in the industrial activities through
dispersing industrialisation. The State attracts foreign direct investment to
strengthen the capital in the industrial sector. To promote the industrial activities
in dynamic, the State is creating a favourable industrial climate in the State by
announcing Industrial Policies, IT Policies from time to time and provides
industrial assistances to the entrepreneurs.46
Growth Performance of Tamil Nadu Fish and Fish Products Export
The state fish and fish product export had plummeted from 58482
tonnes in 2001-02 to 73327 tonnes in 2009-10. The total value of export of fish
had also witnessed a fall from Rs. 201640 lakhs to Rs.198207 lakhs during the
respective ninth years47. The growth performance of Tamil Nadu fish and fish
products export is presented in table 3.7.
46. Statistical Hand Book, 2011, Animal Husbandry, Fisheries and Forest, Department of Economics and Statistics, Government of Tamil Nadu, p 66.
47. http://www.tnstat.gov.in/publications.html

88
TABLE 3.7
GROWTH PERFORMANCE OF TAMIL NADU FISH AND FISH
PRODUCTS EXPORT
2001-2002 TO 2009-2010
Year Quantity Value
2001-2002 58482 201640.00
2002-2003 70147 250787.00
2003-2004 68462 207116.00
2004-2005 70809 206804.00
2005-2006 72418 199572.00
2006-2007 72883 206805.00
2007-2008 72644 181314.00
2008-2009 68397 177220.00
2009-2010 73327 198207.47
Total 627569 1829465.47
Source: MPEDA, 2010, Chennai-40. Q: Quantity in Tonnes, V: Value in Rs. Lakhs
Ornamental Fish in Tamil Nadu
The fisheries sector is important for Tamil Nadu economy and
society. As one of India's leading fish producing States, Tamil Nadu has long
looked to the fisheries sector as a source of livelihood for thousands of fishermen
and their families. And in that sector, the ornamental fish niche is one that is
attracting increasing global attention. The Food and Agriculture Organisation of
the United Nations (FAO) describes it as “a widespread and global component of
international trade, fisheries, aquaculture and development.” The FAO estimates
the industry to be worth $15 billion – when non-exported product, wages, retail
sales and associated materials are taken into account. Statistics reported to FAO

89
from member States indicate that the world export value in 1998 of ornamental
fish was $174 million, with imports valued at $257 million.48
The world trade in ornamental fish is estimated at $2.2 billion, 98
per cent of which are tropical fish. Singapore and Malaysia are the leaders in the
global ornamental fish trade. Since 1985, the value of international trade in
exports of ornamentals has increased at an average growth rate of approximately
14 per cent per year, says the FAO. Developing countries account for about two-
thirds of the total export value. Malaysia is expected to increase its annual
production of ornamental fish to 800 million, worth about $51.5 m on 2010. At
present, Malaysia's annual production stands at nearly 500 million. More than
550 local and exotic varieties – over 250 species – are captive bred in Malaysia
for the domestic and world markets, fetching the country an estimated $38
million annually.49
The biggest market is the US, where about 10 per cent of
households have aquariums with ornamental fish. According to the FAO, with the
levelling off or decline in production from many capture fisheries, people are
looking for other ways of harnessing aquatic biodiversity. “One useful option is
the sustainable harvest and culture of ornamental fishes. In many developing
countries, the harvest of fresh and marine ornamental fish provides income in
areas where little other options exist for employment.” Given that Tamil Nadu
has a great level of unemployment, the ornamental fish sector may well be an
48. Kumar 2010, http://www.thehindubusinessline.com/2010/02/09/stories/2010020952191700. htm
49. Ibid.

90
avenue of income for the state's jobless youth. The Government should now do
its best to promote the sector and ensure that it thrives.
Tamil Nadu Industrial Policy
The present `Global Economic Slowdown’ has its impact in the
State economy also. The manufacturing sub-sectors of the State economy viz.
textiles, wearing apparels, leather, wood products, chemicals, non-metallic
minerals, basic metals, software and hardware of IT industries, transport
equipments, automobiles have experienced lower production compared to that of
the previous year’s level due to lower demand and power shortages.50
Tamil Nadu Industrial Policy 2006-07, focused on stimulating
further industrial development. It aims to attract investment, facilitates
manufacturing capacity and enables global manufacturing competence and
competitiveness of local industry. The Industrial Policy 2006-07 has the
following visions to be achieved by 2011 like to create additional two million
jobs, to raise contribution from manufacturing sector to GSDP from 21 per cent
to 27 per cent, to double Tamil Nadu’s annual exports to Rs.1,40,000 crore, to
raise Tamil Nadu to a position of pre-eminence in innovation and high
technology and raise the competitiveness and efficiency of Micro, Small and
Medium Enterprises (MSMEs) and agro based industries for increasing value
addition and giving better income to the farmers.51
50. Statistical Hand Book, 2011, Animal Husbandry, Fisheries and Forest, Department of Economics and Statistics, Government of Tamil Nadu, p.70. http://www. tnstat.gov.in/publications.html
51. Statistical Hand Book, 2011, Animal Husbandry, Fisheries and Forest, Department of Economics and Statistics, Government of Tamil Nadu, p71. http://www. tnstat.gov.in/publications.html
91
The Liberalisation Policy 1991 increased the FDI into the country.
The FDI inflow depends on the investment climate, availability of tax concession,
incentive packages and infrastructure facilities. FDI inflows bring into the State
not only the investment but also the Foreign Technology Transfers. Between
April 2000 and March 2009, Tamil Nadu Region attracted Rs.21078.90 crore and
stood at the fifth position at the national level.52
Marine Fishery Resource Potential in India
A working Group constituted by Ministry of Agriculture in August
1990 had revalidated the fishery resource potential of Indian EEZ at 3.9 million
tonnes of which 2.21 million tonnes are within a region of depth up to 50 mtrs. It
is found that the resource within 50 mtrs. depth regions is at present exploited to
the optimum level. The resource potential beyond 50 mtrs. is estimated at 1.69
million tonnes. Some of the commercially important resources under exploitated
beyond 50 mtrs. depth regions are tuna (2.09 lakhs tonnes), Tunnies (2.42 lakh
tonnes), Ribbon fish (2.16 lakh tonnes), Perches(1.25 lakh tonnes), Cat fish (0.63
lakhs tonnes) . The details of fishery potential of the Indian EFZ, Marine
Fisheries in Indian Economy and Marine Fishermen Census of India could be
seen in appendix. A, B and C.
Marine Products Exports – An Overview
Marine Export in India
Indian marine products trade has been in the limelight ever since
the economy was liberalized in the early years of the last decade. In India, major
52. Statistical Hand Book, 2011, Animal Husbandry, Fisheries and Forest, Department of Economics and Statistics, Government of Tamil Nadu, p.85. http://www. tnstat.gov.in/publications.html
92
share of export earning is mostly concentrated on few commodities. Exports are
the major focus of India's trade policy. Many items are freely exported from
India. Foreign trade is important to the economy because of the country's need to
import a variety of products. India exports a huge number of products and
imports equally a good number of required products.
Export earnings are given considerable economic importance
under the current World Trade Organization (WTO) regime. According to the
statement made by Marine Product Export Development Authority (MPEDA),
Indian seafood exports had crossed $ 1 billion consecutively for the past 10 years.
Against a target of $ 1.376 billion for 2003-2004, seafood exports were $ 1.330
billion and the quantity exported was 4.12 lakh tonns against 4.67 tonns in 2002-
2003. In rupee terms also terms also there was a shortfall of Rs.789.30 crores as
the final export figures for 2003-2004 were Rs.6, 091.95 crores against
Rs.6881.31 crores recorded in 2002-200353.
The inadequacy of infrastructure facilities right from landing of
catches to the shipment stage tends to be a major constraint in the way of post-
harvest activities including export endeavor. Marine products exporters are
worried about the sharp fall in the marine products catch. They urge that
comprehensive conservation measures be taken, including a total ban on fishing
activities in the country. The major problem faced by exporters at the moment is
the shortage of catch. The marine catch has stagnated over the last few years54.
53. Annual Report, 2005, MPEDA, Kochi.
54. Ibid.

93
Indian exporters suffer from a number of handicaps in the matter
of export related infrastructure, cost of finance and transaction cost. The
transaction cost for Indian exporters is indeed quite high when compared to what
competitors in neighboring countries bear. Exporters are also experiencing
difficulties in the matter of the Duty Entitlement Pass Book (DEPB) scheme. This
scheme is essentially for refund of duties in the form of credit and, as such is
similar to Duty drawback scheme. Fierce competition, thinning profit margins,
high transaction cost and volatility of the rupee, dollar rate are a combination of
factors that could drive the most venturesome of exporters away from the export
business55.
Marine products are one of the most important processed food
exports from India and represent an important potential growth area for the
Indian economy. Exports of Marine products from India has increased from about
US$ 46 million in 1970-71 to more than US$ 1.85 billion in 2006-07 (Figure 1).
It is estimated that by 2010, exports of marine products from India will touch
US$ 4 billion. USA, Japan, Australia and the European Union are traditional
major export markets of India. China and Middle-Eastern countries are perceived
as potential big markets for India’s marine exports56.
Marine Products Export Growth
Marine exports from the country have posted a 10% growth in
55. Ibid.
56. Niladri Saha, Parthapratim Pal, “Marine Product Exports and Its Impact on Female Employment: A Case Study from West Bengal”, http://www.thecommonwealth.org/ gtinformation/164419/164436/167061/marine_ case_study/.

94
value during the first six months of this fiscal as per figures submitted recently by
the Marine Products Export Development Authority (MPEDA) to the Union
commerce ministry. Given the trend, exports were likely to touch the Rs 8,000-
crore level by the end of this fiscal, especially in the backdrop of the ensuing
Christmas and New Year season which should boost shipments in a big way, feel
exporters. During the period April to September, 2, 10,494 tonne of marine
products was exported earning Rs 3,704.87 crore compared to 1, 98,026 tonne
worth Rs 3,373.2 crore during the same period last year. Even value in dollar
terms went up by 4.36% to $810.3 million from $776.47 million. However, the
unit value realisation though remaining static around the $4 a kg level, was
marginally down to $3.85 from $3.92. Shrimp, though the main item in the
export basket accounting for over 60% of the value earned, recorded a decline in
quantity while the rupee realisation was up by 6.35%. From 73,155 tonne it was
down to 68,869 tonne this year while the earnings were up to Rs 2,349.05 crore
from Rs 2,208.82 crore last year.
Marine Products Exports Trend
Marine products exports from India were on the rise thanks to
increasing demand from global markets. Prices have declined in global markets
but demand growth would compensate for lost value, exporters said. Good
harvests have led to a fall in cost of feeds and raw materials and this would
insulate the industry somewhat from falling prices, traders here said. Unit value
realisation in global markets has come down by 35-45 per cent in the year as
supplies from several south-east Asian countries have gone up. The average price
for a kilogram of shrimp last year was $16-18. This has declined to $8-10 this

95
season. This trend has had limited impact, with trawling operations here being
somewhat impacted. Sections of fishing boat owners have decided to stop
trawling for the time being as prices were unviable. Prices of marine products
fell by 20-30 per cent in the local markets in the last few weeks. Exporters seized
this opportunity to step up exports this year, and the volume growth could be as
much as 10 per cent month-on-month between 2003 and 2004.
Sources in the Seafood Exporters Association (SEA) told exports
would be more than the target of Rs 6500 crore set for the current fiscal by the
Marine Products Export Development Authority [MPEDA]. In 2003-04, export
was 4, 12,017 tonne valued at Rs 6091.95 crore. Shrimp accounted for 65 per
cent of the total value of exports and demand for the product was rising in the US
market, exporters pointed out. Industry sources said they expected the anti-
dumping duty imposed by US authorities to be reduced later in the year when the
final verdict on the case would be passed. It was imposed in August 2004. The
final decision of the US commerce department was expected on December 16.
Exporters told Business Standard that demand for marine products other than
shrimp were also on the rise. Cuttle-fish, ribbon-fish and squid were in great
demand in the China market. Export of Indian marine products to China was on
the rise57.
Marine Products Export Comparison
Since the fall in the export earnings during 2003-04, the dollar
earnings have increased steadily till 2009-10. During 2009-10 for the first time in
57. 'Indian marine exports likely to touch $4 billion by 2010', The Business Standard: January 31, 2005.

96
the history of Marine product exports, the export earnings have crossed 2 billion
US dollars and Rs.10,000 crore mark. Export has crossed all previous records in
quantity, rupee value and US $ terms. Exports aggregated to 678436 tonnes
valued at Rs.10048.53 crore and US Dollar 2132.84 million.58 Compared to the
previous year, this recorded a growth of 12.54% in quantity, 16.74% in rupee
earning and 11.75% growth in US $ earnings as shown Table 3.8.
TABLE 3.8
EXPORTS DURING 2009-10 COMPARED TO 2008-09
Export Details 2009-10 2008-09 Growth (%)
Quantity Tonnes 678436 602835 12.54
Value Rs.crore 10048.53 8607.94 16.74
$ Million 2132.84 1908.63 11.75
Source: www.mpeda.com/inner_home.asp?pg=publications/exportreview/trends.htm
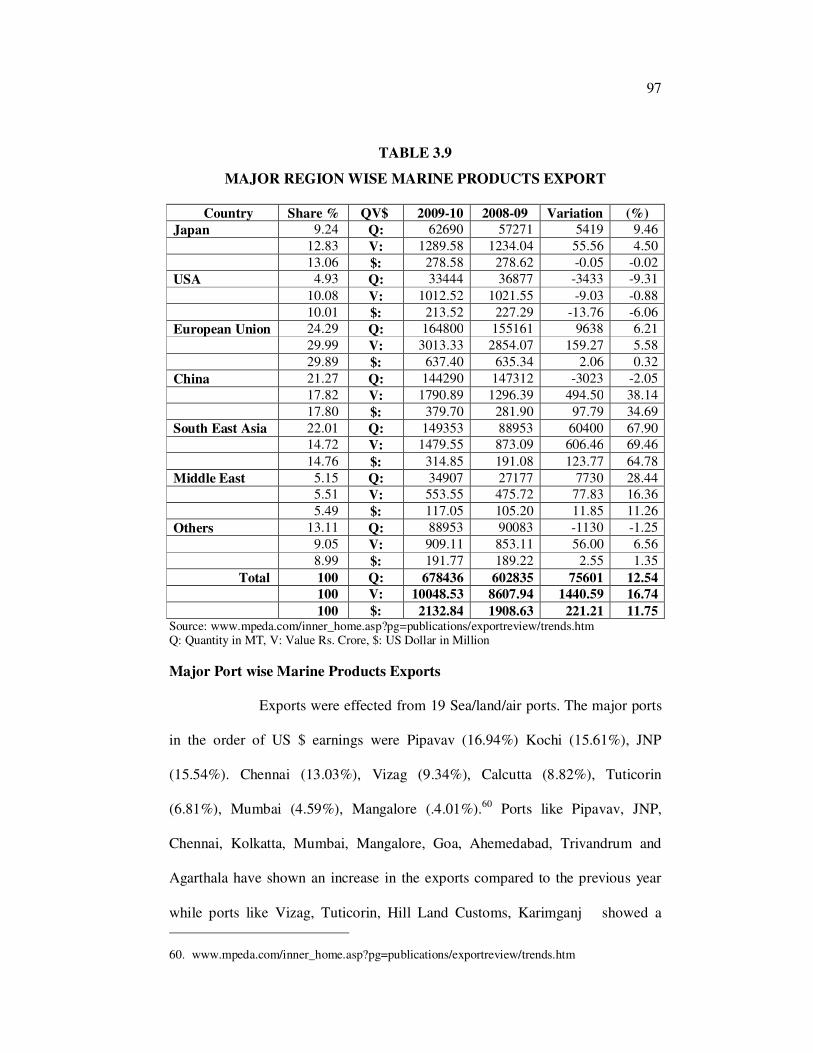
Major Region wise Marine Products Export
European Union (EU)
European Union (EU), continued to be the largest market with
a share of 29.89% in US $ realisation. China maintained the second place with a
share of 17.80%, followed by Japan 13.06%, USA 10.01%, South East Asia
14.76%, Middle East 5.49% and Other Countries 8.99%.59 Exports to countries
like Libya, Reunion islands, Australia, Puertorico, Dominican Republic, Kenya,
Tanzania, Ukraine, Brazil registered a positive growth. Details of major region
wise marine products export are given in the table 3.9.
58. www.mpeda.com/inner_home.asp?pg=publications/exportreview/trends.htm
59. Ibid.
97
TABLE 3.9
MAJOR REGION WISE MARINE PRODUCTS EXPORT
Country Share % QV$ 2009-10 2008-09 Variation (%)
Japan 9.24 Q: 62690 57271 5419 9.46
12.83 V: 1289.58 1234.04 55.56 4.50
13.06 $: 278.58 278.62 -0.05 -0.02
USA 4.93 Q: 33444 36877 -3433 -9.31
10.08 V: 1012.52 1021.55 -9.03 -0.88
10.01 $: 213.52 227.29 -13.76 -6.06
European Union 24.29 Q: 164800 155161 9638 6.21
29.99 V: 3013.33 2854.07 159.27 5.58
29.89 $: 637.40 635.34 2.06 0.32
China 21.27 Q: 144290 147312 -3023 -2.05
17.82 V: 1790.89 1296.39 494.50 38.14
17.80 $: 379.70 281.90 97.79 34.69
South East Asia 22.01 Q: 149353 88953 60400 67.90
14.72 V: 1479.55 873.09 606.46 69.46
14.76 $: 314.85 191.08 123.77 64.78
Middle East 5.15 Q: 34907 27177 7730 28.44 5.51 V: 553.55 475.72 77.83 16.36
5.49 $: 117.05 105.20 11.85 11.26
Others 13.11 Q: 88953 90083 -1130 -1.25
9.05 V: 909.11 853.11 56.00 6.56
8.99 $: 191.77 189.22 2.55 1.35
Total 100 Q: 678436 602835 75601 12.54 100 V: 10048.53 8607.94 1440.59 16.74
100 $: 2132.84 1908.63 221.21 11.75 Source: www.mpeda.com/inner_home.asp?pg=publications/exportreview/trends.htm Q: Quantity in MT, V: Value Rs. Crore, $: US Dollar in Million
Major Port wise Marine Products Exports
Exports were effected from 19 Sea/land/air ports. The major ports
in the order of US $ earnings were Pipavav (16.94%) Kochi (15.61%), JNP
(15.54%). Chennai (13.03%), Vizag (9.34%), Calcutta (8.82%), Tuticorin
(6.81%), Mumbai (4.59%), Mangalore (.4.01%).60 Ports like Pipavav, JNP,
Chennai, Kolkatta, Mumbai, Mangalore, Goa, Ahemedabad, Trivandrum and
Agarthala have shown an increase in the exports compared to the previous year
while ports like Vizag, Tuticorin, Hill Land Customs, Karimganj showed a
60. www.mpeda.com/inner_home.asp?pg=publications/exportreview/trends.htm

98
declining trend. Export from Kochi port showed an increase in quantity as well
as in rupee realization where as there was a decline in US $ terms by 0.69%.
Export from Mundra port also showed an increase in terms of quantity and rupee
value however there was a short fall in US $ realization. There was no export
from ports like Kandla, NSICT and Port Blair. Details of port wise export are
given in the Table 3.10.
TABLE 3.10
MAJOR PORT WISE MARINE PRODUCTS EXPORTS
Ports Share (%) 2009-10 2008-09 Variation (%) Pipavav Q: 26.83 182052 163866 18186.02 11.10
V: 16.66 1673.74 1408.35 265.40 18.84
$: 16.94 361.21 307.69 53.52 17.39
Kochi Q: 15.37 104281 98537 5743.73 5.83
V: 15.69 1576.19 1504.98 71.20 4.73
$: 15.61 333.02 335.35 -2.33 -0.69
JN Port Q: 19.06 129318 126853 2465.68 1.94
V: 15.57 1564.42 1487.28 77.14 5.19
$: 15.54 331.46 329.52 1.94 0.59
Chennai Q: 6.78 45991 39043 6947.93 17.80
V: 13.08 1314.10 1078.44 235.67 21.85
$: 13.03 277.80 240.80 37.00 15.37
Vizag Q: 4.70 31863 32277 -413.73 -1.28
V: 9.39 943.29 897.93 45.37 5.05
$: 9.34 199.24 199.85 -0.61 -0.31
Calcutta Q: 6.91 46901 33625 13275.63 39.48
V: 8.88 892.48 720.36 172.12 23.89
$: 8.82 188.10 159.96 28.14 17.59
Tuticorin Q: 4.10 27782 29354 -1571.80 -5.35
V: 6.83 686.45 693.76 -7.32 -1.05
$: 6.81 145.22 153.59 -8.38 -5.45
Mumbai Q: 0.35 2349 2319 30.19 1.30
V: 4.60 462.67 176.56 286.11 162.04
$: 4.59 97.97 38.60 59.38 153.83
Mangalore Q: 8.70 59000 33083 25917.07 78.34
V: 3.98 400.33 238.44 161.89 67.89
$: 4.01 85.43 52.81 32.62 61.78
Others Q: 7.21 48899 43878 5021 11.44
V: 5.32 534.86 401.84 133.02 33.10
$: 74.92 113.38 90.46 22.92 6.05
Total Q: 100 678436 602835 75600.73 12.54 V: 100 10048.53 8607.94 1440.59 16.74 $: 100 2132.84 1908.63 224.21 11.75
Source: www.mpeda.com/inner_home.asp?pg=publications/exportreview/trends.htm
Q: Quantity in Tons, V: Value in Rs. Crores, $: USD Million

99
Major items wise Marine Products Export
Frozen shrimp
The foundation for the exports of frozen marine products, which is
a revolutionary milestone in the history of marine products exports of India. The
present status of the marine products exports of India is a tribute to his vision and
the pioneering start he gave to the marine products export sector. Frozen shrimp
continued to be the major export item accounting for 41.40% of the total
US$ earnings. Shrimp exports during the period increased by 3.58%, 10.65% and
5.21% in quantity, rupee value and US $ value respectively. There is a slight
increase in unit value realization of 1.57%.
Fish, the principal export item in quantity terms and the second
largest export item in value terms, accounted for a share of about 38.47% in
quantity and 20.21% in US $ earnings. There is an increase of value realisation
of Ribbon fish inspite of the short fall in quantity by 12.45%. There was also
good landing of Leather Jacket. Frozen mackerel, Anchovy, Kati fish etc. also
showed a positive growth where as Tuna export has considerably decreased, Fr.
Cuttlefish recorded a growth of 25.13%, 21.39% and 16.30% in quantity, rupee
value and dollar terms respectively. However, there is a decline in the unit value
realization (7.06%). Items like dried items, live items and chilled items also
showed a substantial growth compared to previous year. Export of Fr. Squid
showed an increase in quantity but there is a fall; in rupee & US dollar
realization. Unit value realization also declined by 13.95%.61 Export of Live
61. www.mpeda.com/inner_home.asp?pg=publications/exportreview/trends.htm

100
Lobster, Live crab and Baigai showed an increase in exports where as the export
of Ornamental fish showed a decline in US $ terms. The major item wise marine
products export present shown Table 3.11.
TABLE 3.11
MAJOR ITEM WISE MARINE PRODUCTS EXPORTS
ITEMS Share (%) 2009-10 2008-09 Variation (%) Frozen Shrimp 19.24 Q: 130553 126039 4513.66 3.58
41.62 V: 4182.35 3779.80 402.56 10.65
41.40 $: 883.03 839.28 43.75 5.21
Frozen Fish 38.47 Q: 260979 238544 22435.60 9.41
20.23 V: 2032.33 1722.34 309.99 18.00
20.21 $: 430.94 375.24 55.70 14.84
Fr Cuttle Fish 9.36 Q: 53504 50750 12754.88 25.13
9.19 V: 923.83 761.05 162.78 21.39
9.18 $: 195.69 168.27 27.42 16.30
Fr Squid 9.06 Q: 61445 57125 4319.15 7.56
6.20 V: 622.63 632.35 -9.71 -1.54
6.20 $: 132.24 142.87 -10.63 -7.44
Dried Item 6.94 Q: 47053 31688 15364.71 48.49
9.76 V: 981.11 420.75 560.36 133.18
9.79 $: 208.72 92.51 116.20 125.61
Live Items 0.81 Q: 5492 3434 2058.27 59.93
1.39 V: 139.14 99.00 40.14 40.55
1.38 $: 29.52 21.82 7.69 35.24
Chilled Items 4.25 Q: 28817 21453 7363.60 34.33
2.63 V: 264.49 217.34 47.15 21.69
2.62 $: 55.87 48.39 7.48 15.46
Others 11.88 Q: 80592 73801 6790.85 9.2
8.98 V: 902.84 975.33 -72.68 -7.45
9.23 $: 196.84 220.24 -23.40 -10.62
Total 100 Q: 678436 602835 75600.73 12.54
100 V: 10048.53 8607.94 1440.59 16.74 100 $: 2132.84 1908.63 224.21 11.75 Source: www.mpeda.com/inner_home.asp?pg=publications/exportreview/trends.htm Q: Quantity in MT, V: Value Rs. Crore, $: US Dollar in Million
Frozen shrimp was the single largest item of export accounting for
51.70% in the total export value for the year 2010-11. Fish, the principal export
item in quantity terms and the second largest export item in value terms,
101
accounting for a share of about 30% in quantity and 14.24% in US$ earnings,
showed a decline of 16.48% in quantity terms and a decline of, 12.64% and
7.25% in rupee and US$ value realization respectively.62
Marine Fishing Industry
Marine Global Fishing Industry
The fishing industry includes any industry or activity concerned
with taking, culturing, processing, preserving, storing, transporting, marketing or
selling fish or fish products. It was defined by the FAO as including recreational,
subsistence and commercial fishing, and the harvesting, processing, and
marketing sectors. The commercial activity is aimed at the delivery of fish and
other seafood products for human consumption or as input factors in other
industrial processes. Directly or indirectly, the livelihood of over 600 million
people in developing countries depends on fisheries and aquaculture.
The practice of fishing has a very long history. It was mentioned
in ancient texts such as the Bible, and it is likely and almost certainty that it
predated biblical times by many centuries. However, while there were plenty of
fish when there were only a few million people on Earth, and there were few
dangers related to over-fishing, we are struggling with a global population of
many billions of people now. Considering this, how long can the fishing
industries are sustained.63
62. Annual Report ,2010-2011, Department of Commerce ,Ministry of Commerce and Industry, Government of India, Udyog Bhawan, New Delhi 110 107, INDIA, http://commerce.nic.in/publications/anualreport_chapter9-2010-11.htm
63. Daman Prakash http://www.mendeley.com/research/global-fisheries-brief-review

102
Marine Fishing Industry in India
Fishing in India is regarded as a flourishing industry. This industry
is still in a primitive stage in the country as it suffers from various tropical
climatic changes. In India, fishing is considered as a bright and prosperous
industry. With short supplies of fish on land, India looks to the sea that holds
huge promise and it can supply vast quantity of fish. Fish is a rich source of high
grade proteins. Fish oil industry is still in infancy and exports of marine products
and overall growth of fishing industry have increased tremendously over the past
few years. It was quite surprising that fishing industry in India is almost in a
primitive stage in spite of having a really long coastal line of near about 6100
kms and a broad continental shelf particularly in several parts along the West
Coast. Another probable reason is that modernisation on a limited scale began
after the independence of the country.64
Capacity of Indian Marine Industry
The marine products industry has a capacity to process 14,000
tonnes of fish a day (mostly for freezing), but about 80 per cent of the capacity is
not being used currently. This is because of two reasons. First, sea catch is
stagnating. Second, the capacity is built to process peak catch. India has 409
modern freezing plants, of which 221 are approved by the European Union. In a
bid to utilise the capacity, marine exporters want procedures eased for importing
fish for processing and onward exports. Table 3.12 presents the built up capacity
of the Indian marine products export industry.
64. Ibid.

103
TABLE 3.12
CAPACITY OF THE INDIAN MARINE PRODUCTS EXPORT
INDUSTRY
Name of the State
No. of Exporters
No. of Process Plants
Freezing Capacity (Ton.p/d)
No. of Cold
Storages
Storage Capacity
No. of Fishing Vessels
Kerala 287 124 1585.77 169 23086.50 2963
Tamil Nadu
202 48 524.55 67 5900.00 1562
Karnataka 43 14 186.40 26 3540.00 3226
Andhra Pradesh
95 52 779.50 53 7200.00 717
Goa 9 7 104.00 9 1275.00 420
Gujarath 64 55 2216.03 57 22925.00 426
Orissa 30 21 220.00 20 2460.00 414 Maharastra 268 41 1327.11 39 19372.00 2932
West Bengal
99 37 340.00 30 3500.00 0
Delhi (UT) 92 -- 0.00 1 15.00 0
Source: Marine Product Export Development Authority, 2007, Kochi.
India is the third largest fish-producing nation in the world,
exporting to 73 countries. It has the potential to grow further in view of the
growing demand in trading blocks such as the European Union, United States,
Canada and Middle East. There has been huge transformation in the Indian
marine industry over the last few years many of which have not been highlighted
or marketed in the international area. In 1997 the EU banned Indian marine
products, citing lack of hygienic and phytosanitary measures in the industry, this
was a landmark as thereon India has come a very long way. The challenge was on
and India spearheaded quality control and HACCP was put into place. Today we
have excellent facilities, competitive labour and our infrastructure is catching up
fast.65
65. Report,2008,The Seafood Exporters Association Of India, 'Seafood House', Willingdon Island, Cochin - 682 003, Http://Www.Seai.in

104
Indian Marine Products Market Structure
Before 1960, the markets of Indian marine products were largely
confined to neighboring countries like Sri Lanka, Myanmar (formerly Burma),
Singapore etc. when our exports were dominated by dried items. This situation
changed with the development of technology/modernization; dried products gave
way to canned and frozen items. The product shift also resulted in market shift.
More sophisticated and affluent markets viz. Japan, USA, Europe, Australia, etc.
became our important buyers. Several marine products processing units with
modern machinery for freezing and production of value added products were set
up at all important centers in the country for export processing.
For a long time USA was the principal buyer for our frozen
shrimp but after 1977, Japan emerged as the principal buyer of the product,
followed by the West European countries. Japan retained its position till 2001-02
as the single largest buyer for our marine products accounting for about 31% in
the total export value. During the year 2002-03 and 2003-04 USA emerged as
the single largest market for our marine products. During the year 2004-05,
the European Union has collectively become the largest importer of Indian
marine products and it retained its position since 2005-06. During 2008-09
European Union (EU) continued as the largest market with a percentage share of
32.6% in $ realization followed by China 14.8%, Japan 14.6%, USA 11.9%,
South East Asia 10%, Middle East 5.5% and Other Countries 10.6%. May be due
to the prevailing economic recession export to EU, USA and Japan declined

105
6.08%, 10.18% and 8.80% respectively, all other countries increased their import
of marine products from India during the year.66
Marine Fisheries in Five Year Plan Period
Fisheries development and planning is undertaken through the
Five-Year Plans formulated by the government since 1951. The initial Five-Year
Plans, starting from the 1950s, focused more on the ‘development’ of the sector,
and on increasing production, while it was only in the Ninth and Tenth Five-Year
Plan period that the need for conservation and management was explicitly
recognized. To meet the increasing demand for fish for food and non-food uses,
the 10th Five Year Plan envisages increased fish production from 6.2 million tons
in 2002-2003 to 8.2 million tons by the end of plan period (2006-2007). This
could be achieved through focusing efforts on sustaining gains already made in
production; protecting the productivity of inland and marine fisheries, increasing
production through expansion of area and new technical breakthroughs, adding
value to the produce and ensuring quality and creating increased livelihood
venues through remunerative and assured marketing opportunities.67
Eleventh Five Year Plan period (2007-2012) enhanced the
production of fish from Indian waters on an environmentally sustainable and
socially equitable basis, Address the hitherto unexplored potentials of Indian
fisheries like island fisheries and non-food fisheries, Conservation of aquatic
resources and genetic diversity, preservation of health of ecosystems, increasing
profitability of fishers and aqua-farmers through an integrated approach from
66. www.mpeda.com/inner_home.asp?pg=publications/exportreview/trends.htm
67. Fish For All - Recommendation and Action Plan Kolkata, West Bengal, 18-19 December 2003.

106
production to consumption, promoting fish as health food and meeting the
changing requirements of both domestic and export markets, strengthening of
infrastructure in harvest, post-harvest, value-addition and marketing and
upliftment of fishers and aqua-farmers communities with gainful employment
opportunities and capacity strengthening.68
Fisheries Legislation in India
The backdrop of fisheries legislations enacted in India traces back
to 1857, when The Indian fisheries Act was endorsed. It was meant to regulate
reverence fisheries and fisheries in inshore waters, to prohibit the use of poisons
and dynamite in fishing, and to protect fish resources in selected waters through
regulation of, among other things, the erection and use of fixed engineers the
construction of weirs, the use of nets of certain types and dimensions69.
The present day scenario is governed by various sets of
enactments essentially having bearing on the marine fisheries sector. These
legislations include Maritime Zones Act (1976) which recognizes the sovereign
rights to conservation and management of living resources in the Indian EEZ, in
addition to their exploration and exploitation. Another important reulation
goverming the marine fisheries is Maritime Zones of India (Regulation of Fishing
by Foreign Vessels) Act (1981) and Rules (1982). Fisheries within the 12-mile
territorial limits are managed under the Marine Fishing Regulation Acts
(MFRAS) of the maritime States of India. The main emphasis of MFRAS is on
regulating fishing vessels in the 12-nautical mile territorial sea, mainly to protect
68. http://www.ncscm.org/sicom/costal-fishing.htm
69. Sathiadhas.R, 2005, Policy Issues for Marine Fisheries Management in India, The seventh Indian Fisheries Forum Proceedings, University of Agricultural Sciences, Bangalore, p.349.

107
the interests of fishermen on board traditional fishing vessels. Thus, the Act has
been mainly used for the purpose of maintaining law and order at sea. The
MFRAS were encated only for regulation of fishing vessels along only for
regulation of fishing vessels along the coastline of the state, the Gujarat MFRA
provides for protection, conservation and development of fisheries in inland and
for regulation of fishing in the inland and territorial waters of the state of Gujarat
and for regulation of fishing in the inland and territorial waters along the
coastline of the State.
The Coastal Regulation Zone Protection Act, (1986) outlines a
zoning scheme to regulate development in a defined coastal strip. The
Notification defines the coastal stretches of seas, bays, estuaries, creeks, rivers
and backwaters which are influenced by tidal action in the landward side, up to
500 m from the high-tide line (HTL) and the land between the low-tide (LTL)
and the HTL, as the CRZ. The Environment Protection Act, (2002) authorizes the
Central government to protect and reduce pollution from all sources, and prohibit
or restrict the setting and/or operation of any industrial facility on environmental
grounds.70 The Biological Diversity Act (2002) provides for the conservation of
biological diversity, the sustainable use of its components and, significantly, the
fair and equitable sharing of the benefits arising out of the use of biological
resources, knowledge and related matters.
Marine Fishing policy enables sustainable and responsible
fisheries in addition to tapping the opportunities in domestic and export market.
70. Sathiadhas, R., 2005, Policy Issues for Marine Fisheries Management in India, The seventh Indian Fisheries Forum Proceedings, University of Agricultural Sciences, Bangalore, p.350.
108
The Marine Fishing Policy of 2004 delineates ‘Territorial Waters’ as the subject
of maritime states. Fisheries beyond this limit fall under the purview of the
‘Exclusive Economic Zone’. The Central Government provides financial
assistance under the central sector schemes and sponsored schemes for fisheries
sector.
In India, hardly 14 per cent of the active fishermen in the marine
fisheries sector have ownership on craft and gear in 2004 and another 3 per cent
possess only gears. The proportion of owner operators in marine fisheries
declined over the years with the increasing capital requirement for possessing
motorized and mechanized fishing units. In the mechanized sector, 12per cents,
motorized sector 9 per cent have ownership on crafts and gears71. Most of the
non-motorised units are operating as family enterprises, not even realizing the
operating cost of the labourers. Lack of finance and credit facilities does not
allow these fishermen to go for modernization an come out of the vicious circle
of poverty and low-income trap.
Disguised unemployment and diminishing returns: During 2003-
2004, 12.20 lakh people are employed in active fishing in the primary sectory and
another 15 lakh in the pre and post-harvest sector in the secondary sector in the
secondary sector and one lakh people employed in the tertiary sector.
It is estimated that about 18to20 million people in India are
depending on marine fisheries sector for their livelihood. The proportion of catch
by mechanized sector as a whole increased from 40 per cent during 1980 to 68
71. Sathiadhas, R., 2005, Policy Issues for Marine Fisheries Management in India, The seventh Indian Fishereis Forum Proceedings, University of Agricultural Sciences, Bangalore, p 351.

109
per cent in 1997 and again declined to 66 per cent in 2003. At the same time, the
number of active fishermen depending on mechanized fisheries increased from
1.14 lakh to 2 lakh and again increased to 4.1 lakh respectively during the same
period. It should be noted that the annual per capita production of active
fisherman during the period has increased from 5260kg in 1980 to 8130kg in
1997 and drastically declined ot 4175 kg in 2003.72 This clearly indicates the high
prevalence of disguised unemployment in the mechanized fisheries sector. The
pressure for employment in active fishing is increasing more than proportionate
to the harvestable yield in the open access marine fisheries. The fishermen
involved in active fishing is more than the absorbing capacity of the fisheries
sector and has led to lower per capita production, increased pressure on fishing
which results in juvenile fishing, large level discards and thus ultimately causing
serious threats to resource sustainability and environmental stability.
Employment in fisheries sector has undergone rapid structural
changes during the last few decades. Among those engaged in the mechanized
sector, 75% work in trawl fisheries and the rest 25% in other sectors. In the case
of motorized sector, 50% are engaged in ring seine fishery alone. There is a wide
disparity in income between those engaged in different sectors. The number of
annual fishing days per worker reveals that the level of employment for hired
labourers as well as those not having sufficient equipment is low and they are
very much underemployed. The seasonal nature of fishery and the risk and
72. Sathiadhas.R, 2005, Policy Issues for Marine Fisheries Management in India, The seventh Indian Fishereis Forum Proceedings, University of Agricultural Sciences, Bangalore, p.352.

110
uncertainties associated with marine fishing entangled the fishermen in the low-
income trap.
The current scenario of marine fisheries in terms of fishing fleets
clearly indicates a situation of “too many boats chasing too few fishes”.
Overcapitalization in the mechanized sector and under employment in non-
mechanized sector is rampant issues, which creates regulatory, and conservatory
problems for sustainable production on one hand and socio-economic problems
on the other. The continuous changes and up gradation of existing fishing
technologies not only increase the efficiency of craft and gears but also
marginalize the fisherfolk who are not able to cope up with the changes.
Similarly in motorized sector technological upgradation in the form of size of the
net and boat has increased over the years. Boats fitted with 2-3 OB engines are
very common which enhanced their mobility and fishing capabilities. In the
mechanized sector expanded fishing activities with extended fishing days of even
more than five days per trip is very common. Whit this acute competition, both
inter and intra sectoral level has marginalized a number of fishermen who are
depending on labour intensive technologies for their livelihood.
Marine Fisheries Rules and Regulation
The operation of foreign fishing vessels in Indian EEZ is regulated
under provisions of the Maritime Zones of India (Regulation of fishing by foreign
vessels) Act, 1981 and Rules there under. Besides restricting fishing operations in
certain areas such as shrimp grounds in the Sandheads and off Quilon, the rules in
general restrict the fishing beyond 12 nautical miles along the east coast and 24
nautical miles along the west coast. In the case of territorial waters the fishing
111
activity is regulated by the respective maritime state governments under marine
fisheries regulation acts or by executive orders. The states of Maharashtra,
Karnataka, Kerala, Tamil Nadu, Orissa, Goa, Andhra Pradesh, west Bengal and
the Union Territories of Pondicherry have enacted Marine Fishing Regulations
Acts.
Fishing Policy
The new policy on deep sea fishing has been announced in March,
1991, which involves three new schemes namely leasing of Foreign Fishing
Vessels for operation in the Indian EEZ, Test Fishing by engaging foreign fishing
vessels and Joint Ventures between Indian and foreign companies in deep sea
fishing, processing and marketing. The salient features of the policy are as
Leasing of foreign fishing vessels like Long terms leasing of foreign fishing
vessels for operation in Indian Waters will be allowed in terms of the Maritime
Zones of India Rules, 1982, Leased vessels should be preferably new. However,
second hand vessels also will be taken on lease subject to satisfactory
performance of the vessels. Test fishing will be governed by the provisions of
Maritime Zones of India Act, 1981, Merchant Shipping Act, 1958 and the
Maritime Zones of India Rules 1982’ (as amended from time to time) and the
broad guidelines specified herein. All data generated including details of
operations during test fishing will be made available to the Marine Products
Export Development Authority (MPEDA) and the Fishery.73
73. www.mpeda.com
112
New Marine Fisheries Act
Marine Fisheries (Regulation and Management) Act 2009 contains
‘hidden ideas' of granting permission to foreign vessels to conduct industrial
fishing in Indian seawaters. The industrial fishing in any part of the world had
caused depletion of fish which is evident in Somalian seashores and the proposed
Act did not ensure the livelihood security and moreover the stakeholders also get
affected. In a memorandum submitted to the Union Agriculture Minister, the
Association pointed out that the proposed Act ignores the basic idea that
seawaters is for the betterment of the fishing folk in India, who entirely depend
on it for their livelihood. The Act did not envisage a pricing mechanism; helpful
to the fishermen for the catch they bring ashore even if the resources are meant
for exports or domestic consumption. Though it is a state subject, the scope of the
state to interfere is not streamlined in the Act.74
The Regulation of Foreign Vessels Act, 1981, has strictly
restricted the entry of foreign vessels into Indian seawaters. But its usurpation
goes uninterrupted. If this violation goes on unhindered, the Association feared
that the enactment of new law would not deter them as it all matters on
enforcement. Besides, the Murari Committee is vehemently categorical in barring
the entry of industrial fishing. Foreign industrial fishing vessels and the Indian
fishing boats are treated alike in the proposed Act in the matter of licensing. The
stark difference of the profit-making and livelihood making is not differentiated
and the right of the citizens.
74. Sajeev Kumar, 2010, Kochi, http://www.thehindubusinessline.com/2010/02/11/stories/ 2010021152751900. htm

113
Foreign Trade Policy Measures in India
In the wake of global economic slowdown, India’s merchandise
exports faced significant adverse impact. Exports, which had grown by 48.1%
during April to September, 2008, suffered a decline during the next 12 months
from October, 2008 to September, 2009, due to the shrinkage of the demand
worldwide and particularly the contraction in demand in the traditional markets
of our exports. In May, 2009, the exports declined by as high as 34.2% in US$
terms. The downward trend was arrested from October, 2009 onwards and our
exports ended up with an export figure of US$ 178.75 billion in 2009-10 against
US$ 185.30 billion in 2008-09, which indicates an overall decline of 3.5% in
dollar terms. The growth in exports since October, 2009 can be attributed to
growth in some sectors, but is primarily due to the lower base effect of the
exports in the corresponding months of previous financial year. This year, exports
have registered a growth of about 27% in US$ terms and it is expected that we
exceed the merchandise export target of US$ 200 billion by the end of 2010-11.75
The Foreign Trade Policy (FTP), 2009-14 was announced on 27th
August, 2009 in the backdrop of a fall in India’s exports due to global slowdown.
The immediate and the short term objective of the policy was to arrest and
reverse the declining trend of exports as well as to provide additional support
especially to those sectors which were hit badly by recession in the developed
world. The Policy envisaged an annual export growth of 15 per cent with an
annual export target of US $ 200 billion by March 2011 and to come back on the
high export growth path of around 25 per cent per annum in the remaining three
75. http://www.tradechakra.com/indian-economy/exports/index.html

114
years of this Foreign Trade Policy i.e. up to 2014. The long term policy objective
for the Government is to double India’s share in global trade by 2020. Problems
relating to various provisions of exim policy were taken up with DGFT whenever
larger interests of marine products exporters are affected.
As an immediate relief, the Government provided a policy
environment through a mix of measures including fiscal incentives, institutional
changes, procedural rationalisation, and efforts for enhanced market access across
the world and diversification of export markets. Towards achieving these
objectives, several steps were announced in the Policy. Some of the important
steps included addition of new markets under the Focus Market Scheme,
coverage of Africa, Latin America and large part of Oceania under Focus Market
Scheme (FMS) and the Market Linked Focus Product Scheme (MLFPS), increase
in incentives available under the Focus Market Scheme from 2.5% to 3% and for
Focus Product Scheme (FPS) and MLFPS from 1.25% to 2%, introduction of
EPCG Scheme at zero duty for specified sectors, and the grant of additional duty
credit scrip to status holders.
Thereafter, as promised in FTP, to continue regular interaction
with stakeholders to maintain a close watch on the performance of the policy in
the field, a number of interactions were held with members of Board of Trade,
Open Houses with exporters and sectoral reviews with EPCs. Constant dialogues
were held with all key stakeholders in industry and the exporting community for
sectoral assessment of exports at regular intervals.
The recovery has been fragile and economies around the world are
still emerging out of the shadows of a grim recessionary period. The IMF

115
projections indicate that the world economy is recovering at varying speeds for
different regions. Though, there had been marginal improvement in some of the
developed economies like US, UK, Germany, France, Japan etc., the nervousness
continued in the markets about the fiscal situation and sovereign indebtedness in
several high income countries of Europe. In this setting, it was expected that the
developed countries would aim at economic recovery through consolidation and
export led growth, which would pose a challenge to Indian exporters in accessing
overseas markets for their products. The uncertainty surrounding Indian
exporters’ prospects, therefore, continued to linger. Though the exports growth
moved towards the positive trajectory from October, 2009 onwards, our exports
were not yet out of the woods.
Under this global situation of slow recovery, it was necessitated to
take stock of the situation so as to make mid course corrections. Accordingly,
sectoral reviews were continued in the current financial year 2010-11, and the
first such review for 2010-11 was undertaken in July 2010. It was observed that
despite the measures announced in the FTP and additional support extended in
January and March, 2010, some sectors continued to face difficulties. It was also
realized that there was a shroud of uncertainty continuing over the fragile nature
of global economic recovery. Even as global economic rebalancing had been
proceeding apace, it was not going to be an easy patch for Indian exporters. In
view of resource constraints, it was not simply possible to sustain support to all
sectors and there was need to calibrate the support measures appropriately.
On the other hand, exports of certain products had been placed
under restriction in view of domestic situation i.e. inflationary pressures and

116
unemployment. It was also essential to be conscious of the need for and the
inevitability of fiscal consolidation. Keeping all these factors in mind and based
on the sectoral review held in July, 2010, need based additional initiatives were
undertaken in the Annual Supplement 2010-11 to FTP 2009-14, announced on
23rd August, 2010. While emphasis on stability of policy regime was continued,
additional measures were announced to support exports particularly for the labour
intensive sectors. In order to promote technological up gradation, zero duty
EPCG and Status Holder Incentive Schemes were expanded and validity
extended. It will add to expansion and modernisation of production base at a time
when investment is drying up in export industry.
Trade policy measures taken by the Government and the RBI this
year focused on mitigating the adverse impact of the global recession on the
Indian economy and on checking inflation. In addition to the three stimulus
packages announced in 2008-09, measures by the RBI and the Government in the
Union Budget 2009-10 and 2010-11 and the Foreign Trade Policy (FTP), 2009-
14, announcements made in January, 2010, additional measures were taken in
March, 2010, the Annual Supplement to FTP released in August, 2010 and the
measures announced on 11th February, 2011, to help the export sector in general
and the employment intensive sectors affected by the world recession, in
particular.76
International Trade Organizations
International trade has assumed paramount importance in world
76. Annual Report 2010-11http://commerce.nic.in/publications/anualreport_chapter3-2010-11.htm

117
economy since the formation of WTO followed the marathon GATT Uruguay
Round talks. Almost all countries, including many who had hitherto taken an
autarkic stance, have been drawn into the vortex of world trade, thus ensuring
that the slightest ripple in the farthest corner of the globe has some effect in our
country, or, for that matter, all countries. Hence, it is time to take stock of the
situation, now that the WTO has completed a good seven and a half years, to
have an estimate of how India has fared in the new regime of decreasing tariffs
and vanishing quotas, and to attempt to divine what the future has in store for us.
To achieve this end, it is necessary to bring together brilliant minds concerned
with international trade, so that a fruitful exchange of seminal ideas can apprise
us of where India actually stands, what lies on her road ahead, and what should
be done so that she embarks upon a comfortable journey to prosperity.77
General Agreement on Tariffs and Trade (GATT)
The General Agreement on Trade and Tariff (GATT) was set up
on October 30, 1947 in Geneva with 23 countries as its founder members, and
India was one of them. It was originally set up as a temporary arrangement to
bring about trade liberalisation. India has always been an active champion of
multilateral trade negotiations. GATT later became an important and permanent
set-up to attend to all trade issues among member countries. Its membership also
got enlarged to practically all the members of the United Nations, except the
communist countries and East European countries.78
77. Research Paper, "Post-WTO trade Scenario- An Indian Perspective" on 8th and 9th November, 2002 at Darbar Hall, Great Eastern Hotel, Kolkata, http://www.dgciskol.nic.in/
78. http://www.indiaagronet.com/indiaagronet/Fisheries/Fisheries.htm

118
From 1947 to 1967, GATT sponsored six rounds of multilateral
trade negotiations mainly with a view to bring down the trade barriers by
persuading countries to bring down their import levies with a view to greater
exchange of goods and more trade flow. The sixth round brought the weighted
average tariff of major trading nations to be reduced by 2% on raw materials and
7.7% on industrial products. GATT played a prominent role in the settlement of
trade disputes between two countries. The Uruguay Round, terminated in
Marrakesh in 1994, has been the 8th Round, and it is the last GATT Round. The
next Round, which could be (though that seems highly unlikely), launched at the
next WTO Ministerial Conference, to be held in Singapore in December 1996,
will be the first WTO Round.79
World Trade Organization (WTO)
The World Trade Organisation (WTO) is an international
organisation dealing with the rules of trade between nations. There are a number
of ways of looking at the WTO. It is an organisation for liberalising trade, a
forum for governments to negotiate trade agreements and a place for them to
settle trade disputes. The WTO came into force on 1 January 1995, but its trading
system is half a century older. Since 1948, the General Agreement on Tariffs and
Trade (GATT) had provided the rules for the system. The WTO has 148
members, together accounting for 90 percent of world trade.80
Almost six years have elapsed since various trade agreements
were signed under the auspices of World Trade Organization (WTO, 1995). One
79. http://www.wto.org/report/paper 287
80. http://www.wto.org.
119
agreement considered most effective in reforming food and agricultural sector
was the Agreement on Agriculture (AoA). The essence of AoA liberalization was
that markets should be distortion-free, a standard thinking in neoclassical
economics. AoA translated this thinking by aiming for improving market access
and export competition and reduction in domestic support. This in-turn was to be
achieved through tariffication of quantitative restrictions, and time-bound
reduction in existing tariffs, export subsidies and domestic support. An important
assumption in the neoclassical thinking is that there is complete information in
the markets and elimination of tariffs and subsidies will lead to free trade among
nations.
However, markets are not characterised by complete information
preventing a smooth and distortion-free trade. This aspect is extremely important
in the global trade in food products. Traditional economics textbooks cite food
and agricultural markets/products as examples of perfectly competitive markets
with homogeneous products; however, nothing can be farther from the truth.
Individual food products are not homogeneous across countries; different
countries and firms adopt different performance standards and safety and quality
norms; and, moreover, buyers cannot ascertain quality of food products merely
by physical inspection. As a result, AoA by itself cannot guarantee removal of all
barriers to trade. Two other WTO agreements address this concern. They are:
Agreement on Sanitary and Phytosanitary Measures (SPS) and Agreement on
Technical Barriers to Trade (TBT).81
81. http://www.wto.org.article/ 25/eto

120
Legal and Economic Approaches of the WTO
Economic analysis which focuses on the gains for the country
itself suggests that, under conditions which are likely to be the most frequent, a
country should not hesitate to adopt unilaterally a free trade policy. By doing so,
the country will improve its welfare with respect to the situation with no
international trade (autarky) or less trade. The tremendous success of WTO has
been due to the fact that it has been able to combine both the legal and economic
aspects in a mutually acceptable way. As underlined in the comments about
section 11.2.1, the basic WTO principles do not impose any constraint on the
level of protection: they do not impose a free trade view. The founding fathers of
the GATT-WTO were intimately convinced about the value of free trade, but
they were also politicians good enough to know the power of politics of
protection at home.
Without the capacity to impose free trade to countries unwilling to
follow this policy by their own will, the WTO has been able to succeed only
because it has been able to improve transparency. Countries have progressively
realized the costs of their own protectionist policies for their own consumers -
individual consumers or industrial users. By doing so since 1947, the WTO
liberal approach has favoured a steady movement towards freer trade on a
multilateral basis. Tariffs on industrial goods have been reduced from 45 to 4
percent by OECD countries which have participated to the GATT-WTO process
since the start. In a nutshell, the WTO is not done for "virtuous" (or lucky)
governments which can follow a freer trade policy without strong opposition
from domestic vested interests. Rather, the WTO is an institution which is useful

121
for "normal" governments struggling with strong vested lobbies on the road to
freer trade and which need help from their fellow governments facing the same
ordeal. The key GATT-WTO instrument for launching and sustaining this trend
of "joint liberalization" has been Rounds of trade negotiations, where each
government trades concessions in its import regime for foreign concessions in the
foreign import regimes.
The WTO framework consists in three components. First, it is a
set of agreements dealing with a large range of topics, from agriculture to
industry and services, from intellectual property rights to trade related investment
measures, as well as dealing with special fields of concerns, such as anti-
dumping, subsidies or safeguards. Second, it is a series of Round negotiations,
leading over time to freer trade in a wider number of activities. Lastly, the WTO
is an organization, with a permanent staff of around 600-700 persons, and several
bodies, such as the Appellate Body.82
This study of the WTO has implications for the fish sector. The
most important lesson flowing from the WTO texts has already been underlined
the focus on non-discrimination is essential for political as well as economic
reasons. The second lesson comes from the Round technique, it is much easier to
get compromises when there is a large choice of possible trade-offs. In other
words, there is an incentive to integrate, more completely than before, fish and
fishery products in the general bargain of future WTO Rounds.
82. http://www.wto.org/spsfisheries repot/795
122
Sanitary & Phyto - Sanitary Measures
India is one of the world’s topmost producer of Marine Products
and posses a huge source and prospects in this trade. Seafood Processing Industry
in our country is now facing a serious threat due to poor sanitary and hygienic
practices and lack of proper infrastructure facilities. This is high time for us to
improve the sanitary and hygienic practices; otherwise we loose the export
market to a great extent because the consumer sensitivity regarding healthy and
safe food is improving day by day with the fast paced development of
technology, medicine and communication. In order to meet the SPS measures we
have to make a sea of changes throughout the entire system. Full commitment
and involvement of Management, Workforce and Government is required to get
the things happen.
Two nodal agencies for processed food exports have been
identifies in Indian at the national level. These are the Agricultural and Processed
Food Export Development Authority (APEDA) and the Marine Products Exports
Development Authority (MPEDA). While MPEDA is responsible for overseeing
all fish and fishery products exports, other processed food product exports are the
responsibility of APEDA. Given reductions in tariffs and domestic support and
expected reduction in export subsidies, increasing food product exports requires
searching for new opportunities in terms of better market access and enhanced
competitiveness in export markets.83
83. www.mpeda.org/report.
123
WTO Agreements on SPS and TBT
Trade liberalization, hoped to be achieved through WTO
Agreement on Agriculture (AoA) is expected to lead to export promotion and
import substitution opportunities for Indian food sector. However, these
opportunities cannot be exploited unless serious attention is paid to two important
WTO agreements – Agreement on Sanitary and Phytosanitary Measures (SPS)
and Agreement on Technical Barriers to Trade (TBT). Due to the ‘experience’
and ‘credence’ nature of food products, trading partners impose import
restrictions based on food safety and quality concerns. These concerns are
legitimised by SPS and TBT agreements.84 Hence, to obtain maximum possible
benefit from these agreements, India will have to improve its safety and quality
norms to match the Codex standards and participate effectively in Codex standard
setting meetings. Moreover, it must ask for substantial amendments to some of
the articles of these agreements which seem discriminatory in nature. Finally,
India will have to strengthen import monitoring mechanisms so that domestic
food and phytosanitary laws are effectively applied to imported food items.
Trade Implications of SPS and TBT
Under the auspices of WTO, SPS and TBT agreements were
signed along with many other agreements including AoA. In fact SPS and TBT
agreements have not received the kind of attention they should have from
industry and researchers alike. There is a lot of confusion regarding
understanding the difference between SPS and TBT agreements. SPS agreement
aims to protect human, animal and plant life or health from pest and diseases
84. Ibid.
124
arising out of imports of food and agricultural products. On the other hand, TBT
agreement deals with product specifications which include size, shape, weight
and packaging material requirements including labeling and handling safety.
The sanitary and phytosanitary measures that confirm to the
international standards, guidelines and recommendations will be deemed
necessary to protect human, animal or plant life or health." For food products, the
international standards, guidelines and recommendations refer to the guidelines
suggested by the Codex Alimentarius Commission (CAC). An important CAC
guideline for food processing companies is to follow a food quality management
system called Hazard Analysis and Critical Control Points (HACCP). In fact,
United States (US) and European Community (EC) have already made this
system mandatory for food processing firms. EC put a ban on imports of fish
from companies in Gujarat which did not adopt HACCP system (IE,1999).
Moreover, about 100 crores of herbal product exports from India, targeted for
1997- 98, were severely affected as US planned to impose ban on imports of
these products if they did not confirm to HACCP (EFP, 1997). Indian marine
products processors, in their bid to remain competitive in the US market, are
taking help from foreign consultants at exorbitant cost to implement HACCP in
their production units (CP, 1997).85
Hazard Analysis and Critical Control Points (HACCP)
Consequent to the promulgation of US marine products
Regulation on HACCP on 18th December 1995, it has become mandatory that
every processor and importer has to comply with HACCP with effect from
85. Ibid.
125
18.12.1997. MPEDA constituted HACCP Cell in early 1996 to assist the Indian
marine products industry for the effective implementation of HACCP. The major
activities of the HACCP Cell are organizing training programmes in HACCP
basic principles, audit etc. for the benefit of technical personnel in the marine
products industry and related departments. So far, 32 such programmes were
organized for the benefit of over 900 technical personnel. Assisting the seafood
establishments in the preparation of HACCP manual, certification of such
manuals, certification of HACCP compliance etc. So far, 26 processing
establishments in India are issued with HACCP compliance certificate by
MPEDA. Inviting Consultants from US FDA, NMFS, FAO / INFOFISH. From
time to time these facilitate in updating knowledge on HACCP and strengthen the
technical base of MPEDA and the industry. Technical personnel of MPEDA are
trained in India and abroad on various aspects of HACCP including HACCP
Audit.
Non Agricultural Market Access (NAMA)
Non Agricultural Market Access (NAMA) relates to trade
negotiations on non-agricultural or industrial products. In the NAMA
negotiations, WTO Members discuss the terms or modalities for reducing or
eliminating customs tariff and non tariff barriers on trade in industrial products.
The product coverage under NAMA includes marine products, chemicals, rubber
products, wood products, textiles and clothing, leather, ceramics, glassware,
engineering products, electronics, automobiles, instruments, sports goods and
toys. On tariffs, the negotiations take place on bound tariffs which are the
bindings taken during the negotiations at the WTO. In the NAMA negotiations

126
there are tariffs on which no bindings have been taken and these are known as the
unbound tariff lines. Based on the commitments taken by India, at the
commencement of the Doha Round in 2001, India has more than 31% of its
NAMA tariff lines as unbound.86
Non-Tariff Barriers
Non Tariff Measures (NTMs) refer to those measures on
international trade that are not in the form of a tariff or a tax. These measures
include trade related procedures such as documentation, certification and
inspections, technical regulations, standards, import related measures such as
restrictions, prohibitions, seasonal duties, tariff rate quotas, foreign exchange
controls including artificial exchange rates, public procurement practices. Certain
NTMs such as imposition of anti-dumping and safeguard duties do have the
effect of imposition of tariffs. Of course, countries tend to impose some
restrictions on imports that some measures are intended to protect human, animal
and plant life and health. These are known as Sanitary and Phytosanitary (SPS)
measures. Non Tariff Barriers (NTBs) are a sub-set of NTMs. NTBs are
considered unfair measures discriminating against imports and therefore violative
of the obligations under the Agreements of the WTO.87
Market Service and Promotional Measures
Market services and market promotion have assumed special
significance in view of the growing stiff competition from other marine products
exporting countries in all overseas markets. Consequent on the large scale
86. Annual Report 2010-11 http://commerce.nic.in/publications/anualreport_chapter8-2010-11.htm
87. Ibid.

127
development of commercial scale shrimp farming in several shrimp producing
countries in Asia and Latin America, the shrimp exporting countries are making
all efforts to maximize share in all major world markets. There is need for
stepping up of our promotional programmes in major overseas markets and
developing better rapport with trade and officials in the importing countries88
Market Diversification
Marine Sector to ensure the Imports for technological up gradation
under EPCG in fisheries sector (except fishing trawlers, ships, boats and other
similar items) exempted from maintaining average export obligation. Duty free
import of specified specialized inputs / chemicals and flavoring oils is allowed to
the extent of 1% of FOB value of preceding financial year’s export. To allow
import of monofilament logline system for tuna fishing at a concessional rate of
duty and Bait Fish for tuna fishes at nil duty. A self removal procedure for
clearance of seafood waste is applicable subject to prescribed wastage norms.
Product Development
Marine products form a considerable segment of the post-harvest
utility of marine fish resources. There has been considerable structural change in
the seafood processing and export industry for the last few years. There is a
growing demand for “ready-to-cook” or “ready to serve” type of seafood,
hygienically prepared and attractively packed convenience foods to match the
changing needs of urban population.89
88. www.mpeda.com/inner_home.asp?pg=publications/exportreview/trends.htm
89. Sathiadhas.R, 2005, Policy Issues for Marine Fisheries Management in India, The seventh Indian Fisheries Forum Proceedings, University of Agricultural Sciences, Bangalore, p.357.

128
The marine products processing and marketing has become
competitive all over the world and exporters are switching over to value addition
to increase profit. Product diversification always promotes price discrimination
and enables us to realize maximum forex earnings. It further helps us to enhance
the employment opportunities of coastal rural women. The emergence of value
added products are accelerated by the current demand pattern of the major
seafood markets in exporting. Today the affluent society is gradually shifting
towards value added products. An additional export of almost one-lakh tones of
value added products in our marine products cold easily corner about Rs.1500
crores of foreign exchange earnings and generates regular employment
opportunity of about 35000 fisherfolk.
The shift in demand towards value added products mainly in the
export markets have opened an excellent opportunity for the seafood sector that
requires to be tapped. Promotion of diversified value added products accelerates
our forex earnings in exports and provides a multiplier effect on employment
front especially for weaker sections and womenfolk. Continuing support and
adequate training to women self help groups engaged in the preparation of value
added products and marketing. The most viable alternative to maximize our forex
earnings from marine shrimp landings is to focus on export of value added ready
to eat products.
Market Access Initiative (MAI)
Under MAI scheme, financial assistance is provided for export
promotion activities on focus country, focus product basis. Financial assistance
is available for Export promotion councils (EPCs), Industry and Trade

129
Associations (ITAs), Agencies of state government, Indian commercial missions
(ICMs) abroad and other national level institutions/eligible entities as may be
notified. Financial assistance is also provided for contesting litigations in the
foreign country concerning restrictions/anti dumping duties etc. on particular
products of Indian origin, as provided under the market access initiative (MAI)
Scheme. DOC provides funds for capacity building for up-gradation of quality to
national level Institutions and EPCs to organize training programmes for the skill
improvement of the exporters for quality up-gradation, reduction in rejection,
product improvement as provided under the Market Access Initiative (MAI)
Scheme of DOC. Central Government will assist in modernization and up-
gradation of test houses and laboratories to bring them at par with international
standards.
Export Promotion Councils
There are at present eleven Export Promotion Councils under the
administrative control of the Department of Commerce and nine export
promotion councils related to textile sector under the administrative control of
Ministry of Textiles. These Councils are registered as non -profit organisations
under the Companies Act/Societies Registration Act. The Export Promotion
Councils perform both advisory and executive functions. These Councils are also
the registering authorities under the Export Import Policy; 1997-2002.These
Councils have been assigned the role and functions under the said Policy.90
90. http://www.indembassysuriname.com/export_promotion_councils.html

130
India Trade Promotion Organisation
India Trade Promotion Organisation (ITPO) is the nodal agency of
the Government of India for promoting the country's external trade. ITPO, during
its existence of nearly three decades, in the form of Trade Fair Authority of India
and Trade Development Authority, has played a proactive role in catalysing
trade, investment and technology transfer processes. Its promotional tools include
organizing of fairs and exhibitions in India and abroad, Buyer-Seller Meets,
Contact Promotion Programmes, Product Promotion Programmes, Promotion
through Overseas Department Stores, Market Surveys and Information
Dissemination.91
Development of Internal Marking System
Post-harvest fisheries activities including processing, product
development, transport and marketing provide greater employment to labour than
the harvesting sector. As the demand and price of fish keep continuously
increasing in the domestic and export markers, the opportunities for the above
activities also keep growing. Fresh fish, once inaccessible to distant locations still
a few years ago are now easily available due to the vast improvements in
handling technologies coupled with advanced transportation. However, the
infrastructure for fish marketing in India is still principally oriented towards the
export market.
Not only the export markets but also the internal marketing system
should be supported by appropriate policies reoriented from time to time
depending upon the market conditions. Not much thrust has been given on the
91. http://www.indiatradefair.com

131
development of the development of the markets and towards improving
marketing efficiency per se. The need of the hour is to develop wider perspective
from marketing angle in terms of product, price, promotion and physical
distribution with supportive factors such as market research and communication.
Policies should follow market rather than markers follow policies.92
The observation that 85 per cent of catch is channeled to the
internal marketing system and the rest exports should be restructured to give
balanced importance. Cooperative marketing should be strengthened since hardly
5 per cent of the fish in the internal marketing system is currently marketed by
cooperatives and the rest is through private marketing agencies and traders.
Thrust should be given for promoting value added products and support price for
commercially important varieties. Identifying and cataloguing of
pharmaceutically important marine products and utilization of idle capacity of
processing plants for internal marketing are viable options.
Development of Infrastructure and Marine Fisheries Information System
Infrastructure development contributes substantially to the growth
of marine fishing and growth of its ancillary sectors. The physical infrastructure
in fisheries comprises 2244 landing centres (otherwise termed as primary
markets) six major fishery harbours and 28 minor harbours. Among these landing
centres only a few have well-developed landing and berthing facilities. This acts
as an impediment since a lot of wastage occurs in handling the catches at the
92. Sathiadhas.R, 2005, Policy Issues for Marine Fisheries Management in India, The seventh Indian Fishereis Forum Proceedings, University of Agricultural Sciences, Bangalore, p 360.

132
landing centres. The fishery infrastructure for handling and processing includes
freezing plants, pre-processing centres (peeling sheds) and cold storage.93
The development of fishery sold at domestic and export markets.
The number of freezing plants increased from 264 to 372, number of ice-making
plants increased from 131 to 148 and that of registered peeling sheds from 83 to
900 during 1977-1996 periods. The increase in cold storage facilities and thrust
for preservation and quick transportation of fish improved our distribution and
marketing system.
Earlier marine fishing was closely confined to the coastal and
adjoining regions. By the mid of 1990s, it has been observed that about 50 per
cent of the fish is consumed fresh in and around producing centres, 43 per cent in
demand centres located up to a distance of 200 km from the coast and 7 per cent
goes to the centres located beyond 200 km in our internal marketing system
(Sathiadhas, et.al., 1997). The reluctance of the consumers towards iced-fish has
also changed. The extent of spoilage of fish at distribution channel has been
considerably reduced due to the intensive use of ice, technological improvements
in processing, improved transportation facilities, targeted awareness campaign
measures by state and central government agencies.94
The marine products of India have attracted many ultimately
become advantageous for the fishing community. The fisherfolk got better prices
for their catches and gained respect and recognition in society as primary for their
93. Sathiadhas.R, 2005, Policy Issues for Marine Fisheries Management in India, The seventh Indian Fisheries Forum Proceedings, University of Agricultural Sciences, Bangalore, p 361.
94. Sathiadhas.R, 2005, Policy Issues for Marine Fisheries Management in India, The seventh Indian Fishereis Forum Proceedings, University of Agricultural Sciences, Bangalore, pp 364-365.

133
catches and gained respect and recognition in society as primary producers of raw
materials for marine products export industry. A pre-requisite for planning
coastal zone developments in the capture fisheries sector is the information base
on the potentialities of human resource involvement, the magnitude of facilities
such as fishing crafts, gears and other infrastructure available and the extent of
current resource exploitation.
Growth of fishery sector essentially coupled with development of
infrastructure facilities. The growth of marketing communication also has
enunciated development of the sector fetching better prices to the producers. Also
coastal zone management is also based on information gathering and
dissemination, which forms the basis of the strategies developed. Region-wise
Geographical Information System of the coastal agro-climatic zones for coastal
zone management and development should be prepared in consultation with
experts from capture and culture fisheries. Periodic dissemination of information
on prevailing prices of commercially important varieties of fish in different
markets will be much useful to fishermen, traders and consumers. Adequate
fishery infrastructure like freezing/ice plants, cold storage units may be
established in the marketing centres which will help to store excess catch during
the glut and sell it for a good price later.
Duty Entitlement Passbook (DEPB) Scheme
Duty Entitlement Passbook scheme is to neutralize incidence of
customs duty on import content of export product. Component of customs duty
on fuel (appearing as consumable in the SION) shall also b e factored in the
DEPB rate. Component of Special Additional Duty shall also be allowed under

134
DEPB (as brand rate) in case of non-availment of CENVAT credit.
Neutralization shall be provided by way of grant of duty credit against export
product.
Export Quality Control
Quality & Food Safety is the foundation of any food processing
industry. In the sea food industry, quality control is a very vital element as quality
of the products processed is highly heterogeneous and perishable in nature,
particularly under tropical conditions. Realizing this, the industry has adopted
modern methods of handling, processing besides adequate quality control
measures to improve the quality of marine products. As technology advance and
public awareness grows, consumers are becoming increasingly demanding in
terms of the choice, quality, freshness, nutritional value and microbiological
safety of food.
An advance in food technology has helped to curtail opportunities
for microbiological hazards and significant developments in laboratory diagnosis
such as the novel techniques developed viz: Polymerase Chain Reaction (PCR),
High Performance Liquid Chromatograph coupled with Mass Spectrometry
(HPLC with MS MS). This facilitates not only the detection of pathogens /
residue levels much more quickly but also to a level of minute sensitivity. These
developments have contributed to major improvement in ensuring safety of food.
To cope up with the increasing demand for safe food and to satisfy the needs of
health and quality conscious consumers of the global marine products market.95
95. www.mpeda.com/inner_home.asp?pg=publications/exportreview/trends.htm

135
Export Quality Logo in Indian Marine Products
With the objective of obtaining greater credibility and confidence
for Indian marine products in the international markets, the Marine Products
Export Development Authority (MPEDA) has launched its export quality logo.
The introduction of the new logo is expected to improve and extend the market
for Indian marine products. The affixing of the quality logo would enhance the
appeal of the product among the buyers.96
Nila Seafoods of Tuticorin in Tamil Nadu exporter has become the
first Indian manufacturer-exporter to be awarded the MPEDA quality logo. While
constantly striving to improve their infrastructure and their products, the
company has one of the most sophisticated and best processing plants in India.
The logo is expected to give a shot in the arm to Nila, a major exporter to the
Japanese seafood markets. MPEDA for its part will initiate logo promotion
programmes in Japan through its trade promotion office in that country. The
promotion in expected to assist the wholesalers and retailers in the Japanese
markets in projecting this product among the customers, thus enabling superior
quality right from the catch to the table. Nila specialises in sea-caught white and
flower shrimp grades. The flower caught from the Tuticorin seas commands a
premium price in the international markets. Caught in the wild, these products are
preferred by several top-end customers in the big supermarket chains and their
prices were found to remain relatively steady even when the prices of other
common grades fluctuated. Soon the Indian pink brown, known to be tasty and
96. Anwar Hashim, 2010, President of the Seafood Exporters Association of India (SEAI) http://www.thehindubusinessline.com/2010/08/27/stories/2010082751661800.htm

136
widely used by the Tempura chain of restaurants, is expected to be packed by
Nila with the quality logo.97
Quality Control and Promotion of Exports Complying with WTO Regulations Quality assurance in the domestic marketing channel will enable
the parallel development of the internal marketing system, which is highly
essential to withstand and market collapse and price crash in the export market at
any point of time (Sathiadhas and Narayanakumar, 2002). The marketing and
distribution system in the fishery sector of the country is not well equipped with
quality maintenance mechanism comprising essential marketing infrastructure
and proper administrative procedures. In the light of HACCP regulations, the
government as well as industrialists has been increasingly complying with the
quality standards of the export products.
However, quality maintenance in the internal distribution system
of fresh and processed fish is also essential. Quality concern attracts atmost
priority in the present day markets.98 On the basis of real field level observations,
adequate care for the post-harvest quality assurance of marine resources should
be emphasized. In addition, proper and cost-effective preservation facilities
should be provided at all retail outlets. Preservation or cold storage units can be
established on cooperative basis or by the local bodies extending the facilities by
nominal charges.
97. Ibid.
98. Sathiadhas.R, 2005, Policy Issues for Marine Fisheries Management in India, The seventh Indian Fishereis Forum Proceedings, University of Agricultural Sciences, Bangalore, p 358.
137
Eco-labelling
Eco-labelling is a voluntary method of environmental performance
certification and labeling that is precise around the world. An “eco-label” is a
label which identifies overall environmental preference of a product or service
within a specific product/service category based on life cycle considerations. The
idea that eco-labelling would lead to improved management of marine capture
fisheries is recent origin. Unilever PLC/NV and the World Wide Fund for Nature
(WWF) first publicly promoted it at their Marine Stewardship Council (MSC)
initiative in early 1996. Despite the international community’s general acceptance
of preduct eco-labelling, the approach has caused controversy in several
international arenas, including WTO Sub-Committee on Trade and Environment.
General concerns about eco-labelling are its potential to act as a barrier to trade
and its coherence, or lack of it, with international trade rules.99
More specific concerns arise when applying eco-labelling to
products from marine capture fisheries because these have special characteristics.
At any point of time, eco-labelling is marker-based economic instrument that
seeks to direct consumer’s purchasing behaviour so that they take account of
product attributes other then price. Consumer’s preference are expected to result
in price and/or marker share differentials between products with eco-labels and
those that either do not qualify for them or whose producers have not qualify for
them or whose producers have not qualify for them. The large and producers
have not sought to obtain them.
99. Sathiadhas.R, 2005, Policy Issues for Marine Fisheries Management in India, The seventh Indian Fishereis Forum Proceedings, University of Agricultural Sciences, Bangalore, p.359.

138
The large and progressive global fisheries trade, especially from
developing to industrialised countries, indicates the potential of eco-labelling as
both an incentive to improved fisheries management and a barrier to trade. There
is increasing acceptance on the part of those who are familiar with eco-labelling
that such labels should not be used to discriminate against those who cannot
afford to develop and implement those who cannot afford to develop and
implement the management practices needed for sustainable fisheries
management. Governments, industry and cousumers should promote international
collaboration in order to agree on basic principles for the introduction and use of
eco-labels in fisheries and aquaculture.
Subsidies
Subsidies have long been part and parcel of the fishing industry,
partly because of the public good nature of fisheries management and associated
research, but also because of the precarious livelihood experienced by most
fishing communities. The WTO definition of subsidies is chiefly concerned with
the trade effects on conservation or fisheries management. In WTO terminology,
subsidies in general are identified by “boxes” which are given the colours of
traffic lights: green (permitted), amber (slow down or be reduced), red
(forbidden). The Agriculture Agreement has no red box, although domestic
support exceeding the reduction commitment levels in the amber box is
prohibited; and there is a blue box for subsidies that are tied to programmes that

139
limit production. There are also exemptions for developing countries (sometimes
called an “S&D box”, including provisions in Article 6.2 of the agreement).100
“Green box” subsidies are allowed without limits, provided they
comply with the policy-specific criteria set out in the Agriculture Agreement.
Amber box include measures to support prices, or subsidies directly related to
production quantities. These supports are allowed (5% of agricultural production
for developed countries, 10% for developing countries).
The reduction commitments are expressed in terms of a “Total
Aggregate Measurement of Support” (Total AMS), which includes all supports
that are not for specific products, in one single figure. In the current negotiations,
various proposals deal with how much further these subsidies should be reduced,
and whether limits should be set for specific products rather than conditions with
the single overall “aggregate” limits. Blue box is the amber box with conditions
designed to reduce distortion. Any support that would normally be in the amber
box is placed in the blue box if the support also requires farmers to limit
production.
Subsidies that distort trade are not promoted in the WTO regime
and consequent measures to reduce the same are highly debated. The pros and
cons of its implementation on fisheries sector require to be examined with
reference to its far-reaching implications. Hence there is increasing pressure from
Indian scientist community to club all the subsidies together, instead of being
placed in separate boxes. India would not be adversely affected if these were
100. Sathiadhas.R, 2005, Policy Issues for Marine Fisheries Management in India, The seventh Indian Fisheries Forum Proceedings, University of Agricultural Sciences, Bangalore, p 360.

140
clubbed together, as the aggregate measure of support (AMS) to Indian
agriculture is still well below the de minimus of 10per cent. AMS were calculated
as the sum of product-specific and non-product specific support, as the former is
significantly negative in the Indian case. If India avails of the input subsidies to
the resource commitments even now under WTO provisions, the non-product-
specific support may come down to less than half of the present condition. Anti-
dumping and anti-subsidy duties or safeguard measures must be invoked in time.
Imports should comply with standards and the TRIPs system needs to be
strengthened (Rao, 2004).
Value-added Products in Marine Industry
The dietary habits of the people all over the Globe are changing
fast and India is gearing up to produce and supply value added products in
convenience packs by adopting the latest technologies and by tapping the
unexploited and under exploited fishery resources. Marine Products Export
Development Authority vision is to achieve the export of 5 Billion US $ worth
marine products by 2014-15that too with the 75% contribution of value added
items. Value addition has been considered as the thrust area. Indian marine
products processing units will be encouraged to go in for value addition and
export through setting up new units, expanding their capacity and diversifying
their current activities etc for value addition during the coming years. Foreign
collaboration, investments, tie ups in marketing of value added products and fish

141
import for further processing and export in value added forms will be
encouraged.101
Value-added Products Trends in National and International Markets
Regarding domestic markets, a trend in ‘a ready-to-cook and
‘ready-to-eat’ product was observed. On the Asian international market,
increased marine products sales directly to the retail sector played an important
role in the development of value-added fish products, particularly in Japan. In
addition to traditional Asian export markets for marine products, China’s
booming economy is offering new opportunities to marine products exporters of
the region. Fisheries the value-added products which are presently being exported
from the Asia and Pacific countries to regional and non-regional markets and
which include a variety of live, chilled, frozen, dried, canned and other fish,
shrimp or cephalopod- based products.
Marine Trade in Liberalisation and Globalisation Era
Marine Trade in Liberalisation Era
During the early years of liberalization it was difficult to observe
the impact of the policy on production and export. Therefore, an attempt has been
made in this study to examine the composition, growth and instability of marine
products production and export at the national level.
The liberalization of the Indian economy has provided
opportunities for marine exports. To step up the rate of growth of marine exports,
the government of India has embarked on a major programme of macro-
101. www.mpeda.com/inner_home.asp?pg=publications/exportreview/trends.htm
142
economic stabilization and structural adjustments through new trade and
industrial policies. In the new economic police, adjustments in the exchange rate
of rupee were sought to bring it inline with the equilibrium in order to improve
the seafood international competitiveness. An in depth analysis of global
competitiveness of seafood is necessary as Indian exporters could exploit
opportunities in export of marine products. The WTO as global regulatory
mechanism is bound to dominate the years to come. Keeping the above situations
in view, the present study is undertaken to gain an insight in economic constraints
to the technological impact on output, domestic and global trade, global
competitiveness of marine products, major constraints in both production and
exports and impact of WTO on Indian marine exports industry.
India is equipped to face the challenge in the wake of liberalized
trade regime. Further, the export market is exposed to high amount of risk
because of complex and changing marketing environment. The changes have
become intense in recent years in view of trade liberalization. Demand and
supply vary over the years due to technological and industrial development in the
target market, development of substitutes and new end uses and also due to
changes in the marketing capabilities of competing sources of supplies in the
third world countries. Therefore, it is imperative for us to study the market
opportunities and to evolve a package of appropriate marketing strategy and
policy on long term basis in order to improve the export trade in marine products.
This however requires the complete knowledge of export market for marine
products including the aspects such as export competitiveness, price relationship,

143
direction of trade and other related issues. Results of the study would be of value
in formulating export policy decisions as well as for the marine industry.102
Marine Trade in Globalization Era
In the era of globalization a reassessment of supply potential,
domestic and international demand scenarios and export potential becomes most
essential. Keeping in view the above point’s present study is a modest attempt to
analyze the trade constraints to the exports of marine products in the selected
state of Tamil Nadu in India. The problem of the efficient international trade
policies were undoubtedly never posed with as much acuity for the developing
countries, more particularly in India, than in the new context generated by the
phenomenon of globalization with its procession of consequences unprecently in
the economic history. From where need for essentially revisiting the involved
theses on the stakes (industrial and trade) of globalization, to especially locate the
dangers which it is carrying in reference to multiform imbalances which affect
the nations and the dubious future the poorest countries whose populations are
more than ever victims of process of exclusion.103
Globalisation in Developing Countries
Globalisation is the new buzzword that has come to dominate the
world since the nineties of the last century with the end of the cold war and the
break-up of the former Soviet Union and the global trend towards the rolling ball.
The frontiers of the state with increased reliance on the market economy and
102. www.mpeda.org/liberalisation/articl/4768
103. Boutaleb Kouider and Chaib Baghdad, 2008, “The international trade policies in the context of néo-liberal globalization: which prospects for the countries of the South? “Paper presented to the Conference on Empirical issues in International Trade & Finance, Indian Institute of Foreign Trade (IIFT), Kolkata, 23-24 December.
144
renewed faith in the private capital and resources, a process of structural
adjustment spurred by the studies and influences of the World Bank and other
International organisations have started in many of the developing countries.104
Also Globalisation has brought in new opportunities to developing
countries. But globalisation has also thrown up new challenges like growing
inequality across and within nations, volatility in financial market and
environmental deteriorations. Another negative aspect of globalisation is that a
great majority of developing countries remain removed from the process. Till the
nineties the process of globalisation of the Indian economy was constrained by
the barriers to trade and investment liberalisation of trade, investment and
financial flows initiated in the nineties has progressively lowered the barriers to
competition and hastened the pace of globalisation.105
Globalisation in India
In early 1990s the Indian economy had witnessed dramatic policy
changes. The idea behind the new economic model known as Liberalization,
Privatization and Globalization in India (LPG), was to make the Indian economy
one of the fastest growing economies in the world. An array of reforms was
initiated with regard to industrial, trade and social sector to make the economy
more competitive. The economic changes initiated have had a dramatic effect on
the overall growth of the economy. It also heralded the integration of the Indian
economy into the global economy. The Indian economy was in major crisis in
1991 when foreign currency reserves went down to $1 billion and inflation was
104. Globalisation: Imperatives, Challenges and the Strategies, p.39.
105. The Indian and Global Business - Jan 2004, P.30.

145
as high as 17%. Fiscal deficit was also high and NRI's were not interested in
investing in India.106
India opened up the economy in the early nineties following a
major crisis that led by a foreign exchange crunch that dragged the economy
close to defaulting on loans. The response was a slew of Domestic and external
sector policy measures partly prompted by the immediate needs and partly by the
demand of the multilateral organisations. The new policy regime radically pushed
forward in favour of amore open and market oriented economy.107
India gained highly from the LPG model as its GDP increased to
9.7% in 2007-2008. In respect of market capitalization, India ranks fourth in the
world. But even after globalization, condition of agriculture has not improved.
The share of agriculture in the GDP is only 17%. The number of landless families
has increased and farmers are still committing suicide. But seeing the positive
effects of globalization, it can be said that very soon India will overcome these
hurdles too and march strongly on its path of development.108
Globalisation of Fisheries
Trade liberalisation based on comparative advantage has become
an integral part of international relations in today’s globalising economy.
According to some, trade liberalisation contributes to national development,
resulting in a wide range of benefits such as increased employment, decreased
106. Chandrasekaran, Balakrishnan , 2009, Impact of Globalisation on Developing Countries and India, http://economics.about.com/od/globalizationtrade/l/aaglobalization.htm.
107. Ojha, 2002, "Globalisation and Liberalisation" Prospects of New World Order, Third Concept International Journal of Ideas.
108. Velayudham 2008, Globalisation Trend and Issues, Page 3, 66.

146
wage differentials and enhanced access to technology. This particular study,
supported by the United Nations Conference on Trade and Development
(UNCTAD), was conducted in order to explore the relationships between trade
liberalisation and women employed in India’s fish processing industry.109
Globalization and Liberalization, especially because of the WTO
obligations and the Free trade regional arrangements will raise new challenges for
the Indian economy. However, it will also bring new opportunities, which need to
be harnessed. India is also embarking on a new generation of economic reforms
that are attuned to global realities and global opportunities. Human Right
Activists protested against globalization. They remarked that globalization was
only to help the rich and in no way connected with the growth of developing
countries like India. Globalisation encourages free trade which affects the
economy of poor people and their food security. They sighted the example of our
polity to permit import or raw fishery products to India for processing and export.
This would have negative impact on our fisheries developmental activities and
ultimately fishing would become a none economically viable livelihood for poor
fishermen.110
Globalistaion Challenges in Marine Fisheries
The marine sector has been selected in the Component two of the
most poverty sensitive and is also braving the winds of globalization. By
establishing an effective network as well as informed participation, through an
109. The Impact of Trade and Globalization on Gender in India, A Case Study of Women Workers in the Fisheries Sector, http://www.csrindia.org/index.php/globalization-on-gender.
110. UNCTAD Project. 2009 ‘Strategies and Preparedness for Trade and Globalisation in India’, The United Nations Conference on Trade and Development (UNCTAD)-Government of India- DFID, http://www.fishglobal.org/abouttheproject.htm

147
effectively functioning trade portal, dissemination and enhanced awareness
through newsletters and radio programmes on issues relating to globalization, and
undertaking analytical studies on specific issues, MPEDA and SEAI.111
The issues selected for further examination such as escalating fuel
prices and operating costs as a matter of great concern for the sustainability of
fishing activities by a large number of small scale and artisanal fishermen;
traceability requirements, export capabilities of small fishermen, identification
and documentation of restrictions on exports of fish and fish products, would
strengthen the trade and poverty. Selection, identification and perspectives on the
issues are sought to be guided and enriched by discussions and deliberations with
the stakeholders across the value chain. In this way that the perspective on the
issues would be holistic and representative of the sectoral interests. While
specific interventions are of significance it is more useful to keep the broader
picture of networking in perspective. The network should involve poor producers
so that the objectives of promoting pro poor globalization approaches are
realized. We wish our marine sector all success in their efforts towards reaching
this overarching goal.
Globalisation and Marine Trade Legislation
The Indian marine products processing and export industry is a
major source of income and employment for many people. Either employed as
factory labour or working in the supply chain from capture/harvest to processing
and export. Handling, packaging and processing of fish and fishery products
exported from India into Europe, Japan and US has to conform with importing
111. http://www.seafoodsource.com/newsarticledetail.aspx?id=472

148
country legislation.. Implementation of legislation to upgrade the handling and
processing practices in the supply chain, from capture to factory gate, would be
more complex and would be likely to result in changes to the livelihood assets,
strategies and outcomes of fishermen, traders and service providers involved.
The introduction of further new legislation that may affect labour
and waste disposal.. Export industries in developing countries may be seriously
affected by importing country legislation, with consequent negative impacts on
employment and smallholder livelihoods, but there is often inadequate
knowledge about the nature and extent of this. Very little research has been done
on either previous or future impacts of EU and FDA legislation on the livelihoods
of the poor, directly or indirectly employed in the Indian fisheries export sector.
The lack of relevant knowledge is a constraint to the setting and implementing of
policy in respect of the poor, and poverty alleviation in the Indian post-harvest
fisheries sector.112
Marine Fisheries Management and Sustainability
Marine Fisheries Management
Traditional regulatory schemes used in marine capture fisheries
include output controls, technical measures, and input controls. Output controls
include total allowable catch (TAC) for the fishery, and trip or bag limits on
vessel landings and technical measures include catch. Over fishing and habitat
loss are serious threats to global fisheries. World marine capture fisheries
production in 2002 was nearly 80 million metric tons. The enormity of the
112. Project (2009) Globalization and seafood trade legislation: the effect on poverty in Indiahttp://www.dfid.gov.uk/r4d/SearchResearchDatabase.asp?ProjectID=2909

149
production can be visualized by a single trawl net, whose catch is so large that the
fish are crushed by their own weight. Input controls on fishing effort, the oldest
type of fishery management tool, include gear restrictions, vessel licenses, and
seasonal restrictions. Most fisheries are managed using a combination of these
measures113.
In many cases these regulatory tactics have proved to be
ineffectual in sustaining fishery stocks (populations), and have led to a number of
harmful unintended consequences for both fishers and consumers. For example,
the historical management practice used for Alaskan halibut and sablefish
(among other fisheries) involved establishment of a TAC, along with gear
restrictions and seasonal restrictions. Because fishers do not have a property right
to a share of the TAC, they respond to shortened seasons by acquiring more gear
and larger vessels so that they can capture more fish in a shorter period of time.
The result is an intense race for fish, or derby, which in turn may
require regulators to further reduce the season openings. Derbies create an
incentive for fishers to acquire larger vessels and more gear than they would
otherwise need, thus leading to overcapitalization and a need to further shorten
the season. Due to derby effects, the fishing season in the central Gulf of Alaska
halibut fishery was reduced from over 150 days in the early 1970s to about 3 days
in the early 1990s, yet the total catch approximately tripled. The race for fish,
combined with various subsidy schemes designed to build larger domestic fishing
fleets, has led to excess fishing capacity and financial hardship for fishers.114
113. Hackett, 2002, Fisheries, Marine: Management and Policy, www.waterencyclopedia. com/forum/en
114. Ibid

150
An important problem with both open-access fisheries and
traditional fishery management tools is that fishers do not have a property right to
a share of the available fishery stock prior to capture. Because fishers do not have
a property right to fish until capture, the harvest by one vessel imposes a rule of
capture externality on all others by reducing the remaining stock of fish. When
the rule of capture externality is operating, fishers have an incentive to
overcapitalize in vessel, crew, and gear115.
Fisheries management objectives highlighting the long-term
sustainable use of fishery resources as the overriding criterion of conservation
and management and lists several measures as examples of appropriate
management, such as avoidance of excess fishing capacity, the need to take into
account the interest of fishers, including those engaged in subsistence and small-
scale fisheries; conservation of aquatic habitats and ecosystems and protection of
endangered species; correction of adverse environmental impacts. In the
discussions on the management article of the Code, a rather intensive exchange of
views regarding the relationship between management and international trade had
prevailed; however, as a consensus could not be achieved, a section proposed by
the delegation of Japan on the subject was not included.
Many fishery products are traded in the international market place
and it can be argued that the demand pull originating from these markets affects
resource exploitation and, therefore, constitutes an important variable for
resource management. On the whole for fisheries, demand can be seen as
influencing future supplies resulting from adjustments caused by management
115. Ibid

151
regimes. To a certain extent, present effective demand will determine future
potential supply and to this extent cause a supply/demand gap or contribute to
equilibrium. If this line of responsibility holds, it would be justifiable to involve
those responsible for the (business) administration of the demand, in the
administration of the management regimes as well.116
State Level Fisheries Management
Fisheries management in India can be categorized into
management of fisheries in the EEZ and in the territorial waters. According to the
Constitution of India, the Central (Federal) government has jurisdiction over the
fisheries in the EEZ, while the State (Provincial) governments have jurisdiction
over fisheries in the territorial waters.
Fisheries management is undertaken mainly through licensing,
prohibitions on certain fishing gear, regulations on mesh size and establishment
of closed seasons and areas, under the Marine Fishing Regulation Act
(MFRA). Zones are demarcated by each State based on distance from the
shoreline (from 5 km to 10 km) or on depth. These inshore zones, where trawling
and other forms of mechanized fishing are not permitted, are perhaps the most
important space-based fisheries management measure in place.117
Fisheries Sustainability
Furthermore, developed countries may be in a position to make
116. Erhard Ruckes, 1996, The Code Of Conduct For Responsible Fisheries: Implications For Caribbean States, Paper presented at the Workshop on the Role of Financial Institutions in Strengthening National Fisheries Industries and Privatization of Fisheries Investments in Small island Developing States, Port of Spain, Trinidad and Tobago, 24-28 June, Senior Fishery Industry Officer (Marketing) FAO, Rome, Italy.
117. http://www.icsf.net/icsf2006/jspFiles/indianFisheries/fisheriesManagement.jsp

152
significant and costly changes to management systems as required by the
principles and criteria. A significant concern arises from the fear that developing
countries are not able to meet the environmental standards other countries set for
product groups, afford the costs of certification, or find it more difficult to
comply with all of the ecolabelling programmes’ chain of custody requirements.
Imports from countries that cannot meet the labelling standards may sell their
products in other developing nations where there are fewer consumers willing to
pay more for environmentally friendly marine products.
In addition, in developed nations where consumers have higher
average incomes, and may have a willingness to pay additional for products with
an ecolabel, products without an ecolabel will be de facto discriminated against.
This certainly seems to be the case with organic agriculture products. The
majority of the production and consumption of organic produce is in developed
nations.118
Economic losses in marine fisheries resulting from poor
management, inefficiencies, and over fishing add up to a staggering US$50
billion per year, according to a new World Bank-FAO report. Taken over the last
three decades, these losses total over $US2 trillion, a figure roughly equivalent to
the GDP of Italy. Strengthened fishing rights can provide fishers and fishing
communities with incentives to fish in an economically efficient and socially
responsible manner. Phasing out subsidies that enhance redundant fishing
capacity and harvesting effort will improve efficiency. Greater transparency in
118. FAO Corporate Document Repository, Originated by: Fisheries and Aquaculture Department Title: Product Certification and Ecolabelling for Fisheries Sustainability.

153
allocation of fish resources and greater public accountability for fisheries
management and health of fish stocks will help ecolabelling initiatives to certify
sustainable fisheries119.
Indian Marine Products Exports Constraints
Though India has done well in this sector, there are a number of
external issues which have affected this sector. One of the major problems faced
by the marine exporters from India came in the form of a ban by EU on these
products in 1997. In 1997, the EU imposed ban on the import of Indian fish and
fishery products based on the findings of deficiencies in hygiene and
phytosanitary conditions in many of the processing units in India. This forced the
government to lay down stringent norms for exporters of such products. The
government also initiated a major drive to improve the standards of the
processing plants in India. This led to a major shake-up in the sector as many of
the processing plants could not afford the required investment and closed down.
It also led to significant consolidation of the industry. Interestingly, the emphasis
on higher standards has also affected the nature of work and the pattern of
employment in this sector. This has particularly affected the women workers who
are engaged in the processing of shrimp and other marine products120.
The growth was achieved despite global economic recession
leading to lower consumption of high-end marine products. There were also
problems such as anti-dumping duties imposed by the US on shrimp imports
from India, export rejections on some seafood consignment to the EU on quality
119. Ibid.
120. Ibid.

154
concerns and problems with the Japanese markets. Despite the adverse global
economic challenges and India-specific problems, the volume of marine products
exports grew four per cent to 5.31 lakh tonnes during April-January 2009-10.
Export earnings in dollar terms have increased by over four per cent to $1.704
billion.121
Shrimp exports continued to dominate marine products exports
and accounted for 44 per cent of the total volume. However, shrimp volumes
have been coming down over the years and today account for just 20 per cent.
Even in foreign exchange earnings, shrimp accounted for 44 per cent of the total
realisation. Close to 40 per cent of the total volume of exports was contributed by
frozen fish. Although there was no significant growth in volumes on a year-on-
year basis, the value realisation has moved up close to 10 per cent. The bulk of
the frozen fish exports would have been contributed by China which has been
importing low-value fishes such as ribbon from India in recent years.
Constraints of Indian Marine Industry
Fishing in India suffers from several climatic disadvantages.
Firstly, India being a tropical country, fish does not keep fresh for long time
without proper refrigeration. Modernization in this context means replacing
fishing craft by power driven boats, providing facilities of quick refrigeration of
fish to avoid its putrefaction. It also includes arranging canneries for surplus fish,
utilizing discarded portions of fish for making fertilizers, providing refrigerated
road transport facilities to inland markets and the marketing of fish on
121. Punnathara, 2010, Kochi http://www.thehindubusinessline.com/2010/04/02/stories/ 2010040252441700.htm
155
cooperative lines. Hence, steps are being taken to introduce modernization in the
fishing industry of India in order to bring better results in this particular area.
India’s marine products export industry has to make faster strides
to catch up with the global trends in the sector. Apart from ensuring high quality
standards, promotional efforts have to be stepped up enormously to register the
needed level of progress in the exploitation of high sea pelagic of Indian
Exclusive Zone. The marine industry in our country, especially the value added
when through a difficult globalise period. Shortage of raw-material and
comparatively depressed international market continues to effect the performance
of the marine products industry.
The Indian marine products processing industry is well developed
with post-harvest infrastructure covering over 215 ice plants, nearly 500 shrimp
peeling plants, close to 400 freezing plants, 500 cold storage units and a handful
of plants for canning, fishmeal and surimi. Interestingly, but not surprisingly,
about 95 per cent of the country's marine products processing units are
concentrated in 20 major clusters in 12 maritime States where fish catches is the
highest. Export-oriented units follow quality and risk management systems.
There are nearly 230 units approved by the European Union. The EU is the single
largest buyer of Indian marine products. The industry's total installed freezing
capacity is well over 7,200 tonnes a day, but fully used only during peak fishing
season. Commercial production of 14 major fishery products is destined for over

156
40 overseas markets. Shrimp production line accounts for two-third of export
earnings.122
The Indian marine products export industry is one of the most
important segments of Indian economy in terms of output, foreign exchange
earnings and employment generation. Contribution of fisheries to Indian GDP is
about 1.3 % (2006-07) which forms about 5.2 % of the agricultural GDP. There is
a good demand of Indian marine products, particularly of the Indian tiger prawns.
But a detailed analysis shows that even though Indian exporters seem a satisfied
lot today there are danger signals for the future. This year the export of prawns
from India decreased from 65% to 52%. Challenges like lack of value addition,
lack of technological skills and facilities and concern over hygienic standards can
create a threat for Indian exports.123
Another issue facing the marine products industry is the “wastes”
generated while processing. In the case of cuttle fish, only about 65 per cent of
the animal's body is edible. The ‘waste' thus generated is a nuisance and need to
be disposed off. However, with some support from the government, all the wastes
can be converted into useful by-products, such as bio-diesel. Marine products
industry generates about 400,000 tonnes of discards. To give a perspective of the
magnitude of the wastes, India exported 602,835 tonnes of fish in 2008-09.124
122. Chandrashekhar, 2010, http://www.thehindubusinessline.com/2010/12/20/stories/ 2010122050371100.htm
123. Jitarani Udgata, etal 2008, “Enhancing Indian Tiger Prawn Exports: A Branding Approach”, Paper Presented to the Conference on Empirical issues in International Trade & Finance, Indian Institute of Foreign Trade, Kolkata, 23-24 December.
124. http://www.thehindubusinessline.com/2010/02/19/stories/2010021952791800.htm

157
India adopted economic policy reform programme in the year
1991, which focused on liberalization, openness, transparency and globalization.
Since then Indian economy is going through a transition phase where
restructuring of various sectors has taken place125. The marine products industry
is enjoying the status of a major foreign exchange earner in India nearly over last
thirty years. Source of this comparative advantage lies in large raw material base
and availability of cheap labour. Over the years the marine products industry has
evolved from being exporter of raw materials in the sixties to that of high value
added finished products by the turn of the century.
In this study an analysis of both quantitative and qualitative
performance of different components of the marine products industry is carried
out since 1991 to explore how the relaxation of tariff and imposition of non-tariff
barriers have influenced the functioning of the industry. Emphasis is placed on
analyzing the effectiveness of domestic policy to complement and supplement the
global position through creation of proper incentives to reap advantage of the
competitive World market. In value chain India has started concentrating on high
value, high quality marine products and for the total export of the sector the
realization value has remained always higher than that of the real exchange rate.
The Fisheries sector is the small industrial sector of modern India
as well as the small net foreign exchange earner of the country. In spite of that,
India’s share in world exports of marine products is too low as compared to that
of other nations, specifically, the Asian Giants. In fact, the overall picture of the
125. Anindita Adhikary, etal, 2008, “Export Performance of North East India: Few Empirical Issues” , Paper presented to the Conference on Empirical issues in International Trade & Finance, Indian Institute of Foreign Trade (IIFT), Kolkata, 23-24 December.

158
marine products trade in India is one of great potential but under-performance.
This potential is particularly important in light of the liberalization in marine
products trade foreseen under the Uruguay Round agreement of GATT
negotiations, as well as ambitious export-led growth and liberalization programs
undertaken by the Indian government since 1991.
The abolition of the MFA quotas creates opportunities for
developing countries, but also exposes them to additional competition from other,
formerly restrained, exporters. The outcome for any individual country therefore,
depends heavily on its policy response. Countries that take the opportunity to
streamline their policies, and improve their competitiveness, are likely to increase
their gains from quota abolition.
This study attempts to treat rigorously the issue of India’s
competitiveness of marine products exports vis-à-vis its major Asian competitors
in major regional markets of the world using Constant Market Share analysis,
before and after liberalization of MFA quota, separately, in two phases. Then we
have tried to compare the entire situation by observing whether there exists any
structural break in the values of exports of these Asian countries to the major
regional markets of the world over the entire period of our study especially
between the decades of Pre-WTO and Post -WTO. India’s share declines if we
compare the two extreme years of the entire time period along with some other
competitors. Our study concludes that if India does not pay adequate attention to
make its exportable more competitive vis-à-vis others, both on price and quality
aspects, the free market in international marine products trade will not permit
India to remain as a distinguished exporter.

159
SPS Compliant - Constraints
India has an elaborate system of quality inspection and
certification before any product is exported. In recent times, more rigour has been
brought into this process and the domestic system is evolving in response to the
reported number of rejections of exportable commodities. The Export Inspection
Council (EIC) is the apex-designated agency that is charged with this
responsibility. For brevity, SPS compliant exports are facilitated by the EIC,
which imposes a system three of inspection and certification, namely
consignment- wise inspection; in process quality control and a food safety
management system based certification.
However, for brevity we may recall that under the Consignment
Wise Inspection (CWI), each export consignment is inspected and tested by the
recongnised inspection agencies. Samples are drawn on the basis of statistical
sampling plans, inspected and tested for verifying the conformity of products to
the prescribed standards. In view of growing concern the world over regarding
health and safety parameters of food items being imported, international
standards on Food Safety Management Systems like HACCP/GMP/GHP have
been developed. Based on such standards, which are being prescribed by several
of India’s trading partners such as European Union and other countries. EIC has
introduced certification of product quality integrated with the systems approach.
Currently, Fish & Fishery Products, Egg Products and Milk Products are being
certified under the above system.
Processed food products are gaining in importance in the export
basket of India. There appear to be two key issues relevant for SPS compliant

160
exports like the pre-shipment inspection and certification by the exporting
country and the import procedures and detention in the destination countries.
Since, there are no uniform or homogenous product lines, there are wide
variations in relevant food safety norms and over time, food safety standards have
tended to become more complex and vary substantially amongst countries.
Marine Fisheries Sector Crisis
The fisheries sector faces a growing crisis. Increasing population
pressures, growing demand for fish, growing trade in fish products with
increasing imbalances between production and consumption areas and failures in
governance are leading to unsustainable levels of exploitation of living aquatic
resources and destruction of aquatic ecosystems. In many developing countries
the catches are declining, perpetuating a spiral into poverty for increasing
numbers of small-scale fishers and landless communities for which fishing is
often a livelihood of last resort.126 Exports of marine products have been
inconsistent and on a declining trend which can be owed to the adverse market
conditions prevailing in the European and American markets. The anti-dumping
procedure initiated by the US Government has affected India’s shrimp exports to
the US.
The Global Financial Crisis (GFC) in October 2008 had started
from the fall of the Lehmann Brother of U.S.A. The GFC has led to financial
crunch all over the developed economies and thereby lowered down the
purchasing power of the people. This has resulted that the developed economies
126. Profish Fisheries Factsheet, 2006, The World Bank’s Global Program On Sustainable Fisheries, Number 1, pp.1. www.worldbank.org/fish.

161
has been slipped into Economic Recession. The International Monetary Fund had
declared that U.S.A. and the other world countries would be suffering from
recession in 2007. It predicted that Global Growth would be at the negative rate
of 1.3 per cent. The World Bank (WB) forecasted that the growth of World
Economy would be in the negative rate of 2.9 per cent in 2009 and announced
that the World is experiencing a `Rare Recession’ with `Global Trade’ expected
to fall for the first time since 1982.127
The economy of India is the fourth largest in the world. India’s
foreign exchange reserves are over US$ 102 billion and exceed the forex reserves
of USA, France, Russia and Germany. This has strengthened the Rupee and
boosted investor confidence greatly. Infrastructural inadequacy constrains
economic growth, particularly in the backward States and in the agriculture
sector. There is a need for higher foreign investment, in the form of foreign direct
investment (FDI) and FII. Such investment triggers technology spillovers, assists
human capital formation, contributes to international trade integration and
particularly exports, helps create a more competitive business environment,
enhances enterprise development, increases total factor productivity and, more
generally, improves the efficiency of resource use.128
The recent recession is termed as `Rare Recession’ in the
developed economies heavily affecting the exports from India to these countries.
A sharp contraction is resulted in demand for Indian goods in the global market
and massive job losses in various sectors across the country. This affected the
127. Statistical Hand Book, 2011, Animal Husbandry, Fisheries and Forest, Department of Economics and Statistics, Government of Tamil Nadu, p70.
128. http://www.indianindustry.com/indian-economy/
162
export-oriented sectors like marine products, textiles, leather, gems and jewelers,
petroleum products, and automobiles that are major portion of the India’s export
basket.
Under the CSS for development of infrastructure of marine
fisheries the Government of India has sanctioned 7 major fishing harbours, 58
minor fishing harbours and 189 fish landing centres. Out of these, 7 Major
Fishing Harbours , 44 Minor Fishing Harbours and 189 Fish Landing Centres
have been completed and put to use. The remaining fishing harbours and fish
landing centres are at various stages of construction.129
Constraints of Fisheries Development
Despite the government's broad-based policies and set objectives,
desired success in the fishery sub-sector could not be attained due to several
constraints, such as inadequate credit facilities, scarcity of fish fry and absence of
adequate regulatory measures in the management of common-property water
bodies. Joint ownership of ponds was once identified as a major obstacle to pond-
culture fishery (Rahman and Ali, 1986). Recently, the situation has changed to a
great extent. Today, the leasing of ponds to outsiders for cash and solely for fish-
cultural activities by an owner or several co-owners has become the norm. Not all
ponds are equally suitable for every kind of aquaculture. Soil type, water quality,
availability of water, geographical location, pond-size and depth, and water-
holding capacity influence and affect fish-cultural activities. No data are available
on ponds that are located in ecological zones. In the case of capture-fisheries,
some of the major factors affecting the desired rate of development and limiting
129. http://www.researchandmarkets.com/reports/687785/

163
access to fish and fish products are inadequate knowledge, over-fishing,
degradation of water-quality due to indiscriminate use of insecticides and
pesticides and industrial wastes, unregulated fish conservation laws, absence of
socio-economically desirable advances of fish technologies, low research output,
improper management of fisheries, strict controls of the fish trade by
intermediaries.130
Impact of Japanese Tsunami in Indian Marine Trade
The impact in India would be most on shrimp farmers off the coast
of Andhra Pradesh, Tamil Nadu, Orissa and West Bengal. Black tiger shrimps
which are reared and harvested by these coastal farmers are much in demand and
the major constituent of marine products exports to Japan. Frozen large de-veined
black tiger shrimps are a high-value delicacy in Japanese markets fetching high
returns to the Indian farmer and the exporter. The setback for Indian marine
products exports comes on the back of recession in Europe, the biggest marine
products export destination for India, appreciation in the value of the rupee
against the euro and the economic collapse of Greece, Spain and Portugal.
However, export figures for April-December 2010 suggest that Europe was still
able to retain the top slot accounting for 26.14 per cent of the total marine
products export realisation.
Japan was the third most important export destination after the US
and accounted for 15.12 per cent of the country's total marine products exports in
value. Frozen shrimp continues to be the major item in the export basket
accounting for 48.61 per cent of the total foreign exchange earnings. Not only
130. http://www.thehindubusinessline.com/2010/01/28/stories/2010012851632000.htm
164
does shrimp export fetch high returns but unit value realisation from these
exports has also been rising. During the first nine months of the current fiscal unit
value realisation from shrimp exports have risen by over 25 per cent. Much of
the black tiger aquaculture and exports is pursued along the East Coast of India.
Although exports to Japan are also dominated by exporters from the East Coast,
the biggest players are from West Bengal, sources in SEAI said. While marine
products exports for the current year are not likely to be immediately affected, the
next could year could start on a sour note, the sources warned. And they pointed
out that revival of exports to Japan could take two to three months.131
Shortage of Power in Marine Industry
Marine industry told that shippers are forced to hold reefer
containers in their factories, thereby, incurring huge costs towards power
consumption and delays in shipments, which are mainly Christmas/New Year
contract consignments to Europe, the US, Far East and West Asia destinations.
With the commencement of the peak marine products season from Kochi, the
shortage of reefer plug points in the terminal is a matter of concern for exporters.
Due to the shortage, the terminal operator is forced to restrict acceptance of reefer
containers to the terminal, and many containers have to wait for two or three days
to enter the export container yard inside the Terminal.132
EU rejection of Indian shrimp
The rejections of Indian shrimp (scampi) by the European Union
131. Punnathara,www.thehindubusinessline.com/todays-paper/tp-agri-biz-and-commodity/ article1541394.ece
132. Sajeev Kumar, 2010, Kochi, http://www.thehindubusinessline.com/2010/10/13/stories/ 2010101351211600.htm

165
(EU) have fallen drastically after the modalities of testing the exports for the
banned antibiotic nitro furan were modified on September 2009. A cursory
examination of the data provided by the EU reveals only one rejection through a
notification by the EU Secretariat on January 11, 2010. There were over 50
rejections last year by the EU, mainly before the introduction of the revised
testing formula in September2009. Some of the rejections were due to the
presence of nitro furan metabolite. The EU alerts all member countries of the
presence of banned substances and sub-standard import consignments mainly
through the Rapid Alert System for Food and Feed.133 Indian exporters pointed
out that the allegations were timed with the announcement of the sunset review of
anti-dumping duties for Indian shrimp exports to the US. They also testified to
the high and exacting standards of testing by the EU that had resulted in alerts
being issued to developed countries such as Denmark, Canada, Turkey, Spain and
the UK over and above scores of developing country exports from Asia, Africa
and South America.
Catch Certificates Issue
The Marine Products Export Development Authority (MPEDA)
has put in place a series of measures to issue catch certificates for marine
products caught along the Indian coastline and meant for exports to the EU
region. The measures would fall in line with the requirements of global
organisations such as the FAO and regional fisheries management organisations
such as the Indian Ocean Tuna Commission. The move is expected to fetch
133. Punnathara, 2010, Kochi, http://www.thehindubusinessline.com/2010/01/27/stories/ 2010012751211000.htm

166
reasonable price to fishermen while preventing unregulated, illegal and
unreported fishing for the healthy growth of the fishery sector, MPEDA pointed
out.
EU brought out the new regulation that required all marine
products exports to the region, be it fish, squid, cuttlefish or octopus, and should
be validated with catch certificates. The catch certificate has to be prepared by the
fishing industry and validated by the Government Authority, which in turn has to
monitor a percentage of the applications in extensive detail. The Government has
mandated MPEDA to scrutinise and validate the catch certificates. Exporters are
also worried that they may not enjoy a seamless transition from the pre-catch
certification era to a post-event era. While the bulk of the systems and processes
for implementing the catch certification norms are reportedly ready, they still fear
initial glitches could hinder their consignments, even after the EU is notified of
the agency which is to extend the certification and other processes and systems
are in place.134
Anti-Dumping Duties
As a result of the anti-dumping duties, Indian marine products
exports to the US declined from 61,703 tonnes valued at $424.51 million in 2002-
03 to 33,382 tonnes valued at $211.06 million in 2009-10 – a sharp decline of 50
per cent in value and nearly 46 per cent in quantity. From being the biggest
export destination, the US current accounts for just 5 per cent of the country's
marine products exports and 10 per cent of the value.135
134. Punnathara, 2009, Kochi, http://www.thehindubusinessline.com/2009/12/31/stories/ 2009123150351300.htm
135. Punnathara, http://www.thehindubusinessline.com/2010/06/19/stories/2010061952011600. htm

167
Anti-Dumping Duty on Indian Shrimp Exports
The US has raised the average anti-dumping duty on Indian
shrimp exports to 2.67 per cent up from 0.79 per cent. The increased follows the
Fourth Administrative review by the US authorities. While the duties for
mandatory respondents such as Devi Sea Foods Ltd and Falcon Marine Exports
continue to be low at 0.38 and 0.89 per cent respectively, the rates for some other
companies have been raised sharply. The industry has 30 days to respond and file
its comments regarding the preliminary findings.
The final report will also take into consideration the comments
and observations of the Indian shrimp export industry. Seafood Exporters
Association of India (SEAI) said “With the dumping duty being scaled down
consistently over the last few years, this revision is the first serious setback for
Indian shrimp exporters. Under the Fourth Administrative Review, three
countries witnessed a downward revision in their rates. While the revision was
upward for India alone, the rates have been scaled down for Vietnam from 25.76
per cent to 2.89 per cent, for Thailand from 4.15 per cent to 3.19 per cent and for
China from 112.8 per cent to 1.36 per cent”.The anti-dumping, which was initally
imposed at a steep level of 10.17 per cent, had posed formidable challenges to
Indian shrimp exports.136
Anti-Dumping Duty imposed by the US
Generally the growth trend was reflected in most of the items,
especially frozen fish, cuttlefish and squid. Exports to all countries, except the US
136. Punnathara ,2010, Kochi http://www.thehindubusinessline.com/2010/03/12/stories/ 2010031254041700.htm

168
and South East Asia increased substantially. The European Union continued to be
the main market with a share of 31% in quantity and 33.36% in value, followed
by the US with a quantity share of 11% and value share of 20.73%. Japan stood
in the third place though it had a higher share in terms of quantity at 16% but a
value share of 19.43%. Exports to China were picking up, especially in quantity
where there was nearly 25% rise and 14% increase in value. Exporters felt that
though the anti-dumping duty on shrimp had its impact on shipments to the US,
traditional items like squid, cuttlefish, etc that were earlier shipped out to the EU
had now found their way to the US. Incidentally, exports from Kochi port topped
in quantity with a share of nearly 22% followed by Pipavav and JNPT.
Traditionally low-value fish tuna has now found its way into the international
market in a big way. It has only been recently that efforts began to export tuna
and given the value-addition done, the results have started showing. Over a dozen
tuna items from chilled ones to dried flakes and frozen fillets have helped in
seeing exports go up to 6,360.83 tonne earning over Rs 30 crore from 5,702.03
tonne worth Rs 23 crore last year. MPEDA has in its vision document stressed
the need to improve tuna catch and also its value-addition137.
Anti-Dumping Duty Rates
The marine products exporters told anti-dumping duty rates for
some of the Indian companies which were under review were revised upwards
because there was a discrepancy between their export rates to Japan and those to
the US. These differential rates were deemed as dumping by the US Department
137. Marine exports register 10 per cent growth in H1, The Financial Express: November 22, 2006.
169
of Commerce and the US International Trade Commission. After the steep, yet
graded, reduction in rates from 10.17 per cent earlier to 0.79 per cent last year,
the upward revision of average rates for the industry as a whole is a setback for
the sector. Shrimp exports to the US have fallen drastically by well over 70 per
cent from $140 million before the anti-dumping duties came into vogue to $40
million. Even in volume terms, shrimp exports to the US have been showing a
consistent decline, from 71,000 tonnes during January-June 2006 to 5,900 tonnes
in 2007 and further to 5,400 tonnes in 2008. Buoyed by the sharp reduction in
anti-dumping duty to 0.79 per cent, export volumes staged a decent recovery to
8,600 tonnes during the first half of 2009. But the revision of the anti-dumping
duties could upset future growth by volume and value. Anti-dumping duty had a
major impact on shrimp exports to the US which plummeted from $409 million
in 2003 before the duty imposition to $142 million in 2008. This fall was despite
the total US shrimp imports rising from $3.76 billion to $4.09 billion during the
same period. The position of the US fell further to just seven per cent of the
Indian seafood exports by volume and 13 per cent by foreign exchange earnings.
Indian shrimp exporters also stand to gain compared with exports
from some of the competing destinations. Shrimp imports from Ecuador will
attract an anti-dumping duty of 2.09 per cent, Thailand 4.51 per cent, Vietnam
25.76 per cent and China 112.81 per cent, SEAI sources pointed out. Though
170 Indian shrimp exporting companies came up for review, the respondents
were restricted to Devi Sea Foods Ltd and Falcon Marine Exports Ltd. The
preliminary review estimates that Devi Sea Foods would be attracting an anti-
dumping duty of 0.39 per cent, while Falcon Marine would be at 0.79 per cent.

170
While Devi Sea Foods would be exempt from paying anti-dumping duty since the
findings have placed its rates at sub-0.5 per cent or the de-minimum levels,
Falcon Marine and all other Indian exporters would have to pay duty at 0.79 per
cent. The Indian shrimp exporters were optimistic that the final administrative
review would validate the preliminary findings and reduce the anti-dumping
duties to very low levels.138
Marine Fish Marketing Constraints
India has a long sea coast where marine fishing is a big business.
Several lakhs of people are engaged in capturing, processing and marketing fish
and fish products. Nine states viz. Gujarat, Maharashtra, Goa, Karnataka, Kerala,
Tamil Nadu, Andhra Pradesh, Orissa and West Bengal have sea coast where
marine fishing is done.139
Fishery plays an important role in India’s economy in augmenting
food supply, in generating employment, raising nutritional levels and earning
foreign exchange. The fish production has shown a steep rise during the last four
decades. The structure of fish marketing has been changing considerably since
the days of technological improvements are fishing industry. The rapid pace of
technological changes in the production methods has posed challenges to the
marketing system. The infrastructure developments have enabled to have fresh
fish to more consumers and new markets. The infrastructures include good roads,
ordinary truck transport, transport by insulated vans, supply of ice, cold storage at
landing port markets and consuming markets, processing units. However, they
138. Ibid.
139. http://www.indiaagronet.com/indiaagronet/Fisheries/Fisheries.htm

171
are quite inadequate as against the requirements and at some places they are
lacking.140
Marine fishing is carried out in the sea coast while the consumer
are spread over not only in towns and cities along the sea coast but also in the
inland towns and cities quite far away. This needs quick transport, efficient
marketing agency, modern transport equipment. The problem of marketing fish is
compounded due to highly perishable nature of fish. This needs storage including
cold storage facilities both at landing centres and consuming centres. Such
facilities are developed in some states and at important landing port markets. But
by and large these facilities are quite inadequate. The fishermen in general are
unorganised and some of them still carry out fishing operation by country or
traditional boats and hence their catch is small, which poses marketing problems.
Marine Products Demand and Supply Elestricstics Constraints
Much has been written about the need for appropriate price and
non-price, exchange rate policies for promoting marine exports of developing
countries. The relatives’ importance of price and non-price factors has been
debated over years. Also relevant is the distinction between individual and
aggregate marine exports in respect of their response to prices and other relevant
polices. Supply Constraints rather than external demand constraint has often been
considered as an important factor in inhibiting the growth of marine products of
developing countries. However, much of the debate on these issues hinges on the
140. Jeffery, Williamson, Wider Annual Lecture 6: Winners and Losers over two centuries of Globalisation, p.49.

172
adequacy of empirical evidence on the quantitative significance of various factors
affecting supply and demand for marine products exports.
The magnitude of income elasticity of demand determines whether
growth in developed countries can provide a boost to the exports of developing
countries; the size of price elasticity of demand determines how shifts in export
supply will affect revenues. Finally, the export supply function indicates the
relatives’ influence of relevant price and non-price factors and associated policies
in stimulating the supply of factors. The responsiveness of marine products to
price and income changes in export and world markets has been estimated in the
past. However, price responsiveness of exports is often analyzed without
differentiating supply from demand response and many models do not specify
supply and demand relationships clearly and separately. Nor is sufficient account
taken of lags in the response of demand and supply to price changes.
Summary
The state of Tamil Nadu has a remarkable marine products export
profile compared to other maritime state in India. Tamil Nadu has an important
maritime state in the South East Coast of India endowed with rich marine and
inland fishery resources. The state dominates high potential for fish culture and it
is one of the leading exporters of fish in the country. The state fish export had
plummeted from 72644 MT in 2007-08 to 68364 MT in 2008-09. The total value
of export of fish had also witnessed a fall from Rs.1813 crores to Rs.1768 crores
during the respective years. So in the next chapter t analysed trade constraints to
the exports of marine products in Tamil Nadu – India.


![PDF (Profile of marine fishing practices) - [email protected] - Central](https://img.dokumen.tips/doc/110x75/6207454749d709492c2fb8e4/pdf-profile-of-marine-fishing-practices-emailprotected-central.jpg)