Embed Size (px)
Citation preview
CHAPTER III
MIGRATION: PATTERN, PROCESS AND SOCIO-ECONOlVIIC PROFILE
OF THE SLUMS

INTRODUCTION In this chapter, an attempt has been made to highlight pattern and processes of
migration and the socio economic profile of the migrants. The creation of slums is an
alternative to the housing scarcity, cost of the proper housing. In many cases as the time
passes, the slums are integrated into mainstream of the city life also.
In this chapter, we analyse the process of migration with the help of their of place
of origin, causes, duration, age at the time of migration, stages of migration, decision on
migration and reason of their choice of destination. The analysis of the process is
followed by the socio economic profile of the migrants in these slums, with particular
reference to size, age, sex, marital status and educational qualifications of the sample
household.
A questionnaire was developed for this purpose, covering these questions and it is
given in the appendix. A questionnaire consists of four parts covering around eighty
questions. These questionnaire were administered on 550 households distributed in three
slums namely Govindpuri, Madanpur khader and yamuna pushta. The numbers of
household are approximately proportional to the population size of the slums.
In all it was decided to cany out survey of about 550 households with the break
up of 300 samples from Govindpuri, 150 samples from Madanpur khader and 100
samples from yamuna pushta. The analysis of migration pattern and the socio economic
profile is discussed in this chapter. In most of the cases, the respondents were the head of
the household.
3.1 MIGRATION PATTERN
The phenomenon of migration has often been classified into various types on the basis of
origin,motivation, distance and time.
3.2 PLACE OF ORIGIN
In the first part of the questionnaire relation to flow of migration from different
states which is given in table 3.2. The table shows that the migrants come from all over
India but mainly from Uttar Pradesh, Bihar, Rajasthan, Haryana and west Bengal to three
slums
89

The Table3 .1 and Map no 3.2 shows that, In Madanpur khader, most of the
households are from Uttar Pradesh (39%) followed by Bihar (32%), Rajasthan (10%),
Delhi (05%). These four regions contribute around 89% of the total population of the
migrants in Madanpur khader. The rest of migrants belong to Orissa (02%), Madhya
Pradesh (02%), Haryana (02%), Jharkhand (03%), Maharashtra and Uttaranchal
contribute only l % of the total Migrant population. The proportion of population in
Govindpuri slums is similar to the Madanpur khader slum in terms of area of origin.
Map no 3.1 FLOW OF MIGRANTS FROM MAJOR TO GOVINDPURI
+
,,
200 0 :!00 Kilometer s E3 ~
Map no 3.2 FLOW OF MIGRANTS TO FROM MAJOR MADANPUR KHADER
+
200 0 200 Kilometers
" ,,
"
90

Map No 3.3
FLOW OF MIGRANTS TO FROM MAJOR YAM UNA PUSHT A
95 °
Map no 3.3 shows that. In Yamuna Pushta has major migration from the Uttar
Pradesh, Bihar, Rajasthan, Delhi and Haryana but very low migrant population from
Delhi as compared to other slums. In Yamuna Pushta, the state of Uttar Pradesh has the
largest contribution of the migrants, which is 28 percent followed by Bihar (22) percent,
Rajasthan (15) percent, Delhi (09) percent and Haryana (09) respectively. The states of
Uttaranchal , Maharashtra, Orissa and others have less then 3 percent of the migrant
household in the Yamuna Pushta slum.
As we compare between three slums the density of population Govindpuri slum is
very high, which is 2700 persons per sq km (table 3.2), the main reason is the good
infrastructural facilities, nearness to transport routes, Nearness to central place like Nehru
place near kalkaji and Greater kailash areas provide great support for employment needs.
As far as Yam una Pushta slum and Madan pur khader slum are concerned, Yam una
Pushta is illegal but Madanpur khader is a resettlement slum (settled in 2001) located far
from there place of migration. The population densities of these slums is therefore, much
lower then Govindpuri slum.
91

TABLE 3.1 Percentage of Head of the Households as Migrants and Total Number of Migrant Households in Three
Slums from Different States <~ --·=
PLACE OF NO. OF MIGRANTS HOUSEHOLDS PERCENTAGE ORIGIN
STATES GOVINDPURI MADANPUR YAMUNA G.P M.K Y.P KHADER PUSHTA
UTTAR PRADESH 86 47 28 28.66 39 28
BIHAR 64 39 22 21.33 32 22
RAJASTHAN 38 16 15 12.66 12 15
, DELHI "" .).) 14 09 11.00 05 09 !
MADHYA 12 06 04 04.00 02 04 , PRADESH
: ORISSA 8 04 02 02.66 02 02
HARYANA 33 12 09 11.00 04 09
JHARKHAND 16 07 06 05.33 03 06
· UTTARANCHAL 5 01 01 01.66 01 01
. MAHARASHTRA 5 01 01 01.66 01 01
: OTHERS 0 02 03 00 00 03
. TOTAL SAMPLES 300 150 100 100 100 100
Table 3.2 SLUM DENSITY PER SQ KM IN THREE SLUMS
SLUMS DENSITY PER SQ KM
i SLUMS GOVINDPURI MADANPUR YAMUNA KHADER PUSHTA
: DENSITY 2700 1800 2200
3.3 CAUSES OF MIGRATION
In order to assess the reason for migration, one will face typical problem with
those who are dependent on the family. Some of the people at present are the head of
household and completely assimilated into the economic life of the slum people. There
response of migration, which will be family move, education, and marriage, has to seen
in these perspectives. In most of the cases they are dependents of the families, who
92

reported employment as reason of migration. There parents who survived continued to
report employment as reason but in case of head of the household dies the elder son
becomes the head of the household and would report reason of migration as family move,
education and marriage as instead of migration. It is therefore considered proper to cross
classify the reason of migration of head of household by there age and duration of
migration.
Information regarding the cause of migration stated in the primary survey. the
cause of migration has been grouped under eight heads, viz, employment, education,
family moved, marriage, hostile condition in family/community, natural calamities,
higher wages and eight causes is other factors. The category "others" includes minor
causes like social disturbances, fight within family, accompanying brother and problems
within society, etc. the data on causes of migration is given in table 3.3 below.
Table 3.3
CAUSE OF MIGRATION IN THREE SLUMS
Cause of Migration Households Households % GOVIND MADANPUR YAMUNA G PURl MADAN y
PURl KHADER PlJSIHA KHAOER PlJSHTA
Employment 225 78 52 75.0 52.0 52
Education 04 02 04 01.3 01.3 04
Hostile conditions 06 02 02 02.0 04.0 02 in family/Community
Natural Calamities 00 00 01 00.00 00 01
, Higher wages 19 10 18 07.00 06.6 18
Others 46 58 23 15.33 38.6 23
Table 3.3 shows that, the Employment is the main cause of migration for
more then three fourth of the respondents, education, marriage and higher wages are
other major factors causing migration to the slums of Delhi. The total percentage of
migration due to employment contributes around 75 percent in Govindpuri. 52 percent in
Yamuna Pushta, 52 percent in Madanpur khader. For better education, Family movement
and other factors contributes very small percentage of population coming to these slums.
Education contributes only two percent, two percent and four percent in Govindpuri,
Madanpur khader and Yamuna Pushta slums respectively.
93

There is no migration reported due to natural calamities in Govindpuri and
Madanpur khader but yamuna pushta contributes one percent. These are residents
belonging to Bengal and Bihar, who have migrated due to floods and inhospitable
condition at the place of origin (caste violence and land problems etc). As we compare
between these three slums in terms of factors of migration, we come to these conclusions
that economic reasons (employment and higher wages) are dominant factors for
migration; in Govindpuri only one percent of migration moved to Govindpuri slum due to
the movement of family but in Madan Pur khader and yamuna pushta it contributes
eleven percent and twelve percent respectively.
Other factor contributes only 15.33 percent in Govindpuri, 38.6 percent in Madan
Pur khader and 23 percent in yamuna pushta respectively. Other factor includes marriage
and family movement. Marriage and family movement are taken into others because in
the survey, only the head of the household are enumerated and the people coming to these
slums as dependent and later becoming the head of the household may give reasons at the
time of migration other than economic.
The nature of migration primarily reflects household subsistence strategies in the
face of social, cultural, demographic and other constraints. Male predominate in most
labour migration streams but in a number of other cases both men and women migrate
together for work, especially among lower caste and tribals: where constraints on
women's participation in non-household economic activities are fewer. The pattern of
labour migration (whether males alone, males and females, or females alone) is related to
the social structure. Among inter-state economic migrants, the share of the northern states
(Bihar, UP) is very large in male migration, but the southern states have a comparatively
larger share in female economic migrants (Srivastava. 1998) but these observation not
valid in three sample slums. On the whole, however, females move smaller distances for
work compared to males. The major stream of the female migration came from Haryana,
Delhi and Rajasthan.
To know weather there exist any association between causes of migration and
place of origin, the migrant of all three slums have been classified and is given in state of
origin (table 3.4). It shows that migration due to natural calamities and hostile conditions
are region specific and largely contributed by floods and societal problems. In the states
94
of Bihar, west Bengal floods create massive destruction of settlements and property and
this ultimately leads to the out migration to other parts of India. Delhi is the most visited
destination because of nearness and homogeneity due to North Indian culture. Most of
those migrated on account of marriage are from Rajasthan. Delhi, Uttar Pradesh, Bihar,
Haryana and Madhya Pradesh. It is l I percent, 14 percent and 7 percent in Govindpuri,
Madanpur khader and Yamuna pushta respectively.
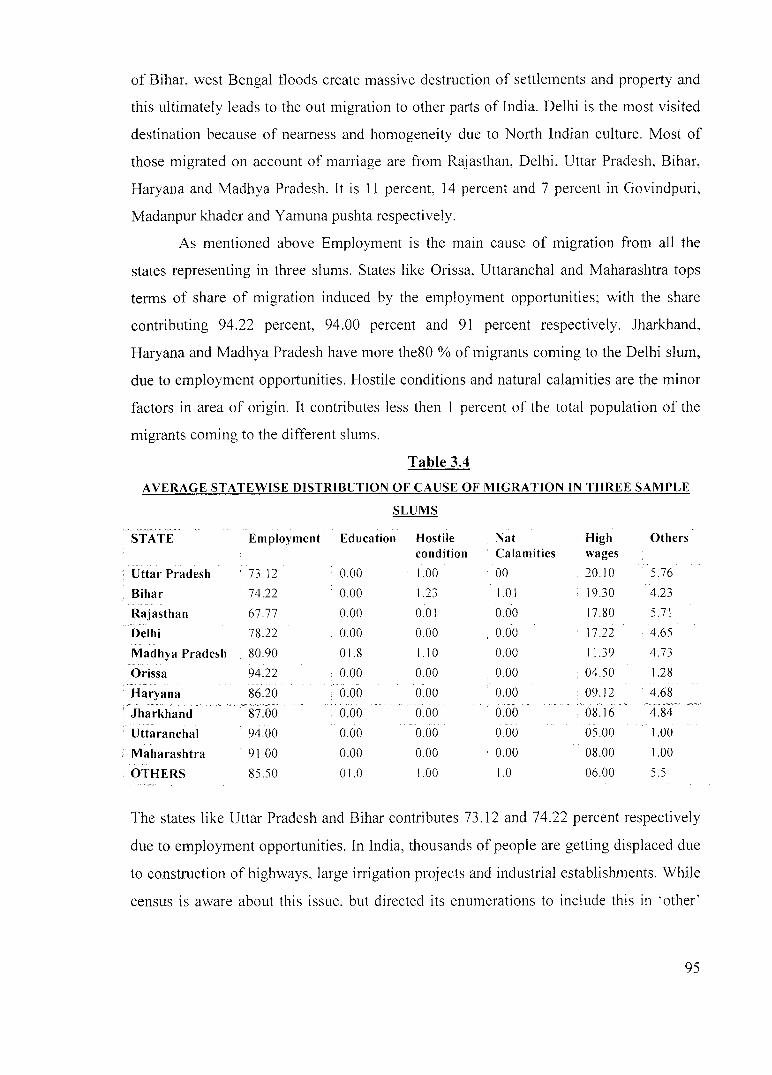
As mentioned above Employment is the main cause of migration from all the
states representing in three slums. States like Orissa, Uttaranchal and Maharashtra tops
terms of share of migration induced by the employment opportunities; with the share
contributing 94.22 percent. 94.00 percent and 91 percent respectively. Jharkhand,
Haryana and Madhya Pradesh have more the80 % of migrants coming to the Delhi slum,
due to employment opportunities. Hostile conditions and natural calamities are the minor
factors in area of origin. It contributes less then I percent of the total population of the
migrants coming to the different slums.
Table 3.4
AVERAGE STATEWISE DISTRIBUTION OF CAUSE OF MIGRATION IN THREE SAMPLE
SLUMS
STATE Employment Education Hostile Nat High Others condition Calamities wages
Uttar Pradesh 73.12 0.00 1.00 00 20.!0 5.76
Bihar 74.22 0.00 1.23 1.0 I 19.30 4.23
Rajasthan 67.77 0.00 0.01 0.00 17.80 5.71
Delhi 78.22 0.00 0.00 ' 0.00 17.22 4.65
Madhya Pradesh 80.90 01.8 1.10 0.00 11.39 4.73
Orissa 94.22 0.00 0.00 0.00 04.50 1.28
Haryana 86.20 0.00 0.00 0.00 09.12 4.68
Jharkhand 87.00 0.00 0.00 0.00 08.16 4.84
Uttaranchal 94.00 0.00 0.00 0.00 05.00 1.00
Maharashtra 91.00 0.00 0.00 0.00 08.00 1.00
OTHERS 85.50 01.0 1.00 1.0 06.00 5.5
The states like Uttar Pradesh and Bihar contributes 73.12 and 74.22 percent respectively
due to employment opportunities. In India, thousands of people are getting displaced due
to construction of highways, large irrigation projects and industrial establishments. While
census is aware about this issue. but directed its enumerations to include this in 'other'
95

category. Here also these people are enumerated into others category. The migrants
belonging to this category are from Madhya Pradesh and Rajasthan but these migrants
contribute very negiigible proportion ofthe migrants.
3.4 AREA OF ORIGIN
Table 3.3 shows the data regarding the place of origin of the migrants, the area of
the origin has been divided into urban and rural. The majority of the people coming to the
three slums of Delhi belongs to the rural areas and come to Delhi in search of good
employment opportunities and higher wages. Only small section of people belongs to the
urban areas and these are those migrants who moved from small cities to the urban areas
and later coming to Delhi slums.
As we compare three slums m Table 3.3, we see only Govindpuri slums
contributes little less then 90 percent from rural areas and its urban population percentage
contributes 12 percent. Madan Pur khader and yamuna pushta contributes 8 percent and
6.5 percent to total population from urban areas respectively, who are migrating to Delhi
slums from other urban areas.
The majority of the slums population comes from the rural areas and this induced
migration has been called as "distressed migration."
AREA OF ORIGIN
URBAN
RURAL "'
TOTAL
TABLE 3.5
AREA OF ORIGIN
COVINDPURI % MADAN PUR
KHADER%
12 08
88 92
100 100
3.~ DURATION OF MIGRATION
YAMUNA PUSHTA
'Yo
6.5
93.5
100
Migration is influenced both by the pattern of development (National
Commission on Rural Labour (NCRL, 1991) and the social structure. The National
Commission on Rural Labour focusing on seasonal migration concluded that uneven
development was the main cause of seasonal migration. Along with inter regional
disparity, disparity between different socioeconomic classes and the development policy
adopted, since independence has accelerated the process of seasonal migration. The year
96
of migration is an aspect of the study of migration. For this purpose the, the year of
leaving home was classified into four periods, i.e. before 1980, 1980-90, 1990-2000 and
after 2000. For the total 550 samples divided into three slums based on proportional
population. (Table 3.6)
The migrants coming to the Govindpuri slums started in eighties and gained
impetus in 1980 to 1990; before 1980 only 16 percent migrants migrated to the this slum
and these are original migrant families. 52 percent families migrated between 1980 to
1990, they constitutes majority of the migrants of Govindpuri slums and these are also
the original migrated families coming to these slums.24 percent migrants were
contributed in constitutes 1990 to 2000. After 2000 Only 08 percent the migrants came to
the Govindpuri slums. This is due to high living standards of living in comparison to
other slums of Delhi. The proportion of the slums after 2000 is very less because of fact
that the survey was conducted in 2005.
In the Madan Pur khader slums, the whole population of migrants, migrated to
these slums after there resettlement to this slums in 2000 In Madanpur khader slums, all
of the population migrated after 2000 and that's why no settlement or migration
happened before 2000.
Table 3.6
YEAR OF ARRIVAL OF THE HEAD OF THE HOUSEHOLD
Year of arrival Slums%
Govindpuri Madan pur Yamuna pushta khader
Before 1980 16 00 00
1980-1990 52 00 24
1990-2000 24 00 36
2000 & above 8 100 40
Total 100 100 100
In Yamuna pushta, the period of migration started after1980. After 1980, 24
percent of migrants came to yamuna pushta. The majority of migrants coming to this
slums after 1980, 1990 and 2000 increased because of resettlement of older inhabitants
and there vacant places are taken over by other inhabitants. Many slum dwellers come to
this slum in apprehension that one day they will get a house in one resettlement colony.
97

Many people have two or three slum household in Delhi areas and they rented it for
money. The stream of migration has been halted by the complete evacuation of the slums
in 2006.
As there arrival to Delhi is analysed, only very low percentage of inhabitants left
Delhi and gone back to there home (the place of origin). It means more immigration then
out migration from Delhi. In terms of departure from slums to other areas is concerned,
the movement of population from Yamuna Pushta and Madanpur khader slums is very
high. Main reason is resettlement and better housing aspiration of resettlers.
To find out that, whether any association exists between the place of origin and
period of leaving home, the information is further cross classified. The result shows that
the majority of the migrants belong to Uttar Pradesh, Bihar, Rajasthan, Haryana and
Delhi. During 1980 and on wards, the process of industrialization gained movementum
around Delhi and migrants came from Uttar Pradesh and Bihar and these two contributed
more 60 percent of the total migrants, followed by Rajasthan, Haryana and Delhi. The
migrant from these states contributed around 20 percent of the total migrants.
Possible association between the cause of migration and period of leaving home is
cross- classified. The result shows that there is a strong association between these two
aspects, the employment being the main reason for migration in all three slums. In
Govindpuri slum the major migration stream comes in 1980 to 1990 but yamuna pushta
contributes largest migration stream followed after 2000, which is 40 percent of the total
migration. Madan Pur khader contributes largest migrants came after 2000, which was
created after 2000 as Madanpur khader settlement colony. All the residents of Nehru
place slum relocated to Madan Pur khader colony in 2000-01. Migration due higher
wages and marriages are other major factors contributing to flow of migration. They
contribute less then 12 percent respectively before 1980 and there share in all the four
period of migration is remain stable and there is very slight change in there proportion to
the total population.
In case of family movement, only 3 percent of population migrated before in
1980.It increased to 3.2 percent in 1980-1990 and in 1990-2000 the proportion increase
to 3.34 percent. The Employment is the major factor contributing largely to the
movement of the peoples from different states to the Delhi slums.
98

Natural calamites like floods and drought contributed very less to the distressed
migration to the Delhi slums. The population from North Bihar and west Bengal are the
people came to Delhi in search of employment. In I980 to I990, the inhabitants of Orissa
also migrated due to t1oods. (Table 3 .6)
The discussion indicates that there is a strong association between the period of
migration and the cause of migration. While most migrants left home during I980 and
1990 due to employment higher wages and to some extant marriage and movement of
families. Before employment and higher wages were the paramount factors of migration
to the urban slums. Hostile condition in society and other factors are insignificant to
migration of people to the urban areas (Table 3.7)
Table 3.7 MAJOR STATEWISE DISTRIBUTION OF MIGRANTS BY THE YEAR OF LEAVING HOME
(in%)
Place of origin Before 1980 1980-90 1990-2000 After 2000
Uttar Pradesh 32 35 36 27
Bihar 29 24 24 26
. Rajasthan 12 II 12 14
Haryana 9 15 14 10
Others 20 15 16 23
Uttar Pradesh dominates in all periods of migration followed by Bihar,
Rajasthan, Haryana and others. Uttar Pradesh contributes 32, 35 36 and 27 percent in
before 1980 1980-90, 1990-2000 and after 2000 respectively.
3.6 Age at the Time of Migration
Data on individual migrants working population gleaned from sample surveys and
Census of India shows a significant clustering of migrants in the 16-40 year age group.
This is even more the case with poorer semi-permanent or temporary labour migrants.
With respect to education, migration rates are high both among the highly educated and
the least educated, and among seasonal migrants there is a high preponderance of
illiterate people as migrant population includes large uneducated class. The migrant
stream is dominated by unskilled workers
99
The table 3.8 shows that of the 550 migrants distributed in three slums, more than
65 percent of migrate before the age of 30 years. The detailed analysis further reveals that
22.1 percent, 16.11 percent and 19 percent of the inhabitants migrated before the 15 years
of the age in Govindpuri, Madanpur khader and yamuna pushta slum respectively. The
majority of the migrants contributed by age group of 15-25 years in Govindpuri,
contributing 44.16 percent of total mean age of household. In Madanpur khader and
yamuna pushta the age of largest migration belongs to 25-30 years, contributes 42 and
41.25 percent respectively. The age group of 35-40 and above 40 contributes less then
five percent in Govindpuri and yamuna pushta only 5.6 percent in Madanpur khader
slum. Migrant population, Above 40 age group contributes less then one percent in the
entire slum
AGE AT TIME OF MIGRATION
<15
15-25
30-35
35-40
>40
total
TABLE 3.8 AGE AT THE TIME OF MIGRATION
SLUMS
Govindpuri Madan pur khader
22.1 16.11
44.12 29.05
23.45 42
08.00 8.16
2.53 5.6
0.8 0.08
100 100
Yamuna pushta
19
26.25
41.25 .
8.25
4.25
100
Govindpuri, Madanpur khader and yamuna pushta: Age at the Time of Migration
(head of the household)
As we compare between the different sample slums taken for the study namely
Govindpuri, Madanpur khader and yamuna pushta respectively.
On the one hand different age groups have been taken and on the other hand age
at the time of migration in slums is taken. Here we see that the age group 15-25
dominates in all the streams of migration. which contributes 44.12 percent respectively
(table 3.9).
100

Table 3.9 GOVINDPURI: AGE AT THE TIME OF MIGRATION
AGE AT THE Age groups TIME OF
>15 15-25 25-30 30+ MIGRATION
0-5 2.6 6.8 9.8 6.2
5-10 5.2 16.4 10.5 4.1
10-15 5.8 12.8 1.2 0.3
15-20 7.5 6.5 2.0 0.0
20+ 1.0 2.5 1.0 0.0
TOTAL 22.1 44.12 23.45 10.61
The table 3. 9 denotes, In Govindpuri, less then 15 years of age groups, 25-
30 age groups and more than 40 years age group, the proportion of population in different
age groups is 22.11 percent, 23.45 percent and 10.61 percent respectively. The proportion
of the stay and the age at the time of migration is positively correlated. In the age group
of less then 15, 15-25 and 25 -30 age groups is 2.6 percent, 8. 7 percent and 9.8 percent
respectively
Table 3.10 MADANPUR KHADER: AGE AT THE TIME OF MIGRATION
AGE AT THE Age groups TIME OF
>15 15-25 25-30 30+ MIGRATION ""
0-5 16.11 29.05 42.04 13.80 '"
5-10 0.00 0.00 0.00 0.00
10-15 0.00 0.00 0.00 0.00
15-20 0.00 0.00 0.00 0.00
: 20+ 0.00 0.00 0.00 0.00
[TOTAL 16.11 29.05 : 42.04 ; 13.80
. The age group of 15-25 has the largest concentration in 5-10 and 10-15 age groups,
which is 16.4 and 12.8 percent respectively. In the age group 25-30 and more then 30
years, the highest percentage of population is concentrated in the age group of 0-5 and the
5-10 years of stay.
Table 3.10 states that in Madanpur khader; all age groups are concentrated in the
0-5 years of the duration of the stay. The largest concentration is in the age group 15-25
1 01
and 25-30, which is 29.05 and 42 percent respectively. The age group of below 40 years
contributes 16.11 and 13.80 percent respectively
The table 3.11 shows that in Yamuna Pushta the major contribution to the mean
age migration is dominated by the age group of 25-30, which is 41.25 percent followed
by the age group of 15-25, less then 15 and more the 30 years. In the age group of 25-30,
the largest concentration of duration of stay is calculated from the 10-15 and 15-20 years.
The age of migration in the age group of 15-25 is concentrated in more then 20 years of
migration. In which, the maximum concentration is 15-20 year of stay in less then 15
year of stay and in 10-15 years of duration it is more then 30 years.
Table 3.11 YAM UNA PUSHT A: AGE AT THE TIME OF MIGRATION
AGE AT THE Age groups TIME OF
>15 15-25 25-30 MIGRATION 30+
' 0-5 3.2 3.10 4.6 1.6
5-10 4.7 2.2 3.7 1.4
10-15 1.9 1.8 15.0 6.2
15-20 6.2 7.5 16.5 2.8
20+ 3.0 11.6 1.5 1.4
TOTAL 19.0 26.25 41.25 13.50
3.7 MIGRATION PROCESS
Migration process is related to movement of the migrant are what are the factors
which promote the migration. In this part we are analysing the factors related to the
migration process.
3.8 DIRECT I STEP WISE MIGRATION
Migration takes place both directly and step wise; the mode of the migration has
been determined by the circumstances, information and the distance between the place of
departure and destination. Information regarding the direct and step wise migration was
collected by ascertaining information about the number of places the respondents had
stayed before moving to Delhi. Migration decisions are influenced by both individual and
household characteristics as well as the social matrix, which is best captured in social
anthropological studies Among inter-state economic migrants, the share of the northern
102

states (Bihar, UP) is very large in male migration. On the whole, however, females move
smaller distances for work compared to males.
Out of 550 migrants, the table 3.9 states that, three fourth of migrants came
directly to Delhi living in three slums. These slums contribute 74.92, 72.25, and 75.8
percent respectively. The number of migrants came directly and there proportion
decreases when we go to more then one years of the stay. These three slums contribute
3.55, 5.2 and 5 percent respectively in more then two places of the stay in Govindpuri,
Madanpur khader and Yamuna pushta respectively. The percentages of migrants stayed at
three places contribute 1.61 percent 9.25 percent and 0.75 percent in Govindpuri,
Madanpur khader and Yamuna pushta respectively
TABLE 3.12 TYPE OF MIGRATION
TYPE OF SLUMS MIGRATION GOVINDPURI MADAN PUR YAM UNA PUSHTA
KHAOER
Came directly 74.92 10.25 75.8
Stayed at one place 19.92 55.3 18.45
Stayed at two place 3.55 35.2 5
Stayed at three place 1.61 9.25 0.75
To find out whether there exist any association between the place of origin and
step migration. Information has been cross classified. It is seen that from the table that the
proportion of migration decreased as the distance of migration as the distance from Delhi
increased as a phenomenon called by E.W .Raven stein as the "distance decay". Although
the actual distance of the places is not taken in the samples so that is not known, the
location of the states indicates the distance decay proposition. Migration came directly to
Delhi belongs to Haryana, Rajasthan, fringes of outskirts of Delhi. One major findings of
the study is that migrants from Uttar Pradesh and Bihar came directly to Delhi slums and
do not follow the distance decay theory. The main reason is the good transport network
supported by the railways. The people from north Bihar and eastern Uttar Pradesh are the
beneficiaries of this railway network. The incidence of direct migration was 90-1 00
103

percent for migrants of Uttar Pradesh, Bihar, Rajasthan and Haryana. Madhya Pradesh
Orissa and west Bengal contribute 80-90 percent of the total migrants. Only 60 percent
came from other states of India directly to Delhi. Around 20 percent of migrants from
Bengal, Orissa and Maharashtra stayed at one place before coming to Delhi. Migration
from Bihar and Uttar Pradesh stayed for three places before coming to Delhi but there
percentage is very small, contributing only less then one percent. Some migrants from
west Bengal stayed at more than three places before reaching to Delhi, from their
settlement in Bihar, Uttar Pradesh and Haryana and they create some sort of suspicion
when asked about there homes back in West Bengal( may be they are international
migrants coming illegally to Indian territories). In yamuna pushta slum some migrants are
not able to recall there place of there origins and can not tell were they stayed before
coming to Delhi. A majority of them were influenced by their relatives who are already
staying in the slum. It is also found that majority of people stay in different slums stay
because of availability ofjobs and nearness to work place and migrate to other slums as there
work shift from one area to another.
3.9 IDEA ABOUT MIGRATION
Migration encompasses enormous economic and social diversity. Migrants are
concentrated in different types of work in rural and urban areas. In the rural areas, self
employment is the predominant activity for both male and female migrant workers
followed by casual work
The process of migration is always controlled by circumstances in which the idea
of migration was taken out. The idea of migration is the important constituent for the
migration to any area. As per the movement in Delhi slum is concerned, the majority of
migrants come from North India namely Uttar Pradesh, Bihar, Rajasthan and Haryana.
Family members are the main motivating force behind the movement of migrants. Better
dreams of the tomorrow and good living condition are the motivating forces for the
migration. The highest motivating factors are family members, who contribute 69, 72 and
73 percent in Govindpuri Madanpur khader and Yamuna pushta respectively (table 3.13).
104

TABLE 3.13 IDEA ABOUT MIGRATION
IDEAOFM IG RATION SLUMS
GOVINDPURI MADANPUR KHADER
FAMILY MEMBERS 69
FRIENDS WHO HAVE 22 MIG
HEARDAOUT 5 OPPURTUNITY
ATRANDOM J
OTHERS
TOTAL 100
72
i6
8
2
2
100
YAMUNA PUSHTA
78
10
2
6
2
100
The second motivating forces are the friends who have migrated to these cities;
they contribute 22 percent, 16 percent and 10 percent in Govindpuri, Madanpur khader
and Yamuna pushta respectively.
Other factors like heard about the opportunity, at random decision and other
factors contributes very less percentage of idea of migration The idea of migration was
largely provided by the family members in all of the slums
3.10 DECISION ABOUT MIGRATION
The idea of migration in all three slums is dominantly suggested by the family
members and the friends. it constitute around 90 percent of the total migrant coming to
Delhi slums. As the decision making is concerned, the Table 3.14 suggest that. the
majority of decision for migration is contributed by the migrant himself contributing 84,
80 and 78 percent of the migrants in Govindpuri, Madan pur khader and Yam una pushta
respectively.
Parents contribute only 12, I 0 and 13 percent of the migrant decision in three
slums respectively. Spouse and other relatives contribute only 4, 9 and 9 percent of the
migrants in Govindpuri, Madan pur khader and Yamuna pushta respectively. (Table 3.14)
The idea of migrants deciding to move to the Delhi is largely decided by the
migrant himself and for the betterment of the family, the male migrant below the age of
30 are the main constituent of migrants
105

DECISION MADE FOR MIGRATION
Table 3.14 DECISION MADE FOR MIGRATION
SLUMS
GOVINDPUR! MADAN PUR YAMUNA PUSHTA KHAOER
Yourself 84 80 78
Parents 12 iO 13
Spouse 04 09 19 ,. " --~ ' -
others 00 01 00
Total 100 lOO 100
3.1.fl REASONS TO CHOOSE DESTINATION
The reason to choosing destination is mainly the function of the migrants; the
migrants choose the destination according to nearness to the destination, better
employment, higher wages and better living condition (table 3.15).
TABLE 3.15 REASONS TO CHOOSE DESTINATION
REASONS TO CHOOSE DESTINATION
RELATIVES, FRIENDS ALREADY
, LIVING THERE
· RELATIVES, FRIENDS LIVING IN THE
PREVIOUS PLACE OF RESIDENCE
LABOUR RECRUITER/ CONTRACTOR
MEDIA SOURCE LIKE NEWSPAPER,
RADIO
WITHOUT ANY HELP
TOTAL
GOVINDPURI
66
22
06
02
04
100
PERCENTAGE
MADAN PUR KHADER
74
20
02
02
02
100
YAMUNA PUSHTA
71
21
03
02
01
100
Table 3.15 shows that the reason to move to Delhi is largely contributed by
relatives, friends already living there and the relative, friends living in the previous place
of residence. Relatives and friends already living there are the major reason for choosing
the destination contributing 66, 74 and 71 percent in Govindpuri, Madanpur khader and
Yamuna pushta respectively.
106

The other factor like labour recruiter contributes 6, 2 and 3 percent in Govindpuri,
Madanpur khader and Yamuna pushta respectively. Media source like newspaper and
without any help they migrated to Delhi contributes only 2 percent in all three slums.
Delhi has been the greatest puller because of its heterogeneous nature in terms of jobs
and services. Other people were intluenced by their kin folk who were already dwelling
here; they were support for the new migrants. The majority of migrants have come to this
particular slum area because of cheep accommodation as they cannot effort higher
accommodation costs. The household coming without any help contributes very less
percentage and they contribute 4, 2 and I percent in Govindpuri. Madanpur khader and
Yamuna pushta respectively.
3.12 FAMILY COMPOSITION OF MIGRANT'S IN PLACE OF ORIGIN
Mobility occurs when workers in source areas lack suitable options for
employment/livelihood, and there is some expectation of improvement in circumstances
through migration. The improvement sought may be better employment or higher
wages/incomes, but also maximisation of family employment or smoothing of
employment/income/consumption over the year.
TABLE 3.16 FAMILY COMPOSITION OF MIGRANT'S AT THE PLACE OF ORIGIN
FAMILY SLUMS o;.,
COMPOSITION GOVINDPURI % MADANPUR KHADER YAMUNA PUSHTA
o;o o;o
FATH/MOTHER 26 32 35
FATH/MOTH/BROTHER 38 25 32 m.
F ATH/MOTH/BROTH ER 28 36 21 /SISTER
F ATH/MOTH/BROTHER 08 07 12 /SISTER/WIFE
TOTAL 100 100 100
107
Family constitutes basic structure ofthe society. The majority of migrants coming
to Delhi belong to Uttar Pradesh, Bihar, Rajasthan, Haryana and Delhi contributing
around 85 percent ofthe total migrant population of these slums.
As the data shows in table 3 .16, the majority of father and mother live in there
native places and young people migrate to the urban areas. Due to joint family system
prevailing in the rural areas, one or two brother stays there in the rural areas to cater there
land and others immoveable assets. Until the marriage, the sister stays with there parents
and due to these the percentage is 21 percent in yamuna pushta and 36 percent in
Madanpur khader. Majority of migrants are staying with there wife and children and his
wife also contributes by working as maid or in informal sector. The migrants did having
wife and children in slums contributes only 08 percent, 07 percent and 12 percent in
Govindpuri, Madan Pur khader and yamuna pushta. Majority of migrants live with there
families and only 8 percent, 7 percent and 12 percent in Govindpuri, Madanpur khader
and Yamuna pushta live without families respectively.
3.13 SOCIO-ECONOMIC PROFILE OF SLUMS
Thus we note that the Hindu population dominates m all the slums the three
slums. However the good concentration of the Muslim population 30 % is also found in
yamuna pushta.
Caste Composition
As per the caste composition, we divided caste not as the main caste but under
four categories like general, other backward class (as defined by the government of
India), scheduled caste and scheduled tribes.
Tables 3.17 given below shows very vivid picture of the all three samples slums.
General are dominant in the Govindpuri slum with 90 percent of the population. Its share
is 69 percent in Madanpur khader and only 37 percent in yamuna pushta respectively.
One of the important conclusion, we get to know about these slums is that as the income
level of the area get reduced the proportion of the other backward caste. scheduled caste
and scheduled tribe get increased. The fact is clear from the table 3.18, which shows that
Yamuna pushta having lowest income level (the average income level is around Rs 4500)
consist 48 percent of other backward caste, 20 percent of the scheduled caste and 1
108

percent of the scheduled tribe. Same is applicable for the Madanpur khader, which also
contributes 42 percent for OBC,s, 20 percent of SC and 1 percent of STs in the locality.
Table 3.17 CASTE COMPOSITION
CASTE SLUMS(%) COMPOSITION GOVINDPURI MADANPUR
KHADER
GENERAL 90 69
OBC 7 20
. sc 3 10
ST 0
total 100 100
YAMUNA PUSHTA
37
42
20
100
DELHI
73
00 22 05
100
Govindpuri contributes 90 percent of general, 7 percent of OBCs, 3 percent of SC
and zero percent of ST. the proportion of the scheduled caste and the scheduled tribe is
very less in all the three slums. Scheduled caste population is nil in Govindpuri and
Madanpur khader slums.
In Delhi as a whole. the general population dominates the total population
percentage, which is 73 percent. No other backwards class population has been
enumerated by the census so no census results have been constructed. The scheduled
caste and scheduled tribe constitutes 22 percent and 5 percent respectively.
Mother Tongue
Mother tongue is the language in which the person read and speaks in his home
and with his family members. The language by the people is taken as an indicator of their
ethnicity. It indirectly reveals their background in terms of their state of origin. More then
15 languages and dialect are spoken by the sample slum population.
Some languages are spoken by a large number of people namely Hindi and
Punjabi while most of the languages are spoken by fewer people. Table 3.18 gives the
distribution of population of mother tongue as Hindi, Punjabi and other languages. The
table reveals that Hindi and Punjabi are the main languages of the slums dwellers. Other
languages consist of Bhojpuri, Urdu, haryanvi: maithili and Rajasthani contribute very
little to the mother tongue
109

Table 3.18 MOTHER TONGUE
MOTHER SLUMS(%) DELHI
TONGUE GOVINOPURI MADANPUR YAMUNA PlJSHTA KHAOER
-" HINDI 70 92 94 84
PUNJAB! 28 0 OS OTHERS 2 7 6 11
'""'
TOTAL 100 100 100 100
Table 3.18 reveals Hindi contribute largest share for the all the slums, it
contributes 70 percent (Govindpuri), 92 percent (Madanpur khader) and 94 percent
(Yamuna Pushta).Punjabi language is in the good position only in Govindpuri slum. It is
absent in other two slums. The Punjabi families are migrated from the race course slum
and settled in this slum. Other languages contribute 2 percent, 7 percent and 6 percent in
Govindpuri, Madanpur khader and Yamuna Pushta respectively.
In Delhi, Hindi is largest spoken language followed by others and Punjabi respectively.
The large population of the other states namely Tamil, Telagu, Haryanvi. Urdu, Bhojpuri
and Rajasthani etc comes into others category
Family Composition
Family is the integral part of the society on which the whole structure of society is
dependent. Family size denotes the composition of the family.
FAMILY
SIZE GOVINDPURI
N j T
0-2 2 0
3- 5 32 26
6-8 16 22
8+ 0 2
TOTAL 68 50
N=nuclear. J=joint. T= Total
Table 3.19 FAMILY SIZE
SLUMS%
MADANPUR KHADER
N J T
2 2
58 19
38 22
2
100 44
3
19
32
4
68
YAMUNA PUSHTA
N J T
5 2 3
38 25 15 40
52 17 39 56
5 0
100 44 56 100
110

The size reveals the actual no of the people residing in the household. The family
size of the population in all the slums shows very different picture from each other. The
family size is very much related to the economic structure of the slums
Family has been divided into two categories namely joint family and nuclear
family. Joint family is those families that lives with whole of the clan under one roof and
have food with the same kitchen. Nuclear family is those which do not live along with
other member of household and includes husband, wife and children. As per the family
composition in the slums are concerned, shown in table 3 .16. The family composition is
largely dominated by the joint family in the Madanpur khader and Yamuna Pushta
contributing around 72 percent and 64 percent respectively. In Govindpuri, the ratio of
the joint family is less then 42 percent. The proportion of the nuclear family is just the
opposite. It is 58 percent in Govindpuri, 28 percent in Madanpur khader and 36 percent in
Yamuna Pushta respectively. The majority of the families contributing to the joint family
are those families that are totally dependent on the very less paid jobs
Table 3.19 denotes that, the nuclear family contributes 58 percent, 28 percent and
36 percent in Govindpuri, Madanpur khader and yamuna pushta slums respectively. The
joint family contributes 42 percent, 72 percent and 64 percent in Govindpuri, Madanpur
khader and yamuna pushta slums respectively. In Govindpuri slum, the family size
having largest concentration of the family members is concentrated in the age group of 3-
5 and 6-8 family sizes respectively.
Table 3.19 states that; In Govindpuri slums, the median size of the family is 3-5
people per household; contributing around 58 percent of the total household. In the
Madanpur khader and the yamuna pushta slum the median number of the household is 5-
8 persons per household. The total contribution of the 5-8 people per household is very
high in these slums and they contribute 52 percent and 56 percent in Govindpuri,
Madanpur khader respectively.
Family size of 6-8 groups Govindpuri slum contributes only 38 percent of the
total household. More then 8 people per household contribute very less to the total
number of the household. It contributes 2 percent in Govindpuri, 5 percent in Madan pur
khader and only 1 percent in the yamuna pushta. One notable feature of the family size is
111
that the size class 3-5 is the dominant size class in Govindpuri and 6-8 family size in
Madanpur khader and Yamuna pushta respectively.
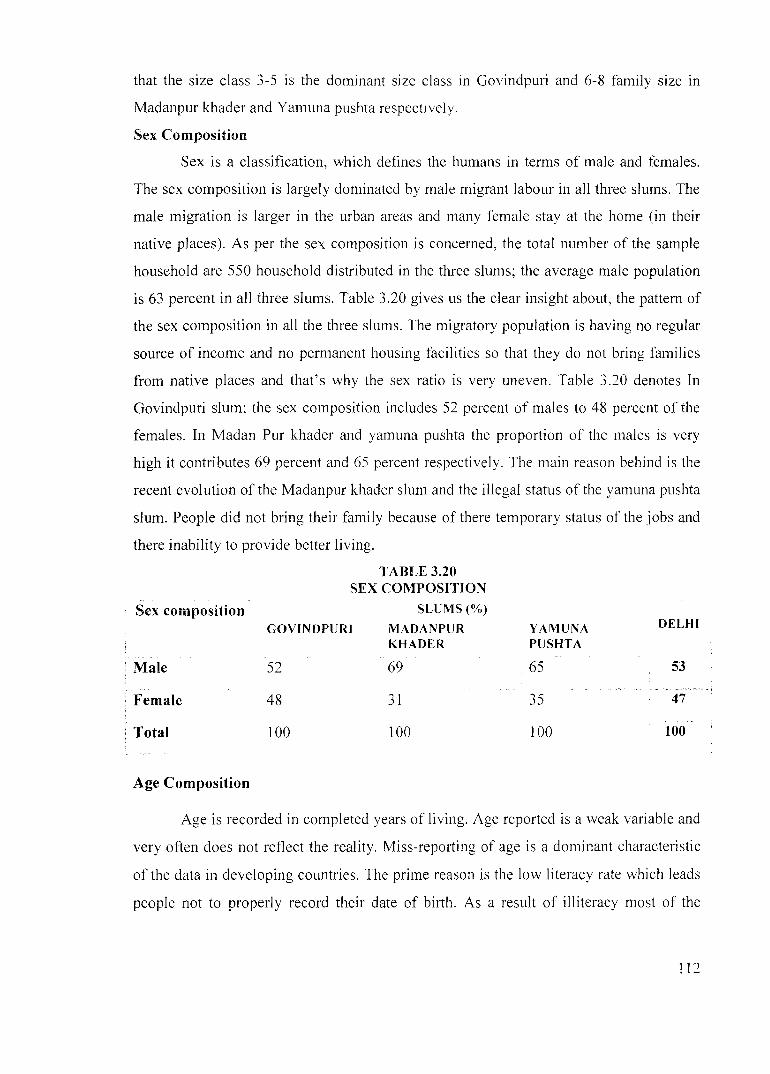
Sex Composition
Sex is a classification, which defines the humans in terms of male and females.
The sex composition is largely dominated by male migrant labour in all three slums. The
male migration is larger in the urban areas and many female stay at the home (in their
native places). As per the sex composition is concerned, the total number of the sample
household are 550 household distributed in the three slums; the average male population
is 63 percent in all three slums. Table 3.20 gives us the clear insight about, the pattern of
the sex composition in all the three slums. The migratory population is having no regular
source of income and no permanent housing facilities so that they do not bring families
from native places and that's why the sex ratio is very uneven. Table 3.20 denotes In
Govindpuri slum: the sex composition includes 52 percent of males to 48 percent of the
females. In Madan Pur khader and yamuna pushta the proportion of the males is very
high it contributes 69 percent and 65 percent respectively. The main reason behind is the
recent evolution of the Madan pur khader slum and the illegal status of the yamuna pushta
slum. People did not bring their family because of there temporary status of the jobs and
there inability to provide better living.
Sex composition
'Male
· Female
: Total
Age Composition
TABLE 3.20 SEX COMPOSITION
SLUMS (0/r•)
GOVINDPURI MADANPUR KHADER
52 69
48 31
100 100
YAMUNA DELHI
PUSHTA
65 53
35 47
100 100
Age is recorded in completed years of living. Age reported is a weak variable and
very often does not reflect the reality. Miss-reporting of age is a dominant characteristic
of the data in developing countries. The prime reason is the low literacy rate which leads
people not to properly record their date of birth. As a result of illiteracy most of the
112
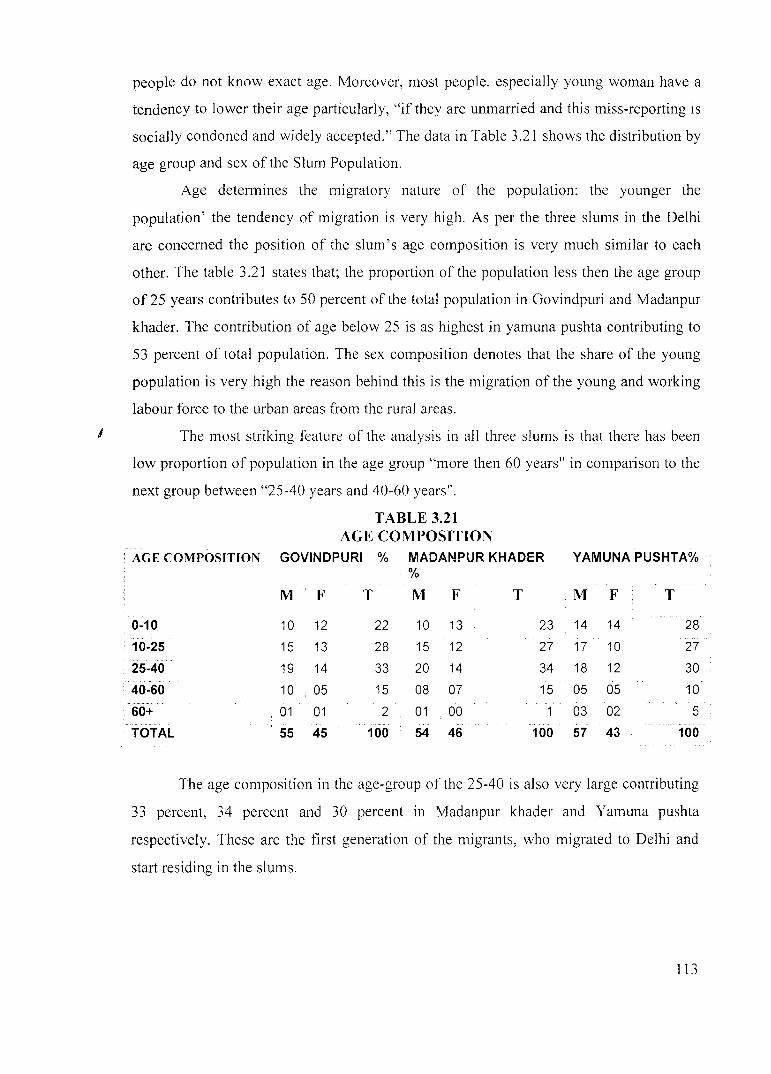
I
people do not know exact age. Moreover, most people, especially young woman have a
tendency to iower their age particularly, "if they are unmarried and this miss-reporting is
socially condoned and widely accepted." The data in Table 3.21 shows the distribution by
age group and sex of the Slum Population.
Age determines the migratory nature of the population: the younger the
population' the tendency of migration is very high. As per the three slums in the Delhi
are concerned the position of the slum's age composition is very much similar to each
other. The table 3.21 states that; the proportion of the population less then the age group
of 25 years contributes to 50 percent of the total population in Govindpuri and Madan pur
khader. The contribution of age below 25 is as highest in yamuna pushta contributing to
53 percent of total population. The sex composition denotes that the share of the young
population is very high the reason behind this is the migration of the young and working
labour force to the urban areas from the rural areas.
The most striking feature of the analysis in all three slums is that there has been
low proportion of population in the age group "more then 60 years" in comparison to the
next group between "25-40 years and 40-60 years".
TABLE 3.21 AGE COMPOSITION
AGE COMPOSITION GOVINDPURI % MADANPUR KHADER YAMUNA PUSHTA% %
M F T M F T M F T
0-10 10 12 22 10 13 23 14 14 28
10-25 15 13 28 15 12 27 17 10 27
25-40 19 14 33 20 14 34 18 12 30
• 40-60 10 05 15 08 07 15 05 05 10
. 60+ 01 01 2 01 00 1 03 02 5
TOTAL 55 45 100 54 46 100 57 43 100
The age composition in the age-group of the 25-40 is also very large contributing
33 percent, 34 percent and 30 percent in Madanpur khader and Yamuna pushta
respectively. These are the first generation of the migrants, who migrated to Delhi and
start residing in the slums.
113

The position and the living standard of the first generation are very problematic in
comparison to the second generation migrants. The age group is only 15 percent in
Govindpuri and Madan pur khader only 10 percent of the population in age group of 40-60
years in yamuna pushta. The senile or old age population in the age group of 60 +
contributes very less proportion of the population in three slums It contributes only
2percenL 1 percent and 5 percent in Govindpuri, Madanpur khader and Yamuna pushta
respectively. The old age population is very scarce, the reason are the low standard of
living, less health facilities, poor nutrition and unhygienic condition. The age composition
is dominating factor in the terms ofthe migration pattern to the slums. Children's and the
working age population are dominant age groups in all three slums. More then 60
population is marginal in Govindpuri and Madanpur khader slums but specific 60 plus
population is very large in yamuna pushta. The reason behind is the joint family structure.
Marital Status
The institution of marriage is universally recognized and subscribed to in Delhi
slums. It directly affects fertility level of the population because conception outside
marnage is strongly frowned upon and religion did not permit conception before
marriage. The marital status is calculated in the age group of the 15-50, the reproductive
age group of the population.
Table 3.22 shows that the majority of the household shows the married status. It is
89 percent, 91 percent and 90 percent for males in Govindpuri, Madanpur khader and
yamuna pushta slums respectively. The female shows larger married status as compared
to males. They are 93 percent, 95 percent and 93 percent in Govindpuri, Madanpur
khader and yamuna pushta slums respectively.
TABLE 3.22 MARITAL STATUS OF THE HEAD OF THE HOUSEHOLD
MARITAL GOVINDPURI MADANPUR KHADER YAMUNA PUSHTA
STATUS M F M F M F
MARRIED 89 93 91 95 90 93 UNMARRRIED II 07 09 05 10 07
TOTAL 100 100 100 100 100 100 MEAN AGE AT 23 20 22 20 20 16
MARRIAGE
114

The largest share of married couples is shown by the Madanpur khader slum and
largest unmarried household belongs to Govindpuri slum. Male show larger unmarried
status then females and they are 11 percent, 9 percent and 1 0 percent in Govindpuri,
Madanpur khader and yamuna pushta slums respectively.
The mean age at marriage is 21.5 years, 21 years and 18 years in Govindpuri,
Madanpur khader and Yamuna Pushta slums respectively.
The reason behind is the household tries to divulge their responsibility faster as
they can. So the girls and boys of very tender age are being married. Due to lowering of
the age group the age of the conception is also very high and due to this the family size is
3-5 in Govindpuri and 6-8 Madanpur khader and Yamuna pushta respectively.
RELIGIOUS COMPOSITION
Religion comprises the major part m the Indian society and the first section
therefore deals with religious composition of the household. As per the population in the
three slums the three slums give different pattern of religious composition.
. RELIGIOUS
' COMPOSITION
HINDU
MUSLIM
SIKH
OTHER
TOTAL
Table 3.23 RELIGIOUS COMPOSITION
GOVINDPURI
100
89
2
8
8
MADNPUR
KHADER
100
84
10
6
6
YAMUNA PUSHTA
100
70
30
0
0
Table 3.23 gives details about the religious composition of the households in the
three slums. The Hindu is dominant religion of the majority of the households,
comprising 89 percent in Govindpuri, 84 percent in the Madanpur khader and 70 percent
in yamuna pushta. The Muslims are the second largest religious category and found to 02
percent, I 0 percent and 30 percent in GovindpurL Madanpur khader and yamuna pushta
respectively. Sikhs contribute very less proportion of the slum population in all three
115

samples. They contribute 8 percent and 6 percent in Govindpuri and the Madanpur
khader respectively. There presence in yamuna pushta is nil. They are the trader
communities having shops in the localities.
Table 3.24 shows that, In all three slums the ratio of four states namely Uttar
Pradesh, Bihar, Rajasthan Haryana and Delhi accounts for 89% of the total migrants and
also these four regions account for majority of Hindu migrant's : Muslim migrant are
mainly from Uttar Pradesh(83.73 percent), Bihar (8.53 percent)and very low percentage
belong to Rajasthan. Only Sikh family, we find in Govindpuri slum, which constitutes
around 2 %of the total population. No Buddhist, Christian and Jain family reside in these
slums.
Table 3.24 RELIGION WISE PERCENTAGE OF TOTAL MIGRANTS
STATES RELIGION GOVINDPlJRI MADANPURKHADER YAMUNA PUSHTA
UTTAR Hindu 62 66 56
PRADESH Muslim JS 34 44
Sikh 00 00 00
Others 00 00 00
BIHAR Hindu 76 70 52
Muslim 22 29 48
Sikh 00 00 00
Others 02 01 00
RAJASTHAN Hindu 70 72 62
Muslim 30 24 38
Sikh 00 00 00
Others 00 24 00
HARYANA Hindu 79 78 68
Muslim 20 21 32
Sikh 01 00 00
Others 00 01 00
·· ofi-lER sr ATE Hindu 82 76 70
Muslim 10 24 28
Sikh 07 00 ()()
Others 01 00 00
116

Income Level of the Head of the Household
The monthly household income has been calculate by aggregating the income of
all household members from all the sources the household have been classified into
household monthly income and monthly per capita income groups. It is seen from the
Table 3.25 that the income level in the yamuna pushta slum is very bad and I 0 percent of
the population lives below the income level of Rs 2000.
The contribution of the population living in between Rs 2000- 4000 is absent in the
Govindpuri slum and 4 percent and 15 percent is contribute by the Madanpur khader and
the yamuna pushta slum. The reason behind the low level of income is due to the fact that
the household are indulged into the lower and the menial jobs mainly related to the
informal sector.
TABLE 3.25 INCOME LEVEL
INCOME LEVEL SLUMS%
GOVINDPURI MADANPURKHADER YAM UNA PUSHTA
0-2000 0 0 10
2000-4000 0 4 15
4000-6000 12 13 51
6000-8000 18 24 20
8000-10000 24 40 4
10000+ 46 19 0
TOTAL 100 100 100
The yamuna pushta slum contributes 51 percent of the total household in the
category of Rs 4000-6000 which is 12 percent in Govindpuri and 13 percent in Madanpur
khader.In 6000-8000 category, the population contribution is 18 percent in Govindpuri,
24 percent in Madanpur khader and 20 percent in the yamuna pushta slum. The
contribution of the Madan pur khader slum is very high in Rs 8000-10000 category, in
which it contributes around 40 percent of the total income level and only 24 percent and 4
percent is contribute by the Govindpuri slum and yamuna pushta slum.
In th income level more then Rs 1 0000, the proportion of the Govindpuri slum is
very high and it contribute 46 percent of the total income level in the Govindpuri slum
and only 19 percent contributed by the Madanpur khader slum. No household in the
yamuna pushta slums have the income level more then Rs 1 0000 is zero. Govindpuri and
117

Madanpur khader contribute 70 percent and 59 percent of the households above Rs 8000
per month. In Yamuna Pushta 76 percent of the population have monthly income below
Rs 6000.
Income Level at the Place of Origin
As we analyse the economic background of three slums at the place of origin, we
see the majority of the lower class and agricultural labourers, low income household and
landless farmers tend to migrate to Delhi slums.
As we compare between the different slums of study area. Here we analyse the
economic background at the pace of origin. We see income levels of all the people are
very less. The highest income group is Govindpuri slum, followed by Madan Pur khader
and the lowest slum income group possessed by Yamuna pushta. The main reason behind
the low income level is due to illegal status of yamuna pushta, less affluent class nearby
and lastly the people inhabit this slum as stop over place. Population in Govindpuri and
yamuna pushta shows very good employment in informal sector and service sector. The
proportion of migrant to the urban population is concerned; the population of slums
contributes very heavily to the urban population
TABLE 3.26 INCOME LEVEL AT THE PLACE OF ORIGIN
INCOME LEVEL SLUMS%
GOVINO PURl MAOANPUR YAMUNA PUSHTA KHAOER
LESS THEN 5000 22 29 49
5000-8000 64 35 39
8000-12000 9 26 12
12000-16000 5 0 0
MORE THEN 16000 2 0 0
TOTAL 100 100 100
Table 3.24 denotes that the income level of the three slums is very diverse in
nature at the place of origin. It is only 22, 29 and 49 percent in the income level of less
then five thousand in Govindpuri, Madanpur khader and yamuna pushta respectively.
118

Largest concentration of income found in the category of 5000-8000, which is 64, 35 and
39 percent in Govindpuri, Madanpur khader and yamuna pushta respectively. In 8000-
12000 Madan pur khader have the largest share contributing 26 percent of the total level.
In the category of 12000-16000 and more then 16000 is only contributed by the
Govindpuri slum. They contribute only 5 and 2 percent respectively.
Income Level of Migrant Families
The income and consumption level of migrant households is generally higher than
that of similarly placed non-migrants but this conclusion needs to be carefully linked to
migration impact as it is generally based on ex-post cross-sectional comparisons. other
studies testify, migrants are not only differentially placed at the entry point, their
differential status also leads to different trajectories, so that changes in post-migration
average incomes may provide only a limited picture of the varied set of changes.
One of the few careful ethnographical studies provides some evidence of
improvement in incomes of seasonal migrants as a result of migration, but these
conclusions need to be supported by other studies.
The monthly aggregate income has been calculated by aggregating the income of
all household members from all the sources. The income level is calculated in terms of
total annual income of the family from all sources
Income level
>25000
25000-50000
50000-100000
<100000
TABLE 3.27 Income Level of Migrants
Covindpuri Madanpur khader
24 28
42 48
32 23
02 OJ
Yamuna pushta
36
44 -··
20
00
The Table 3.27 shows that less well of localities like Madanpur khader and
yamuna pushta contribute 28 and 36 in the income level percent in the income level less
then 25000 and Govindpuri contributes 24 percent of the total population living below
25000 levels. In the income group of 25000-50000, the contribution of income is
distributed as 42, 48 and 44 percent in Govindpuri, Madanpur khader and Yamuna pushta
119

respectively. The situation turn upside down and Govindpuri slum migrants are well of
then Madan Pur khader and yamuna pushta. Govindpuri contributes 32 percent in 50000-
100000 and around 2 percent in more then one Lakh level. Great variation exists because
of the nature of the jobs the residents perform. By this we can conclude that these people are
leading a simple life with some amenities.
Shekhar Mukherji (2004-05) stated m his study of the urban slums of Delhi;
Migrant poor workers appear to be worse off than "other" poor workers. Nearly 23 per
cent of migrant poor workers earn an income of less than Rs 1 ,000 per month whereas the
corresponding figure for "other" is only 14 per cent. Similarly, more than eight percent of
"other" poor workers earn above Rs 3,000 per month, and this is higher than the
percentage of migrant poor. The distinction between the migrant and "other" workers
from non-poor households is also evident. About 11 per cent of "other" workers earn an
income of more than Rs 4,500 per month whereas the corresponding figure for migrant
workers is only three per cent. This seems to mean that "other" workers are better off
than those who migrated in last 10 years or so though in terms of poverty incidence
measured on the basis of consumption expenditure, the opposite appears to be true. This
suggests looking into factors that may explain variations in per capita consumption
expenditure at the household level, which is pursued in the next section.
Education
Education is the development of individuals' capacity to be happy, successful, and
become a productive member of the society. Formal Education, it encompasses teaching
and learning specific knowledge, beliefs, and skills. Informal Education, it is the process
of imbibing knowledge of numbers and language that are taught by parents and other
members of the student's culture and about the functioning of surrounding objects. As per
the education pattern are concerned in all three slums are concerned, the position of the
education is not good. The majority of the slum households are below the school level of
the education ..
120

Table 3.28 LEVEL OF EDUCATION OF MIGRANT HEAD OF THE HOUSEHOLD
SLUMS% EDlJCA TIONAL LEVEL GOVINDPURI MADANPUR YAMUNA
KHADER PUSHTA
ILLITERATE 2 9 20
LITERATE WITHOUT FORMAL EDUCATION 2 6 16
: LIT BUT BELOW PRJ 6 8 14
PRIMARY 25 22 20
MIDDLE 17 20 26
. SECONDERY 12 25 10
HIGH SECONDERY 14 4 2 (
DIPLOMA 5 4
i GRAGUATION 10 2
POST -GRAGUA TION 2 0 0
• TOTAL 100 100 100
Table 3.28 denotes that the level of education in all three slums is not satisfactory
and many families did not have the formal education. The contrition of the illiterate
population is only 2 percent in Govindpuri but it increased to 9 percent and 20 percent in
Madanpur khader and yamuna pushta respectively.
The proportion of population, which is literate without having formal education,
is 2 percent, 7 percent and 17 percent in Govindpuri, Madanpur khader and Yamuna
pushta respectively in three slums. Highest share of education is contributed by the
primary education; it contributes 17 percent, 20 percent and 26 percent in Govindpuri,
Madanpur khader and Yamuna pushta respectively. The people running electric shop or
any formal engineering shop have some diploma courses. This is 5 percent, 4 percent and
1 percent in Govindpuri, Madanpur khader and Yamuna pushta respectively. The level of
education became very scarce after the graduation in Madanpur khader and yamuna
pushta. Only 10 percent in Govindpuri, 2 percent in Madanpur khader and 1 percent in
yamuna pushta are graduate and no person attain the level of the post graduation in two
slums namely Madan pur khader and Yam una Pushta. Only 2 percent of the Govindpuri
populations have the post graduation degree
121

The majority of education level belongs to middle, secondary and higher
secondary level. It is 17, 12 and 14 percent in Govindpuri, 20, 25 and 4 percent in
Madanpur khader and 26, 1 0 and 2 percent in yamuna pushta slum. One noteworthy
feature of the analysis is the level of the secondary education is 25 percent far above
Govindpuri and Yamuna Pushta slum, who have only 12 and I 0 percent in this category.
Occupational Status of the Head of Household
Migrant labourers are exposed to large uncertainties in the potential job market.
To begin with, they have little knowledge of the market and risk high job search costs.
The perceived risks and costs tend to be higher the further they are from home. There are
several ways in which migrants minimise risks and costs. For a number of industries,
recruitment is often done In the urban informal sector, friends and relatives act as a
network and the job market is highly segmented based around people of the same caste,
religion and kinship. Social networks provide initial income support, information,
accommodation, and access to jobs. However, parts of the urban unorganised sector may
also be characterized by a high degree of organised migration, as in the rural areas
discussed above. In the construction industry, workers are largely recruited through
contractors who settle wages, retain part of their earnings apart from payments received
from employer, and sometimes also play supervisory roles
Employment is divided into two parts, first employed and second self employed;
these are further divided into rural and urban areas of origin (Table 3.29).
TABLE 3.29 AREA OF ORIGIN AND THE EMPLOYMENT STATUS OF THE MIGRANTS
Status
Employed
Self employed
RURAL
05
95
Percentage of population
URBAN
95
05
TOTAL
100
100
In the rural areas, the percentage of people having employed status is 05 percent,
03 percent and 01 percent in Govindpuri, Madanpur khader and yamuna pushta slums
respectively. Rest is having self employed status.
122

In the urban areas, the percentage of employed is very high, which is 95 percent,
92 percent and 91 percent in Govindpuri. Madanpur khader and yamuna pushta
respectively.
As we classify the data in terms of employed and self employed, the percentage is
95 percent are self employed and only 5 percent are employed, majority of migrant
families work as agriculturist and due to increasing burden on land led them to leave for
alternate jobs in the urban areas.
Occupation
The principal activity Gob, work or calling) that earns money (regular wage or
salary) is known as the occupation of the person. The occupation is divided into four
parts namely primary, secondary, tertiary (formal) and tertiary (informal).
Given the low educational level and unskilled status workers from the slums tend
to be engaged in low paid unskilled work like porters, loaders, rickshaw pullers,
Construction workers, low grade employees in public undertakings, government and semi
government agencies and private offices as peons and watchman's: among the other
occupation are: petty traders and vendors: carpenters, blacksmiths, lathe workers and
semi professional jobs like compounders, school teachers, clerks and accountants etc on
temporary and permanent basis.
TABLE 3.30 OCCUPATIONAL STATUS IN SIX CATEGORIES
OCCUPATIONAL STATUS
. MANUFUCTURING HH
MANUFACTURING
OHH
TRANSPORT
COMMUNICATION
TRADE
COMMERCE
OTHERS
TOTAL
;\ND
GOVINDPURI MADANPUR KHADER YAMUNA PUSHTA
22 28 24
26 24 12
20
06
09
17
100
24
01
05
18
100
25
00
15
19
100
123

Table 3.30 divides Occupational status is divided into s1x categories, which
includes primary, secondary and tertiary activities are excluded from the list because no
agricultural and allied activities are done in urban areas. Here, the occupational status of
the head of the households includes other six categories - : Manufacturing in household
and Manufacturing other than household contributes 48 percent, 52 percent and 36
percent respectively in Govindpuri, Madanpur khader and yamuna pushta respectively.
The reason behind less manufacturing in yamuna pushta is due to less skilled and
technical specialization.
Transport sector contributes good share in all three slums, which is 20 percent, 24
percent and 25 percent in Govindpuri, Madanpur khader and yamuna pushta respectively.
Here, the majority of people act as driven and contract workers or daily wage earners.
The communication sector in totally contributed by Govindpuri slum and it is 6
percent of the total occupation in Govindpuri and it is only I percent in Madan Pur
khader, yamuna pushta have no head of the household included into communication
sector.
The trade and commerce is 09 percent, 05 percent and 15 percent in Govindpuri,
Madanpur khader and yamuna pushta respectively. In yamuna pushta, the petty vendors
and small investors holds the largest share of occupational status in trade and commerce.
Others occupational shows 17 percent, 18 percent and 19 percent in Govindpuri,
Madanpur khader and yamuna pushta respectively.
3.14 WELLBEING INDEX AND MIGRATION
The following variables have been considered 111 constructing the household
specific wellbeing index: household size, child-woman ratio, per capita total expenditure
(PCE3NH) food and all categories of non-food excluding health expenditure), proportion
of persons in the household who reported illness one year preceding the date of survey
(ILL), percentage of household members who acquired at least primary level education
(PRIM), percentage of members in the age group 15 to 59, proxy for adult potential
earners (PER15-59), age of the household head/principal earner, proxy for experience
particularly in the job market (AG), health expenditure per capita (HPC), and per capita
household income (HHPCI). Variables such as household size, child-woman ratio, and
percentage of ill members in the household, are likely to reduce the wellbeing of the
124

household. Health expenditure per capita on an a priori basis may reduce or raise the
wellbeing of the household though regressions reported in the preceding section indicate
that such expenditure has a positive effect on PCE. On the other hand, other variables
would be expected to enhance wellbeing. Since these variables are heterogeneous, it is
difficult to combine them to indicate an overall living standard of households. Hence,
factor analysis was conducted, and using factor loadings as weights, variables were
combined to generate a composite index of wellbeing or deprivation, denoted as
WELLBEING INDEX (i). This was repeated for each of the significant factors (factors
with Eigen values greater than one), and using the Eigen values as weights,
WELLBEING INDEX (i) s were combined to Form a wellbeing index
n
WELLBEING INDEX~ I FLJ (i) X) J=J
Where, FL is the factor loading, j= 1 ... n corresponding to the number of variables, and I
Represents the I th significant factor.
In the second stage, as mentioned above, the composite indices generated on the basis of
factor loadings for each of the significant factors were combined using the proportion of
eigenvalues as weights.
k
WELLBEING INDE~ i=1
EV (i)
I EV (i)
] WELLBEING INDEX (i), k < n
Where, i range from 1 to k, the number of significant factors.
Using Varimax rotation (in order to obtain statistically independent factors),
results of the factor analysis suggest the presence of two significant factors (Table 3.31 ).
For Factor one (the most dominant, explaining around 69 per cent of the total
variation), household income per capita and the number of working members relative to
household size had the highest loadings. Variables with moderate loadings on this factor
included proportion of persons in the age group 15-59 to total household size, child
woman ratio, household size and per capita consumption expenditure. Loadings for
125

TABLE: 3.31 RESULTS OF FACTOR ANALYSIS BASED ON HOUSEHOLD DATA
·VARIABLES GOVINDPURI MADANPUR KHADER YAMUNA PUSHTA
FACTOR I FACTOR I FACTOR I
HHSZ - 0.21 -0.12 -0.09
PCE3NH 0.22 0.10 0.10
HPC - 0.004 -0.01 0.00
ILL - 0.052 -0.041 -0.040
PRIM 0.008 0.004 0.003
PER 15-59 0.54 0.45 0.12
:CWR -0.29 -0.21 0.19
AG 0.14 0.57 0.53
. HHPC 0.61 0.52 0.48
EIGENVALUES 2.365 2.02 2.590
household size, number of ill population relative to household size, health
expenditure per capita, and child-woman ratio take negative factor loadings while other
variables correspond to positive values. For Factor 2 (which had an eigenvalues of a little
over one), household size and the age of the household head/principal earner have the
highest
Table 3.32 Distribution of Households as Per Wellbeing Index
WELLBEING NO. OF PERCENTAGE COEFFICIENT OF SIZE CLASS HOUSEHOLD SHARE VARIATION IN
WELLBEING INDEX
"
GP MPK yp GP MPK yp GP MPK yp . ~
0-60 30 40 42 10.0 26.7 42.0 26.81 24.47 28.78
: 61-120 92 56 56 30.6 37.3 56.0 19.49 20.17 17.85
121-180 96 53 02 32.0 35.4 02.0 13.44 14.09 11.93
181-240 48 01 00 16.0 00.6 00.0 11.59 10.54 11.78
241-300 34 00 00 11.4 00.0 00.0 10.69 8.95 10.41
· Total 300 150 100 100 100 100 16.04 14.6 13.05
126
loadings. Proportion of ill population per household corresponds to a moderate value with
a negative sign. Child-woman ratio, household income per capita, and consumption
expenditure per capita have low but not negligible factor loadings.
Table 3.32 shows that almost 10 per cent of the sample households correspond to
the lowest size class formed on the basis of composite wellbeing index. On the other
hand, around 28 per cent are located in the top two size classes. The second size class
from the bottom constitutes the largest percentage of households. The wellbeing index is
highly correlated with the income level of the household. The slums like Govindpuri have
the highest level of the well being followed by Madanpur khader and yamuna pushta
respectively
The composite wellbeing index shows that there is a non-linear relationship
between the average wellbeing index and duration of migration (Table 3.33). Those who
have migrated in the last 1 to 10 years and those who have been residing in the city for
the last 21 to 25 years had virtually the same level on the wellbeing index, and this is
considerably higher than the wellbeing index for migrants of 11 to 15 years duration.
The composite wellbeing index, generated by using the factor loadings and the
eigenvalues as weights, suggests that migrants of very long duration are better off than
the rest. Thus, it may be concluded that population mobility is not an irrational decision.
In the long term, there are prospects for upward mobility at the place of destination. An
important policy implication of this finding ~s that while rural development programs
may reduce migration to urban areas, urban employment, shelter, and basic amenities
TABLE 3.33 HOUSEHOLD SPECIFIC WELLBEING INDEX AND DURATION OF MIGRATION
DURATION OF PERCENTAGE OF AVERAGE WELLBEING INDEX MIGRATION
HOUSEHOLD • (YEARS)
GP MPK yp GP MPK yp
1-10 8 100 40 488.85 412(45.54) 365 (41.03) (53.87)
11-15 24 00 36 417.38 00 412 (52.02) (59.18)
16-20 52 00 24 427.86 00 422 (38.25) ( 45.44)
21-25 16 00 00 539.66 00 469 (312.10) (411.66)
127

programs are still important for empowering the urban low income households, many of
whom have been residing in the urban areas for a very long time with limited ties to the
rural sector
Conversely, migrants who have duration of 11 to 15 years have the lowest
wellbeing index value and this is again quite close to the index value of migrants whose
duration is 16 to 20 years. Those whose duration of migration is more than 25 years
(including natives or non-migrants) had the highest value for the wellbeing index though
the coefficient of variation for this category was relatively higher than for others. The
regression of the composite wellbeing index on the duration of migration (excluding the
non-migrant households) reveals a statistically insignificant t-ratio, which supports of the
absence of any stable relationship between duration of migration and the wellbeing index.
On the whole, though there is no strong evidence of gains associated with migration per
se, those who have been residing for a very long time in the urban areas have definitely
benefited from migration. This would explain why migrants do not return to rural areas,
even when mobility does not seem to have improved their living standard in the short or
medium term. With a high intensity of poverty and lack of employment opportunities in
rural areas, the hope that they will be able to experience upward mobility in urban areas
seems to motivate migrants to stay on, particularly recalling the experiences of their
neighbors, relatives, friends, co-villagers, and kith and kin who have resided in urban
areas for more than a quarter century or so. If not within their own lifetime, they may at
least see promising gains for the next generation.
128