Embed Size (px)
Citation preview

12
CHAPTER II
SYNTHESIS AND CHARACTERIZATION BY IR, PMR, 13C
NMR, MASS, UV STUDIES OF BENZOINS AND ITS
DERIVATIVES
2.1. INTRODUCTION
All the substituted benzoins and its derivatives were synthesized using
procedure reported in the literature [1]. All the reagents used for synthesizing the
title compound were of AR grade and the solvents used were commercial products
of the highest available purity. The products were purified by column
chromatography or by PTLC using silica gel [60-120 mesh S.D fine]. Solvents were
purified by the procedures given in ‘Vogel’. High boiling liquids were purified by
distillation under reduced pressure and solid substances by recrystallisation using
suitable solvents [2].
The qualitative analysis on the synthesized compounds has been carried
out using Mass spectrometer to confirm the molecular weight and molecular formula
of the compound. Infrared spectroscopy is used to identify the functional groups of
the synthesized compounds. KBr pellet technique was employed. NMR
spectroscopy is used to determine the molecular structure based on the chemical
environment of the magnetic nuclei like 1H, 13C, 31P etc., even at low concentrations.
This is one of the most powerful non-destructive techniques in elucidating the
molecular structure of the biological and chemical compounds. The optical
absorption range has been carried out to know the suitability of synthesized single
crystals for optical applications.
2.2. SYNTHESIS OF 4 -METHOXY BENZOIN [4MB]
The 4MB was synthesized by benzoin condensation using 4 g of KCN
dissolved in 75 cc of water in a one litre flask. 6.8 g [0.05 mole] of p-anisaldehyde,

13
7 g [0.05 mole] of benzaldeyde and 75 cc of 95% ethanol was added into the flask.
The mixture formed a solution at the boiling temperature and was refluxed for one
and half hours. Steam was then passed through the solution until all the alcohol and
nearly all the unreacted aldehyde were removed. The condensed water was decanted
from the product and latter set aside for crystallization. The product was then
pressed as free as possible from oily material on a suction funnel and washed with
cold alcohol. About 8.1 g [yield: 65%] of crude product was obtained. The crude
mixture was dissolved in alcohol and allowed to crystallize slowly. The 4MB
crystallized out as lumps of long needle. Melting point of the compound was found
to be 110˚C. The yield of pure 4-methoxy benzoin amounted to 50% of the expected
product [Scheme 2.1].
Scheme.2.1 Schematic representation of synthesis of 4MB
Synthesized compound was purified by the successive recrystallization
process. In order to improve the purity of the synthesized compound, the basic
material was purified thoroughly. The purification of 4MB was done by repeated
crystallization and the purity of the material was monitored by TLC and measuring
its melting point in each time.
2.2.1 Mass spectral analysis of 4MB
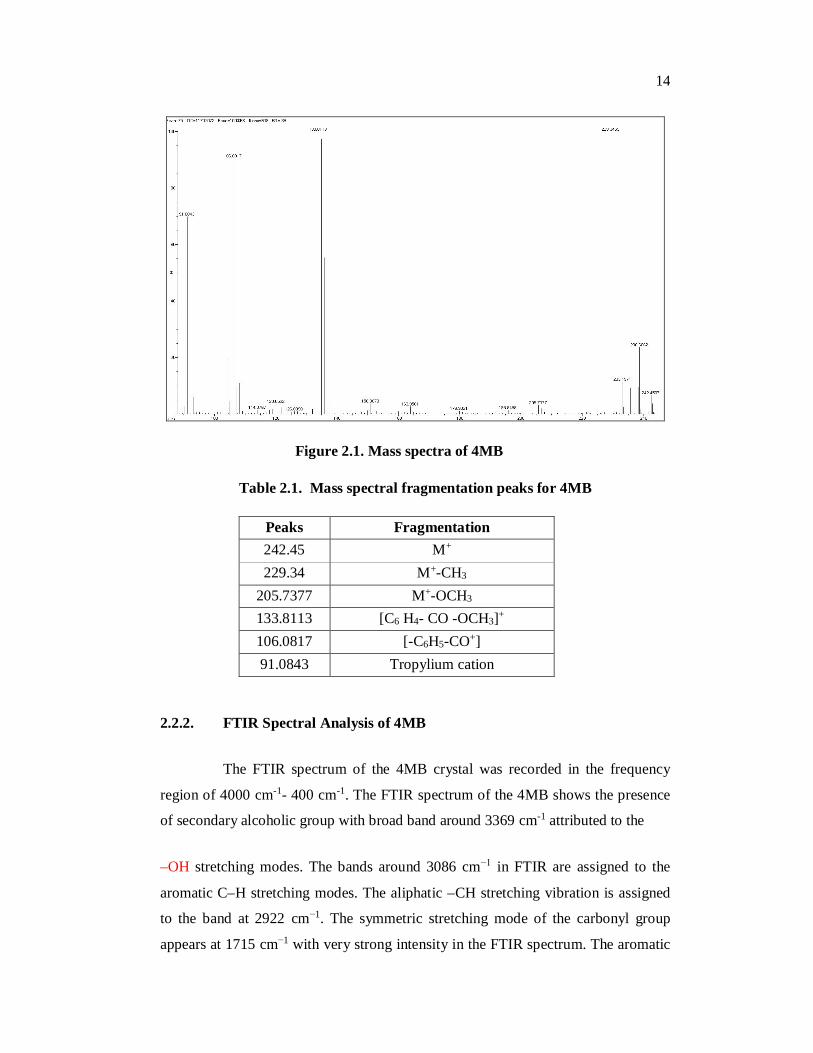
The results of mass spectral analysis [Table 2.1] confirm the molecular
weight [Fig.2.1] and molecular formula of the compound.
14
Figure 2.1. Mass spectra of 4MB
Table 2.1. Mass spectral fragmentation peaks for 4MB
Peaks Fragmentation 242.45 M+ 229.34 M+-CH3
205.7377 M+-OCH3 133.8113 [C6 H4- CO -OCH3]+ 106.0817 [-C6H5-CO+] 91.0843 Tropylium cation
2.2.2. FTIR Spectral Analysis of 4MB
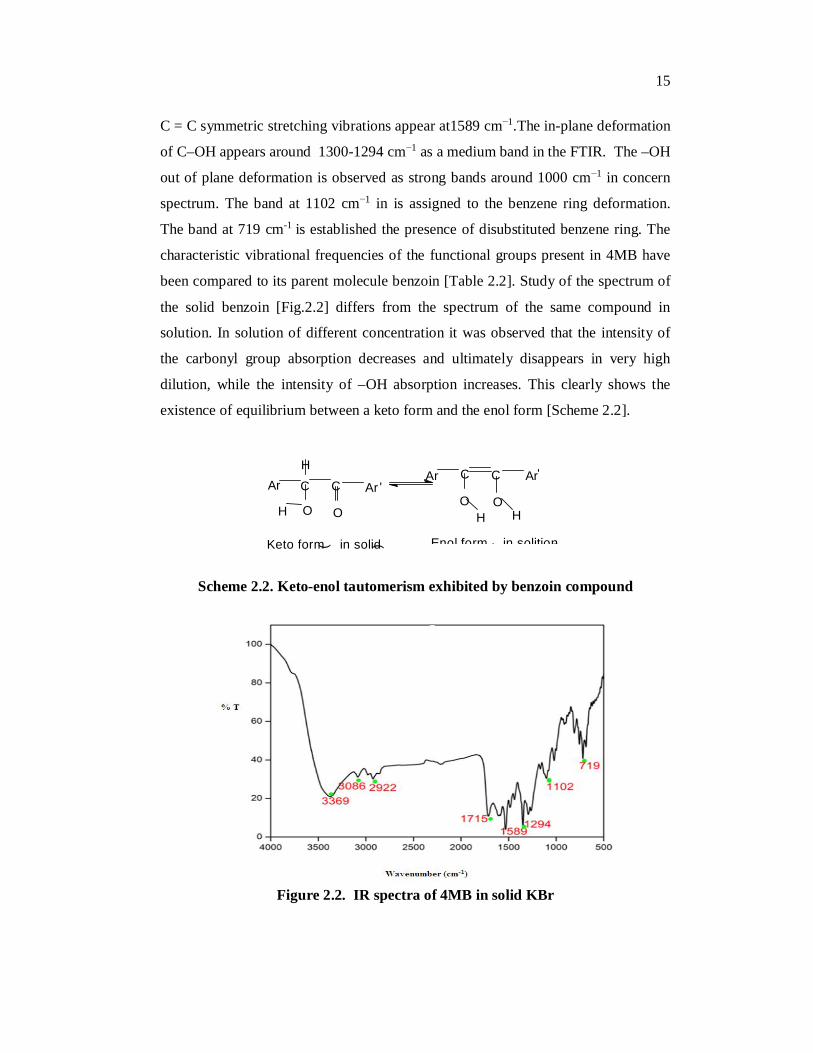
The FTIR spectrum of the 4MB crystal was recorded in the frequency
region of 4000 cm-1- 400 cm-1. The FTIR spectrum of the 4MB shows the presence
of secondary alcoholic group with broad band around 3369 cm-1 attributed to the
–OH stretching modes. The bands around 3086 cm−1 in FTIR are assigned to the
aromatic C–H stretching modes. The aliphatic –CH stretching vibration is assigned
to the band at 2922 cm−1. The symmetric stretching mode of the carbonyl group
appears at 1715 cm−1 with very strong intensity in the FTIR spectrum. The aromatic
15
C = C symmetric stretching vibrations appear at1589 cm−1.The in-plane deformation
of C–OH appears around 1300-1294 cm−1 as a medium band in the FTIR. The –OH
out of plane deformation is observed as strong bands around 1000 cm−1 in concern
spectrum. The band at 1102 cm−1 in is assigned to the benzene ring deformation.
The band at 719 cm-1 is established the presence of disubstituted benzene ring. The
characteristic vibrational frequencies of the functional groups present in 4MB have
been compared to its parent molecule benzoin [Table 2.2]. Study of the spectrum of
the solid benzoin [Fig.2.2] differs from the spectrum of the same compound in
solution. In solution of different concentration it was observed that the intensity of
the carbonyl group absorption decreases and ultimately disappears in very high
dilution, while the intensity of –OH absorption increases. This clearly shows the
existence of equilibrium between a keto form and the enol form [Scheme 2.2].
'Ar
O
'C C
O
Ar
H
H
Enol form ( in solition) Keto form ( in solid)
C C
O
Ar Ar
OH H
Scheme 2.2. Keto-enol tautomerism exhibited by benzoin compound
Figure 2.2. IR spectra of 4MB in solid KBr

16
Table 2.2 Vibrational assignments of the 4MB
FTIR for 4MB [wave number cm-1] Band assignments
3369 cm-1 -OH stretching
3086 cm-1 Aromatic C-H stretching
2922 cm−1[w] Aliphatic C-H stretching
1715 cm-1[vs] Sym C=O stretching
1589 cm-1[vs] Aromatic sym C=C stretching
1300- 1294 cm−1[m] C-OH in plane deformation
1000 cm-1[s] -OH out of plane deformation
1102 cm−1 Presence of Benzene ring deformation
719 cm-1 Disubstituted benzene ring deformation
w:weak; vw:very weak, m:medium, s:strong, vs:very strong.
2.2.3. FT NMR Spectral Analysis of 4MB
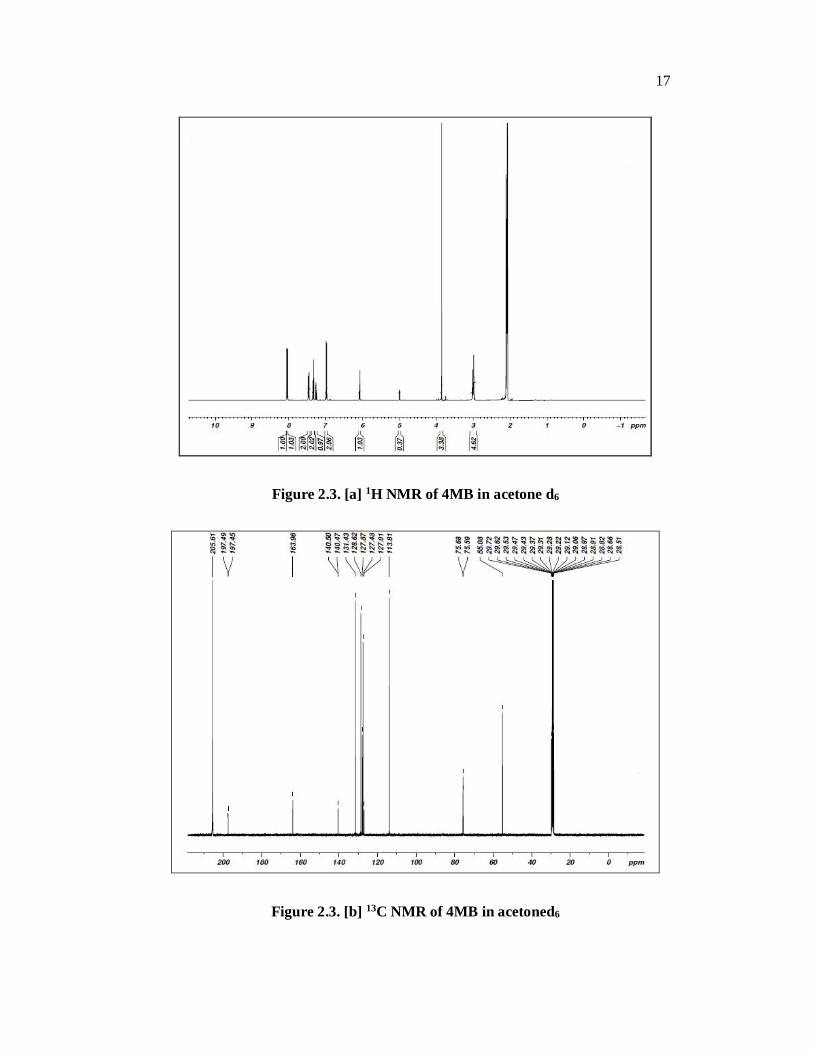
The 1H NMR and 13C NMR spectra of the title compound are presented in
Fig.2.3 [a] and 2.3 [b] respectively. The chemical shifts are tabulated with the
assignments in Table 2.3. In the PMR spectrum of two signals appear in the range
of 2.9 and 3 ppm indicating the presence of a C–H and a –OH protons. A singlet at
3.8 ppm indicates the presence of methoxy group. Signals in the range of 6.8 to
7.48 ppm indicate the presence of aromatic protons. A multiplet around 8.01ppm
indicates the ene-diol –OH protons. In the 13C NMR the aliphatic carbon atoms
appear around 58 ppm, the aromatic carbon atoms appear in the range of 128 to
132 ppm. The signal at 167 ppm indicates the carbonyl carbon and that at 197 ppm
indicates the ene-diol carbon atom.
17
Figure 2.3. [a] 1H NMR of 4MB in acetone d6
Figure 2.3. [b] 13C NMR of 4MB in acetoned6
18
Table 2.3. The chemical shift in 1H NMR and 13C NMR spectrum of 4MB
Spectrum Signal [ppm] Group identification
2.9-3[d] C-H of –OH proton 1H NMR 3.8 [singlet] Methoxy group of 4MB
6.9 to 7.5 [multiplet] Aromatic protons
8.01 ppm enediol of –OH protons 13C NMR 58 ppm Aliphatic carbon atoms
128 to 138 ppm Aromatic carbon atoms
167 ppm Carbonyl carbon of 4MB
197 ppm Ene-diol carbon atom
2.2.4. UV-Visible Spectral Analysis of 4MB
From the absorbance spectrum, it was found that there is almost no
absorbance in the entire visible region. This indicates the crystal of 4MB is a
potential material for optical device fabrication [3]. Strong absorption band is
observed in UV-VIS region in the range of 320-400 nm with fine structure [Fig.2.4].
Another strong absorption appears between 210-300 nm. The former can be
attributed to the absorption due to benzene rings and the latter to the carbonyl group.
The crystal is transparent in the entire visible region which is key factor for this
compound as it is be exploited for NLO applications in the room temperature [4].
The absorption of UV and visible light involves promotion of the electron in the
n and orbital from the ground state to higher states. Very good optical absorbance
with the lower cut-off wavelength of 240 nm may be attributed to → * or
n→ * transitions. The absence of strong absorption in the region between
400 nm to 1000 nm in UV–Vis spectrum shows that the 4MB crystals are useful for
the SHG application.

19
Figure 2.4. UV spectra of 4MB
2.3. SYNTHESIS AND PURIFICATION OF 2-CHLORO-4′METHOXY
BENZOIN [2C4MB]
2C4MB compound was synthesized by benzoin condensation using 4 g of
KCN dissolved in 75 cc of water in a one litre flask. About 6.8 g [0.05 mole] of
4-methoxy benzaldeyde, 7 g [0.05 mole] of 2-chloro benzaldeyde and 75 cc of 95 %
ethanol was added into the flask. The mixture was formed a solution at the boiling
temperature and was refluxed for one and half hour. Steam was then passed through
the solution until all the alcohol and nearly all the unreacted aldehyde were
removed. The condensed water was decanted from the product and latter set aside
for crystallisation. The product was then pressed as free as possible from oily
material on a suction funnel and washed with cold alcohol. By this way about 14 g
[yield was 60 %] of crude product was obtained. The crude mixture was dissolved in
hot alcohol and allowed to crystallise slowly [Scheme 2.3]. The 2-chloro-4′-methoxy
benzoin crystallizing out as colourless, hexagonal crystals suitable for X-ray
diffraction study was obtained [5]. Melting point of the compound was found to be
84˚C. The yield of pure 2-chloro-4′methoxy benzoin is amounted to 60-70 % [6].
20
CH
OH
C
O
Cl
OCH3
Cl
CHO OCH3OHC alc.KCN
4-methoxy benzaldehyde
2-chloro-4'methoxy benzoin
+
2-chloro benzaldehyde
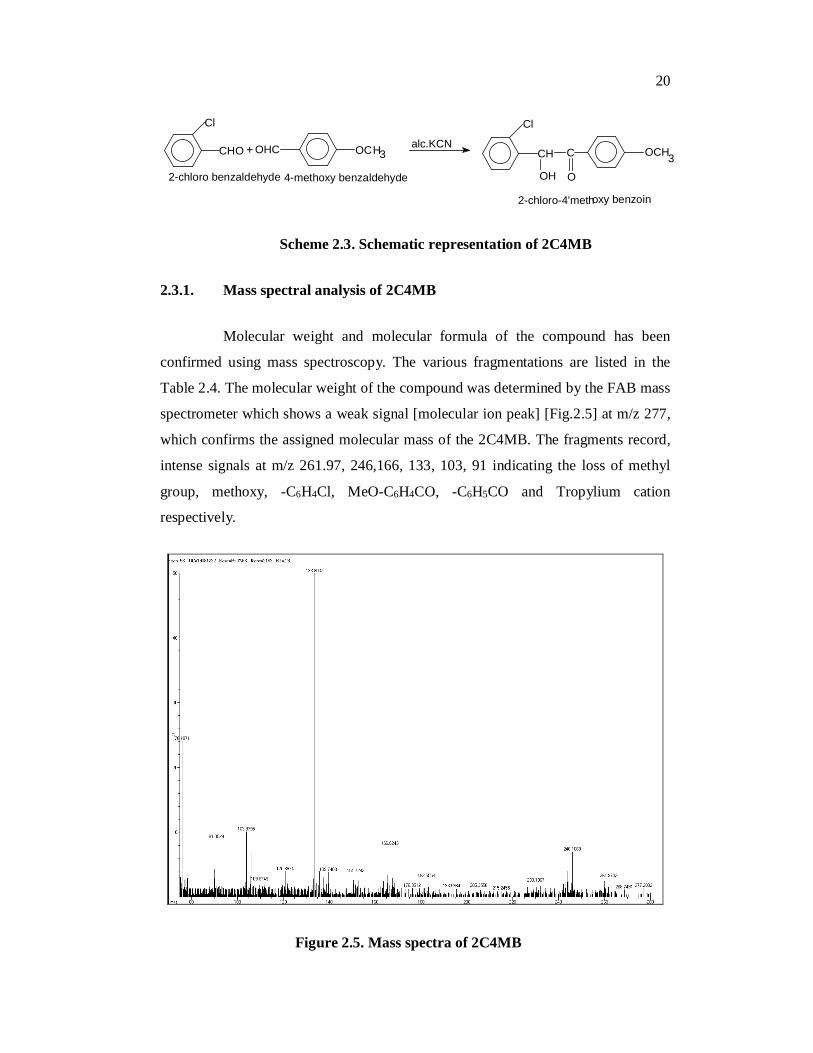
Scheme 2.3. Schematic representation of 2C4MB
2.3.1. Mass spectral analysis of 2C4MB
Molecular weight and molecular formula of the compound has been
confirmed using mass spectroscopy. The various fragmentations are listed in the
Table 2.4. The molecular weight of the compound was determined by the FAB mass
spectrometer which shows a weak signal [molecular ion peak] [Fig.2.5] at m/z 277,
which confirms the assigned molecular mass of the 2C4MB. The fragments record,
intense signals at m/z 261.97, 246,166, 133, 103, 91 indicating the loss of methyl
group, methoxy, -C6H4Cl, MeO-C6H4CO, -C6H5CO and Tropylium cation
respectively.
Figure 2.5. Mass spectra of 2C4MB
21
Table 2.4. Mass spectral fragmentation peaks for 2C4MB
Peaks Fragmentation 277.092 M+
261.9 M+-CH3 246 M+-OCH3 166 M+-C6H4Cl 133 MeO-C6H4CO 103 [-C6H5-CO+] 91 Tropylium cation
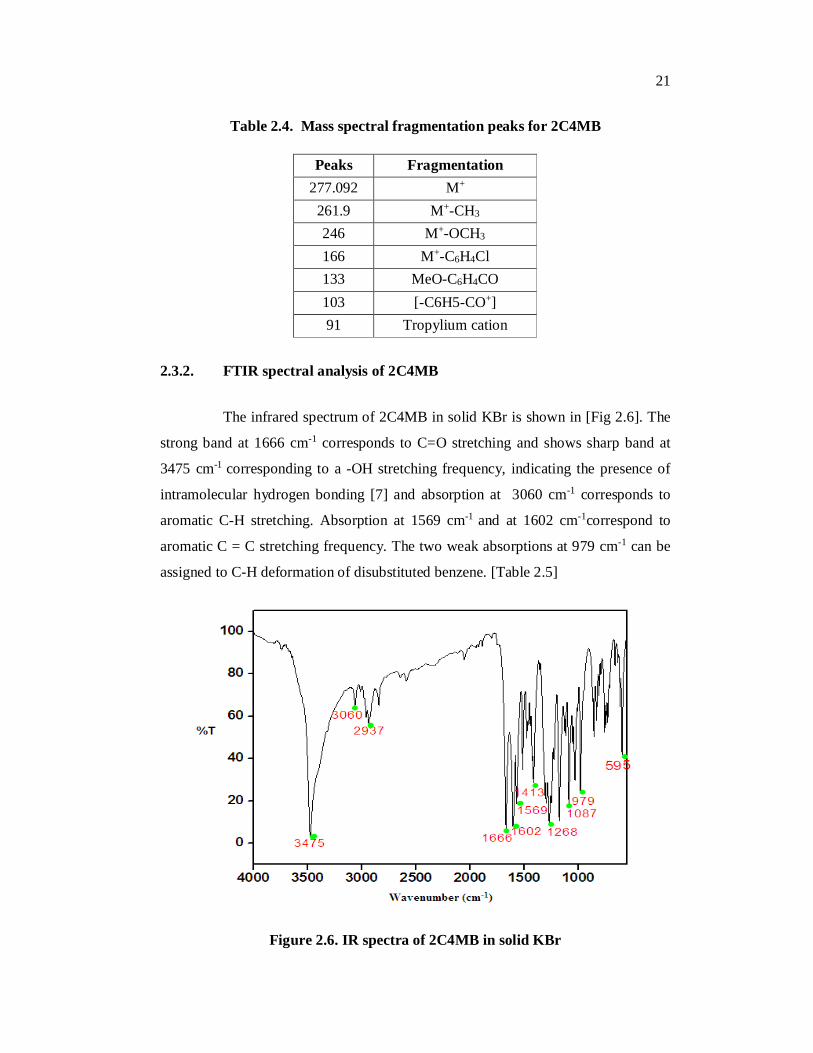
2.3.2. FTIR spectral analysis of 2C4MB
The infrared spectrum of 2C4MB in solid KBr is shown in [Fig 2.6]. The
strong band at 1666 cm-1 corresponds to C=O stretching and shows sharp band at
3475 cm-1 corresponding to a -OH stretching frequency, indicating the presence of
intramolecular hydrogen bonding [7] and absorption at 3060 cm-1 corresponds to
aromatic C-H stretching. Absorption at 1569 cm-1 and at 1602 cm-1correspond to
aromatic C = C stretching frequency. The two weak absorptions at 979 cm-1 can be
assigned to C-H deformation of disubstituted benzene. [Table 2.5]
Figure 2.6. IR spectra of 2C4MB in solid KBr
22
Table 2.5. Vibrational assignments of the 2C4MB
FTIR for 2C4MB [wavenumber]
]]cm-1]
Band assignments
3475 cm-1 -OH stretching
3060 cm-1 Aromatic C-H stretching
2937 cm−1[w] Aliphatic C-H stretching
1666 cm-1[vs] Sym C=O stretching
1569,1602 cm-1[vs] Aromatic sym C=C stretching
1268 cm−1[m] C-OH in plane deformation
979 cm-1[s] -OH out of plane deformation
1087 cm−1 and 1030 cm−1 Presence of Benzene ring
deformation w:weak; vw:very weak, m:medium, s:strong, vs:very strong.
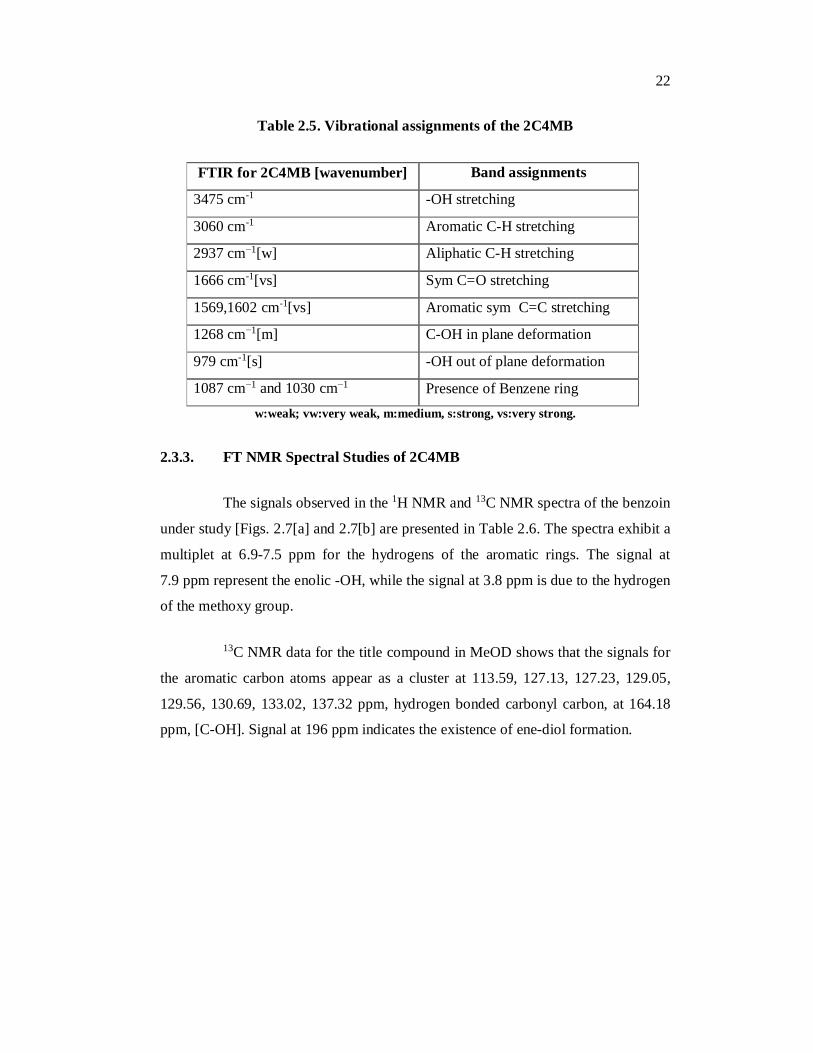
2.3.3. FT NMR Spectral Studies of 2C4MB
The signals observed in the 1H NMR and 13C NMR spectra of the benzoin
under study [Figs. 2.7[a] and 2.7[b] are presented in Table 2.6. The spectra exhibit a
multiplet at 6.9-7.5 ppm for the hydrogens of the aromatic rings. The signal at
7.9 ppm represent the enolic -OH, while the signal at 3.8 ppm is due to the hydrogen
of the methoxy group.
13C NMR data for the title compound in MeOD shows that the signals for
the aromatic carbon atoms appear as a cluster at 113.59, 127.13, 127.23, 129.05,
129.56, 130.69, 133.02, 137.32 ppm, hydrogen bonded carbonyl carbon, at 164.18
ppm, [C-OH]. Signal at 196 ppm indicates the existence of ene-diol formation.

23
Figure.2.7. [a] 1H NMR spectra of 2C4MB
Figure 2.7. [b] 13C NMR of 2C4MB in MeOD
24
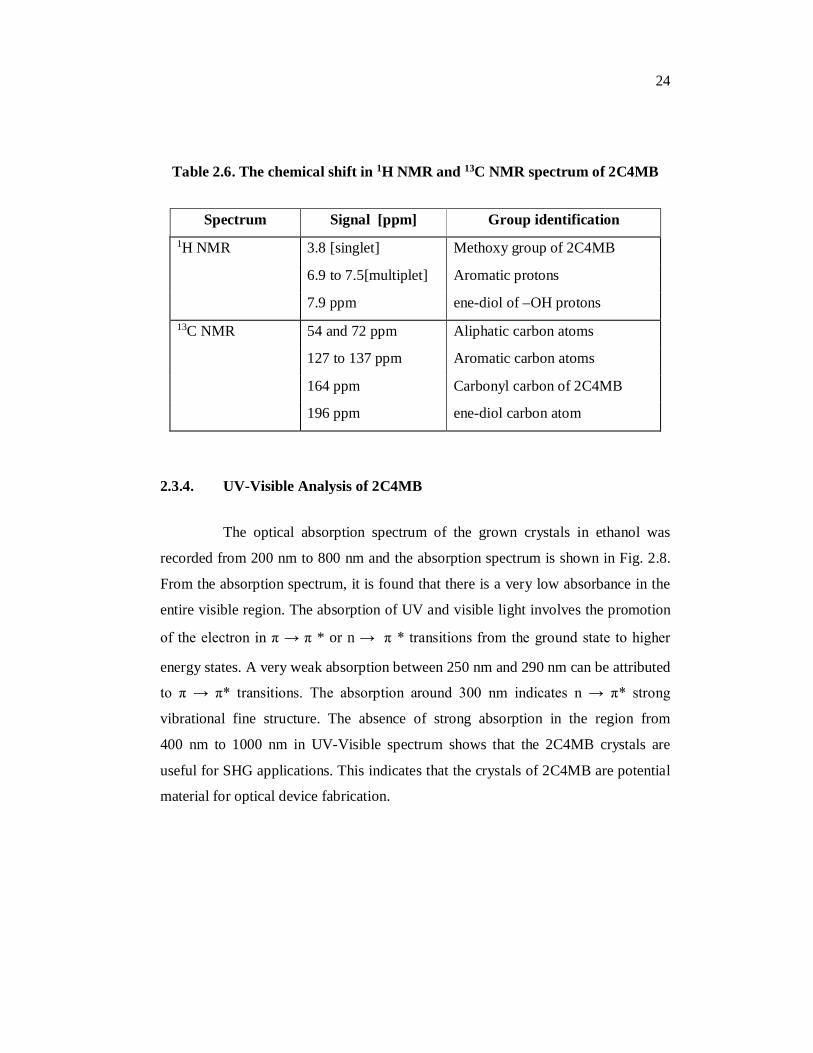
Table 2.6. The chemical shift in 1H NMR and 13C NMR spectrum of 2C4MB
Spectrum Signal [ppm] Group identification 1H NMR 3.8 [singlet] Methoxy group of 2C4MB
6.9 to 7.5[multiplet] Aromatic protons
7.9 ppm ene-diol of –OH protons 13C NMR 54 and 72 ppm Aliphatic carbon atoms
127 to 137 ppm Aromatic carbon atoms
164 ppm Carbonyl carbon of 2C4MB
196 ppm ene-diol carbon atom
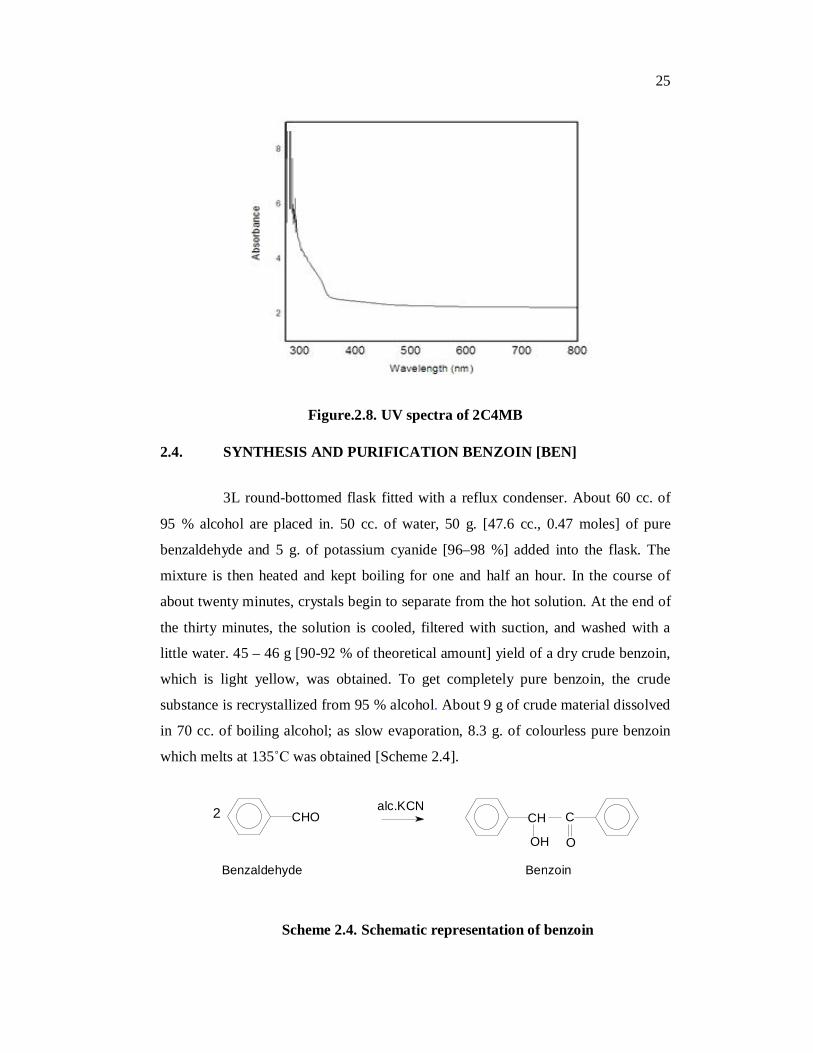
2.3.4. UV-Visible Analysis of 2C4MB
The optical absorption spectrum of the grown crystals in ethanol was
recorded from 200 nm to 800 nm and the absorption spectrum is shown in Fig. 2.8.
From the absorption spectrum, it is found that there is a very low absorbance in the
entire visible region. The absorption of UV and visible light involves the promotion
of the electron in π → π * or n → π * transitions from the ground state to higher
energy states. A very weak absorption between 250 nm and 290 nm can be attributed
to π → π* transitions. The absorption around 300 nm indicates n → π* strong
vibrational fine structure. The absence of strong absorption in the region from
400 nm to 1000 nm in UV-Visible spectrum shows that the 2C4MB crystals are
useful for SHG applications. This indicates that the crystals of 2C4MB are potential
material for optical device fabrication.
25
Figure.2.8. UV spectra of 2C4MB
2.4. SYNTHESIS AND PURIFICATION BENZOIN [BEN]
3L round-bottomed flask fitted with a reflux condenser. About 60 cc. of
95 % alcohol are placed in. 50 cc. of water, 50 g. [47.6 cc., 0.47 moles] of pure
benzaldehyde and 5 g. of potassium cyanide [96–98 %] added into the flask. The
mixture is then heated and kept boiling for one and half an hour. In the course of
about twenty minutes, crystals begin to separate from the hot solution. At the end of
the thirty minutes, the solution is cooled, filtered with suction, and washed with a
little water. 45 – 46 g [90-92 % of theoretical amount] yield of a dry crude benzoin,
which is light yellow, was obtained. To get completely pure benzoin, the crude
substance is recrystallized from 95 % alcohol. About 9 g of crude material dissolved
in 70 cc. of boiling alcohol; as slow evaporation, 8.3 g. of colourless pure benzoin
which melts at 135˚C was obtained [Scheme 2.4].
Scheme 2.4. Schematic representation of benzoin
CHO 2 alc.KCN CH
OH
C
O
Benz a ldehy de Be nz oin

26
2.4.1. Mass spectral analysis of BEN
The results of mass spectral analysis [Table 2.7] confirm the molecular
weight [Fig.2.9] and molecular formula of the compound.
Figure 2.9. Mass spectra of BEN
Table 2.7. Mass spectral fragmentation peaks for BEN
Peaks Fragmentation
212 M+
106 [-C6H5-CO+]
91.0 Tropylium cation
2.4.2. FTIR Spectral Analysis of BEN
The FTIR spectrum of the BEN shows the presence of secondary
alcoholic group with broad band around 3415 cm-1 attributed to the O–H stretching
modes. The bands around 3059 cm-1 in FTIR are assigned to the aromatic

27
C–H stretching modes. The aliphatic -CH stretching vibration is assigned to the
band at 2932 cm-1 in FTIR with weak intensity. The symmetric stretching mode of
the carbonyl group appears at 1678 cm-1 with very strong intensity in the FTIR
spectrum. The aromatic C=C symmetric stretching vibrations appear at 1595 cm-1 as
a very strong intensity in FTIR. The in-plane deformation of C–OH appears around
1262 - 1206 cm−1 as a medium band in the FTIR. The -OH out of plane deformation
is observed as strong bands around 1000 cm−1 in FTIR. The band at 1082 cm−1 and
1068 cm−1 in FTIR is assigned to the benzene ring deformation. [Table 2.8] The
band at 754 cm−1 in FTIR established the presence of disubstituted benzene ring
[Fig.2.10].
Figure 2.10. IR spectra of BEN in solid KBr
28
Table 2.8. Vibrational assignments of the BEN
FTIR for BEN [wavenumber] cm-1] Band assignments
3415 cm-1 -OH stretching
3059 cm-1, 3028 cm-1 Aromatic C-H stretching
2932 cm−1[w] Aliphatic C-H stretching
1678 cm-1[vs] Sym C=O stretching
1595 cm-1[vs] Aromatic sym C=C stretching
1262- 1206 cm−1[m] C-OH in plane deformation
1000 cm-1[s] -OH out of plane deformation
754 cm-1 Disubstituted benzene ring deformation
w:weak; vw:very weak, m:medium, s:strong, vs:very strong.
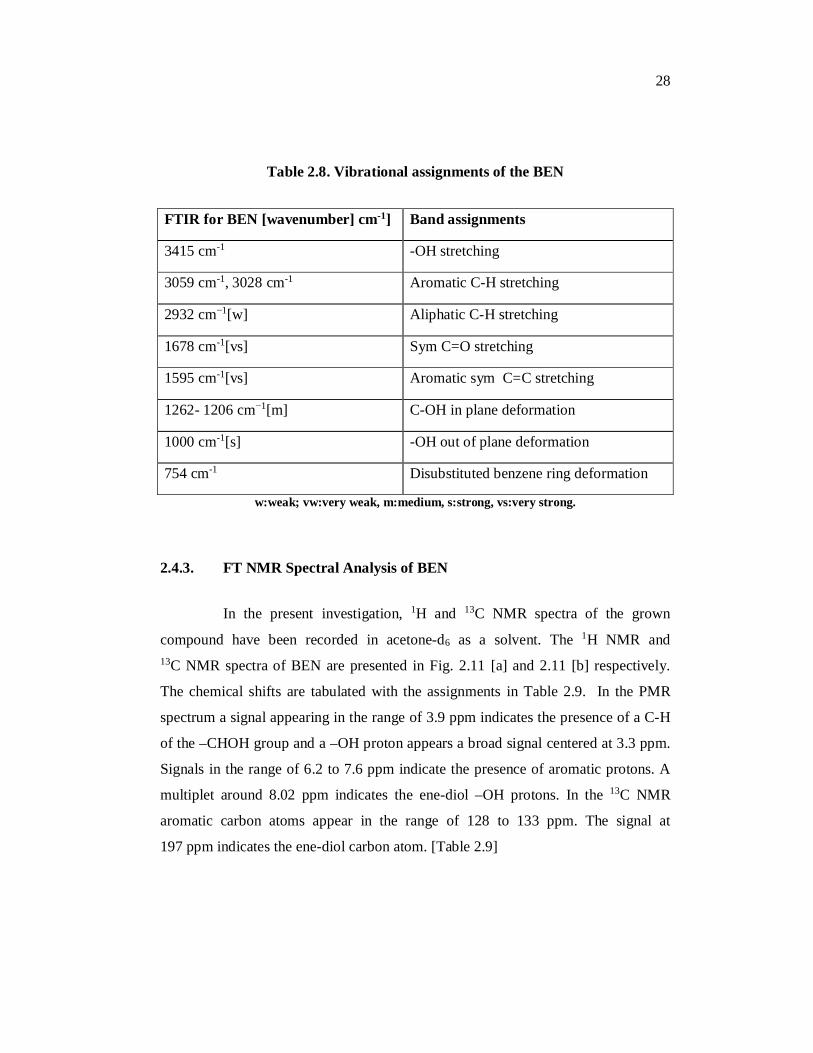
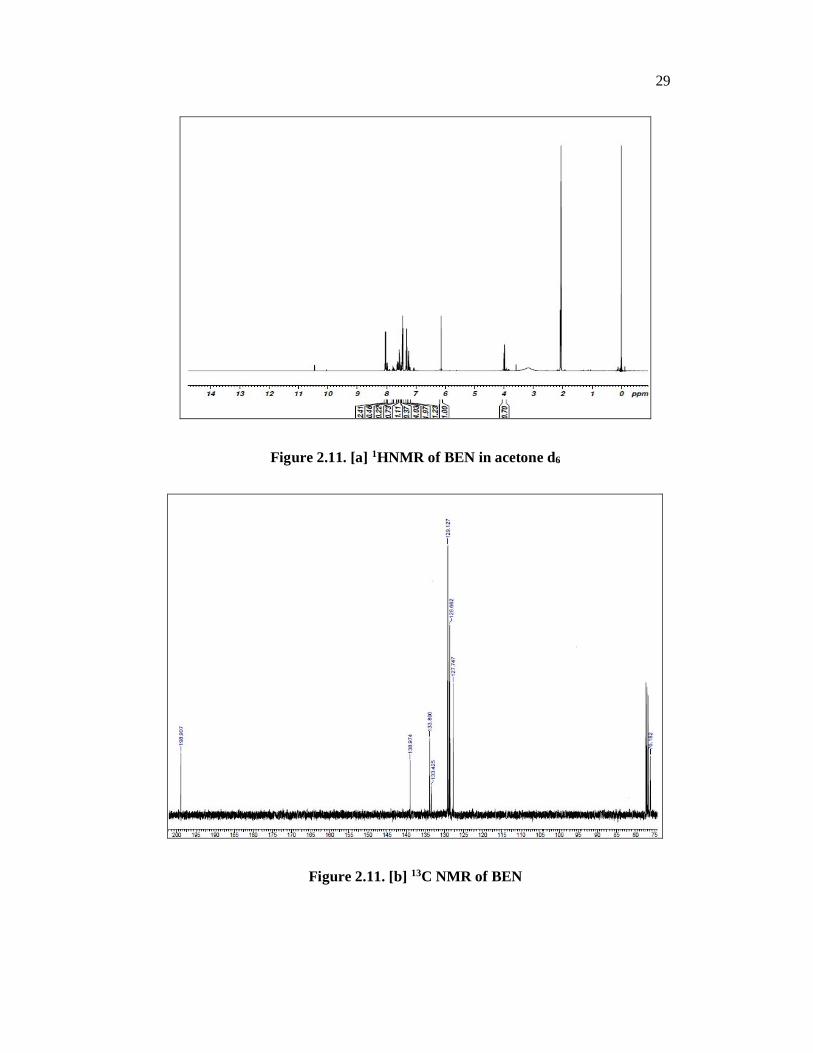
2.4.3. FT NMR Spectral Analysis of BEN
In the present investigation, 1H and 13C NMR spectra of the grown
compound have been recorded in acetone-d6 as a solvent. The 1H NMR and 13C NMR spectra of BEN are presented in Fig. 2.11 [a] and 2.11 [b] respectively.
The chemical shifts are tabulated with the assignments in Table 2.9. In the PMR
spectrum a signal appearing in the range of 3.9 ppm indicates the presence of a C-H
of the –CHOH group and a –OH proton appears a broad signal centered at 3.3 ppm.
Signals in the range of 6.2 to 7.6 ppm indicate the presence of aromatic protons. A
multiplet around 8.02 ppm indicates the ene-diol –OH protons. In the 13C NMR
aromatic carbon atoms appear in the range of 128 to 133 ppm. The signal at
197 ppm indicates the ene-diol carbon atom. [Table 2.9]
29
Figure 2.11. [a] 1HNMR of BEN in acetone d6
Figure 2.11. [b] 13C NMR of BEN
30
Table 2.9. The chemical shift in 1H NMR and 13C NMR spectrum of BEN
Spectrum Signal [ppm] Group identification 1H NMR 3.3 ppm -CHOH proton
6.2 to 7.6 ppm [multiplet] Aromatic protons
8.02 ppm Ene-diol of –OH protons 13C NMR 76 ppm Aliphatic carbon atoms
128 to 133 ppm Aromatic carbon atoms
197 ppm Ene-diol carbon atom
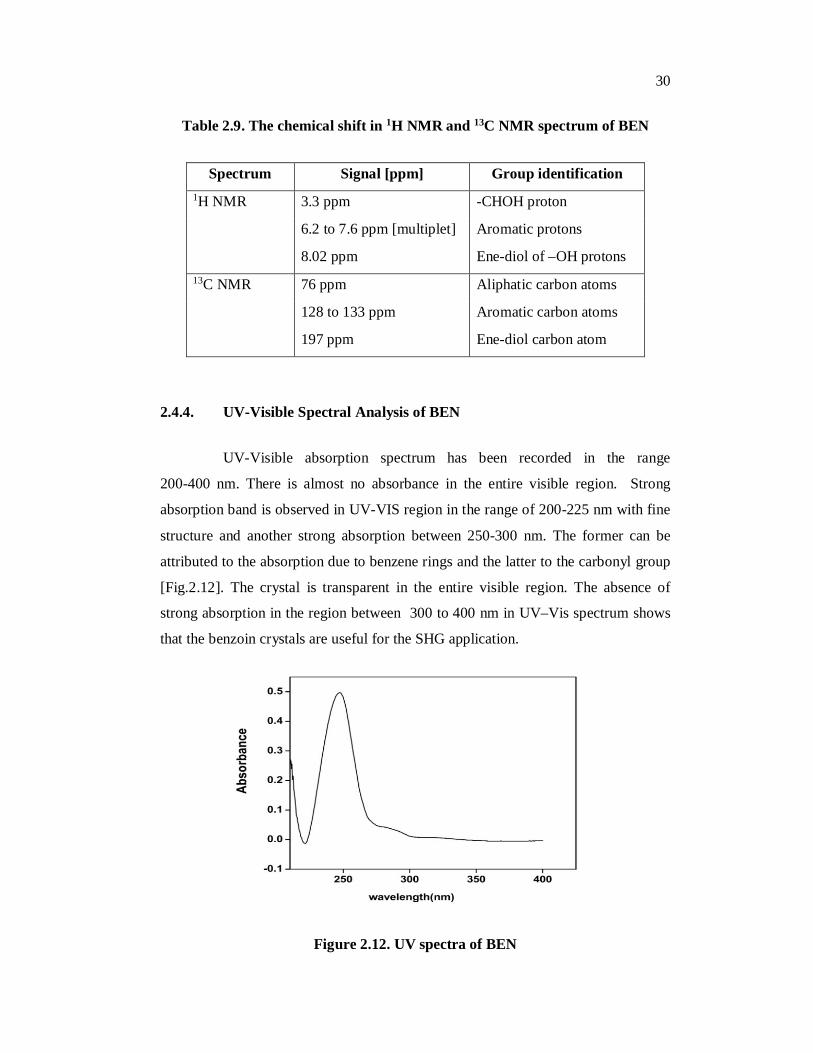
2.4.4. UV-Visible Spectral Analysis of BEN
UV-Visible absorption spectrum has been recorded in the range
200-400 nm. There is almost no absorbance in the entire visible region. Strong
absorption band is observed in UV-VIS region in the range of 200-225 nm with fine
structure and another strong absorption between 250-300 nm. The former can be
attributed to the absorption due to benzene rings and the latter to the carbonyl group
[Fig.2.12]. The crystal is transparent in the entire visible region. The absence of
strong absorption in the region between 300 to 400 nm in UV–Vis spectrum shows
that the benzoin crystals are useful for the SHG application.
Figure 2.12. UV spectra of BEN
31
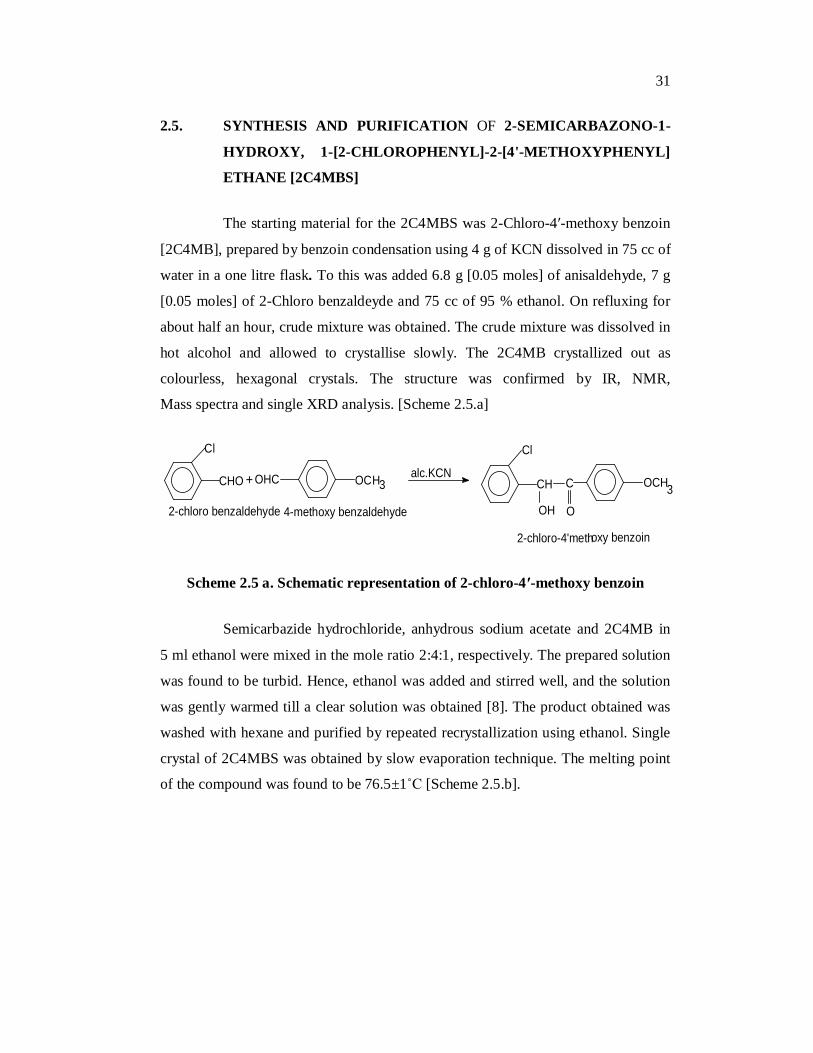
2.5. SYNTHESIS AND PURIFICATION OF 2-SEMICARBAZONO-1-
HYDROXY, 1-[2-CHLOROPHENYL]-2-[4'-METHOXYPHENYL]
ETHANE [2C4MBS]
The starting material for the 2C4MBS was 2-Chloro-4′-methoxy benzoin
[2C4MB], prepared by benzoin condensation using 4 g of KCN dissolved in 75 cc of
water in a one litre flask. To this was added 6.8 g [0.05 moles] of anisaldehyde, 7 g
[0.05 moles] of 2-Chloro benzaldeyde and 75 cc of 95 % ethanol. On refluxing for
about half an hour, crude mixture was obtained. The crude mixture was dissolved in
hot alcohol and allowed to crystallise slowly. The 2C4MB crystallized out as
colourless, hexagonal crystals. The structure was confirmed by IR, NMR,
Mass spectra and single XRD analysis. [Scheme 2.5.a]
CH
OH
C
O
Cl
OCH3
Cl
CHO OCH3OHC alc.KCN
4-methoxy benzaldehyde
2-chloro-4'methoxy benzoin
+
2-chloro benzaldehyde
Scheme 2.5 a. Schematic representation of 2-chloro-4′-methoxy benzoin
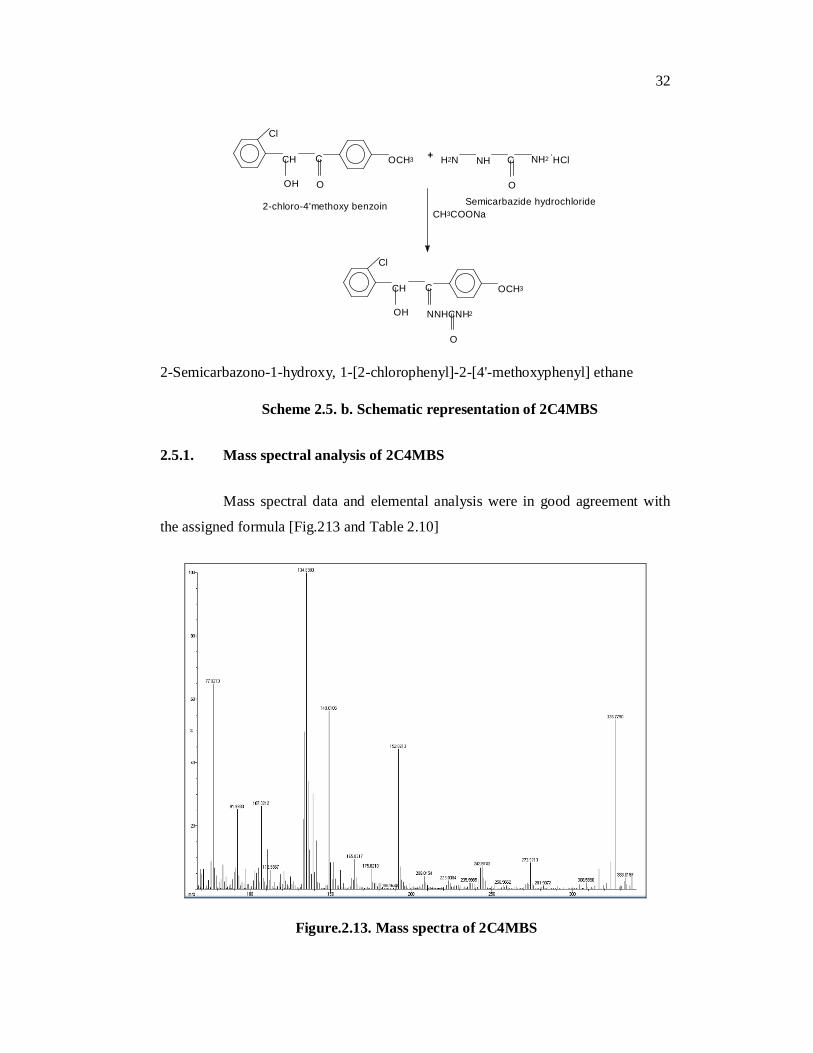
Semicarbazide hydrochloride, anhydrous sodium acetate and 2C4MB in
5 ml ethanol were mixed in the mole ratio 2:4:1, respectively. The prepared solution
was found to be turbid. Hence, ethanol was added and stirred well, and the solution
was gently warmed till a clear solution was obtained [8]. The product obtained was
washed with hexane and purified by repeated recrystallization using ethanol. Single
crystal of 2C4MBS was obtained by slow evaporation technique. The melting point
of the compound was found to be 76.5±1˚C [Scheme 2.5.b].
32
+ NH2 H2N NH C
O
. HCl
CH3COONa
OCH3
Cl
CH
OH
C
O
OCH3
Cl
CH
OH
C
NNHCNH2
O
2-chloro-4'methoxy benzoin Semicarbazide hydrochloride
2-Semicarbazono-1-hydroxy, 1-[2-chlorophenyl]-2-[4'-methoxyphenyl] ethane
Scheme 2.5. b. Schematic representation of 2C4MBS
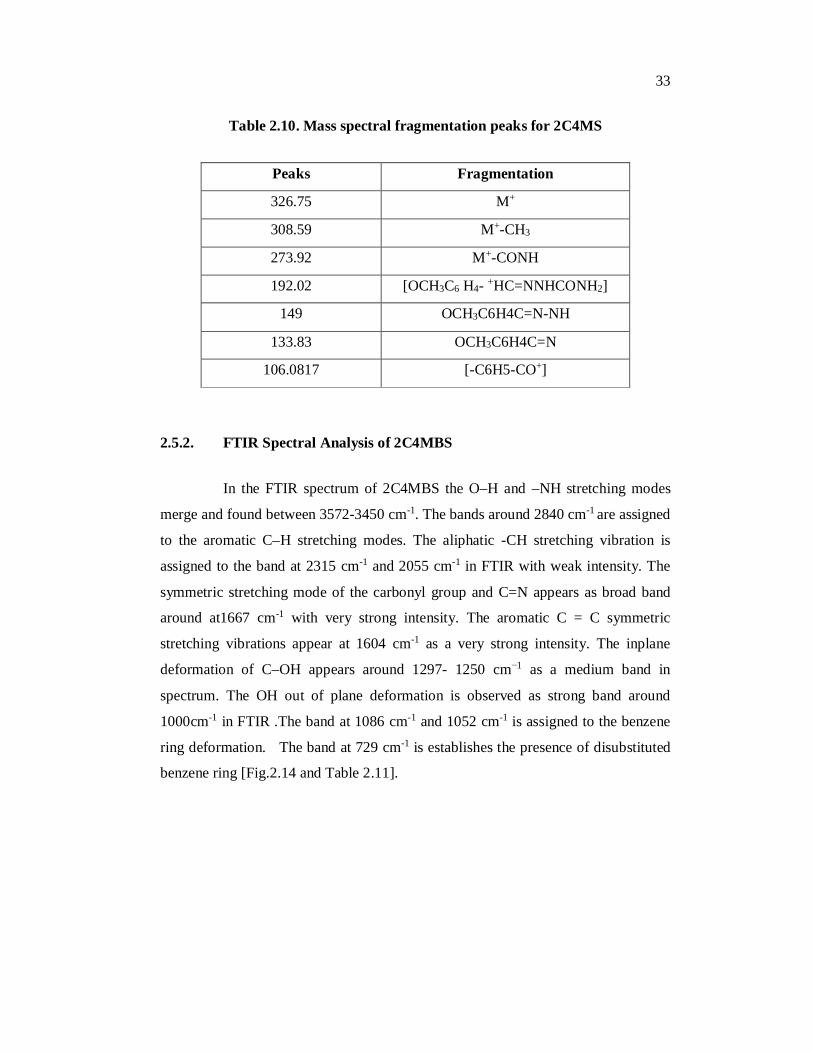
2.5.1. Mass spectral analysis of 2C4MBS
Mass spectral data and elemental analysis were in good agreement with
the assigned formula [Fig.213 and Table 2.10]
Figure.2.13. Mass spectra of 2C4MBS
33
Table 2.10. Mass spectral fragmentation peaks for 2C4MS
Peaks Fragmentation
326.75 M+
308.59 M+-CH3
273.92 M+-CONH
192.02 [OCH3C6 H4- +HC=NNHCONH2]
149 OCH3C6H4C=N-NH
133.83 OCH3C6H4C=N
106.0817 [-C6H5-CO+]
2.5.2. FTIR Spectral Analysis of 2C4MBS
In the FTIR spectrum of 2C4MBS the O–H and –NH stretching modes
merge and found between 3572-3450 cm-1. The bands around 2840 cm-1 are assigned
to the aromatic C–H stretching modes. The aliphatic -CH stretching vibration is
assigned to the band at 2315 cm-1 and 2055 cm-1 in FTIR with weak intensity. The
symmetric stretching mode of the carbonyl group and C=N appears as broad band
around at1667 cm-1 with very strong intensity. The aromatic C = C symmetric
stretching vibrations appear at 1604 cm-1 as a very strong intensity. The inplane
deformation of C–OH appears around 1297- 1250 cm−1 as a medium band in
spectrum. The OH out of plane deformation is observed as strong band around
1000cm-1 in FTIR .The band at 1086 cm-1 and 1052 cm-1 is assigned to the benzene
ring deformation. The band at 729 cm-1 is establishes the presence of disubstituted
benzene ring [Fig.2.14 and Table 2.11].

34
Figure 2.14. IR spectra of 2C4MBS in KBr
Table 2.11. Vibrational assignments of the 2C4MBS
FTIR for 2C4MBS [wavenumber cm-1]
Band assignments
3540 cm-1-3455 cm-1 -OH and –NH stretching
2840cm-1 Aromatic C-H stretching
2315cm−1, 2055cm−1[w] Aliphatic C-H stretching
1667cm-1[vs] Sym C=O,C=N stretching
1604cm-1[vs] Aromatic sym C=C stretching
1297- 1250cm−1[m] C-OH in plane deformation
1086cm−1 and 1052cm−1 Presence of Benzene ring deformation
758cm-1 Disubstituted benzene ring deformation
w:weak; vw:very weak, m:medium, s:strong, vs:very strong.

35
2.5.3. FT NMR Spectral Analysis of 2C4MBS
The signals observed in the 1H NMR and 13C NMR spectra of the
2C4MBS studied and the data [Figs. 2.15[a] and 2.15[b] were presented in
Table 2.12. The spectra exhibit a multiplet at 6.8-7.8 ppm for the hydrogens of the
aromatic rings. The -CHOH hydrogen leads to a singlet of intensity equivalent to
one hydrogen at 3.3 ppm. The signals at 3.8 ppm due to the hydrogens of the -OCH3
and signal at 6.3 ppm for –CONH2 groups. The spectra show a singlet with an
integration equivalent to one hydrogen at 5.9 ppm corresponding to the hydrogen of
the N–NH group. In the 13C NMR aromatic carbon atoms appear in the range of
127 to 137 ppm. The signal at 197 ppm indicates the ene-diol carbon atom. [Table
2.12]
Figure 2.15. [a] 1HNMR of 2C4MBS in acetone d6

36
Figure 2.15.[b] 13C NMR of 2C4MBS in MeOD
Table 2.12. The chemical shift in 1H NMR and 13C NMR spectrum of 2C4MBS.
Spectrum Signal [ppm] Group identification 1H NMR 3.3 ppm -CHOH
3.8 ppm [singlet] Methoxy group of 2C4MB
6.8 to 7.8 ppm[multiplet] Aromatic protons
6.3 ppm -CONH2 protons
5.9 ppm [singlet] -NNH proton 13C NMR 54 and 72 ppm Aliphatic carbon atoms
127 to 137 ppm Aromatic carbon atoms
164 ppm Carbonyl carbon of 2C4MB
197 ppm Ene-diol carbon atom
37
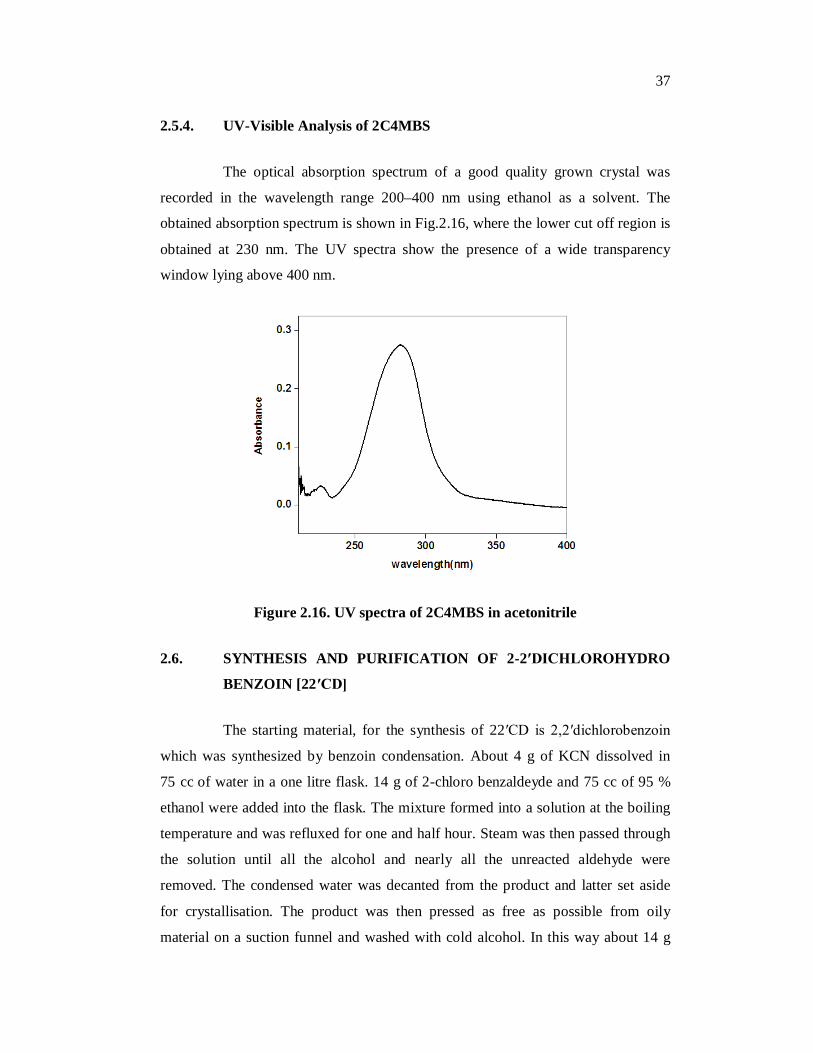
2.5.4. UV-Visible Analysis of 2C4MBS
The optical absorption spectrum of a good quality grown crystal was
recorded in the wavelength range 200–400 nm using ethanol as a solvent. The
obtained absorption spectrum is shown in Fig.2.16, where the lower cut off region is
obtained at 230 nm. The UV spectra show the presence of a wide transparency
window lying above 400 nm.
Figure 2.16. UV spectra of 2C4MBS in acetonitrile
2.6. SYNTHESIS AND PURIFICATION OF 2-2′DICHLOROHYDRO
BENZOIN [22′CD]
The starting material, for the synthesis of 22′CD is 2,2′dichlorobenzoin
which was synthesized by benzoin condensation. About 4 g of KCN dissolved in
75 cc of water in a one litre flask. 14 g of 2-chloro benzaldeyde and 75 cc of 95 %
ethanol were added into the flask. The mixture formed into a solution at the boiling
temperature and was refluxed for one and half hour. Steam was then passed through
the solution until all the alcohol and nearly all the unreacted aldehyde were
removed. The condensed water was decanted from the product and latter set aside
for crystallisation. The product was then pressed as free as possible from oily
material on a suction funnel and washed with cold alcohol. In this way about 14 g
38
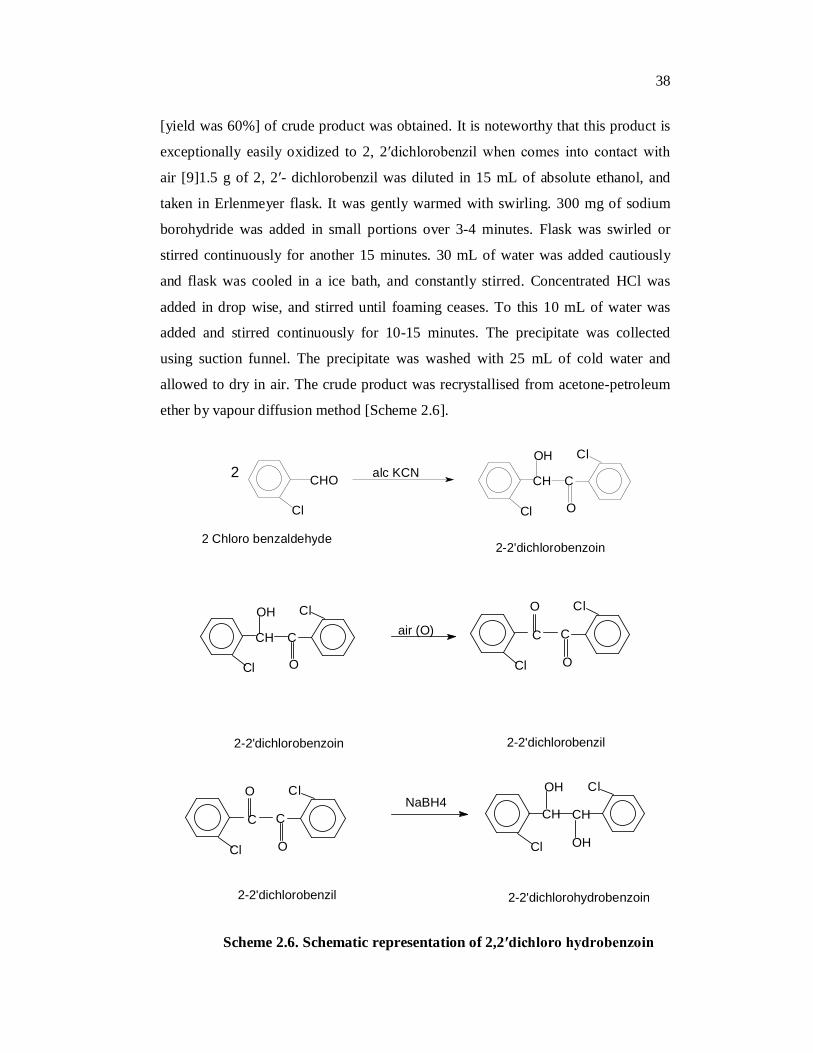
[yield was 60%] of crude product was obtained. It is noteworthy that this product is
exceptionally easily oxidized to 2, 2′dichlorobenzil when comes into contact with
air [9]1.5 g of 2, 2′- dichlorobenzil was diluted in 15 mL of absolute ethanol, and
taken in Erlenmeyer flask. It was gently warmed with swirling. 300 mg of sodium
borohydride was added in small portions over 3-4 minutes. Flask was swirled or
stirred continuously for another 15 minutes. 30 mL of water was added cautiously
and flask was cooled in a ice bath, and constantly stirred. Concentrated HCl was
added in drop wise, and stirred until foaming ceases. To this 10 mL of water was
added and stirred continuously for 10-15 minutes. The precipitate was collected
using suction funnel. The precipitate was washed with 25 mL of cold water and
allowed to dry in air. The crude product was recrystallised from acetone-petroleum
ether by vapour diffusion method [Scheme 2.6].
Cl
lC
O
C
OH
CH air (O) C
O
Cl
Cl
C
O
2-2'dichlorobenzoin 2-2'dichlorobenzil
O
C
Cl
lC
O
CNaBH4
CH
O
Cl
Cl
CH
OH
H
2-2'dichlorobenzil 2-2'dichlorohydrobenzoin
Scheme 2.6. Schematic representation of 2,2′dichloro hydrobenzoin
CH
OH
C
O
Cl
ClCl
C HO2 alc KC N
2 Ch lo ro benz aldehy d e2-2 ' dichlorob enz oin
39
2.6.1. Mass spectral analysis of 22′CD
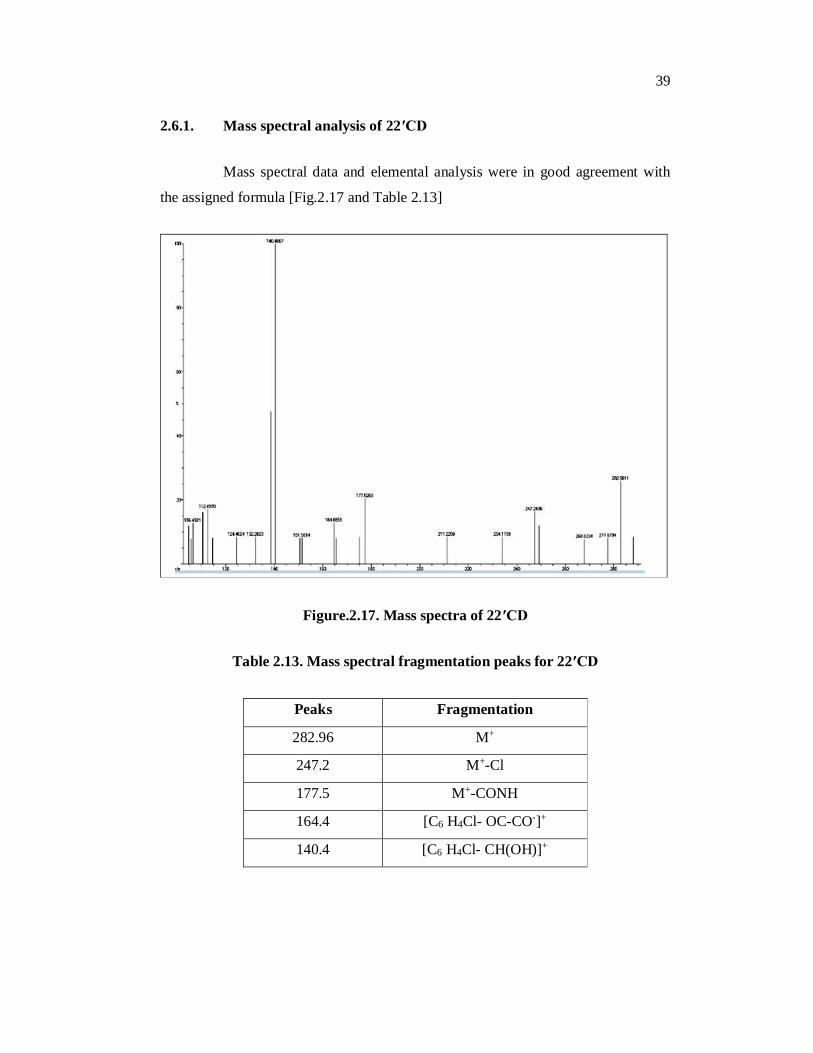
Mass spectral data and elemental analysis were in good agreement with
the assigned formula [Fig.2.17 and Table 2.13]
Figure.2.17. Mass spectra of 22′CD
Table 2.13. Mass spectral fragmentation peaks for 22′CD
Peaks Fragmentation
282.96 M+
247.2 M+-Cl
177.5 M+-CONH
164.4 [C6 H4Cl- OC-CO-]+
140.4 [C6 H4Cl- CH(OH)]+
40
2.6.2. FTIR Spectral Analysis of 22′CD
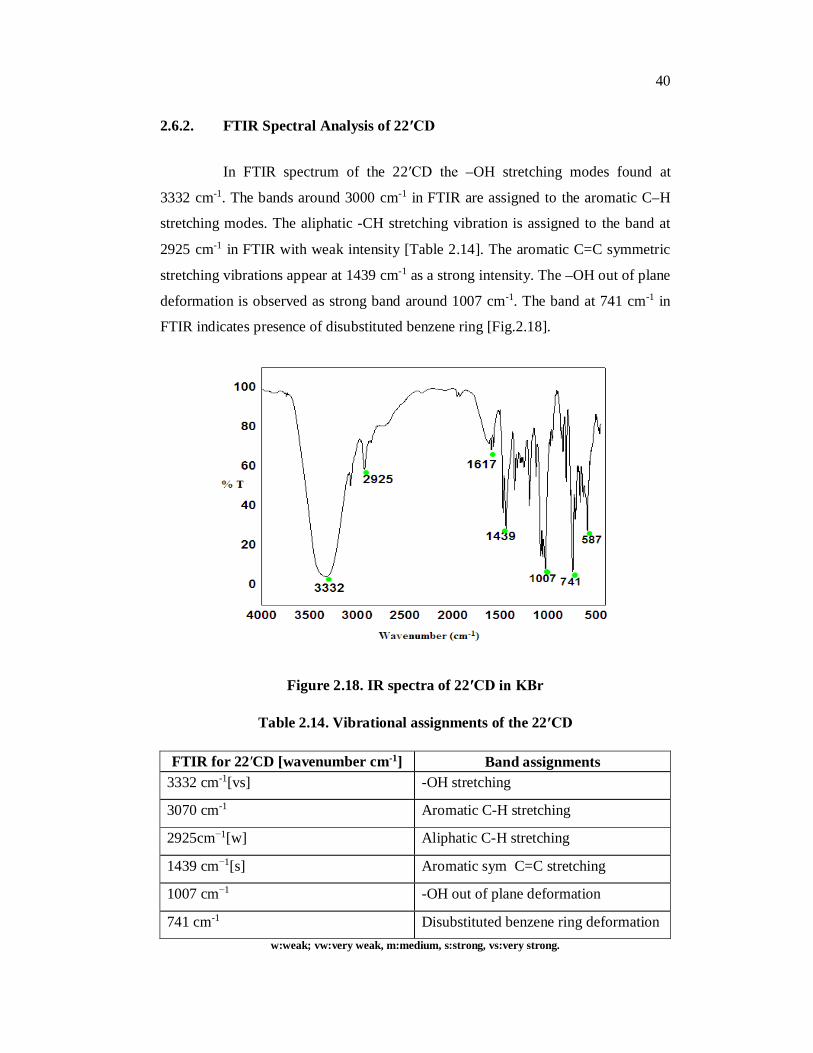
In FTIR spectrum of the 22′CD the –OH stretching modes found at
3332 cm-1. The bands around 3000 cm-1 in FTIR are assigned to the aromatic C–H
stretching modes. The aliphatic -CH stretching vibration is assigned to the band at
2925 cm-1 in FTIR with weak intensity [Table 2.14]. The aromatic C=C symmetric
stretching vibrations appear at 1439 cm-1 as a strong intensity. The –OH out of plane
deformation is observed as strong band around 1007 cm-1. The band at 741 cm-1 in
FTIR indicates presence of disubstituted benzene ring [Fig.2.18].
Figure 2.18. IR spectra of 22′CD in KBr
Table 2.14. Vibrational assignments of the 22′CD
FTIR for 22′CD [wavenumber cm-1] Band assignments 3332 cm-1[vs] -OH stretching
3070 cm-1 Aromatic C-H stretching
2925cm−1[w] Aliphatic C-H stretching
1439 cm−1[s] Aromatic sym C=C stretching
1007 cm−1 -OH out of plane deformation
741 cm-1 Disubstituted benzene ring deformation w:weak; vw:very weak, m:medium, s:strong, vs:very strong.

41
2.6.3. FT NMR Spectral Analysis of 22′CD
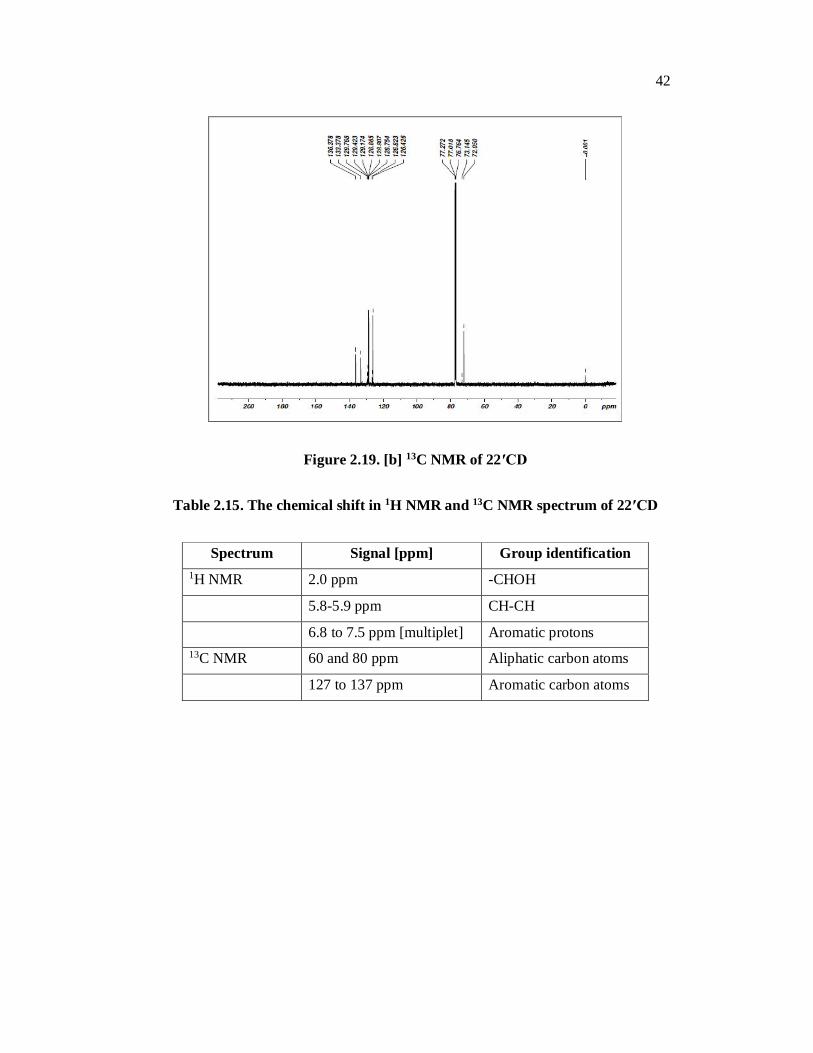
The 1H NMR and 13C NMR spectral signals of the 22′CD were observed
Figs. 2.19[a] and 2.19[b].The corresponding datum are presented in Table 2.15. The
spectra exhibit a multiplet at 6.8-7.5 ppm for the hydrogens of the aromatic rings
hydrogen. The -CHOH hydrogen leads to a broad singlet of intensity equivalent to
two hydrogens at 3 ppm. The spectra shows doublet with an integration equivalent
to two hydrogen at 5.8-5.9 ppm corresponding to the hydrogen of the –CH-CH
group [the signal appears as a doublet of doublet in expanded spectra].
In the 13C NMR aliphatic carbon appear in the range of 60-80 ppm,
aromatic carbon atoms appear in the range of 127 to 137 ppm. [Table 2.15]
Figure 2.19. [a] 1HNMR of 22′CD in acetone d6
42
Figure 2.19. [b] 13C NMR of 22′CD
Table 2.15. The chemical shift in 1H NMR and 13C NMR spectrum of 22′CD
Spectrum Signal [ppm] Group identification 1H NMR 2.0 ppm -CHOH
5.8-5.9 ppm CH-CH
6.8 to 7.5 ppm [multiplet] Aromatic protons 13C NMR 60 and 80 ppm Aliphatic carbon atoms
127 to 137 ppm Aromatic carbon atoms
43
References
[1] a. J S Buck and W S Ide Org. Reactions 4 269 1948
b. Organic Syntheses, Coll. 1 94 1941
[2] A I Vogel Textbook of Practical Organic Chemistry 5th edn. [London : Longman][1989]
[3] N Vijayan, R Ramesh Babu, R Gopalakrishnan, P Ramasamy and W T A Harrison J. Cryst. Growth 262 490 2004
[4] N Vijayan, R Ramesh Babu, M Gunasekaran, R Gopalakrishnan,R Kumarasen, P Ramasamy and C W Lan J. Cryst. Growth 249 309 2003
[5] Organic Syntheses coll.1 33 1921
[6] Buck and Ide. J.Am.Chem.Soc. 51, 1592. 1929
[7] I suryanarayana, B Subrahmanyam, N V Subba Rao Proc. Indian Acad.Sci. 82A 55 1975
[8] B S Furniss, A J Hannaford, P W G Smith and A R Tatachell Vogel′s Text Book of Practical Organic Chemistry 5th edn. [English Language Book Society] [1996]
[9] E. Robert, Lutz, S. Robert and Murphey J. Am. Chem. Soc.71 478 1949