Embed Size (px)
Citation preview
9
AIR-/DROPLET-BORNE DISEASESChapter I
lHaemophilus Influenzae Type B Disease lHand, Foot and Mouth Disease lInfluenza lMeasles lMeningococcal Infection lMumps lPertussis lPneumococcal Disease (invasive) lRubella lViral Conjunctivitis lSevere Illness & Death from Possibly Infectious Causes (SIDPIC) lChickenpox (Varicella)

10
IAIR-/DROPLET-BORNE DISEASES
Airborne transmission occurs by dissemination of droplet nuclei which are small particle residues 5 micrometers or smaller in diameter, which can remain suspended in the air for long periods of time. Droplets can be formed when a person coughs, sneezes or talks. Droplets can also be formed during administration of drugs via nebuliser or invasive procedures such as suctioning and bronchoscopy. Transmission occurs when droplets containing microorganisms generated from infected persons are propelled a short distance (within a meter) through air and deposited on the host’s mucous membranes (such as conjunctiva, nasal mucosa, mouth or respiratory tract).
HAEMOPHILUS INFLUENZAE TYPE B DISEASE
Haemophilus Influenzae type b (Hib) disease is a serious disease caused by bacteria. The most common severe types of Haemophilus influenzae disease are: pneumonia (lung infection); bacteremia (bloodstream infection); and meningitis (infection of the covering of the brain and spinal cord). The causative agent is Haemophilus Influenzae type b (gram-negative coccobacillus). The mode of transmission is by inhalation of respiratory droplets or direct contact with respiratory tract secretions of infected persons. Hib disease is vaccine-preventable. In 2015, there were three cases of Hib disease reported compared to six cases in 2014 (Figure 1.1). All the cases were laboratory confirmed with positive blood culture. All the cases were aged 65 years and above. Among the three major ethnic groups, Malays had the highest incidence rate (Table 1.1 and 1.2). The three cases were classified as local (Table 1.3).
Figure 1.1E-weekly distribution of reported Hib cases, 2014 – 2015
1 3 5 7 9 11 13 15 17 19 21 23 25 27 29 31 33 35 37 39 41 43 45 47 49 51 530
1
2
No. of Cases
Week2014 2015

11
Table 1.1Age-gender distribution and age-specific incidence rates of reported Hib cases, 2015
Age (Yrs) Male Female Total (%) Incidence rate per 100,000 population*
0 - 4 0 0 0 (0.0) 0.0 5 – 14 0 0 0 (0.0) 0.0 15 – 24 0 0 0 (0.0) 0.0 25 – 34 0 0 0 (0.0) 0.0 35 – 44 0 0 0 (0.0) 0.0 45 – 54 0 0 0 (0.0) 0.0 55 - 64 0 0 0 (0.0) 0.0 65+ 2 1 3 (100.0) 0.6
Total 2 1 3 (100.0) 0.1
*Rates are based on 2015 estimated mid-year population.(Source: Singapore Department of Statistics)
Table 1.2Ethnic-gender distribution and ethnic-specific incidence rate of reported Hib cases, 2015
Male Female Total (%) Incidence rate per 100,000 population*
Singapore Resident Chinese 1 0 1 (33.3) 0.0 Malay 0 1 1 (33.3) 0.2 Indian 0 0 0 (0.0) 0.0 Others 1 0 1 (33.4) 0.8 Foreigner 0 0 0 (0.0) 0.0
Total 2 1 3 (100.0) 0.1
*Rates are based on 2015 estimated mid-year population.(Source: Singapore Department of Statistics)
Table 1.3Total number of notifications received for Hib, 2011 – 2015
Age 2011 2012 2013 2014 2015 Group Local Imported Local Imported Local Imported Local Imported Local Imported
0 – 4 0 0 0 0 0 0 1 0 0 0 5 – 14 0 0 0 0 0 0 0 1 0 0 15 – 24 0 0 0 0 0 0 0 0 0 0 25 – 34 0 0 0 0 0 0 1 0 0 0 35 – 44 0 0 0 0 0 0 0 0 0 0 45 – 54 0 0 0 0 2 0 1 0 0 0 55 - 64 0 0 0 0 3 1 0 0 0 0 65+ 2 0 1 0 4 0 2 0 3 0
Total 2 0 1 0 9 1 5 1 3 0

12
HAND, FOOT AND MOUTH DISEASE (HFMD)
Hand, foot and mouth disease (HFMD) is a common childhood viral disease characterised by brief prodromal fever, followed by pharyngitis, mouth ulcers and rash on the hands and feet. Children may have reduced appetite due to painful oral ulcers erupting on the tongue, gums or inside of the cheeks. A non-pruritic vesicular rash or red spots typically appears on the hands and feet, most commonly on the palms and soles. The common causative agents for HFMD are the coxsackieviruses type A (CA), echovirus (EC) and enterovirus 71 (EV-A71). HFMD can be transmitted from person to person through the faecal-oral or respiratory route.
A total of 28,216 cases of HFMD were reported in 2015, an increase of 27.3% compared to 22,171 cases reported in 2014 (Figure 1.2). There were no local cases with severe complications due to HFMD reported in 2015.
The incidence rate was highest in the 0 - 4 years age group, with an overall male to female ratio of 1.2:1 (Table 1.4). Among the three major ethnic groups, Chinese had the highest incidence rate, followed by Malays and Indians (Table 1.5). No HFMD deaths were reported in 2015.
Viral isolation and PCR of enterovirus 71 (EV 71) and other enteroviruses was carried out on samples collected at the KK Women’s and Children’s Hospital (KKH), National University Hospital (NUH) and sentinel GP clinics. Of the isolates that were tested positive, the majority was coxsackieviruses type A (CA) (14.8%), followed by EV 71 (7.2%). Among the coxsackieviruses, CA6 (52.9%) was the predominant serotype, followed by CA 4 (18.6%).
Figure 1.2 E-weekly distribution of reported hand, foot and mouth cases, 2014 – 2015
1 3 5 7 9 11 13 15 17 19 21 23 25 27 29 31 33 35 37 39 41 43 45 47 49 51 530
1
2
No. of Cases
Week2014 2015

13
Table 1.4Age-gender distribution and age-specific incidence rate of reported
hand, foot and mouth cases^, 2015
Age (Yrs) Male Female Total (%) Incidence rate per 100,000 population*
0 – 4 9,774 7,917 17,691 (62.7) 7,766.6 5 – 14 3,698 3,035 6,733 (23.9) 1,424.9 15 – 24 493 517 1,010 (3.6) 134.4 25 – 34 674 746 1,420 (5.0) 113.1 35 – 44 625 440 1,065 (3.8) 107.9 45 – 54 131 68 199 (0.7) 26.6 55+ 44 46 90 (0.3) 8.2
Total 15,439 12,769 28,208 (100.0) 509.6
^Excluding 8 tourists.*Rates are based on 2015 estimated mid-year population.
(Source: Singapore Department of Statistics)
Table 1.5Ethnic-gender distribution and ethnic-specific incidence rate of reported
hand, foot and mouth cases^, 2015
Male Female Total (%) Incidence rate per 100,000 population*
Singapore Resident Chinese 10,571 8,774 19,345 (68.6) 667.1 Malay 1,748 1,581 3,329 (11.8) 639.1 Indian 513 412 925 (3.3) 260.6 Others 881 628 1,509 (5.3) 1190.0 Foreigner 1,726 1,374 3,100 (11.0) 189.9
Total 15,439 12,769 28,208 (100.0) 509.6
^Excluding 8 tourists.*Rates are based on 2015 estimated mid-year population.
(Source: Singapore Department of Statistics)
Institutional Outbreaks of HMFD
There were 1,994 reported outbreaks of HFMD in year 2015, each involving two or more cases. Table 1.6 gives a breakdown of HFMD outbreaks at various educational institutions by attack rate. Two HFMD clusters are discussed below.
Since 2010, additional measures were introduced to curb the HFMD transmission in educational institutions. Childcare centres or kindergartens with prolonged HFMD transmission had their names published on the MOH website and were subsequently closed for ten days if the transmission was further prolonged. These measures continued to be enforced in 2015 with public education enhanced.

14
Table 1.6Outbreaks of hand, foot and mouth disease in childcare centres/kindergartens/schools, 2015
Attack Childcare Kindergartens Primary Enrichment Other rate (%) Centres Schools Centres Institutions*
< 10 1,036 279 269 21 111 10 - 20 210 5 1 16 1 21 - 30 26 - - 6 - 31 - 40 8 - - 1 - 41 - 50 1 - - - - >50 3 - - - - Total 1,284 284 270 44 112
*64 from secondary schools, 25 from international schools, 11 from polytechnic, six from Junior Colleges, five from special schools and one from ITE.
Cluster 1: Childcare centre at Punggol
An outbreak of HFMD involving 32 children aged between 0 and 5 years occurred between 4 May and 4 Jun 2015 in a childcare centre at Ang Mo Kio. At the time of the outbreak, the centre had 36 full-time staff and 159 children in six classes: Infant, Toddler (PG), Nursery 1 (N1), Nursery 2 (N2), Kindergarten 1 (K1) and Kindergarten 2 (K2).
The class-specific attack rates ranged from 3.6% to 55.6%, with an overall attack rate of 20.1% (Table 1.7). The index case, an infant, presented with symptoms on 4 May 2015. The infection subsequently spread amongst other children. The last reported case was on 4 Jun 2015 (Figure 1.3). The centre was mandatorily closed for ten days from 12 to 21 Jun 2015 due to the high number of cases and the prolonged disease transmission period.
Table 1.7Attack rates of hand, foot and mouth disease (HFMD) in a childcare centre at Ang Mo Kio,
4 May 2015 - 4 Jun 2015
Infant 6 12 18 6 100.0 4 33.3 10 55.6 Toddler 9 11 20 4 44.4 6 54.5 10 50.0 N1 18 17 35 3 16.7 3 17.6 6 17.1 N2 21 15 36 2 9.5 2 13.3 4 11.1 K1 9 13 22 1 11.1 0 0.0 1 4.5 K2 10 18 28 1 10.0 0 0.0 1 3.6
Total 73 86 159 17 23.6 15 17.4 32 20.1
Class Category Male Female Total Male % Female % Total %
No. Enrolled No. Affected and Attack Rates

15
Fig 1.3Time distribution of 32 cases of hand, foot and mouth disease in a childcare centre at Ang Mo
Kio, 4 May 2015 - 4 Jun 2015
Cluster 2: Childcare centre at Hougang
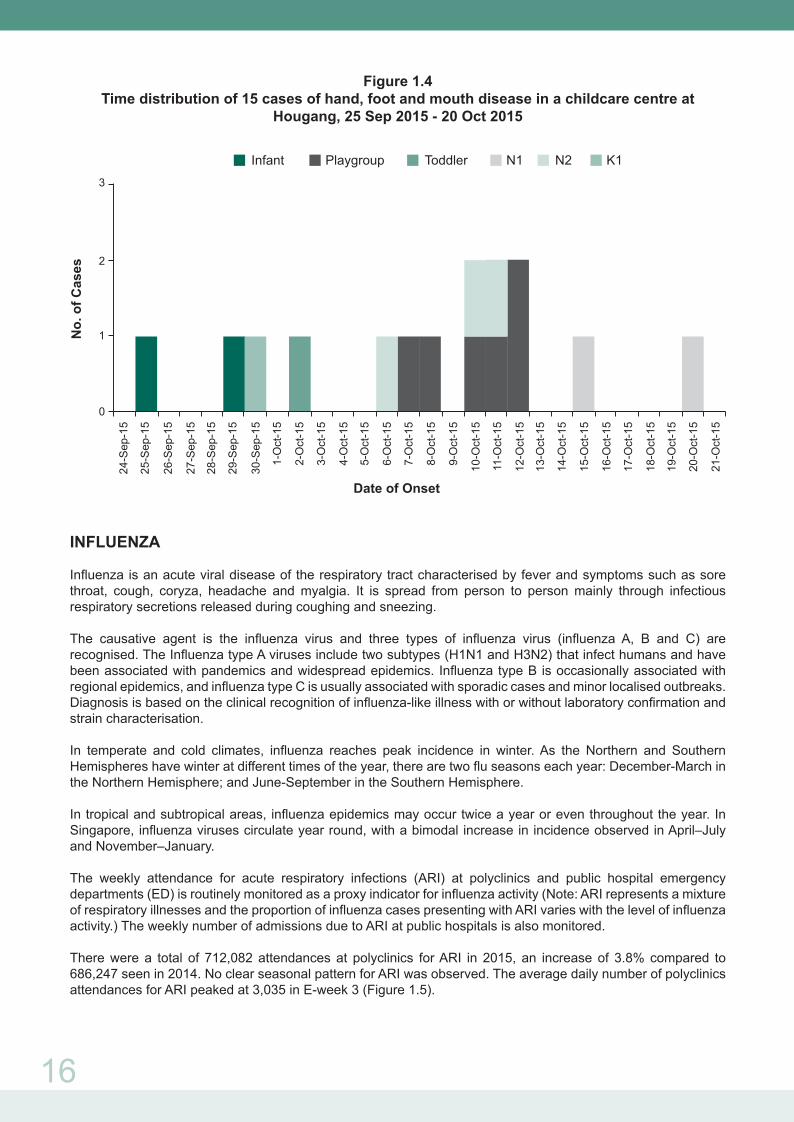
An outbreak of HFMD involving 15 children aged between 1 and 5 years occurred between 25 Sep 2015 and 20 Oct 2015 in a child care centre at Hougang. At the time of the outbreak, the centre had 13 full-time staff and 81 children in seven classes: Infant, Toddler, Playgroup, Nursery 1 (N1), Nursery 2 (N2), Kindergarten 1 (K1) and Kindergarten 2 (K2).
The class-specific attack rates ranged from 8.3% to 54.5%, with an overall attack rate of 18.5% (Table 1.8). The outbreak started with an infant who developed symptoms on 25 September 2015. The infection subsequently spread amongst other children. The last reported case was on 20 October 2015 (Figure 1.4).
The centre’s name was published on the Ministry of Health’s website due to the prolonged disease transmission period.
Table 1.8Attack rates of hand, foot and mouth disease in a child care centre at Hougang,
25 Sep 2015 - 20 Oct 2015
3-May
-15
5-May
-15
7-May
-15
9-May
-15
11-M
ay-15
13-M
ay-15
15-M
ay-15
17-M
ay-15
19-M
ay-15
21-M
ay-15
23-M
ay-15
25-M
ay-15
27-M
ay-15
29-M
ay-15
31-M
ay-15
2-Jun
-15
4-Jun
-15
0
1
2
3
4
5
6
7
8Infant Toddler N1 N2 K1 K2
No.
of C
ases
Date of Onset
Infant 5 2 7 2 40.0 0 0.0 2 28.6 Toddler 4 6 10 0 0.0 1 16.7 1 10.0Playgroup 4 7 11 2 50.0 4 57.1 6 54.5 N1 7 8 15 2 28.6 0 0.0 2 13.3 N2 7 10 17 2 28.6 1 10.0 3 17.6 K1 6 6 12 0 0.0 1 16.7 1 8.3 K2 6 3 9 0 0.0 0 0.0 0 0.0 Total 39 42 81 8 20.5 7 16.7 15 18.5
Class Category Male Female Total Male % Female % Total %
No. Enrolled No. Affected and Attack Rates
16
Figure 1.4Time distribution of 15 cases of hand, foot and mouth disease in a childcare centre at
Hougang, 25 Sep 2015 - 20 Oct 2015
INFLUENZA
Influenza is an acute viral disease of the respiratory tract characterised by fever and symptoms such as sore throat, cough, coryza, headache and myalgia. It is spread from person to person mainly through infectious respiratory secretions released during coughing and sneezing.
The causative agent is the influenza virus and three types of influenza virus (influenza A, B and C) are recognised. The Influenza type A viruses include two subtypes (H1N1 and H3N2) that infect humans and have been associated with pandemics and widespread epidemics. Influenza type B is occasionally associated with regional epidemics, and influenza type C is usually associated with sporadic cases and minor localised outbreaks. Diagnosis is based on the clinical recognition of influenza-like illness with or without laboratory confirmation and strain characterisation.
In temperate and cold climates, influenza reaches peak incidence in winter. As the Northern and Southern Hemispheres have winter at different times of the year, there are two flu seasons each year: December-March in the Northern Hemisphere; and June-September in the Southern Hemisphere.
In tropical and subtropical areas, influenza epidemics may occur twice a year or even throughout the year. In Singapore, influenza viruses circulate year round, with a bimodal increase in incidence observed in April–July and November–January.
The weekly attendance for acute respiratory infections (ARI) at polyclinics and public hospital emergency departments (ED) is routinely monitored as a proxy indicator for influenza activity (Note: ARI represents a mixture of respiratory illnesses and the proportion of influenza cases presenting with ARI varies with the level of influenza activity.) The weekly number of admissions due to ARI at public hospitals is also monitored.
There were a total of 712,082 attendances at polyclinics for ARI in 2015, an increase of 3.8% compared to 686,247 seen in 2014. No clear seasonal pattern for ARI was observed. The average daily number of polyclinics attendances for ARI peaked at 3,035 in E-week 3 (Figure 1.5).
24-S
ep-1
5
0
1
2
3
Infant Playgroup Toddler N1 N2 K1
No.
of C
ases
Date of Onset
25-S
ep-1
5
26-S
ep-1
5
27-S
ep-1
5
28-S
ep-1
5
29-S
ep-1
5
30-S
ep-1
5
1-O
ct-1
5
2-O
ct-1
5
3-O
ct-1
5
4-O
ct-1
5
5-O
ct-1
5
6-O
ct-1
5
7-O
ct-1
5
8-O
ct-1
5
9-O
ct-1
5
10-O
ct-1
5
11-O
ct-1
5
12-O
ct-1
5
13-O
ct-1
5
14-O
ct-1
5
15-O
ct-1
5
16-O
ct-1
5
17-O
ct-1
5
18-O
ct-1
5
19-O
ct-1
5
20-O
ct-1
5
21-O
ct-1
5

17
Figure 1.5E-weekly distribution of acute respiratory infection attendance at polyclinics
2014 – 2015
An annual total of 85,916 ARI cases were seen at the emergency departments (ED) of public hospitals in 2015, a decrease of 10.2% compared to 95,661 cases reported in 2014. The highest average weekly ARI attendance at ED was observed in E-week 22 at 2,577. In addition, ARI admissions peaked at 95 cases in E-week 22 (Figure 1.6).
Figure 1.6Weekly polyclinic attendance, emergency department (ED)
attendances and admissions for ARI, 2015
Virological surveillance of influenza viruses was carried out on throat and/or nasopharyngeal specimens obtained from polyclinics, hospitals and sentinel private clinics throughout the year. The typing, subtyping and isolation of influenza viruses was carried out at the National Public Health Laboratory (NPHL) and at designated hospital laboratories. Further genetic analysis and antigenic characterisation of selected samples was also done by NPHL and the WHO Collaborating Centre for Reference and Research on Influenza, Melbourne, Australia.
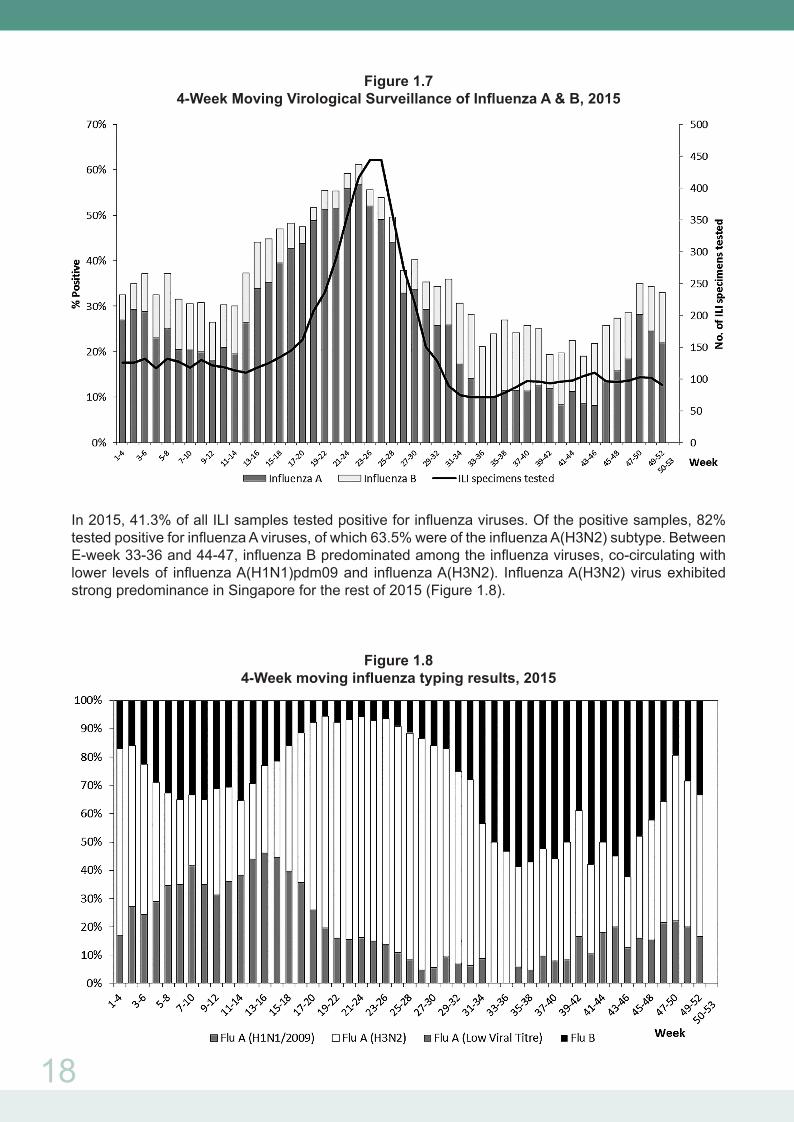
The 4-weekly moving average of the proportion of samples from patients in polyclinics and sentinel private clinics with influenza-like illness (ILI) which were positive for influenza viruses is shown in Figure 1.7. Higher levels of influenza activity were observed for the 4-weekly moving average between E-weeks 13-16 and 25-28, with a range of 44.1% to 61.2%. Influenza activity peaked in E-weeks 22-25 with 61.2% of ILI samples testing positive for influenza viruses. 57% of the positive samples in E-weeks 22-25 were influenza A viruses and of these, 78% were of the H3N2 subtype.
Average Daily No
Week2014 2015
1 3 5 7 9 11 13 15 17 19 21 23 25 27 29 31 33 35 37 39 41 43 45 47 49 51 530
500
1000
1500
2000
2500
3000
3500
18
Figure 1.74-Week Moving Virological Surveillance of Influenza A & B, 2015
In 2015, 41.3% of all ILI samples tested positive for influenza viruses. Of the positive samples, 82% tested positive for influenza A viruses, of which 63.5% were of the influenza A(H3N2) subtype. Between E-week 33-36 and 44-47, influenza B predominated among the influenza viruses, co-circulating with lower levels of influenza A(H1N1)pdm09 and influenza A(H3N2). Influenza A(H3N2) virus exhibited strong predominance in Singapore for the rest of 2015 (Figure 1.8).
Figure 1.84-Week moving influenza typing results, 2015

19
Majority of influenza A(H1N1)pdm09 viruses of 2015 were antigenically homogenous and closely related to the current vaccine strain, A/California/07/2009. Influenza A(H3N2) viruses were grouped in phylogenetic clades 3C.2 and 3C.3, and most viruses remain antigenically related to A/Switzerland/9715293/2013, which was the A(H3N2) component of the 2015 southern hemisphere influenza vaccine as recommended by WHO. Influenza B viruses of the B/Victoria/2/87 and the B/Yamagata/16/88 lineages co-circulated, with the latter predominating among influenza B viruses in many countries. These recently circulating B/Yamagata/16/88 viruses were found to be antigenically similar to influenza B/Phuket/3073/2013, the virus recommended for use in the 2015 southern hemisphere vaccine. Over 180 isolates, including influenza A(H1N1)pdm09, A(H3N2) and B viruses, were analysed for the resistance to neuraminidase inhibitors oseltamivir, peramivir, laninamivir and zanamivir. Resistance to oseltamivir was detected in one influenza A(H1N1)pdm09 isolate.
MEASLES
Measles is an acute, highly communicable viral disease caused by the measles virus, a member of the genus Morbillivirus of the family Paramyxoviridae. The mode of transmission is airborne by droplet spread, or direct contact with the nasal or throat secretions of an infected person.
In Singapore, the number of reported measles cases has rapidly declined with the introduction of compulsory measles vaccination in August 1985. In 1992 and 1997, there was an increase in the number of reported cases (Figure 1.9). All age groups were affected and as a result, the “catch-up” immunisation initiative was implemented in July – November 1997 and the two-dose MMR vaccination regime was implemented in January 1998. The incidence of measles has remained at a low level since then.
Figure 1.9 Incidence of reported measles cases, 1990 – 2015
A total of 42 laboratory confirmed cases of measles were reported in 2015 compared to 142 cases reported in 2014 (Figure 1.10). The highest incidence rate was observed in children under the age of 1 year (Table 1.10). Among the three major ethnic groups, Malays had the highest incidence rate, followed by Chinese and Indian (Table 1.11). Four cases had at least one dose of MMR vaccination prior to onset of illness (Source: National Immunisation Registry).

20
WHO classification of measles cases
A total of 40 laboratory confirmed measles cases were reported to WHO Western Pacific Regional Office (WPRO) from January to December 2015. During this period, 95% of cases were sporadic and the rest were involved in a small cluster. The source of infection and the method of confirmation based on WHO classification are shown in Table 1.12.
Of the 40 measles cases, 28 were classified as locally acquired and 12 were imported. The majority of imported cases originated from Malaysia, followed by Indonesia (Table 1.13).
Figure 1.10E-weekly distribution of reported measles cases, 2014 – 2015
Table 1.9Total number of notifications received for Measles, 2011 – 2015*
Excluding one tourist and one foreigner seeking medical treatment in Singapore
2011 2012 2013 2014 2015 Age Local Imported Local Imported Local Imported Local Imported Local Imported
< 6 mths 6 0 1 0 2 1 4 0 1 06 mths – < 1yr 20 3 2 0 12 3 21 7 9 0 1 – 4 yrs 51 8 9 0 9 5 31 9 6 2 5 – 9 yrs 6 1 3 0 0 4 2 0 1 0 10 – 14 yrs 1 0 1 0 1 0 0 0 1 0 15 – 24 yrs 6 0 3 0 1 0 4 2 2 1 25 – 34 yrs 14 6 7 4 2 0 20 8 4 6 35 – 44 yrs 9 2 4 2 4 0 14 1 5 2 45 – 54 yrs 0 0 0 0 0 0 3 2 0 0 55+ 0 0 1 0 0 0 0 0 0 0
Total 113 20 31 6 31 13 99 29 29 11
No. of Cases
1 3 5 7 9 11 13 15 17 19 21 23 25 27 29 31 33 35 37 39 41 43 45 47 49 51 53
Week2014 2015
0123456789
10111213141516

21
Table 1.10Age-gender distribution and age-specific incidence rate of reported measles cases^, 2015
Age Male Female Total (%) Incidence rate per 100,000 population*
< 6 mths 1 0 1 (2.5) 24.3 6 mths – < 1yr 5 4 9 (22.5) 1 – 4 yrs 1 7 8 (20.0) 4.3 5 – 9 yrs 1 1 2 (5.0) 0.4 10 – 14 yrs 1 2 3 (7.5) 0.4 15 – 24 yrs 6 4 10 (25.0) 0.8 25 – 34 yrs 4 3 7 (17.5) 0.7 35 – 44 yrs 0 0 0 (0.0) 0.0 45 – 54 yrs 0 0 0 (0.0) 0.0 55+ 0 0 0 (0.0) 0.0
Total 19 21 40 (100.0) 0.7
^Excluding one tourist and one foreigner seeking medical treatment in Singapore*Rates are based on 2015 estimated mid-year population.
(Source: Singapore Department of Statistics)
Table 1.11Ethnic-gender distribution and ethnic-specific incidence rate of reported measles cases^,
2015
Male Female Total (%) Incidence rate per 100,000 population*
Singapore Resident Chinese 10 7 17 (42.5) 0.6 Malay 2 7 9 (22.5) 1.7 Indian 0 1 1 (2.5) 0.3 Others 1 0 1 (2.5) 0.8 Foreigner 6 6 12 (30.0) 0.7
Total 19 21 40 (100.0) 0.7
^Excluding one tourist and one foreigner seeking medical treatment in Singapore*Rates are based on 2015 estimated mid-year population.
(Source: Singapore Department of Statistics)

22
Table 1.12WHO classification of measles cases, January – December 2015^
Confirmed measles cases
Source# Laboratory Epidemiological Total confirmed Linkage Respiratory Blood specimen specimen
Endemic 0 0 0 0 Unknown 8 20 0 28 Imported 8 (1*) 4 0 11 Imported-Related 0 1 0 1
Total 16 (1*) 25 0 40
#Source – whether the source of virus was imported, import-related, endemic or unknown, as extracted from description provided by WHO in the WHO monthly summary excel spreadsheet.
• Imported: A case exposed outside the region or country during the 7-21 days prior onset to rash and supported by epidemiological or virological evidence, or both.
• Import-Related: A locally acquired infection occurring as part of a chain of transmission originating from an imported case as supported by epidemiological or virological evidence, or both.
• Endemic: Laboratory or epidemiologically-linked confirmed cases of measles resulting from endemic transmission of measles virus.
• Unknown: A confirmed case for which an epidemiologically or virological link to importation or to endemic transmission cannot be established after a thorough investigation.
* Persons who had both respiratory and blood samples collected^ Reporting is based on the date of onset of rashes from 1 Jan - 31 Dec 2015.
Table 1.13Distribution of measles cases by genotype, January - December 2015
Classification
Genotypes Local Imported Total Country of importation (No. of persons)
B3 1 0 1 D8 9 3 12 Indonesia (1) India (1) Malaysia (1) D9 6 1 7 Malaysia (1) H1 0 1 1 China(1) Genotyping not 12 7 19 Indonesia (2) performed India(1) Malaysia (3) Europe* (1) Total 28 12 40
*Person travelled to Paris and Zurich.

23
MENINGOCOCCAL INFECTION
Meningococcal meningitis is an acute bacterial disease, characterised by sudden onset of fever, intense headache, nausea and often vomiting and stiff neck. Frequently there is a petechial rash with pink macules or very rarely, vesicles. The causative agent is Neisseria meningitidis with serotype groups, namely, A, B, C, Y, W-135, X and Z. The mode of transmission is via direct contact, including respiratory droplets from nose and throat of infected persons.
In 2015, there were six cases of meningococcal infection reported compared to nine cases in 2014 (Tables 1.14 and 1.15). All the cases were laboratory confirmed with positive blood/ cerebral spinal fluids culture or virginal swab PCR (Table 1.16).
Table 1.14Total number of notifications received for meningococcal infection, 2011 – 2015
Table 1.15Age-gender distribution and age-specific incidence rates of reported
meningococcal infection cases, 2015
Age Male Female Total (%) Incidence rate per 100,000 population*
0 - 4 1 1 2 0.9 5 – 14 0 0 0 0 15 – 24 2 0 2 0.3 25 – 34 1 1 2 0.2 35 – 44 0 0 0 0 45 – 54 0 0 0 0 55 - 64 0 0 0 0 65+ 0 0 0 0
Total 4 2 6 (100.0) 0.1
*Rates are based on 2015 estimated mid-year population.(Source: Singapore Department of Statistics)
2011 2012 2013 2014 2015 Age Group Local Imported Local Imported Local Imported Local Imported Local Imported
0 – 4 0 0 0 0 1 0 3 0 2 0 5 – 14 1 0 0 0 0 0 0 0 0 0 15 – 24 0 0 0 0 0 0 0 0 2 0 25 – 34 0 0 0 0 0 0 1 0 2 0 35 – 44 1 0 0 0 0 1 1 0 0 0 45 – 54 0 0 0 0 0 0 2 0 0 0 55 - 64 1 0 0 0 1 0 2 0 0 0 65+ 3 0 0 0 0 0 0 0 0 0
Total 6 0 0 0 2 1 9 0 6 0
24
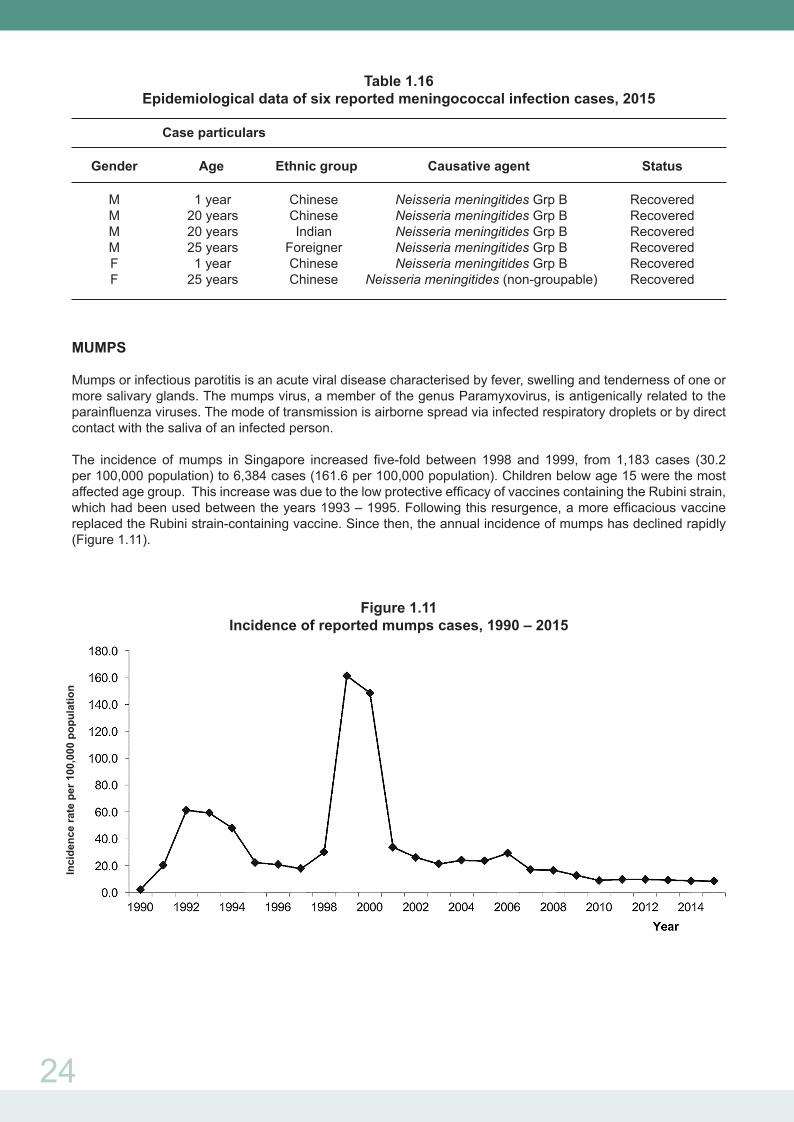
Table 1.16Epidemiological data of six reported meningococcal infection cases, 2015
Case particulars Gender Age Ethnic group Causative agent Status
M 1 year Chinese Neisseria meningitides Grp B Recovered M 20 years Chinese Neisseria meningitides Grp B Recovered M 20 years Indian Neisseria meningitides Grp B Recovered M 25 years Foreigner Neisseria meningitides Grp B Recovered F 1 year Chinese Neisseria meningitides Grp B Recovered F 25 years Chinese Neisseria meningitides (non-groupable) Recovered
MUMPS
Mumps or infectious parotitis is an acute viral disease characterised by fever, swelling and tenderness of one or more salivary glands. The mumps virus, a member of the genus Paramyxovirus, is antigenically related to the parainfluenza viruses. The mode of transmission is airborne spread via infected respiratory droplets or by direct contact with the saliva of an infected person.
The incidence of mumps in Singapore increased five-fold between 1998 and 1999, from 1,183 cases (30.2 per 100,000 population) to 6,384 cases (161.6 per 100,000 population). Children below age 15 were the most affected age group. This increase was due to the low protective efficacy of vaccines containing the Rubini strain, which had been used between the years 1993 – 1995. Following this resurgence, a more efficacious vaccine replaced the Rubini strain-containing vaccine. Since then, the annual incidence of mumps has declined rapidly (Figure 1.11).
Figure 1.11Incidence of reported mumps cases, 1990 – 2015
Inci
denc
e ra
te p
er 1
00,0
00 p
opul
atio
n
25
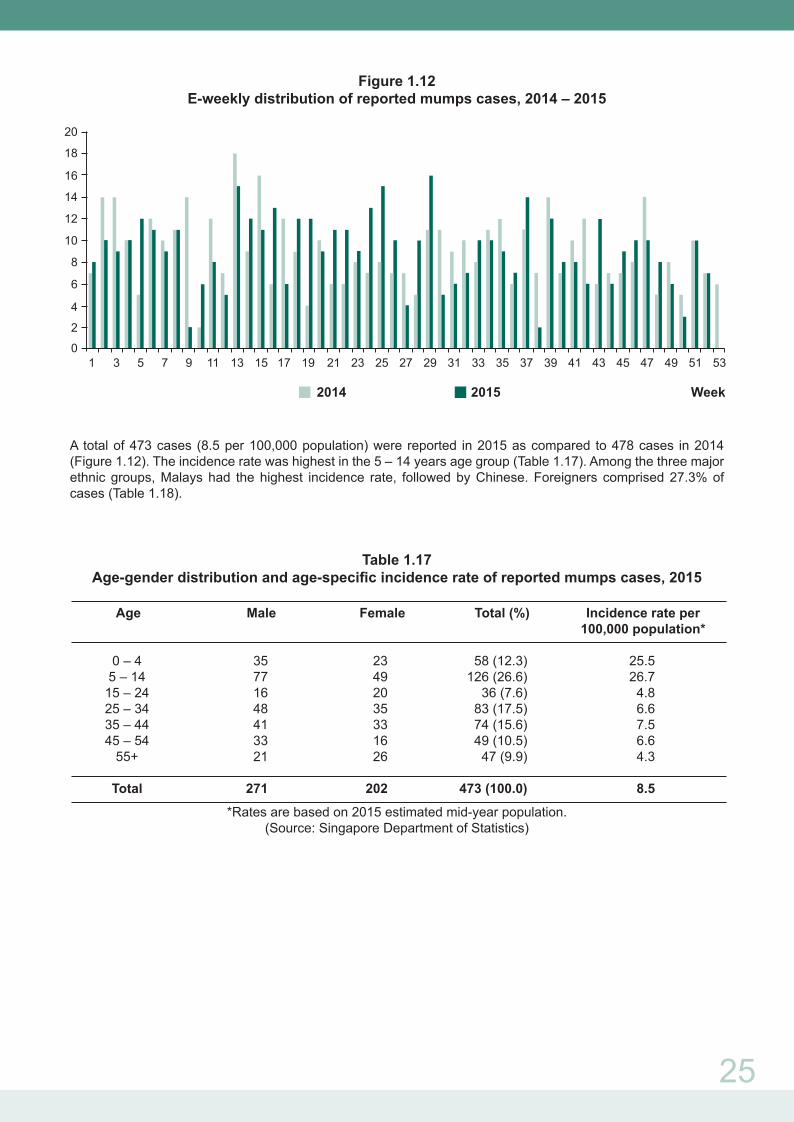
Figure 1.12E-weekly distribution of reported mumps cases, 2014 – 2015
A total of 473 cases (8.5 per 100,000 population) were reported in 2015 as compared to 478 cases in 2014 (Figure 1.12). The incidence rate was highest in the 5 – 14 years age group (Table 1.17). Among the three major ethnic groups, Malays had the highest incidence rate, followed by Chinese. Foreigners comprised 27.3% of cases (Table 1.18).
Table 1.17Age-gender distribution and age-specific incidence rate of reported mumps cases, 2015
Age Male Female Total (%) Incidence rate per 100,000 population*
0 – 4 35 23 58 (12.3) 25.5 5 – 14 77 49 126 (26.6) 26.7 15 – 24 16 20 36 (7.6) 4.8 25 – 34 48 35 83 (17.5) 6.6 35 – 44 41 33 74 (15.6) 7.5 45 – 54 33 16 49 (10.5) 6.6 55+ 21 26 47 (9.9) 4.3
Total 271 202 473 (100.0) 8.5
*Rates are based on 2015 estimated mid-year population.(Source: Singapore Department of Statistics)
16
18
20
1 3 5 7 9 11 13 15 17 19 21 23 25 27 29 31 33 35 37 39 41 43 45 47 49 51 53
2
4
6
8
10
12
14
0
Week2014 2015
26
Table 1.18Ethnic-gender distribution and ethnic-specific incidence rate of reported mumps cases, 2015
Male Female Total (%) Incidence rate per 100,000 population*
Singapore Resident Chinese 140 107 247 (52.2) 8.5 Malay 26 28 54 (11.4) 10.4 Indian 13 5 18 (3.8) 5.1 Others 16 9 25 (5.3) 19.7 Foreigner 76 53 129 (27.3) 7.9
Total 271 202 473 (100.0) 8.5
*Rates are based on 2015 estimated mid-year population.(Source: Singapore Department of Statistics)
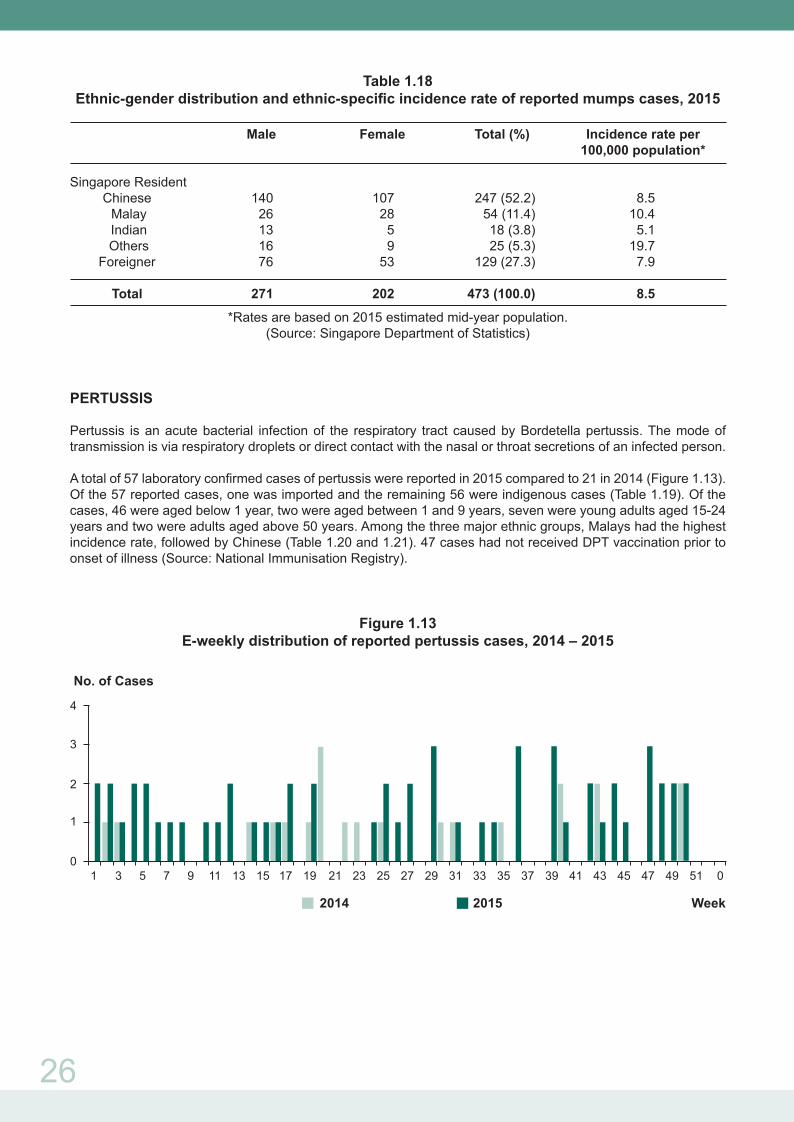
PERTUSSIS
Pertussis is an acute bacterial infection of the respiratory tract caused by Bordetella pertussis. The mode of transmission is via respiratory droplets or direct contact with the nasal or throat secretions of an infected person.
A total of 57 laboratory confirmed cases of pertussis were reported in 2015 compared to 21 in 2014 (Figure 1.13). Of the 57 reported cases, one was imported and the remaining 56 were indigenous cases (Table 1.19). Of the cases, 46 were aged below 1 year, two were aged between 1 and 9 years, seven were young adults aged 15-24 years and two were adults aged above 50 years. Among the three major ethnic groups, Malays had the highest incidence rate, followed by Chinese (Table 1.20 and 1.21). 47 cases had not received DPT vaccination prior to onset of illness (Source: National Immunisation Registry).
Figure 1.13E-weekly distribution of reported pertussis cases, 2014 – 2015
1 3 5 7 9 11 13 15 17 19 21 23 25 27 29 31 33 35 37 39 41 43 45 47 49 51 0
2
No. of Cases
Week2014 2015
3
4
1
0

27
Table 1.19Total number of notifications received for pertussis, 2011 – 2015
Table 1.20Age-gender distribution and age-specific incidence rate of reported pertussis cases, 2015
Age Male Female Total (%) Incidence rate per 100,000 population*
0 – <1yr 30 16 46 (80.7) 111.7 1 – 4 yrs 2 0 2 (3.5) 1.1 5 – 9 yrs 0 0 0 (0.0) 0.0 10 – 14 yrs 0 0 0 (0.0) 0.0 15 – 24 yrs 7 0 7 (12.2) 0.9 25 – 34 yrs 0 0 0 (0.0) 0.0 35 – 44 yrs 0 0 0 (0.0) 0.0 45 – 54 yrs 1 0 1 (1.8) 0.1 55 – 64 yrs 1 0 1 (1.8) 0.2 65 yrs+ 0 0 0 (0.0) 0.0
Total 41 16 57 (100.0) 1.0
*Rates are based on 2015 estimated mid-year population.(Source: Singapore Department of Statistics)
Table 1.21Ethnic-gender distribution and ethnic-specific incidence rate of reported pertussis cases, 2015
Male Female Total (%) Incidence rate per 100,000 population*
Singapore Resident Chinese 20 7 27 (47.4) 0.9 Malay 16 8 24 (42.1) 4.6 Indian 2 0 2 (3.5) 0.6 Others 2 1 3 (5.3) 2.4 Foreigner 1 0 1 (1.7) 0.1
Total 41 16 57 (100.0) 1.0
*Rates are based on 2015 estimated mid-year population.(Source: Singapore Department of Statistics)
2011 2012 2013 2014 2015 Age Group Local Imported Local Imported Local Imported Local Imported Local Imported
0 – 4 19 1 9 4 14 1 9 2 47 1 5 – 14 1 0 0 0 0 0 1 0 0 0 15 – 24 8 0 11 0 0 1 9 0 7 0 25 – 34 0 0 0 0 1 0 0 0 0 0 35 – 44 0 0 0 0 0 0 0 0 0 0 45 – 54 0 0 0 0 0 0 0 0 1 0 55 - 64 0 0 0 0 0 0 0 0 1 0 65+ 0 0 0 0 0 0 0 0 0 0
Total 28 1 20 4 15 2 19 2 56 1

28
PNEUMOCOCCAL DISEASE (INVASIVE)
Invasive pneumococcal disease (IPD) is an acute bacterial infection of the respiratory tract, brain or blood stream caused by Streptococcus pneumoniae. The mode of transmission is by droplets or close contact with the nasopharyngeal secretions of an infected person.
A total of 146 laboratory confirmed cases of invasive pneumococcal infection were reported in 2015, a decrease of 0.7% compared to 147 cases reported in 2014 (Figure 1.14). Of the 146 reported cases, three were imported cases and 143 indigenous cases (Table 1.22). The incidence rate was highest in those aged 65 years and above. Among the three major ethnic groups, Malays had the highest incidence rate, followed by Chinese and Indians (Tables 1.23 and 1.24). Of these 146 laboratory confirmed IPD cases, the number of serotyped cases was 119, which correspond to 81.5% of laboratory confirmed IPD cases. The predominant pneumococcal type for children cases was 19A and for adult cases was 3. (Tables 1.25 and 1.26). Six cases had received at least one dose of pneumococcal vaccines prior to onset of illness (Source: National Immunisation Registry).
Figure 1.14E-weekly distribution of reported invasive pneumococcal cases, 2014 – 2015
Table 1.22Total number of notifications received for invasive pneumococcal disease, 2011 – 2015
2011 2012 2013 2014 2015 Age Group Local Imported Local Imported Local Imported Local Imported Local Imported
0 – 4 15 0 16 1 9 1 14 0 10 1 5 – 14 11 0 9 0 8 1 7 1 9 0 15 – 24 8 0 10 0 1 1 2 1 4 0 25 – 34 7 0 19 0 13 3 11 0 9 1 35 – 44 14 0 8 0 11 0 9 1 11 0 45 – 54 19 0 16 0 17 1 11 1 15 0 55 - 64 21 0 31 0 36 0 24 3 25 0 65+ 53 0 52 1 64 1 62 0 60 1
Total 148 0 161 2 159 8 140 7 143 3
No. of Cases
1 3 5 7 9 11 13 15 17 19 21 23 25 27 29 31 33 35 37 39 41 43 45 47 49 51 53
Week2014 2015
0
1
4
5
6
7
2
3
8
9

29
Table 1.23Age-gender distribution and age-specific incidence rate of reported
invasive pneumococcal cases, 2015
Age Male Female Total (%) Incidence rate per 100,000 population*
0 – 4 8 3 11 (7.54) 4.8 5 – 14 4 5 9 (6.16) 1.9 15 – 24 3 1 4 (2.74) 0.5 25 – 34 5 5 10 (6.85) 0.8 35 – 44 9 2 11 (7.53) 1.1 45 – 54 13 2 15 (10.27) 2.0 55 - 64 14 11 25 (17.12) 4.3 65+ 44 17 61 (41.79) 12.0
Total 100 46 146 (100.0) 2.6
*Rates are based on 2015 estimated mid-year population.(Source: Singapore Department of Statistics)
Table 1.24Ethnic-gender distribution and ethnic-specific incidence rate of reported
invasive pneumococcal cases, 2015
Male Female Total (%) Incidence rate per 100,000 population*
Singapore Resident Chinese 54 27 81 (55.48) 2.8 Malay 19 12 31 (21.23) 6.0 Indian 8 2 10 (6.85) 2.8 Others 2 1 3 (2.05) 2.4 Foreigner 17 4 21 (14.39) 1.3
Total 100 46 146 (100.0) 2.6
*Rates are based on 2015 estimated mid-year population.(Source: Singapore Department of Statistics)
Table 1.25Distribution of pneumococcal serotypes among children cases, 2015
Pneumococcal Number of isolates Type/ Group (n = 18) (%)
Type 3 *§ 4 (22.21) Group 11 1 (5.56) Group 15 2 (11.11) Type 15C 1 (5.56) Type 18C *§ 1 (5.56) Type 19A § 5 (27.78) Type 6B *§ 1 (5.56) Type 23A 3 (16.66)
* Serotype included in PCV7, § serotype included in PCV13

30
Table 1.26Distribution of pneumococcal serotypes among adult cases, 2015
Pneumococcal Number of isolates Type/ Group (n = 101) (%)
Type 1 *§ 3 (2.97) Type 3 *§ 15 (14.85) Type 4 *§ 3 (2.97) Type 8 5 (4.95) Group 10 1 (0.99) Group 11 2 (1.98) Group 12 2 (1.98) Type 14 *§ 7 (6.93) Group 18 1 (0.99) Type 20 3 (2.97) Type 15A 1 (0.99) Type 15B 2 (1.98) Type 15C 1 (0.99) Type 15F 1 (0.99) Type 18C *§ 2 (1.98) Type 19A § 5 (4.95) Type 19F *§ 2 (1.98) Type 22A 1 (0.99) Type 22F 2 (1.98) Type 23A 4 (3.96) Type 23B 2 (1.98) Type 23F *§ 6 (5.94) Type 6A § 3 (2.97) Type 6B *§ 7 (6.93) Type 6C 2 (1.98) Type 7C § 1 (0.99) Type 7F § 8 (7.92) Type 9V *§ 1 (0.99) Non-groupable 8 (7.92)
* Serotype included in PCV7, § serotype included in PCV13
RUBELLA
Rubella is a generally mild febrile viral disease with a diffuse punctate and maculopapular rash sometimes resembling that of measles or scarlet fever. It is also commonly known as German measles. The causative agent is the rubella virus (genus Rubivirus) from the Togaviridae family and it is spread through droplets or by close contact with the nasopharyngeal secretions of an infected person.
Rubella incidence fluctuated during 1991 – 1999. This was followed by a steady decline from 1999 (10.9 per 100,000 population) to 2015 (0.3 per 100,000 population) (Figure 1.15).

31
Figure 1.15Incidence of reported rubella cases, 1991 – 2015
A total of 15 cases of rubella were reported in 2015, a decrease of 11.8% compared to 17 cases reported in 2014 (Figure 1.16). The incidence rate was highest in the 0 - 4 year age group (Table 1.27). 2 out of 3 female cases (0.5 per 100,000 female population) were in the reproductive age group of 15 – 44 years. Among the three major ethnic groups, Chinese had the highest incidence rate, Malay and Indian had no cases reported. Foreigners comprised 53.8% of cases (Table 1.28).
There were no cases of congenital rubella.
Figure 1.16 E-weekly distribution of reported rubella cases, 2014 – 2015
1 3 5 7 9 11 13 15 17 19 21 23 25 27 29 31 33 35 37 39 41 43 45 47 49 51
No. of Cases
Week2014 2015
1
0
2
3
4

32
Table 1.27Age-gender distribution and age-specific incidence rate of reported rubella cases^, 2015
Age (Yrs) Male Female Total (%) Incidence rate per 100,000 population*
0 – 4 3 1 4 (30.8) 1.8 5 – 14 1 0 1 (7.7) 0.2 15 – 24 0 1 1 (7.7) 0.1 25 – 34 4 0 4 (30.8) 0.3 35 – 44 2 1 3 (23.0) 0.3 45 – 54 0 0 0 0.0 55+ 0 0 0 0.0
Total 10 3 13 (100.0) 0.2
^Excluding two foreigners seeking medical treatment in Singapore*Rates are based on 2015 estimated mid-year population.
(Source: Singapore Department of Statistics)
Table 1.28Ethnic-gender distribution and ethnic-specific incidence rate of reported rubella cases^, 2015
Male Female Total (%) Incidence rate per 100,000 population*
Singapore Resident Chinese 5 1 6 (46.2) 0.2 Malay 0 0 0 (0.0) 0.0 Indian 0 0 0 (0.0) 0.0 Others 0 0 0 (0.0) 0.0 Foreigner 5 2 7 (53.8) 0.4
Total 10 3 13 (100.0) 0.2
^Excluding two foreigners seeking medical treatment in Singapore*Rates are based on 2015 estimated mid-year population.
(Source: Singapore Department of Statistics)
Table 1.29Total number of notifications received for Rubella, 2011 – 2015 ^
^excludes tourists and foreigners seeking medical treatment in Singapore
2011 2012 2013 2014 2015 Age Local Imported Local Imported Local Imported Local Imported Local Imported
< 6 mths 9 0 3 0 2 0 0 0 1 0 6 mths – < 1yr 1 – 4 yrs 10 0 9 0 3 0 5 0 3 0 5 – 9 yrs 5 0 3 0 0 0 1 0 1 0 10 – 14 yrs 2 0 1 0 0 0 1 0 0 0 15 – 24 yrs 18 0 10 0 2 0 0 0 1 0 25 – 34 yrs 28 1 21 1 10 1 3 1 4 0 35 – 44 yrs 15 1 4 0 12 2 2 2 3 0 45 – 54 yrs 8 0 5 0 7 0 0 0 0 0 55+ 7 0 1 0 5 0 0 0 0 0
Total 102 2 57 1 41 3 12 3 13 0

33
VIRAL CONJUNCTIVITIS
Viral conjunctivitis is a clinical syndrome characterised by inflammation of the conjunctiva of the eyes beginning with lacrimation, irritation and hyperemia of the palpebral and bulbar conjunctivae. The common causative agents are the adenoviruses and the enteroviruses.
In 2015, the polyclinics reported 22,693 attendances for conjunctivitis, a decrease of 13.5% compared to 26,227 attendances reported in 2014 (Figure 1.17).
Figure 1.17E-weekly distribution of reported conjunctivitis cases, 2014 – 2015
SEVERE ILLNESS AND DEATH FROM POSSIBLY INFECTIOUS CAUSES (SIDPIC) PROGRAMME
The SIDPIC programme is a hospital-based sentinel surveillance programme which reviews cases of unexplained deaths and critical illness to identify possible emerging infections caused by novel pathogens. It aims to reduce delays in recognising emerging infections of public health importance. The project is presently operational in four public hospitals (TTSH, NUH, SGH and KKH). In year 2015, a total of 12,406 hospital patients were screened by SIDPIC project coordinators in participating hospitals (Table 1.30). Of these, 217 SIDPIC cases that fulfilled the inclusion criteria were identified. The majority of SIDPIC cases (35.48%) had illnesses with respiratory syndromes (Table 1.31). Of the 217 cases identified in 2015, 108 were found to have alternate aetiologies. 47 of these 108 cases had causative pathogens found. The top two causative pathogens were respiratory viruses (17%), and Streptococcus (17%). The remaining cases had clinical presentations that were consistent with the clinical diagnosis, e.g. auto-immune disorders. Despite extensive laboratory testing, the aetiology in 109 (50.23%) cases remained unknown. Table 1.32 lists the pathogens which may be tested for under the SIDPIC programme.
1 Inclusion criteria of SIDPIC programme:• Age 1 to 49 years. • Previously healthy. Exclusion criteria: - Immunosuppression (e.g. HIV/ AIDS, cancers, and immune disorders) - Chronic diseases (e.g. cardiac, lung, renal and hepatic)• Clinical presentation suggestive of infection• Death or critically ill cases• Routine testing has not identified a known cause
1 3 5 7 9 11 13 15 17 19 21 23 25 27 29 31 33 35 37 39 41 43 45 47 49 51 53
200
406080
100120140160180
Average Daily No
Week2014 2015
34
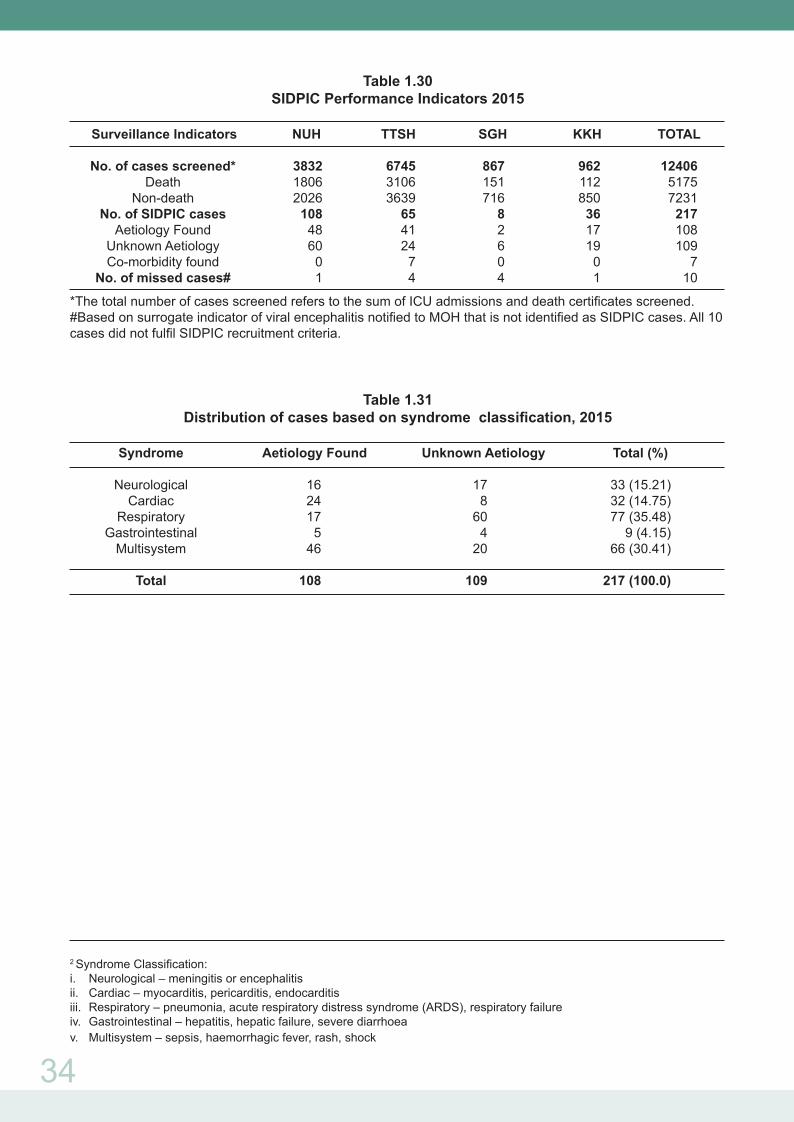
Table 1.30 SIDPIC Performance Indicators 2015
Surveillance Indicators NUH TTSH SGH KKH TOTAL No. of cases screened* 3832 6745 867 962 12406 Death 1806 3106 151 112 5175 Non-death 2026 3639 716 850 7231 No. of SIDPIC cases 108 65 8 36 217 Aetiology Found 48 41 2 17 108 Unknown Aetiology 60 24 6 19 109 Co-morbidity found 0 7 0 0 7 No. of missed cases# 1 4 4 1 10
*The total number of cases screened refers to the sum of ICU admissions and death certificates screened. #Based on surrogate indicator of viral encephalitis notified to MOH that is not identified as SIDPIC cases. All 10 cases did not fulfil SIDPIC recruitment criteria.
Table 1.31 Distribution of cases based on syndrome classification, 2015
Syndrome Aetiology Found Unknown Aetiology Total (%) Neurological 16 17 33 (15.21) Cardiac 24 8 32 (14.75) Respiratory 17 60 77 (35.48) Gastrointestinal 5 4 9 (4.15) Multisystem 46 20 66 (30.41)
Total 108 109 217 (100.0)
2 Syndrome Classification:i. Neurological – meningitis or encephalitisii. Cardiac – myocarditis, pericarditis, endocarditisiii. Respiratory – pneumonia, acute respiratory distress syndrome (ARDS), respiratory failureiv. Gastrointestinal – hepatitis, hepatic failure, severe diarrhoeav. Multisystem – sepsis, haemorrhagic fever, rash, shock

35
Abbreviations:
AFB = Acid-fast bacillusAg = AntigenCCHF = Crimean-Congo haemorrhagic feverCMV = CytomegalovirusE. coli O157:H7 = Escherichia coli serotype O157:H7EBV = Epstein-Barr virusEM = Electron microscopy EV = EnterovirusEV71 = Enterovirus Type 71H5N1 = Influenza A virus subtype H5N1HFRS = Haemorrhagic fever with renal syndromeHSV = Herpes simplex virusJE IgM = Japanese encephalitis immunoglobulin M
Respiratory SamplesMultiplex PCRInfluenza PCRH5N1 PCRSARS CoV-PCRMERS-CoV PCRTB PCR
BloodBacterial cultureMycoplasma serologyLegionella serologyChlamydia serologyH5N1 PCRSARS CoV-PCR
BloodBrucella serology
Respiratory SamplesViral isolationHantaan virus PCRNipah PCRZikavirus (Micronesia area)
BloodEV71 PCR
StoolEnterovirus PCR
BloodVirus isolation
UrineUrine culturePneumococcal AgLegionella Ag
Other samples (e.g. lung tissue)PCP stainFungal stain
Other samples (e.g. Cardiac tissue)Histopathology
Other samples (e.g. Cardiac tissue)EM, special stains
Cerebrospinal FluidBacterial cultureAFB PCR, cultureFungal cultureEnterovirus PCRHSV/ CMV/ VZV/ EBV PCRDengue PCRJE IgM, PCRWNV PCRNipah PCR
Respiratory SamplesEV PCRNipah PCR
Cerebrospinal FluidViral isolation, also consider lymphocytic choriomeningitis virus Rickettsial isolationKunjinChandipuraMeaslesPolioRabies, and other viral encephalitides dependent on travel history, e.g. WEE, SLE, VEE, Kyasanur forest disease (India)
StoolVibrio CholeraE. coli O157:H7
StoolRotavirus, astrovirus, sapovirus, adenovirus 40.41, Norovirus PCRViral isolation
First line panel*
Second line panel#
First line panel*
Second line panel#
Table 1.32 SIDPIC Lab Test Panels
Pneumonia EncephalitisViral
Haemorrhagic Fever
StoolEnterovirus PCRPoliovirus PCR
Other samples (e.g. Brain tissue)Histopathology
Toscana (from Europe/ Spain)Sindbis virus (Europe/ Australia/ Asia)
StoolViral isolation
Other samples (e.g. Brain tissue)EM
Other samples (e.g. Liver/ intestinal tissue)HistopathologySpecial stains
Other samples (e.g. Liver/ intestinal tissue)EM, special stains
Blood & Respiratory SamplesDengue PCR, serologyChikungunya PCR, serologyYellow fever PCR, serologyLassa, Ebola, Marburg fever
Blood & Respiratory SanplesVEE, CCHF, RVF and other South American arenaviruses, e.g. Junin, Machupo, Guanarito and Sabia viruses, depending on travel historyHFRSVirus isolationEM
BloodBacterial cultureYellow fever PCR, serology
Myocarditis Gastrointestinal
* First line panel: These are the first-line tests which may be conducted after a check has been made to ensure that these pathogens have not already been tested for, as part of the patient’s clinical management. # Second line panel: These tests may be conducted after the SIDPIC physician and the laboratory have evaluated the epidemiological and clinical features of the case.
MERS-CoV = Middle East respiratory syndrome coronavirusPCP = Pneumocystis carinii pneumoniaPCR = Polymerase chain reactionRVF = Rift Valley feverSARS-CoV = Severe acute respiratory syndrome coronavirus
SLE = St Louis encephalitis TB = TuberculosisVEE = Venezuelan equine encephalitisVZV = Varicella zoster virusWEE = Western equine encephalitisWNV = West Nile Virus
36
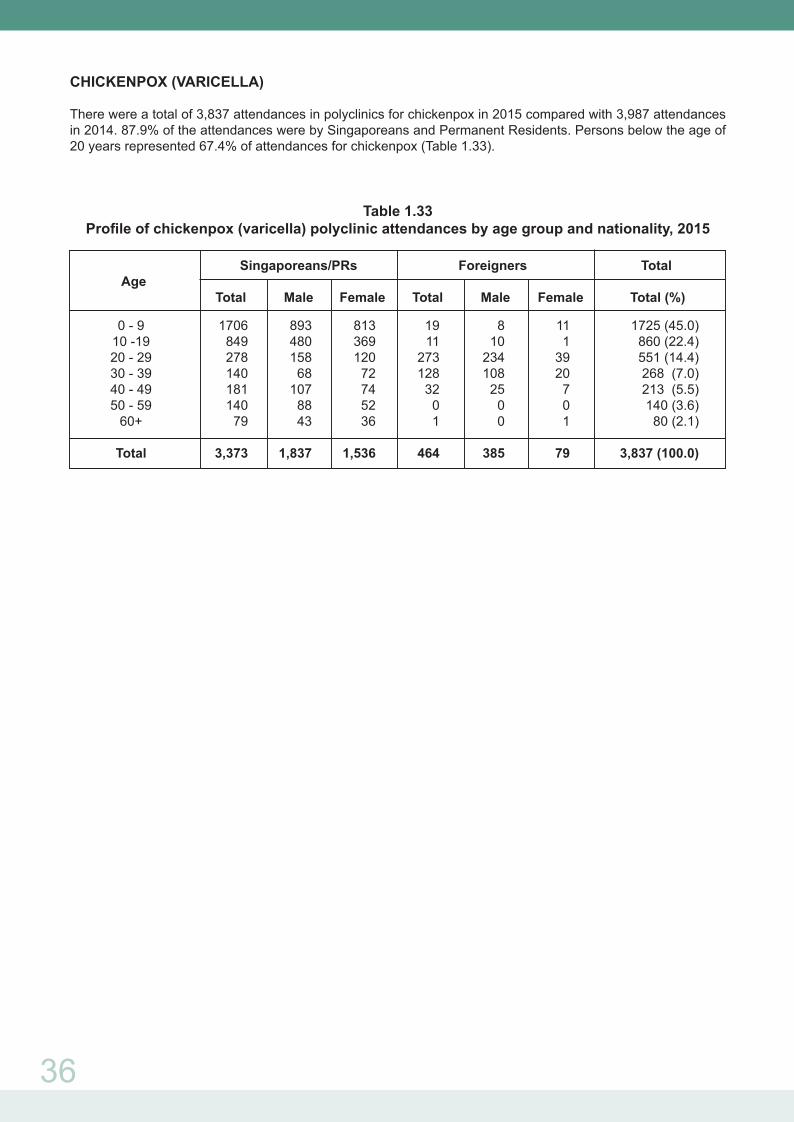
CHICKENPOX (VARICELLA)
There were a total of 3,837 attendances in polyclinics for chickenpox in 2015 compared with 3,987 attendances in 2014. 87.9% of the attendances were by Singaporeans and Permanent Residents. Persons below the age of 20 years represented 67.4% of attendances for chickenpox (Table 1.33).
Table 1.33Profile of chickenpox (varicella) polyclinic attendances by age group and nationality, 2015
Singaporeans/PRs Foreigners Total Age Total Male Female Total Male Female Total (%)
0 - 9 1706 893 813 19 8 11 1725 (45.0) 10 -19 849 480 369 11 10 1 860 (22.4) 20 - 29 278 158 120 273 234 39 551 (14.4) 30 - 39 140 68 72 128 108 20 268 (7.0) 40 - 49 181 107 74 32 25 7 213 (5.5) 50 - 59 140 88 52 0 0 0 140 (3.6) 60+ 79 43 36 1 0 1 80 (2.1)
Total 3,373 1,837 1,536 464 385 79 3,837 (100.0)