Embed Size (px)
Citation preview
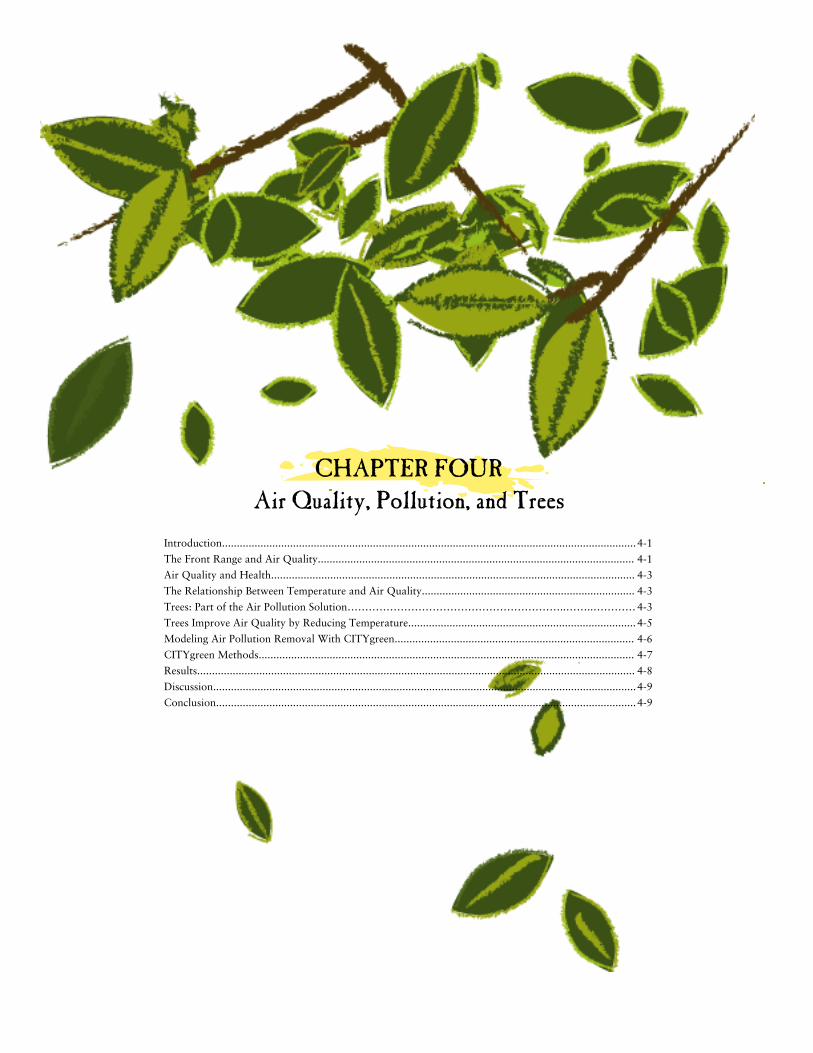
Introduction............................................................................................................................................
The Front Range and Air Quality...........................................................................................................
Air Quality and Health...........................................................................................................................
The Relationship Between Temperature and Air Quality........................................................................
Trees: Part of the Air Pollution Solution……………………………………………………..……..…………
Trees Improve Air Quality by Reducing Temperature.............................................................................
Modeling Air Pollution Removal With CITYgreen.................................................................................
CITYgreen Methods...............................................................................................................................
Results....................................................................................................................................................
Discussion...............................................................................................................................................
Conclusion..............................................................................................................................................
CHAPTER FOURAir Quality, Pollution, and Trees
4-1
4-1
4-3
4-3
4-3
4-5
4-6
4-7
4-8
4-9
4-9

Air Quality, Pollution, and Trees
IntroductionResidents of Boulder witness both the brown skies of winter and the haze of summer. Although local weather patterns can sometimes exasperate air quality on a bad day, it is most often the rapid growth of the surrounding metro area that has been blamed for substandard air quality. Air pollution comes primarily from burning fossil fuels, both for power generation and in vehicles. Low air quality has been implicated as causing numerous health problems and contributing to rising health care costs.
Trees remove a significant amount of pollution from the atmosphere as part of their normal functioning. They directly increase the quality of the air in the city and it’s surrounding area and should be considered an integral part of any comprehensive plan aimed at improving overall air quality.
The Front Range and Air Quality Colorado’s Front Range has a long-standing problem with air quality.
When the EPA passed the Federal Clean Air Act in 1970, it designated the
Denver metro area as a non-attainment area for several federal air quality
standards. Since then the region has often violated the standard for
carbon monoxide, ozone, and particulate matter. For instance, in the late
1970’s, Denver violated federal air quality standards more than 200 days
a year. The recent regional trend, though, is of increasing air quality, as
the EPA reports a significant improvement in the last 25 years,66 and has
had fewer than 15 violations over the last five years. In fact, because of a
low occurrence of violations, the region is now moving toward re-
designation as an attainment area for Colorado.
Because Boulder is only a small part of a much larger airshed (similar to a watershed), it is affected by the same air quality issues as the larger region of the Northern Front Range. Because it is impossible to control, movement of polluted air is completely dependent upon the surrounding weather systems. While wind is responsible for rapidly dispersing air pollution, temperature inversions and lack of wind are responsible for keeping it put for extended periods of time.85
Motor vehicles are the largest source of air pollution in Boulder County and the Front Range. In fact, 66% of criteria air pollutants in Boulder County are from mobile sources such as automobiles, reports the Boulder
County Clean Air Consortium.68 These mobile sources are responsible not
Page 1 Q Chapter 4 Q Air Quality, Pollution, and Trees
POver 200,000 people in Boulder County face a cancer risk more than 100 times the goal set by the Clean Air Act.68
Non-attainment area: Areas of the country where air pollution levels persistently exceed the national ambient air quality standards may be designated this way.
Criteria air pollutants: The EPA has set national standards for the six most common air pollutants, called criteria air pollutants because the agency has regulated them by first developing health-based criteria (science-based guidelines) as the basis for setting permissible levels.83
P“The air quality problem along the northern Front Range of Colorado is distinctly regional in nature. Air pollution from Douglas County to the Wyoming state line collects in the South Platte River Valley and creates the Brown Cloud. In fact, the recently completed Northern Front Range Air Quality Study measured levels of PM2.5 in rural areas northeast of Greeley that were as high as levels in downtown Denver.”67
only for emitting pollutants from their tailpipes, but also kick up street sand and dust from the region’s paved and unpaved roadways. Particulate matter is responsible for approximately 70 percent of the “Brown Cloud” and can lead to violations of the federal health standards, according to the Regional Air Quality Council.67
Automobile emissions are the primary source of our air pollutants, and therefore the growing population of the Front Range, owning an increasing number of vehicles, will contribute increasingly to the air quality issue. In 1999, there were just under 63,000 vehicles registered within the City of Boulder. Although new cars are burning fuel cleaner than ever, growth projections for Boulder County show approximately 62,000 additional automobiles in Boulder County by the year 2010.69 Slight increases in fuel economy and emissions in newer vehicles cannot mitigate for such an increase in not only the number of vehicles, but the number of miles travelled. For the past 10 years, the number of vehicle miles driven in Boulder has increased at a greater rate than population.70 Other studies have shown a direct correlation between increasing population and decreasing air quality.71
Air Quality, Pollution, and Trees Q Chapter 4 Q Page 2
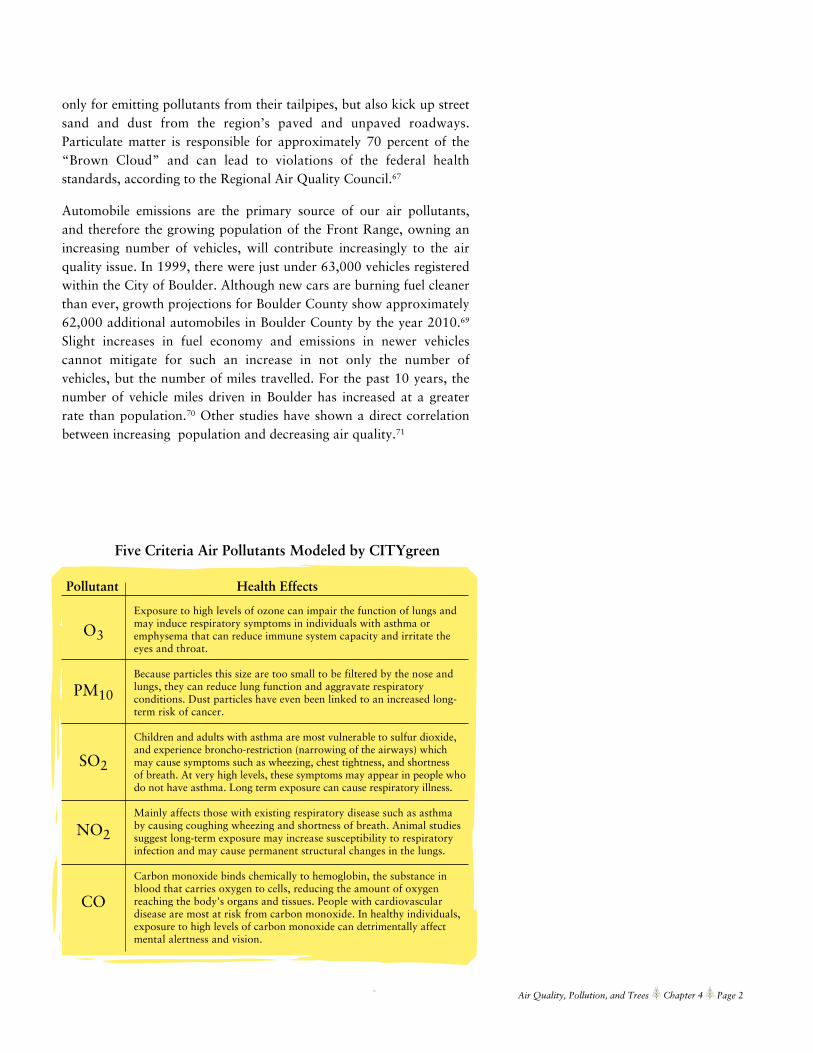
Exposure to high levels of ozone can impair the function of lungs and may induce respiratory symptoms in individuals with asthma or emphysema that can reduce immune system capacity and irritate the eyes and throat.
Because particles this size are too small to be filtered by the nose and lungs, they can reduce lung function and aggravate respiratory conditions. Dust particles have even been linked to an increased long-term risk of cancer.
Children and adults with asthma are most vulnerable to sulfur dioxide, and experience broncho-restriction (narrowing of the airways) which may cause symptoms such as wheezing, chest tightness, and shortness of breath. At very high levels, these symptoms may appear in people who do not have asthma. Long term exposure can cause respiratory illness.
Mainly affects those with existing respiratory disease such as asthma by causing coughing wheezing and shortness of breath. Animal studies suggest long-term exposure may increase susceptibility to respiratory infection and may cause permanent structural changes in the lungs.
Carbon monoxide binds chemically to hemoglobin, the substance in blood that carries oxygen to cells, reducing the amount of oxygen reaching the body's organs and tissues. People with cardiovascular disease are most at risk from carbon monoxide. In healthy individuals, exposure to high levels of carbon monoxide can detrimentally affect mental alertness and vision.
O3
PM10
SO2
NO2
CO
Pollutant Health Effects
Five Criteria Air Pollutants Modeled by CITYgreen
Air Quality and HealthEpidemiological research over the last two decades has determined that there is a direct relationship between poor air quality and a decline in overall human health.75 The EPA estimates that mobile (car, truck, bus) sources of air toxics account for as much as half of all cancers attributed to outdoor sources of air toxics (based on predictive models).
Impacts on the health care system involve increased resource utilization and associated expenditures that are related to treating air quality-induced illnesses.
The Relationship Between Temperature and Air QualityVehicles are responsible for emitting pollutants even when they are not
driven. Refer to Chapter 2 of this report for more information about
urban heat islands. A vehicle is full of volatile substances such as fuel, oil,
and coolant that evaporate on warm summer days while parked.
The evaporation rate is temperature dependent, therefore a vehicle parked
in an unshaded spot in a hot parking lot during the summertime is also
creating more air pollution than a vehicle parked in a shaded spot or
parking lot. According to US Forest Service researcher Dr. Gregory
McPherson, evaporation from parked cars counts for over 15% of
reactive organic gas emissions from vehicles.73
Higher urban temperatures also accelerate the production of smog, of which ozone is a major component. Ozone is not emitted directly as a
pollutant but is formed in the atmosphere through a complex set of
chemical reactions involving hydrocarbons, oxides of nitrogen, and
sunlight. Problematic ground level ozone should not be confused with
atmospheric ozone (consider it “good up high, bad nearby”). While ozone
in the upper atmosphere occurs naturally and acts as an ultraviolet filter,
ground level ozone is considered a noxious pollutant. The rate at which
the reactions proceed is related to both temperature and intensity of the
sunlight. Because of this, problematic ground level ozone occurs most
frequently on hot summer afternoons. These conditions result in increased
illness, lost work and health care costs.
Trees: Part of the Air Pollution Solution Trees provide a large leaf surface onto which particles are deposited and gases removed.76 Pollution is removed by nearly all parts of a tree; the soil, roots, and vegetative portions (leaves, stems and bark) of urban forest ecosystems all function as sinks for atmospheric pollution.
Page 3 Q Chapter 4 Q Air Quality, Pollution, and Trees
PIt is estimated that about 60,000 people die annually in the United States from the effects of particulate pollution.72
PA study completed by McPherson and others demonstrated differences in vehicle in-tank temperatures for cars parked in shaded parking lots and cars parked without shade. Maximum temperatures inside the fuel tank of the unshaded vehicle reached 106.9oF, while the maximum temperature inside the tank of the shaded vehicle only reached 101.5oF. Cabin temperature of the same vehicles showed similar patterns, with the shaded vehicle being approximately 45oF cooler between the hours of noon and 5:00 PM. 74
Trees “breathe”, or respirate, and exchange gases similar to the way humans do, yet the methods and results are quite different. Trees intake gases through stomates, or holes, on their leaves; these gases include those necessary for the tree’s functioning as well as other gaseous air pollutants. Once inside the leaf, gases diffuse into the spaces between the cells of the leaf to be absorbed by water films or chemically altered by plant tissues. Trees also reduce air pollution by intercepting airborne particles and retaining them on the leaf surface, called dry deposition. Some can be absorbed by the leaf surface itself, although most remain on the plant surface.84
Leaf surfaces are most efficient at removing pollutants that are water-soluble including sulfur dioxide, nitrogen dioxide and ozone. Pollutant removal rates are highest when vegetative surfaces are wet or damp; these conditions can increase removal rates ten-fold because the entire trees surface (leaves, twigs, trunk, and branches) is available for pollutant uptake. Because of the drier climate, trees of the Front Range are not as efficient at removing airborne chemicals as trees in a humid climate.
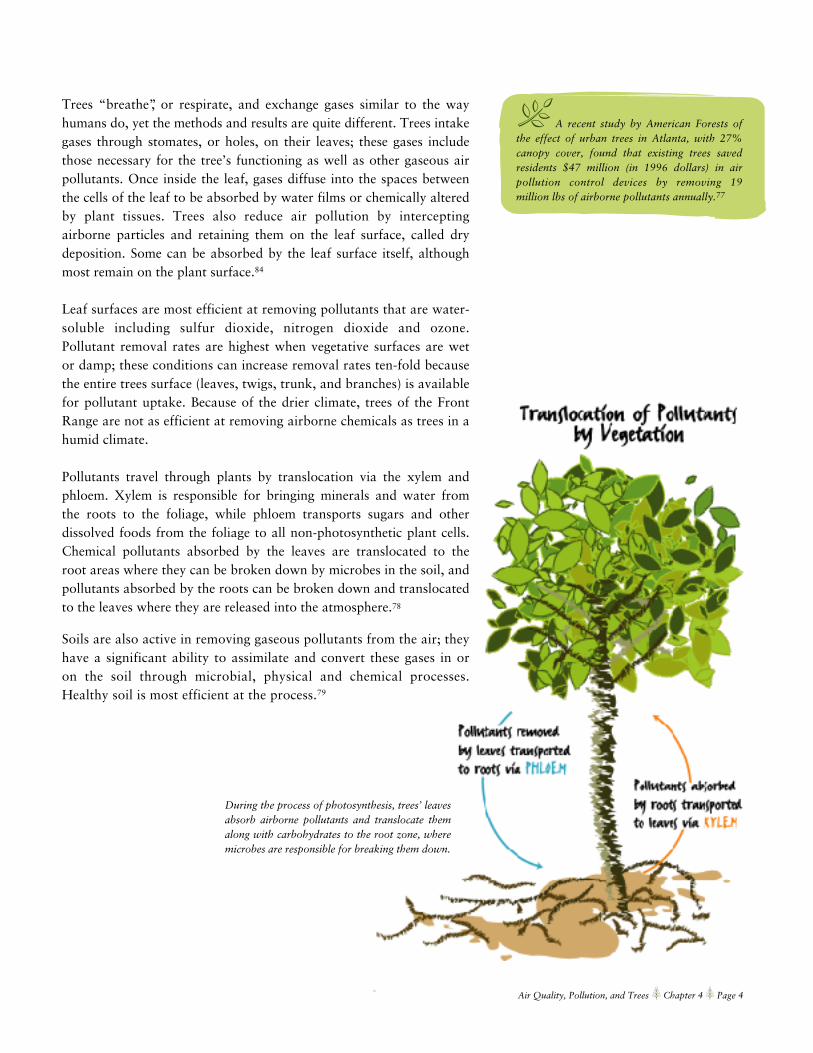
Pollutants travel through plants by translocation via the xylem and phloem. Xylem is responsible for bringing minerals and water from the roots to the foliage, while phloem transports sugars and other dissolved foods from the foliage to all non-photosynthetic plant cells. Chemical pollutants absorbed by the leaves are translocated to the root areas where they can be broken down by microbes in the soil, and pollutants absorbed by the roots can be broken down and translocated to the leaves where they are released into the atmosphere.78
Soils are also active in removing gaseous pollutants from the air; they have a significant ability to assimilate and convert these gases in or on the soil through microbial, physical and chemical processes. Healthy soil is most efficient at the process.79
Air Quality, Pollution, and Trees Q Chapter 4 Q Page 4
PA recent study by American Forests of the effect of urban trees in Atlanta, with 27% canopy cover, found that existing trees saved residents $47 million (in 1996 dollars) in air pollution control devices by removing 19 million lbs of airborne pollutants annually.77
During the process of photosynthesis, trees’ leaves absorb airborne pollutants and translocate them along with carbohydrates to the root zone, where microbes are responsible for breaking them down.

Trees Improve Air Quality By Reducing TemperatureTrees are also responsible for reducing summertime high temperatures, and therefore slowing the rates at which many air pollutants are formed and volatized. Reduction of air temperatures in summertime help to reduce pollution in three ways:
1. By reducing chemical reaction rates in the atmosphere that result in ozone formation. Lower temperatures reduce ozone-precursor emission rates, thus influencing ozone formation.
2. By decreasing temperature-dependent emissions of hydrocarbons from both natural and manmade sources.
3. By decreasing emissions of pollutants from electric power plants due to reduced air conditioning demands.80,84
In addition to all of the above, vegetation is also extremely efficient at removing the toxic chemicals benzene and formaldehyde from the air.
Interception of particles by vegetation has been shown to be much greater for street trees due to their proximity to high intensities of road traffic.81
Page 5 Q Chapter 4 Q Air Quality, Pollution, and Trees
Trees in close proximity to cars, a major source of air pollution, are especially important.
Trees Affect Temperature and Air Quality Results
Reduce AC Use
Reduce outdoortemperatures
Reduce demand forenergy generation at
power plant
Area sources emit lessat lower temperatures
Slower chemicalreaction rates
Fewer pollutantsemitted duringpower generation
Lower CO2, NO2,and VOC levels
Lower ozone levels
Modeling Air Pollution Removal With CITYgreenCITYgreen’s Air Pollution Removal model is based on research by Dr. David Nowak of the USDA Forest Service, and measures the ability of an urban forest to mitigate airborne pollution using an adaptation of the Urban Forests Effects (UFORE-D) module. The model is based on data collected in 50 U.S. cities, and estimates the removal of ozone, sulfur dioxide (SO2), nitrogen dioxide (NO2), carbon monoxide (CO), and particulate matter less than 10 microns (PM10) that can be attributed to the urban forest. Each of the aforementioned pollutants are considered criteria air pollutants by the EPA.83
Area covered by tree canopy is the only parameter required to run this model. Pollution removal rates vary by region and are a function of humidity, growing season, and climate, among other things. Pollution removal estimates are generated using regional data that takes into account air pollutant deposition factors; in this case data collected in Denver, Colorado was used to determine Boulder’s figures.
The monetary values associated with the removal of the five air pollutants are based on median externality values for each pollutant that consider the direct and indirect costs associated with a pollutant once it enters the atmosphere. These values, developed by state and governmental agencies, are a means to quantify the net cost to society of a given amount of air pollutant emitted.86 Two factors are involved: the cost of physically removing the pollutants using industrial scrubbers as a form of emission control, as well as the long term increase in health care costs that result when individuals breathe polluted air.
Air Quality, Pollution, and Trees Q Chapter 4 Q Page 6
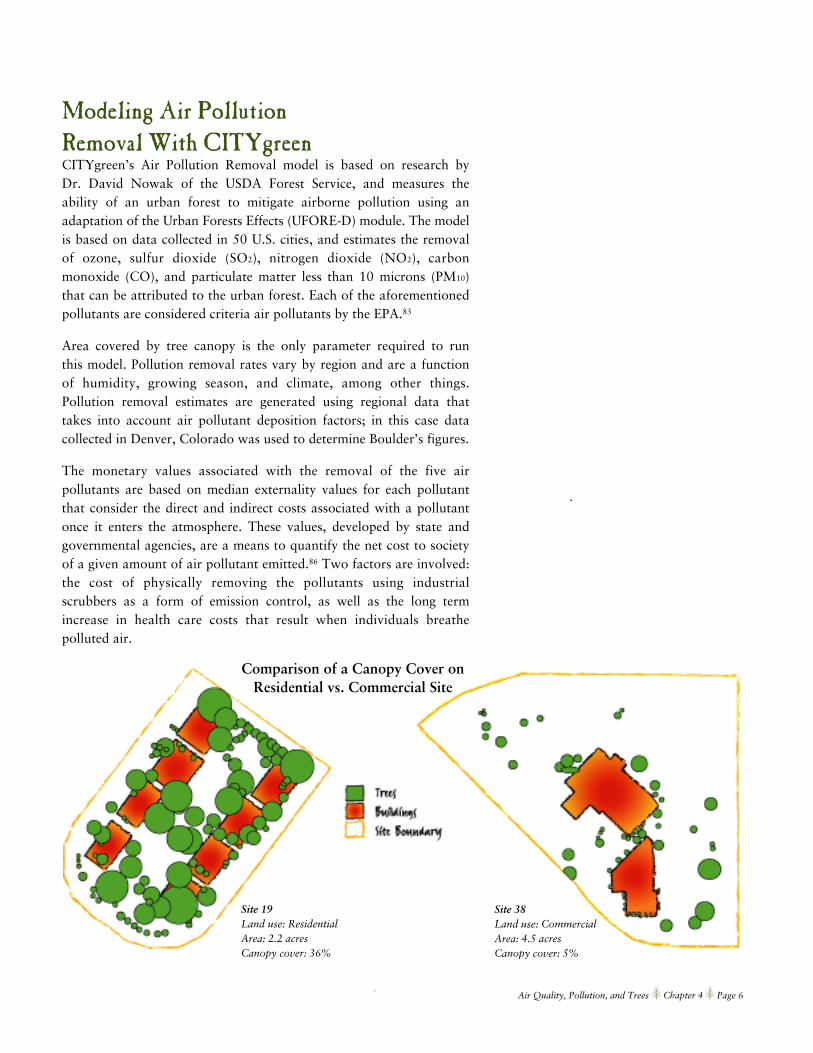
Site 38Land use: CommercialArea: 4.5 acresCanopy cover: 5%
Site 19Land use: ResidentialArea: 2.2 acresCanopy cover: 36%
Comparison of a Canopy Cover onResidential vs. Commercial Site
CITYgreen Methods32 sites were surveyed in the four land use categories (residential, commercial, industrial, and public); the number of sites selected in each category represents the relative amount of land in the City covered by that particular land use. The method for measuring trees in riparian areas differed due to the fact that mapping individual trees in densely forested areas is very difficult and time consuming.
At each site, the canopy of individual trees was traced onto a field map and later digitized using GIS software. After digitizing, which gave the trees and their canopy real-world coordinates, the size of each canopy was calculated, and all canopy was totaled and compared to the overall acreage of the site, enabling the estimation of the overall canopy cover
percent for each site.
The canopy cover for each generalized land use category was determined by averaging the canopy cover for all sites within each land use type. Because the acreage of each land use type was known, (the information was gathered from Zoning GIS data provided by the City of Boulder) this acreage was then multiplied by the average canopy cover to determine the amount of canopy acres within that land use type across the city. Using this method it was possible estimate the number of acres of canopy in all land use types within the entire city. Trees within the different land use types are treated identically in terms of their air pollution removal potential.
To estimate canopy cover in riparian areas, aerial photos of the entire city were examined and from these, patches of trees and shrubs in riparian areas were digitized. Riparian areas cover approximately 6% of the City of Boulder;82 digitized trees and shrubs covered approximately 40% of these areas.
Page 7 Q Chapter 4 Q Air Quality, Pollution, and Trees
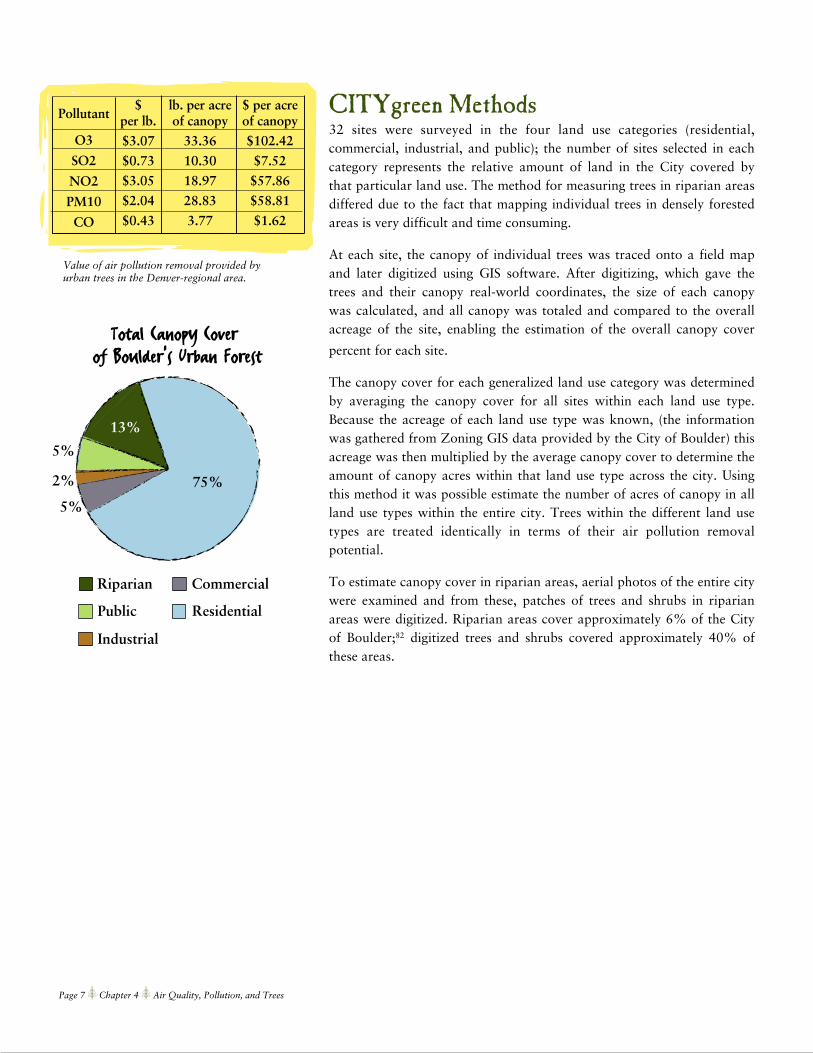
Pollutant
O3
SO2
NO2
PM10
CO
$per lb.
$3.07
$0.73
$3.05
$2.04
$0.43
lb. per acreof canopy
33.36
10.30
18.97
28.83
3.77
$ per acreof canopy
$102.42
$7.52
$57.86
$58.81
$1.62
Riparian
Value of air pollution removal provided byurban trees in the Denver-regional area.
Total Canopy Cover of Boulder's Urban Forest
Commercial
Public
Industrial
Residential
75%
5%
2%
5%
13%
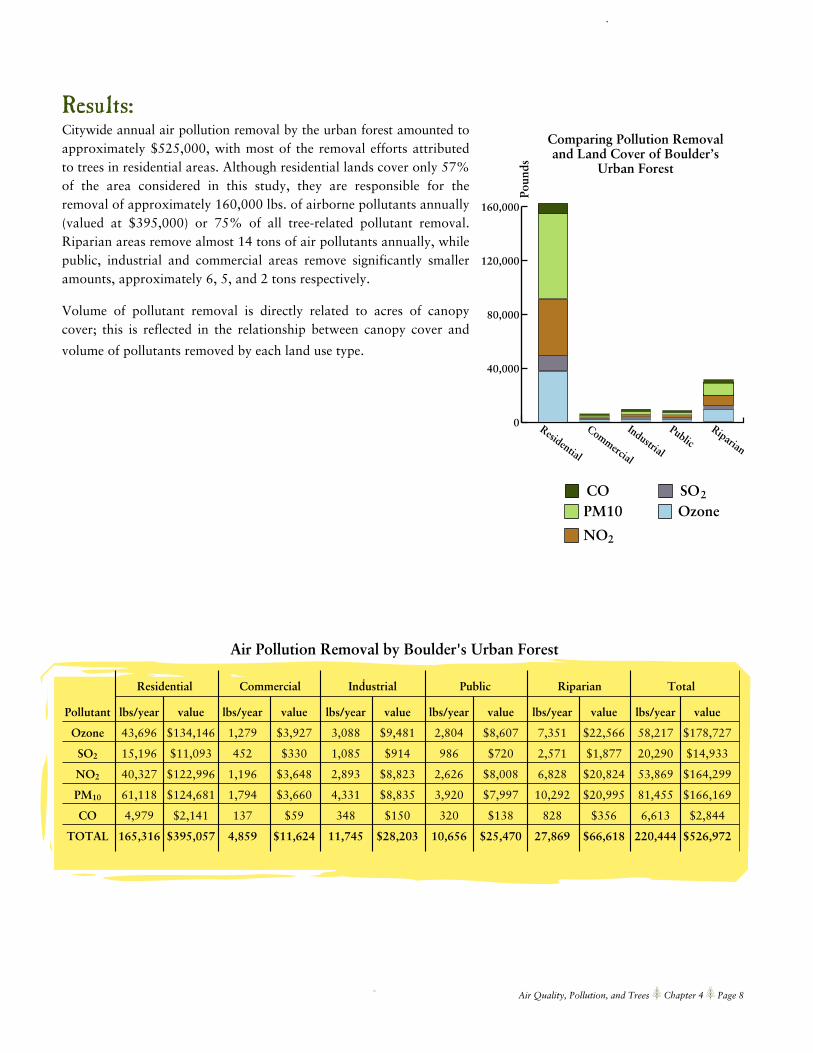
Results:Citywide annual air pollution removal by the urban forest amounted to approximately $525,000, with most of the removal efforts attributed to trees in residential areas. Although residential lands cover only 57% of the area considered in this study, they are responsible for the removal of approximately 160,000 lbs. of airborne pollutants annually (valued at $395,000) or 75% of all tree-related pollutant removal. Riparian areas remove almost 14 tons of air pollutants annually, while public, industrial and commercial areas remove significantly smaller amounts, approximately 6, 5, and 2 tons respectively.
Volume of pollutant removal is directly related to acres of canopy cover; this is reflected in the relationship between canopy cover and
volume of pollutants removed by each land use type.
Air Quality, Pollution, and Trees Q Chapter 4 Q Page 8
Pollutant
Ozone
SO2
NO2
PM10
CO
TOTAL
lbs/year
43,696
15,196
40,327
61,118
4,979
165,316
value
$134,146
$11,093
$122,996
$124,681
$2,141
$395,057
lbs/year
1,279
452
1,196
1,794
137
4,859
value
$3,927
$330
$3,648
$3,660
$59
$11,624
lbs/year
3,088
1,085
2,893
4,331
348
11,745
value
$9,481
$914
$8,823
$8,835
$150
$28,203
lbs/year
2,804
986
2,626
3,920
320
10,656
value
$8,607
$720
$8,008
$7,997
$138
$25,470
lbs/year
7,351
2,571
6,828
10,292
828
27,869
value
$22,566
$1,877
$20,824
$20,995
$356
$66,618
lbs/year
58,217
20,290
53,869
81,455
6,613
220,444
value
$178,727
$14,933
$164,299
$166,169
$2,844
$526,972
Comparing Pollution Removaland Land Cover of Boulder’s
Urban Forest
Residential
Commercial
Industrial
PublicRiparian
Poun
ds
0
40,000
80,000
120,000
160,000
CO SO2
PM10
NO2
Ozone
Residential Commercial Industrial Public Riparian Total
Air Pollution Removal by Boulder's Urban Forest
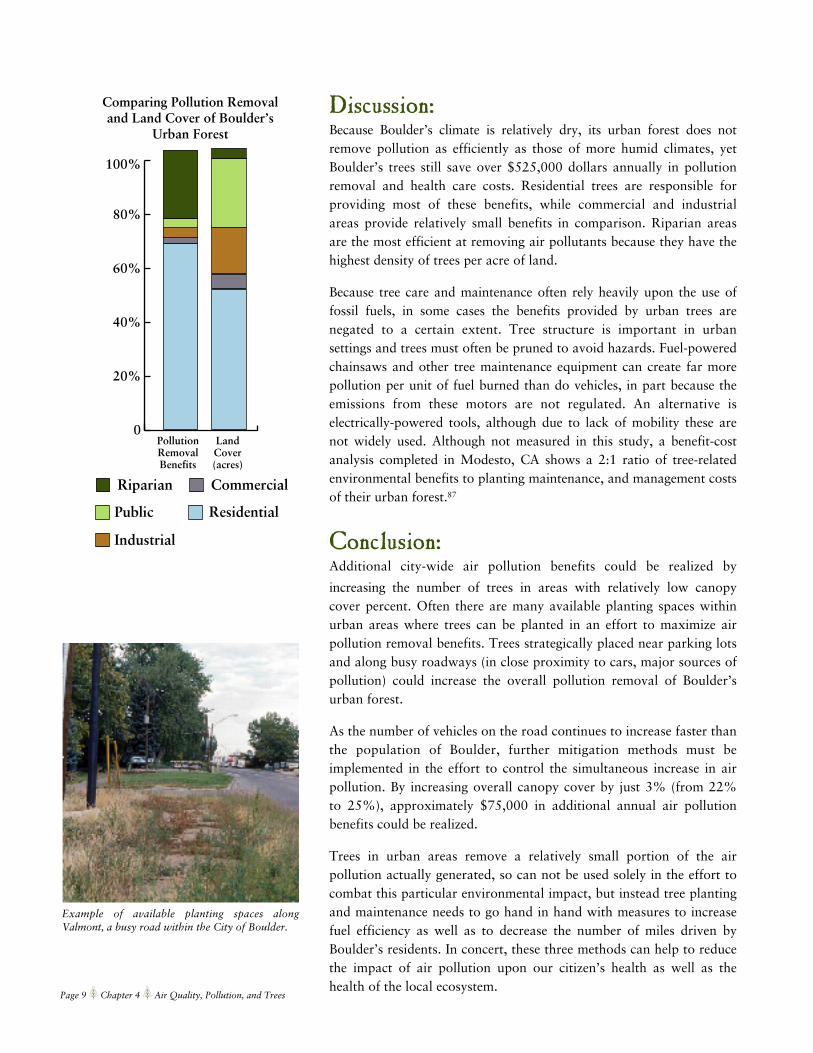
Discussion:Because Boulder’s climate is relatively dry, its urban forest does not remove pollution as efficiently as those of more humid climates, yet Boulder’s trees still save over $525,000 dollars annually in pollution removal and health care costs. Residential trees are responsible for providing most of these benefits, while commercial and industrial areas provide relatively small benefits in comparison. Riparian areas are the most efficient at removing air pollutants because they have the highest density of trees per acre of land.
Because tree care and maintenance often rely heavily upon the use of fossil fuels, in some cases the benefits provided by urban trees are negated to a certain extent. Tree structure is important in urban settings and trees must often be pruned to avoid hazards. Fuel-powered chainsaws and other tree maintenance equipment can create far more pollution per unit of fuel burned than do vehicles, in part because the emissions from these motors are not regulated. An alternative is electrically-powered tools, although due to lack of mobility these are not widely used. Although not measured in this study, a benefit-cost analysis completed in Modesto, CA shows a 2:1 ratio of tree-related environmental benefits to planting maintenance, and management costs of their urban forest.87
Conclusion:Additional city-wide air pollution benefits could be realized by
increasing the number of trees in areas with relatively low canopy cover percent. Often there are many available planting spaces within urban areas where trees can be planted in an effort to maximize air pollution removal benefits. Trees strategically placed near parking lots and along busy roadways (in close proximity to cars, major sources of pollution) could increase the overall pollution removal of Boulder’s urban forest.
As the number of vehicles on the road continues to increase faster than the population of Boulder, further mitigation methods must be implemented in the effort to control the simultaneous increase in air pollution. By increasing overall canopy cover by just 3% (from 22% to 25%), approximately $75,000 in additional annual air pollution benefits could be realized.
Trees in urban areas remove a relatively small portion of the air pollution actually generated, so can not be used solely in the effort to combat this particular environmental impact, but instead tree planting and maintenance needs to go hand in hand with measures to increase fuel efficiency as well as to decrease the number of miles driven by Boulder’s residents. In concert, these three methods can help to reduce the impact of air pollution upon our citizen’s health as well as the health of the local ecosystem.
Page 9 Q Chapter 4 Q Air Quality, Pollution, and Trees
Comparing Pollution Removaland Land Cover of Boulder’s
Urban Forest
PollutionRemovalBenefits
LandCover(acres)
0
20%
40%
60%
80%
100%
Riparian Commercial
Public
Industrial
Residential
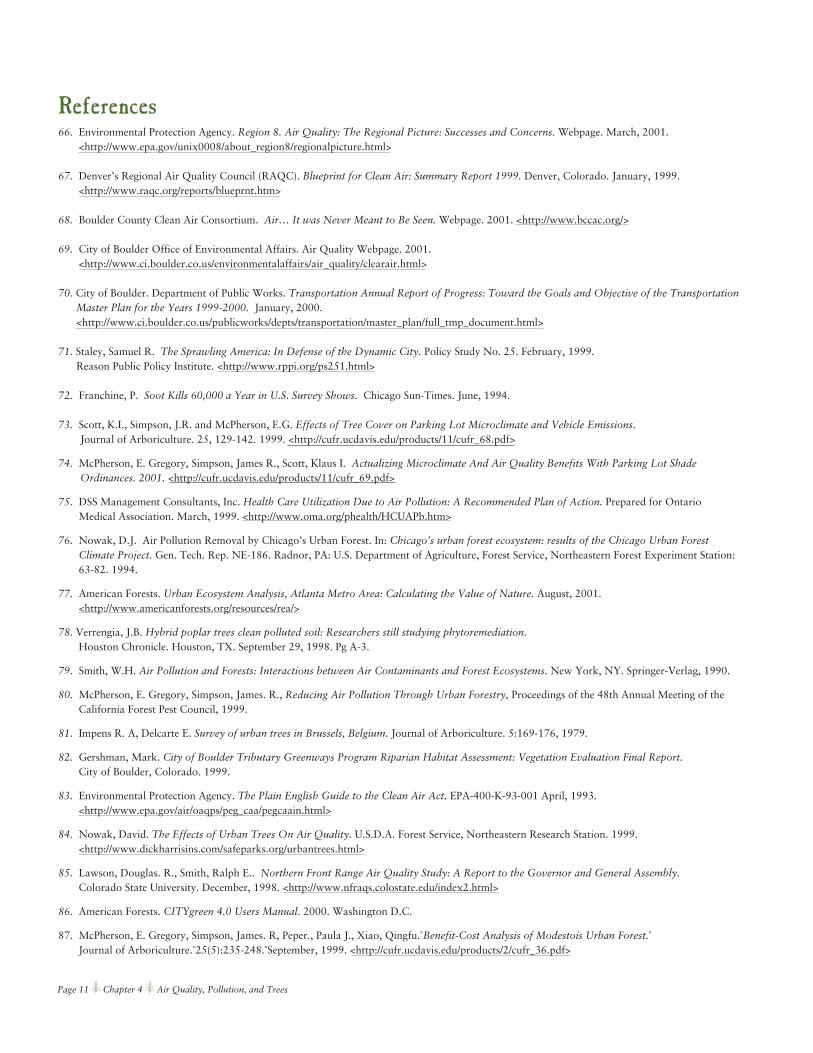
Example of available planting spaces along Valmont, a busy road within the City of Boulder.
Page 11 Q Chapter 4 Q Air Quality, Pollution, and Trees
References66. Environmental Protection Agency. Region 8. Air Quality: The Regional Picture: Successes and Concerns. Webpage. March, 2001.
<http://www.epa.gov/unix0008/about_region8/regionalpicture.html>
67. Denver’s Regional Air Quality Council (RAQC). Blueprint for Clean Air: Summary Report 1999. Denver, Colorado. January, 1999. <http://www.raqc.org/reports/blueprnt.htm>
68. Boulder County Clean Air Consortium. Air… It was Never Meant to Be Seen. Webpage. 2001. <http://www.bccac.org/>
69. City of Boulder Office of Environmental Affairs. Air Quality Webpage. 2001.<http://www.ci.boulder.co.us/environmentalaffairs/air_quality/clearair.html>
70. City of Boulder. Department of Public Works. Transportation Annual Report of Progress: Toward the Goals and Objective of the Transportation Master Plan for the Years 1999-2000. January, 2000. <http://www.ci.boulder.co.us/publicworks/depts/transportation/master_plan/full_tmp_document.html>
71. Staley, Samuel R. The Sprawling America: In Defense of the Dynamic City. Policy Study No. 25. February, 1999.Reason Public Policy Institute. <http://www.rppi.org/ps251.html>
72. Franchine, P. Soot Kills 60,000 a Year in U.S. Survey Shows. Chicago Sun-Times. June, 1994.
73. Scott, K.I., Simpson, J.R. and McPherson, E.G. Effects of Tree Cover on Parking Lot Microclimate and Vehicle Emissions. Journal of Arboriculture. 25, 129-142. 1999. <http://cufr.ucdavis.edu/products/11/cufr_68.pdf>
74. McPherson, E. Gregory, Simpson, James R., Scott, Klaus I. Actualizing Microclimate And Air Quality Benefits With Parking Lot Shade Ordinances. 2001. <http://cufr.ucdavis.edu/products/11/cufr_69.pdf>
75. DSS Management Consultants, Inc. Health Care Utilization Due to Air Pollution: A Recommended Plan of Action. Prepared for Ontario Medical Association. March, 1999. <http://www.oma.org/phealth/HCUAPb.htm>
76. Nowak, D.J. Air Pollution Removal by Chicago’s Urban Forest. In: Chicago’s urban forest ecosystem: results of the Chicago Urban Forest Climate Project. Gen. Tech. Rep. NE-186. Radnor, PA: U.S. Department of Agriculture, Forest Service, Northeastern Forest Experiment Station: 63-82. 1994.
77. American Forests. Urban Ecosystem Analysis, Atlanta Metro Area: Calculating the Value of Nature. August, 2001. <http://www.americanforests.org/resources/rea/>
78. Verrengia, J.B. Hybrid poplar trees clean polluted soil: Researchers still studying phytoremediation.Houston Chronicle. Houston, TX. September 29, 1998. Pg A-3.
79. Smith, W.H. Air Pollution and Forests: Interactions between Air Contaminants and Forest Ecosystems. New York, NY. Springer-Verlag, 1990.
80. McPherson, E. Gregory, Simpson, James. R., Reducing Air Pollution Through Urban Forestry, Proceedings of the 48th Annual Meeting of the California Forest Pest Council, 1999.
81. Impens R. A, Delcarte E. Survey of urban trees in Brussels, Belgium. Journal of Arboriculture. 5:169-176, 1979.
82. Gershman, Mark. City of Boulder Tributary Greenways Program Riparian Habitat Assessment: Vegetation Evaluation Final Report. City of Boulder, Colorado. 1999.
83. Environmental Protection Agency. The Plain English Guide to the Clean Air Act. EPA-400-K-93-001 April, 1993. <http://www.epa.gov/air/oaqps/peg_caa/pegcaain.html>
84. Nowak, David. The Effects of Urban Trees On Air Quality. U.S.D.A. Forest Service, Northeastern Research Station. 1999. <http://www.dickharrisins.com/safeparks.org/urbantrees.html>
85. Lawson, Douglas. R., Smith, Ralph E.. Northern Front Range Air Quality Study: A Report to the Governor and General Assembly.Colorado State University. December, 1998. <http://www.nfraqs.colostate.edu/index2.html>
86. American Forests. CITYgreen 4.0 Users Manual. 2000. Washington D.C.
87. McPherson, E. Gregory, Simpson, James. R, Peper., Paula J., Xiao, Qingfu. Benefit-Cost Analysis of Modestoís Urban Forest. Journal of Arboriculture. 25(5):235-248. September, 1999. <http://cufr.ucdavis.edu/products/2/cufr_36.pdf>