Embed Size (px)
Citation preview

ECONOMIC DEVELOPMENT & REDEVELOPMENTECONOMIC DEVELOPMENT & REDEVELOPMENTECONOMIC DEVELOPMENT & REDEVELOPMENTECONOMIC DEVELOPMENT & REDEVELOPMENT CHAPTER 9CHAPTER 9CHAPTER 9CHAPTER 9
COMPREHENSIVE PLAN 201COMPREHENSIVE PLAN 201COMPREHENSIVE PLAN 201COMPREHENSIVE PLAN 2013333 Chapter Chapter Chapter Chapter 9999---- Page Page Page Page 1111
EMPLOYMENT AND UNEMPLOYMENT The 2010 Census results indicated there were 2,659 residents in Harrington that were 16 years and over (employable). By age group, the largest employed group consists of residents 25 to 54 years, with 1,071 employed or in the armed services and 84 unemployed. This age range is 52 percent of the employable population. Of the 908 residents not in the labor force, 399 or 44 percent come from age group of 65 years and older. The following table provides information regarding the age, and gender of those employed and unemployed in Harrington.
Employment Status by Age and Gender, 2010, City of Harrington
Total Male Female
Population 16 and over 2,659 1,359 1,300
In Labor force 1,751 940 811
Armed forces 46 46 -
Civilian labor force 1,705 894 811
Employed 1,519 773 746
Unemployed 186 121 65
Not in labor force 908 419 489
Population 16 to 19 238 147 91
In Labor force 107 43 64
Armed forces - - -
Civilian labor force 107 43 64
Employed 76 27 49
Unemployed 31 16 15
Not in labor force 131 104 27
Population 20 to 24 318 239 79
In Labor force 250 195 55
Armed forces 18 18 -
Civilian labor force 232 177 55
Employed 196 152 44
Unemployed 36 25 11
Not in labor force 68 44 24
Population 25 to 54 1,384 634 750
In Labor force 1,155 562 593
Armed forces 28 28 -
Civilian labor force 1,127 534 593
Employed 1,043 481 562
Unemployed 84 53 31
Not in labor force 229 72 157
Population 55 to 59 98 46 52
In Labor force 89 37 52
Armed forces - - -
Civilian labor force 89 37 52
Employed 87 35 52
Unemployed 2 2 -
Not in labor force 9 9 -
Population 60 to 64 173 96 77
In Labor force 101 74 27
Employed 77 58 19
Unemployed 24 16 8
Total Male Female
Not in labor force 72 22 50
ECONOMIC DEVELOPMENT & REDEVELOPMENTECONOMIC DEVELOPMENT & REDEVELOPMENTECONOMIC DEVELOPMENT & REDEVELOPMENTECONOMIC DEVELOPMENT & REDEVELOPMENT CHAPTER 9CHAPTER 9CHAPTER 9CHAPTER 9
COMPREHENSIVE PLAN 201COMPREHENSIVE PLAN 201COMPREHENSIVE PLAN 201COMPREHENSIVE PLAN 2013333 Chapter Chapter Chapter Chapter 9999---- Page Page Page Page 2222
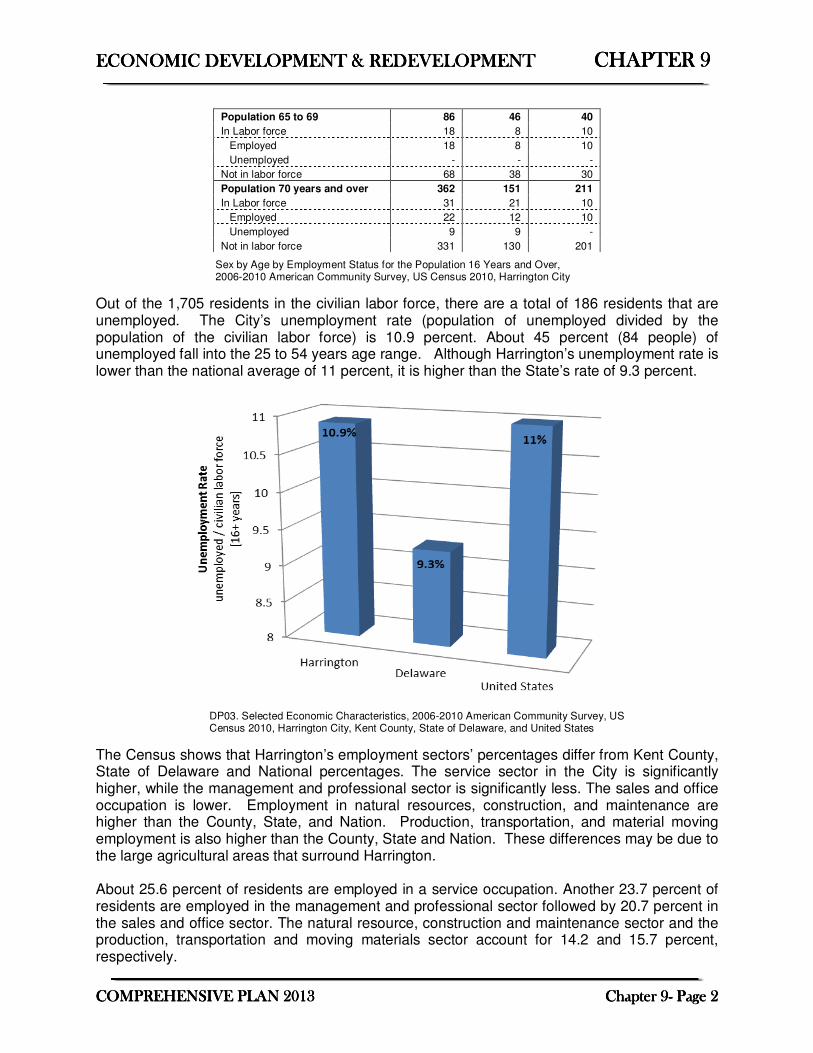
Sex by Age by Employment Status for the Population 16 Years and Over, 2006-2010 American Community Survey, US Census 2010, Harrington City
Out of the 1,705 residents in the civilian labor force, there are a total of 186 residents that are unemployed. The City’s unemployment rate (population of unemployed divided by the population of the civilian labor force) is 10.9 percent. About 45 percent (84 people) of unemployed fall into the 25 to 54 years age range. Although Harrington’s unemployment rate is lower than the national average of 11 percent, it is higher than the State’s rate of 9.3 percent.
DP03. Selected Economic Characteristics, 2006-2010 American Community Survey, US Census 2010, Harrington City, Kent County, State of Delaware, and United States
The Census shows that Harrington’s employment sectors’ percentages differ from Kent County, State of Delaware and National percentages. The service sector in the City is significantly higher, while the management and professional sector is significantly less. The sales and office occupation is lower. Employment in natural resources, construction, and maintenance are higher than the County, State, and Nation. Production, transportation, and material moving employment is also higher than the County, State and Nation. These differences may be due to the large agricultural areas that surround Harrington. About 25.6 percent of residents are employed in a service occupation. Another 23.7 percent of residents are employed in the management and professional sector followed by 20.7 percent in the sales and office sector. The natural resource, construction and maintenance sector and the production, transportation and moving materials sector account for 14.2 and 15.7 percent, respectively.
Population 65 to 69 86 46 40
In Labor force 18 8 10
Employed 18 8 10
Unemployed - - -
Not in labor force 68 38 30
Population 70 years and over 362 151 211
In Labor force 31 21 10
Employed 22 12 10
Unemployed 9 9 -
Not in labor force 331 130 201

ECONOMIC DEVELOPMENT & REDEVELOPMENTECONOMIC DEVELOPMENT & REDEVELOPMENTECONOMIC DEVELOPMENT & REDEVELOPMENTECONOMIC DEVELOPMENT & REDEVELOPMENT CHAPTER 9CHAPTER 9CHAPTER 9CHAPTER 9
COMPREHENSIVE PLAN 201COMPREHENSIVE PLAN 201COMPREHENSIVE PLAN 201COMPREHENSIVE PLAN 2013333 Chapter Chapter Chapter Chapter 9999---- Page Page Page Page 3333
Employment by Sector, Harrington, Kent County, Delaware, U.S.
Source: DP03. Selected Economic Characteristics, 2006-2010 American Community Survey, US Census 2010, Harrington City, Kent County, State of Delaware, and United States
As mentioned there were 1,519 people employed in Harrington in 2010. That makes up approximately 57 percent of the total number of civilian non-institutional residents over the age of 16. This percentage is slightly less than State of Delaware and National statistics of 59 percent.
Labor Force Statistics, 2010
Harrington
Number Harrington
Percent Delaware Percent
United States Percent
Civilian non-institutional population, 16+ years
2,659 100 100 100
Civilian labor force (participation rate) 1,705 64.1 64.3 64.5 Male (labor force participation rate) 894 65.6 68.1 70.1 Female (labor force participation rate) 811 62.4 60.8 59.3 Employed (percent of civilian population 16+)
1,519
57.1 59.1 59.4
Unemployed (percent of civilian population 16+)
186 7.0 5.2 5.1
DP03. Selected Economic Characteristics, 2006-2010 American Community Survey, US Census 2010, Harrington City, State of Delaware, and United States

ECONOMIC DEVELOPMENT & REDEVELOPMENTECONOMIC DEVELOPMENT & REDEVELOPMENTECONOMIC DEVELOPMENT & REDEVELOPMENTECONOMIC DEVELOPMENT & REDEVELOPMENT CHAPTER 9CHAPTER 9CHAPTER 9CHAPTER 9
COMPREHENSIVE PLAN 201COMPREHENSIVE PLAN 201COMPREHENSIVE PLAN 201COMPREHENSIVE PLAN 2013333 Chapter Chapter Chapter Chapter 9999---- Page Page Page Page 4444
Employment by Sector, City of Harrington
-
50
100
150
200
250
300
Management,
Professional & Related
Occupations
Service Sales & Office Natural resources,
construction, and
maintenance
Production,
Transportation &
Material Moving
Male
Female
C24010. Sex by Occupation for the Civilian Employed Population 16 Years and Over. 2006-2010 American Community Survey, US Census 2010, Harrington City,
WHERE PEOPLE WORK
Most working residents of Harrington work outside of the city. Approximately 23 percent of Harrington’s working population work within the City. Approximately 49 percent of Harrington residents work within Kent County outside City limits. Approximately 16 percent work outside of Kent County in either New Castle or Sussex Counties. The remaining working population (approximately 12 percent) works outside Delaware.

ECONOMIC DEVELOPMENT & REDEVELOPMENTECONOMIC DEVELOPMENT & REDEVELOPMENTECONOMIC DEVELOPMENT & REDEVELOPMENTECONOMIC DEVELOPMENT & REDEVELOPMENT CHAPTER 9CHAPTER 9CHAPTER 9CHAPTER 9
COMPREHENSIVE PLAN 201COMPREHENSIVE PLAN 201COMPREHENSIVE PLAN 201COMPREHENSIVE PLAN 2013333 Chapter Chapter Chapter Chapter 9999---- Page Page Page Page 5555
Place of Work for Harrington Workers 16 Years and Over, 2010
B08007. Sex of Workers by Place of Work, Place Level. B08008. Sex of Workers by Place of Work, State and County Level. 2006-2010 American Community Survey, US Census 2010, Harrington City. Note: Total number of workers per B08007 and B08008 is 1,562.
Top Employers Harrington Area
BUSINESS NAME ADDRESS#
EMPLOYED
IN
CITY
HARRINGTON RACEWAY & CASINO 15 W RIDER ROAD 750
LAKE FOREST SCHOOL DISTRICT 5423 KILLENS POND ROAD 608
UPS 15994 SOUTH DUPONT HWY 300
COLOR-BOX INC. 17507 SOUTH DUPONT HWY 150 *
BURRIS FOODS 111 REESE AVENUE 121 *
FOOD LION 2000 MIDWAY DRIVE 68 *
PEPSI BOTTLING VENTURES OF DELMARVA 58 CLUCKEY DRIVE 62 *
KIRBY & HOLLOWAY PROVISION MEAT CO. 966 JACKSON DITCH ROAD 50
MCDONALDS 16758 S DUPONT HWY. 46 *
BYLERS STORE 1 LIBERTY PLAZA 40 *
CITY OF HARRINGTON 106 DORMAN STREET 33 *
WALGREENS/HAPPY HARRYS 2000 MIDWAY DRIVE-SUITE 1 29 *
HARDEES 7237 MILFORD HARR. HWY. 29 *
TAYLOR & MESSICK 325 WALT MESSICK ROAD 22 *
LEHIGH VALLEY DAIRIES 17267 S DUPONT HWY. 20 *
1ST NATIONAL BANK OF WYOMING 7 COMMERCE STREET 20 *
WONDER YEARS KIDS CLUB 17001 SOUTH DUPONT HWY 20 *
RITE AIDE 17069 S DUPONT HWY. 20 *
HOLIDAY INN EXPRESS 17271 S DUPONT HWY. 18 *
JOSEPH T RICHARDSON INC 105 EAST CENTER STREET 18 *
KIDS COTTAGE 1 EAST STREET 15 *
ACE HARDWARE 2000 MIDWAY DRIVE 14 *
AMERICINN 1259 CORN CRIB ROAD 12 *
ENVIROCORP 51 CLARK 12 *
WILMINGTON TRUST 1 CLARK STREET 8 *
Source: City of Harrington Staff-verified via telephone survey November 2010 *=within the City limits

ECONOMIC DEVELOPMENT & REDEVELOPMENTECONOMIC DEVELOPMENT & REDEVELOPMENTECONOMIC DEVELOPMENT & REDEVELOPMENTECONOMIC DEVELOPMENT & REDEVELOPMENT CHAPTER 9CHAPTER 9CHAPTER 9CHAPTER 9
COMPREHENSIVE PLAN 201COMPREHENSIVE PLAN 201COMPREHENSIVE PLAN 201COMPREHENSIVE PLAN 2013333 Chapter Chapter Chapter Chapter 9999---- Page Page Page Page 6666
INCOME As of the 2010 Census, there were a total of 1,365 households. Thirteen and one half percent or 185 households have an income range below $15,000. Six percent or 83 households have an income greater than $100,000. The income ranges from $15,000 to less than $50,000 account for 38.5 percent of occupied households. Households where income is between $50,000 to less than $100,000 account for 42 percent. The income range of $50,000 to $74,999 accounts for the largest single income range with 401 households.
Number of Households by Income, 2010
DP03. Selected Economic Characteristics, 2006-2010 American Community Survey, US Census 2010, Harrington City, Kent County, State of Delaware, and United States
TRAVEL TO WORK In Harrington the largest percentage of working residents commute more than 35 minutes to work. Twenty-two percent of workers in Harrington travel less than 10 minutes to get to work. Another twenty-one percent of workers travel 30 to 34 minutes to commute to work.

ECONOMIC DEVELOPMENT & REDEVELOPMENTECONOMIC DEVELOPMENT & REDEVELOPMENTECONOMIC DEVELOPMENT & REDEVELOPMENTECONOMIC DEVELOPMENT & REDEVELOPMENT CHAPTER 9CHAPTER 9CHAPTER 9CHAPTER 9
COMPREHENSIVE PLAN 201COMPREHENSIVE PLAN 201COMPREHENSIVE PLAN 201COMPREHENSIVE PLAN 2013333 Chapter Chapter Chapter Chapter 9999---- Page Page Page Page 7777
Travel to Work for Workers 16 Years and Older
S0801. Commuting Characteristics by Sex, 2006-2010 American Community Survey, US Census 2010, Harrington City
Eighty-five percent of the residents that work drive alone to work. Eleven percent of residents carpool and only two percent walk or bike to work. There are no residents that take public transportation; this startling statistic could be a result of the lack of or limited services within the area.
Means of Transportation for Workers 16 Years and Over
S0801. Commuting Characteristics by Sex, 2006-2010 American Community Survey, US Census 2010, Harrington City

ECONOMIC DEVELOPMENT & REDEVELOPMENTECONOMIC DEVELOPMENT & REDEVELOPMENTECONOMIC DEVELOPMENT & REDEVELOPMENTECONOMIC DEVELOPMENT & REDEVELOPMENT CHAPTER 9CHAPTER 9CHAPTER 9CHAPTER 9
COMPREHENSIVE PLAN 201COMPREHENSIVE PLAN 201COMPREHENSIVE PLAN 201COMPREHENSIVE PLAN 2013333 Chapter Chapter Chapter Chapter 9999---- Page Page Page Page 8888
Of the 169 residents that carpool to work, 149 consist of two person carpools; 11 drive in a three person carpools; and 9 are in a carpool with four or more people.
Private Vehicle Occupancy for Journey to Work
S0801. Commuting Characteristics by Sex, 2006-2010 American Community Survey, US Census 2010, Harrington City
POVERTY According to the 2010 Census, there were 3,013 residents above the poverty level which is 86.1 percent of the population for whom poverty status is determined. There were 487 residents (13.9 percent) that fell below the poverty status. The highest percentage (39 percent) of families and people whose income is below the poverty level are families with a female head of household with children and no husband present. The second largest percentage group (22.9 percent) is people under 18 years of age.
Percentage of Families Whose Income is Below Poverty Level
Percent Below Poverty
Families
All families 10.0 Married couple families 2.2 Families with female householder, no husband present
38.8
All People 13.9 Under 18 years 22.9 18 years and over 10.5 People in families 13.8 Unrelated individuals 15 years and over 14.8
DP03. Selected Economic Characteristics, 2006-2010 American Community Survey, US Census 2010, Harrington City,

ECONOMIC DEVELOPMENT & REDEVELOPMENTECONOMIC DEVELOPMENT & REDEVELOPMENTECONOMIC DEVELOPMENT & REDEVELOPMENTECONOMIC DEVELOPMENT & REDEVELOPMENT CHAPTER 9CHAPTER 9CHAPTER 9CHAPTER 9
COMPREHENSIVE PLAN 201COMPREHENSIVE PLAN 201COMPREHENSIVE PLAN 201COMPREHENSIVE PLAN 2013333 Chapter Chapter Chapter Chapter 9999---- Page Page Page Page 9999
REDEVELOPMENT Harrington is starting to see a redevelopment trend occur in the downtown area, as well as, in the highway corridor. There are also several redevelopment projects within the City that have made improvements such as exterior renovations, signage, etc. Economic redevelopment and improvements are increasing in the City of Harrington. Please see the table below for a list of these projects:
Commercial Redevelopment, 2005-2011
Development #
Name Location Type of Redevelopment
1 Liberty Plaza DuPont Highway Exterior Renovations, Landscaping, Byler's Store
2 Clark Street Corner DuPont Highway Interior/Exterior Renovations, Fence, Signage
3 Downtown Junction Commerce Street Vacant Downtown Building to Retail Store
4 Rudy’s Diner DuPont Highway Interior/Exterior Renovations, Signage
5 Mattlind Square DuPont Highway Exterior Renovations, Site work and Tenant Units
6 Power in Praise Clark Street Interior/Exterior Renovations, Site Work, Signage
7 Spartan Station Clark Street Interior/Exterior Renovations, Signage, Clock Tower In 2007, the City expedited the review process for projects that were changing the use in an existing structure. The resulting process was less expensive in terms of time and cost. This process has been very successful and encourages redevelopment through onsite guidance and building improvements. Some of the successful redevelopment projects that have been completed recently are:
Liberty Plaza Rudy’s Diner

ECONOMIC DEVELOPMENT & REDEVELOPMENTECONOMIC DEVELOPMENT & REDEVELOPMENTECONOMIC DEVELOPMENT & REDEVELOPMENTECONOMIC DEVELOPMENT & REDEVELOPMENT CHAPTER 9CHAPTER 9CHAPTER 9CHAPTER 9
COMPREHENSIVE PLAN 201COMPREHENSIVE PLAN 201COMPREHENSIVE PLAN 201COMPREHENSIVE PLAN 2013333 Chapter Chapter Chapter Chapter 9999---- Page Page Page Page 10101010
RJ’s Trackside Car Sales Spartan Station
Power In Praise Ministries Downtown Junction
Walgreens Royal Farms
Corner of Clark Street and DuPont Highway Improvements
BEFORE AFTER

ECONOMIC DEVELOPMENT & REDEVELOPMENTECONOMIC DEVELOPMENT & REDEVELOPMENTECONOMIC DEVELOPMENT & REDEVELOPMENTECONOMIC DEVELOPMENT & REDEVELOPMENT CHAPTER 9CHAPTER 9CHAPTER 9CHAPTER 9
COMPREHENSIVE PLAN 201COMPREHENSIVE PLAN 201COMPREHENSIVE PLAN 201COMPREHENSIVE PLAN 2013333 Chapter Chapter Chapter Chapter 9999---- Page Page Page Page 11111111
Mattlind Square- Redevelopment Project
BEFORE
DURING
AFTER
Calloway - Commerce Street Vacant Lot
BEFORE AFTER LOCAL FARMERS MARKET

ECONOMIC DEVELOPMENT & REDEVELOPMENTECONOMIC DEVELOPMENT & REDEVELOPMENTECONOMIC DEVELOPMENT & REDEVELOPMENTECONOMIC DEVELOPMENT & REDEVELOPMENT CHAPTER 9CHAPTER 9CHAPTER 9CHAPTER 9
COMPREHENSIVE PLAN 201COMPREHENSIVE PLAN 201COMPREHENSIVE PLAN 201COMPREHENSIVE PLAN 2013333 Chapter Chapter Chapter Chapter 9999---- Page Page Page Page 12121212
Listed below please find vacant and under maintained properties available for redevelopment: The old Jay’s Market location is a prime location for retail or service sectors and would serve an area of the City that lacks retail and service. This property is located on Clark Street, one of the gateways to the downtown area.
2-two story buildings located downtown on Commerce Street.
This vacant corner lot fronts DuPont Highway and Clark Street.

ECONOMIC DEVELOPMENT & REDEVELOPMENTECONOMIC DEVELOPMENT & REDEVELOPMENTECONOMIC DEVELOPMENT & REDEVELOPMENTECONOMIC DEVELOPMENT & REDEVELOPMENT CHAPTER 9CHAPTER 9CHAPTER 9CHAPTER 9
COMPREHENSIVE PLAN 201COMPREHENSIVE PLAN 201COMPREHENSIVE PLAN 201COMPREHENSIVE PLAN 2013333 Chapter Chapter Chapter Chapter 9999---- Page Page Page Page 13131313
This structure is vacant and located on the corner of Clark Street and East Street. This is also considered a gateway location into the City. The City recently took possession of this property. A vacant mixed use structure located on DuPont Highway is currently under major renovations.
The old Pliant manufacturing building is currently vacant and has great potential located on DuPont Highway.
The old meat packing plant remains vacant and is located on Clark Street.

ECONOMIC DEVELOPMENT & REDEVELOPMENTECONOMIC DEVELOPMENT & REDEVELOPMENTECONOMIC DEVELOPMENT & REDEVELOPMENTECONOMIC DEVELOPMENT & REDEVELOPMENT CHAPTER 9CHAPTER 9CHAPTER 9CHAPTER 9
COMPREHENSIVE PLAN 201COMPREHENSIVE PLAN 201COMPREHENSIVE PLAN 201COMPREHENSIVE PLAN 2013333 Chapter Chapter Chapter Chapter 9999---- Page Page Page Page 14141414
Vacant lot located on Delaware Avenue, great infill potential with street frontage.
Another vacant lot located on Delaware Avenue, great infill potential with street frontage.
If buildings remain vacant and unmaintained for too long, they become an eyesore, as well as, a possible health and safety issue. The City should continue to work with these projects and assist in the regulatory process with all involved parties. BROWNFIELDS Brownfields are real property that may be vacant, abandoned or underutilized as a result of a reasonably-held belief that they may be environmentally contaminated (7 Del.C. § 9103(3)). Productive use of these idle properties provides “new” areas for economic development, primarily in former industrial/urban areas with existing utilities, roads and other infrastructure. DNREC encourages the development of Brownfields and can provide grant funding and other assistance when investigating and remediating Brownfield sites. The Delaware Brownfields Marketplace is an interactive database that contains a list of market-ready Brownfield sites throughout Delaware. The inventory is designed to make it easier for potential buyers and developers to locate available Brownfield properties. Cleaning up and reinvesting in these properties protects the environment, reduces blight, and helps to create jobs for Delaware citizens, while preserving Delaware’s precious green space and natural resources. To add sites in your municipality to the Marketplace (with owner approval) or to determine if any sites in your municipality are Brownfields, please contact DNREC’s Site Investigation and Restoration Section at (302) 395-2600. For more information online, please visit: http://apps.dnrec.state.de.us/BFExt/BFExtMain.aspx The State recommends the following: If any future development occurs on sites with previous manufacturing, industrial, or agricultural use, SIRS strongly recommends that the land owner(s) perform environmental due diligence of the property by performing a Phase I Environmental Site Assessment (including a title search to identify environmental covenants) in accordance with Section 9105(c) (2) of the Delaware Hazardous Substance Cleanup Act (HSCA). While this is not a requirement under HSCA, it is good business practice and failure to do so will prevent a person from being able to qualify for a potential affirmative defense under Section 9105(c) (2) of HSCA.

ECONOMIC DEVELOPMENT & REDEVELOPMENTECONOMIC DEVELOPMENT & REDEVELOPMENTECONOMIC DEVELOPMENT & REDEVELOPMENTECONOMIC DEVELOPMENT & REDEVELOPMENT CHAPTER 9CHAPTER 9CHAPTER 9CHAPTER 9
COMPREHENSIVE PLAN 201COMPREHENSIVE PLAN 201COMPREHENSIVE PLAN 201COMPREHENSIVE PLAN 2013333 Chapter Chapter Chapter Chapter 9999---- Page Page Page Page 15151515
The former Berry Plastics (DE-1526) is a Site Investigation and Restoration Section (SIRS) site.
GOALS Goals listed are not in any specific order and should be considered as funding and/or resources are available.
• Evaluate the existing tax incentive program
• Create additional incentives for redevelopment
• Encourage infill as much as possible while preserving the neighborhood character
• Review the commercial vacant building ordinance encouraging seasonal window
displays or promoting of community events
• Coordinate economic marketing efforts with State & County Economic Development offices as well as the Central Chamber of Commerce
• Attract and encourage large employer businesses
• Study alternate travel to work transportation methods
• Continue to provide professional planning/engineering services with
redevelopment projects for guidance and recommendations throughout the process
• Clearly define an area to be designated as downtown commercial as stated in
Chapter 8 and Exhibit 17