Embed Size (px)
Citation preview

3UHYLRXV�&KDSWHU3UHYLRXV�&KDSWHU
Lyle, M., Koizumi, I., Richter, C., et al., 1997Proceedings of the Ocean Drilling Program, Initial Reports, Vol. 167
9. SITE 10151
Shipboard Scientific Party2
aterbor-se thedites for forlagicppershouldand
49.5s be-d on
egonimen-s, ands in-
pperat is
adeds andsharponglynno-e arenno-mayvelsadja-
ssilsngerxcept
some and dia-
e ex-cial
ini-ggest
circu- the
sure-aphynd the
cur inounds.
wt%.
HOLE 1015A
Date occupied: 12 May 1996
Date departed: 12 May 1996
Time on hole: 14 hr
Position: 33°42.925′N, 118°49.185′W
Drill pipe measurement from rig floor to seafloor (m): 911.9
Distance between rig floor and sea level (m): 11.1
Water depth (drill pipe measurement from sea level, m): 900.8
Total depth (from rig floor, m): 1061.4
Penetration (m): 149.5
Number of cores (including cores having no recovery): 16
Total length of cored section (m): 149.5
Total core recovered (m): 139.1
Core recovery (%): 93.0
Oldest sediment cored:Depth (mbsf): 149.5Nature: Quartz feldspar silty sandAge: Quaternary
HOLE 1015B
Date occupied: 12 May 1996
Date departed: 13 May 1996
Time on hole: 09 hr, 45 min
Position: 33°42.922′N, 118°49.118′W
Drill pipe measurement from rig floor to seafloor (m): 912.1
Distance between rig floor and sea level (m): 11.1
Water depth (drill pipe measurement from sea level, m): 901.0
Total depth (from rig floor, m): 1008.9
Penetration (m): 97.8
Number of cores (including cores having no recovery): 12
Total length of cored section (m): 97.8
Total core recovered (m): 81.4
Core recovery (%): 83.1%
Oldest sediment cored:Depth (mbsf): 97.8Nature: Silty clay, clay with nannofossils and siltAge: Quaternary
1Lyle, M., Koizumi, I., Richter, C., et al., 1997. Proc. ODP, Init. Repts., 167: Col-lege Station, TX (Ocean Drilling Program).
2Shipboard Scientific Party is given in the list preceding the Table of Contents.
7DEOH�RI�&7DEOH�RI�&
Principal results: Site 1015 is located in the Santa Monica Basin at a wdepth of 901 mbsl. It is the only Leg 167 site located within an inner derland basin. This basin is known to have had anoxic periods becausource of deep water is very near the oxygen minimum. Distal turbifrom the Hueneme fan extend to Site 1015. The primary objectivedrilling here was to sample a very high-resolution sediment sectioncomparison with ODP Site 893 in the Santa Barbara Basin. Hemipesections between turbidites should be sufficiently large to study uPleistocene and Holocene paleoceanographic processes. The site also prove useful for sedimentological study of turbidite deposition the development of Hueneme Fan.
Two holes were cored with the APC at Site 1015 to a depth of 1and 97.8 mbsf, respectively. Detailed comparisons of the two holetween the magnetic susceptibility and the GRAPE density generatethe MST and high-resolution color reflectance measured with the OrState University system, demonstrated complete recovery of the sedtary sequence down to 36 mbsf. The existence of gas voids, turbiditecoring disturbances below that depth precluded any further continuouterhole correlations.
The sedimentary sequence consists of a 150-m-thick interval of uQuaternary sediments. Sediments form one lithostratigraphic unit thcharacterized by decimeter- to meter-scale rhythmic repetition of grsand with sharp basal contacts, homogeneous non-bioturbated siltclays, and laminated and possibly bioturbated nannofossil clay. The basal contacts, normal grading, and well-sorted nature of the sand strsuggest turbidite deposition. Four intervals containing laminated nafossil clay are present within the upper 90 m of the sequence. Thesinterrupted by intervals with homogeneous, possibly bioturbated nafossil clay. The repetition of laminated and bioturbated(?) intervals represent millennial-scale oscillation of bottom-water oxygenation leduring the latest Pleistocene and Holocene similar to that from the cent Santa Barbara Basin (ODP Site 893).
Biostratigraphic age control was provided by calcareous nannofoand planktonic foraminifers that indicate a latest Quaternary age, youthan 60 ka. Sand layers in the sequence are barren of microfossils efor very rare, moderately well-preserved calcareous nannofossils in intervals. Hemipelagic sediments contain well-preserved planktonicbenthic foraminifers and calcareous nannofossils. Radiolarians andtoms are essentially absent, except for reworked Miocene taxa.
Changes in planktonic foraminifer assemblages in this sequenchibit evidence of Quaternary oscillations between glacial and interglaconditions. The Holocene is well marked by distinct planktonic foramfer assemblages. Planktonic and benthic foraminifer assemblages suthat the glacial-interglacial episodes are associated with changes in lation of upper intermediate waters, which influenced oxygen levels inbasins of the California Borderland.
Gas voids, turbidites, and coring disturbances precluded the meament of most physical properties. A paleomagnetic reversal stratigrcould not be obtained because of the young age of the sediment acoring disturbances.
Carbonate values range between 2 and 7 wt%. Lowest values octhe turbidites. The organic carbon record shows hemipelagic backgrvalues of ~1−1.5 wt%, with <0.5 wt% in the coarse-grained turbiditeWood fragments in the sediment contribute to high values up to 2.3
223
RQWHQWVRQWHQWV 1H[W�&KDSWHU1H[W�&KDSWHU

SITE 1015
Although the chemical composition of the interstitial water samples fromthis site indicates that organic matter diagenesis, biogenic opal dissolu-tion, and authigenic mineral precipitation and/or ion exchange reactionsare significant influences, drilling disturbance of the sediments makes dis-tinguishing primary geochemical signals from drilling fluid contamina-tion problematic.
BACKGROUND AND OBJECTIVES
General Description
Site 1015 is located about 30 km west of Los Angeles, California,in Santa Monica Basin. It is the only Leg 167 drill site within an innerborderland basin (Fig. 1). Water depth at the drill site is shallow (901mbsl), and the sill depth for waters entering Santa Monica Basin is737 mbsl (Emery, 1960). Deep water entering the basin is at the endof a flow path that began at Animal Basin (Site 1011). The source ofdeep water is also very near the oxygen minimum, so that the basinperiodically becomes anoxic (D. Gorsline, pers. comm., 1995) Thesite is located near the center of the basin because the Holocene cy-cles of anoxic events seem to expand outward from the center.
Santa Monica Basin is occupied in its northern end by the Huen-eme Fan, which is formed at the base of Hueneme and Mugu Subma-rine Canyons near Oxnard, California. Distal turbidites from the fanextend to Site 1015, with numerous turbidites throughout the recov-ered section. The site has the highest sedimentation rate of the Leg167 drill sites, and the age for the base of drilling is late Quaternary.
The site was surveyed in detail with the Maurice Ewing on cruiseEW9504 in 1995 (Lyle et al., 1995a, 1995b; Fig. 2). The basin fill isextremely flat, changing less than 10 m over 10 km, and has highacoustic return, typical of turbidites. Individual layers can be tracedup the western slope of the Santa Monica Basin, which indicates that
224
occasional very large turbidity flows cascaded into the basin. Depthto basement is difficult to determine beneath the drill site, but is sig-nificantly deeper than the 150 mbsf drilled.
Site Objectives
Site 1015 was drilled to sample a very high-resolution sedimentsection to compare with Santa Barbara Basin (ODP Site 893). Whileit may be possible to use the hemipelagic sections between turbiditesto study late Pleistocene and Holocene paleoceanographic processes,it will be difficult to assign age control points and verify continuityof the section. The site may also prove useful for sedimentologicalstudy of turbidite deposition in Santa Monica Basin and the develop-ment of Hueneme Fan. Organic carbon diagenesis, through geochem-ical analyses of the solids, can be studied in a sedimentary sectionthat has been quickly deposited and where there is likely to be a largeterrigenous organic component.
OPERATIONS
Transit from Site 1014 to Site 1015
The 85.0-nmi transit from Site 1014 to Site 1015 was accom-plished in 7.75 hr at an average speed of 11.0 kt. A 3.5-kHz precisiondepth recorder survey was performed while approaching Site 1015.The JOIDES Resolution arrived at Site 1015 at 0530 hr on 12 May.
Hole 1015A
Hole 1015A was spudded at 0815 hr on 12 May. APC Cores 167-1015A-1H through 16H were taken from 0 to 149.5 mbsf with 93.1%
120°W 119°
893
1015
1013
1014
34°N
33°Figure 1. Location map for Site 1015, showing its posi-tion with respect to other northern California Border-land drill sites. Site 1015, in Santa Monica Basin and Site 893 (Santa Barbara Basin) are within inner Border-land basins, whereas Site 1013, in San Nicolas Basin, is in the middle Borderland belt, and Site 1014 is located in the outer Borderland.

SITE 1015
SP362 SP236 SP198 SP152X line 4 X line 5 X line 9
4400 m
Site 1015
X line 6
1000
Tw
o-w
ay tr
avel
time
(s)
2200
1800
1400
N S
Figure 2. Seismic reflection profile through Site 1015 (Line EW9504 BA4-1; Lyle et al., 1995a, 1995b). The data are summed 4-channel data, filtered between30 and 200 Hz, with predictive deconvolution and Stolt F-K migration applied. Santa Monica Basin is filled with a thick sequence of turbidites interlayered withmore hemipelagic sediments. Site 1015 was drilled to a depth of 150 mbsf, and an upper Pleistocene sequence of sediments was recovered. On y-axis, (s) = mil-liseconds.
recovery (Table 1; see Table 2 on CD-ROM in the back pocket of thisvolume for a more detailed coring summary). Oriented cores wereobtained on Cores 167-1015A-3H through 9H. An Adara tempera-ture measurement was run on Core 4H. Further Adara measurementswere canceled because of overpull and the slow APC bit advance-ment. The recovered core exhibited multiple turbidites, which con-tributed to the slow drilling conditions. The vessel was offset 100 mto the east in an attempt to find an area more conducive to APC cor-ing.
Hole 1015B
Hole 1015B was spudded at 2000 hr on 12 May. APC Cores 167-1015B-1H through 12H were taken from 0 to 97.8 mbsf with 83.2%recovery (Table 1). The APC coring system encountered refusal inCore 12H and the hole was terminated. The drill string was trippedback to the surface and secured for the 16-hr transit to Site 1016 by0545 hr on 13 May.
LITHOSTRATIGRAPHY
Introduction
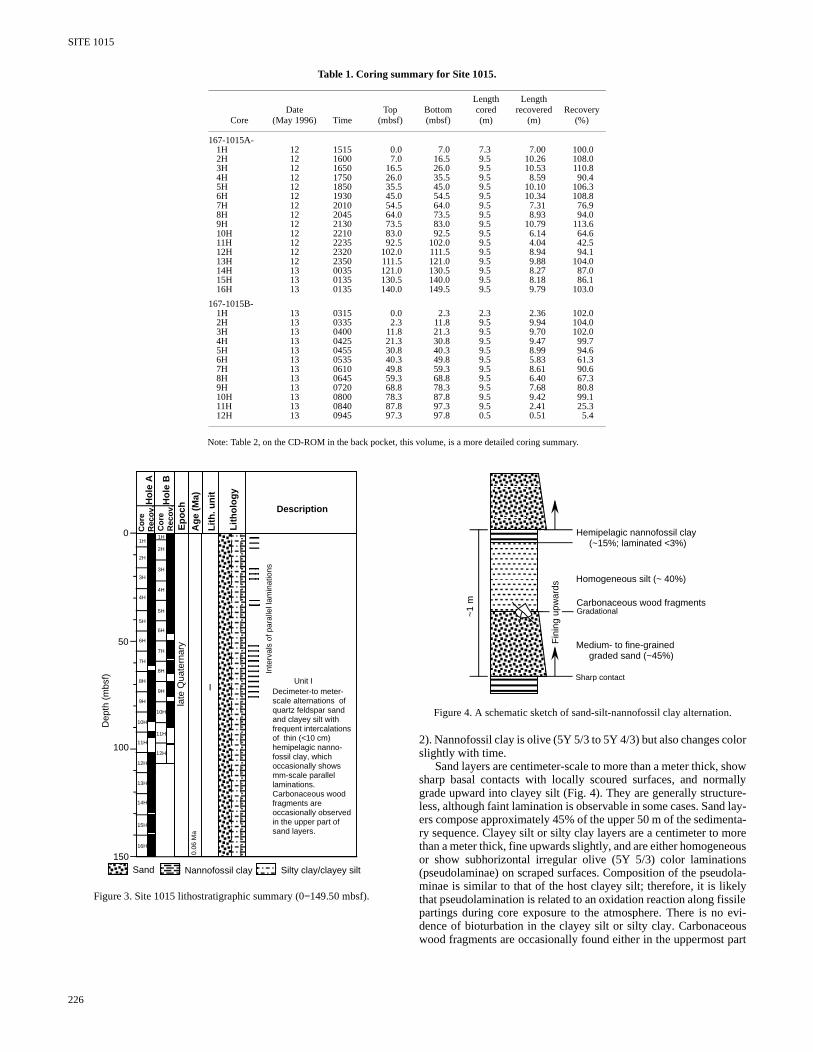
A 149.5-m-thick, upper Quaternary sedimentary sequence was re-covered at Site 1015. Sediments are dominated by decimeter- tometer-scale repetition of quartz feldspar sand and clayey silt (Fig. 3).Sand layers show sharp basal contacts and grade upwards into clayeysilt, suggesting deposition by turbidity currents. Carbonaceous wood
fragments are common in the upper part of sand layers. Thin layersof (<10 cm) laminated hemipelagic nannofossil clay frequently over-lie the clayey silt and in turn are overlain by sand. Volcanic glass is alocally important siliciclastic component but does not occur as dis-crete layers. Micrometer-size authigenic pyrite is a minor but com-mon constituent of the sediment. The biogenic component is domi-nated by nannofossils with subordinate amounts of foraminifers inthe hemipelagic layers but is an insignificant percentage of the clayeysilt and sand layers. Siliceous microfossils such as diatoms and radi-olarians are rare to absent.
The sediments were grouped into a single lithostratigraphic unitbased on visual core descriptions and smear-slide estimates (Fig. 3).
Description of Unit
Unit I
Hole 1015A, intervals 167-1015A-1H-1 through 16H-CC, 0−149.50mbsf (base of hole);
Hole 1015B, intervals 167-1015B-1H-1 through 12H-CC, 0−97.8mbsf (base of hole).
Age: Quaternary, 0.0−0.06 Ma.
Unit I is predominantly composed of a rhythmic repetition of me-dium- to fine-grained quartz feldspar sand and clayey silt or silty claywith frequent intercalations of nannofossil clay to clay with nanno-fossils and silt. Sand and clayey silt are medium gray (N 5) to grayishblack (N 3) in freshly split core surfaces, but oxidation causes the col-or to change quickly (<1 hour) to olive gray (5Y 5/2) to olive (5Y 4/
225
SITE 1015
226
Table 1. Coring summary for Site 1015.
Note: Table 2, on the CD-ROM in the back pocket, this volume, is a more detailed coring summary.
CoreDate
(May 1996) TimeTop
(mbsf)Bottom (mbsf)
Lengthcored(m)
Lengthrecovered
(m)Recovery
(%)
167-1015A-1H 12 1515 0.0 7.0 7.3 7.00 100.02H 12 1600 7.0 16.5 9.5 10.26 108.03H 12 1650 16.5 26.0 9.5 10.53 110.84H 12 1750 26.0 35.5 9.5 8.59 90.45H 12 1850 35.5 45.0 9.5 10.10 106.36H 12 1930 45.0 54.5 9.5 10.34 108.87H 12 2010 54.5 64.0 9.5 7.31 76.98H 12 2045 64.0 73.5 9.5 8.93 94.09H 12 2130 73.5 83.0 9.5 10.79 113.610H 12 2210 83.0 92.5 9.5 6.14 64.611H 12 2235 92.5 102.0 9.5 4.04 42.512H 12 2320 102.0 111.5 9.5 8.94 94.113H 12 2350 111.5 121.0 9.5 9.88 104.014H 13 0035 121.0 130.5 9.5 8.27 87.015H 13 0135 130.5 140.0 9.5 8.18 86.116H 13 0135 140.0 149.5 9.5 9.79 103.0
167-1015B-1H 13 0315 0.0 2.3 2.3 2.36 102.02H 13 0335 2.3 11.8 9.5 9.94 104.03H 13 0400 11.8 21.3 9.5 9.70 102.04H 13 0425 21.3 30.8 9.5 9.47 99.75H 13 0455 30.8 40.3 9.5 8.99 94.66H 13 0535 40.3 49.8 9.5 5.83 61.37H 13 0610 49.8 59.3 9.5 8.61 90.68H 13 0645 59.3 68.8 9.5 6.40 67.39H 13 0720 68.8 78.3 9.5 7.68 80.810H 13 0800 78.3 87.8 9.5 9.42 99.111H 13 0840 87.8 97.3 9.5 2.41 25.312H 13 0945 97.3 97.8 0.5 0.51 5.4
Dep
th (
mbs
f)
0
50
100
150
1H
2H
3H
4H
5H
6H
7H
8H
9H
10H
11H
12H
1H
2H
3H
4H
5H
6H
7H
8H
9H
10H
11H
12H
13H
14H
15H
16H
I
late
Qua
tern
ary
Sand Silty clay/clayey siltNannofossil clay
Decimeter-to meter- scale alternations of quartz feldspar sand and clayey silt with frequent intercalations of thin (<10 cm) hemipelagic nanno-fossil clay, which occasionally shows mm-scale parallel laminations. Carbonaceous wood fragments are occasionally observed in the upper part of sand layers.
Inte
rval
s of
par
alle
l lam
inat
ions
Ag
e (M
a)
Lit
ho
log
y
Lit
h. u
nit
Description
Ep
och
Ho
le A
Ho
le B
Co
reR
eco
v.C
ore
Rec
ov.
Unit I
0.06
Ma
Figure 3. Site 1015 lithostratigraphic summary (0−149.50 mbsf).
2). Nannofossil clay is olive (5Y 5/3 to 5Y 4/3) but also changes colorslightly with time.
Sand layers are centimeter-scale to more than a meter thick, showsharp basal contacts with locally scoured surfaces, and normallygrade upward into clayey silt (Fig. 4). They are generally structure-less, although faint lamination is observable in some cases. Sand lay-ers compose approximately 45% of the upper 50 m of the sedimenta-ry sequence. Clayey silt or silty clay layers are a centimeter to morethan a meter thick, fine upwards slightly, and are either homogeneousor show subhorizontal irregular olive (5Y 5/3) color laminations(pseudolaminae) on scraped surfaces. Composition of the pseudola-minae is similar to that of the host clayey silt; therefore, it is likelythat pseudolamination is related to an oxidation reaction along fissilepartings during core exposure to the atmosphere. There is no evi-dence of bioturbation in the clayey silt or silty clay. Carbonaceouswood fragments are occasionally found either in the uppermost part
~1
m
Medium- to fine-grained graded sand (~45%)
Sharp contact
Homogeneous silt (~ 40%)
Gradational
Hemipelagic nannofossil clay (~15%; laminated <3%)
Fin
ing
upw
ards
Carbonaceous wood fragments
Figure 4. A schematic sketch of sand-silt-nannofossil clay alternation.

SITE 1015
simf tomceotnt m
rintio
(B
tets at015
hich se-thate se-telyipe-nicin-
of sand layers or the lower part of clayey silt layers. Clayey silt layerscompose ~40% of the sedimentary sequence. Sands dominantly com-prise quartz and feldspar with subordinate amounts of amphibole andmica. Volcanic glass is abundant locally. Sands enriched in volcanicglass also tend to be enriched in biotite and amphibole. Framboidalpyrite is a minor but common component of the silt fraction.
Centimeter- to decimeter-thick nannofossil clay to clay with nan-nofossils and silt generally overlies the clayey silt and forms the toppart of the repetitive sequence of sedimentation (Fig. 4). This lithol-ogy contains as much as 40% nannofossils and 8% foraminifersbased on smear-slide observations. Nannofossil clay occasionallyshows millimeter-scale, olive (5Y 4/3) and black (N 2) parallel lam-inations (Fig. 5). Olive laminae tend to be slightly enriched in nanno-fossils, whereas black laminae are enriched in pyrite. Sequences oflaminae are generally 1 cm to 3 cm thick and rarely exceed 10 cm.The base of laminated layers always has a sharp contact with under-lying homogeneous clayey silt and their top contact is cut sharply byoverlying sand. When nannofossil clay is not laminated, its lowerboundary is generally gradational. This relationship is probably relat-ed to biomixing, although distinct burrows are not observed. Lami-nated layers occur in several discrete intervals: ~4 to 8 mbsf, 17 to 25mbsf, 31 to 33 mbsf, and 50 to 75 mbsf. Nannofossil clay constitutes~15% of the sedimentary sequence of the upper 50 m, but laminatednannofossil clay forms <3%.
A 30-cm-thick interval of disaggregated wood was recovered inSection 167-1015B-10H-3. It occurs in the uppermost part of a ho-mogeneous clayey silt layer. Cores 167-1015A-12H to 16H are filledwith soupy sand, suggesting that sand is the dominant lithology be-low ~100 mbsf.
Depositional Conditions
Sediments at Site 1015 are characterized by decimeter- to meter-scale rhythmic repetition of graded sand with sharp basal contacts,homogeneous non-bioturbated clayey silt to silty clay, and laminatedand possibly bioturbated nannofossil clay. The sharp basal contacts,normal grading, and well-sorted nature of the sand strongly suggestturbiditic deposition. The gradational change from the underlyingsand, the non-bioturbated, homogeneous appearance, combined withthe slightly fining-upward nature and lack of planktonic microfossilsare all consistent with the hypothesis that the clayey silt to silty claycompose the upper part of turbidite beds. The lack of sedimentarystructures characteristic of classic turbidite deposits (Stow and Wet-zel, 1990) does not allow confirmation of this origin. An alternativeexplanation for the origin of clayey silt and silty clay include flooddeposits that were transported along the pycnocline created duringflood events (Drake et al., 1972). In either case, sand and clayey siltlayers at Site 1015 likely represent instantaneous event deposits rath-er than continuous background deposition. Smear-slide observationssuggest at least two different sources of siliciclastics, one enriched inquartz and feldspar and the other enriched in volcanic glass, biotite,and amphiboles.
Nannofossil clay, on the other hand, seems to represent back-ground hemipelagic deposition. The presence of millimeter-scaleparallel laminations, as well as the in situ foraminifers within this li-thology (see “Biostratigraphy” section, this chapter), is also content with a hemipelagic origin. Four intervals characterized by lanated nannofossil clay are recognized within the upper 90 m osequence, which are interrupted by intervals characterized by hgeneous, possibly bioturbated nannofossil clay. Since presenlamination and bioturbation imply suboxic to anoxic and oxic btom-water conditions, respectively (Savrda et al., 1984), repetitiothese laminated and possibly bioturbated intervals may represenlennial-scale oscillation of bottom-water oxygenation levels duthe latest Pleistocene and Holocene (see “Biostratigraphy” secthis chapter) similar to that of the adjacent Santa Barbara Basin and Kennett, 1996).
s-i-heo-
of- of
il-gn,
ehl
BIOSTRATIGRAPHY
Calcareous nannofossil and planktonic foraminifer data indicathat the 150-m sequence of turbidites and hemipelagic sedimenSite 1015 are of latest Quaternary age, younger than 60 ka. Site 1is represented by a single calcareous nannofossil Zone CN15, wdates the sequence as younger than 85 ka. The paleoclimaticquence indicated by changes in planktonic foraminifers suggests the base of the sequence is no older than 60 ka. Sand layers in thquence are barren of microfossils except for very rare, moderawell-preserved calcareous nannofossils in some intervals. Hemlagic sediments contain abundant to few, well-preserved planktoforaminifers, common to abundant, well-preserved benthic foram
cm120
125
130
135
Figure 5. A close-up of laminated nannofossil clay overlying clayey silt, andin turn overlain by a sand turbidite (Sample 167-1015A-3H-6, 120−135 cm).
227

SITE 1015
ifers, and abundant to rare, well-preserved calcareous nannofossils.Radiolarians are conspicuous only at the very top of the sequence(Sample 167-1015A-1H-CC) and are essentially absent below, ex-cept for pervasive reworked Miocene forms. Diatoms are absentthroughout the sequence except for reworked Miocene taxa.
Changes in planktonic foraminifer assemblages in this sequenceexhibit clear evidence of large-scale Quaternary glacial-interglacialoscillations. The Holocene is well marked by interglacial planktonicforaminifer assemblages and is ~31 m thick. Below the Holocene,planktonic foraminifers exhibit faunal variability seen during glacialisotopic Stages 2 and 3 in Santa Barbara Basin (Kennett and Venz,1995). Planktonic foraminifer assemblages occurring at some levelsduring oxygen isotopic Stage 3 reflect sea-surface temperatures as in-termediate between full interglacial and glacial conditions and mayrepresent interstadial episodes. Benthic foraminifer assemblages in-ferred to be closely associated with very low oxygen levels in basinalwaters occur together with relatively warm planktonic foraminiferassemblages. In contrast, cooler planktonic foraminifer assemblagesare often associated with benthic forms indicative of more highlyoxygenated bottom waters. This suggests that the glacial-interglacialepisodes are associated with changes in circulation of upper interme-diate waters affecting changes in oxygen levels of the basins of theCalifornia Borderlands.
Planktonic Foraminifers
Planktonic foraminifers at Site 1015 indicate a sequence rangingin age from the Holocene through latest Pleistocene oxygen isotopicStage 3 (Table 3). The age of the base of the sequence is not yetknown, but the sequence of climatic cycles suggests that it is youngerthan Stage 4 (60 ka). The core-catcher samples examined from Site1015 are from two distinct sediment facies: fine sand turbidites andhemipelagic sediments. Both planktonic and benthic foraminifers arecompletely absent in sediments dominated by fine sands. In contrast,samples from hemipelagic layers contain abundant to few well-pre-served planktonic foraminifers and common to abundant well-pre-served benthic foraminifers. The great majority of planktonic fora-minifers observed are in place. A small percentage of specimens are
228
clearly reworked from shallower depths and are poorly preserved.Changes in planktonic foraminifer assemblages in this sequence ex-hibit clear evidence of large-scale Quaternary glacial-interglacial os-cillations.
The uppermost part of Hole 1015A (Samples 167-1015A-1H-CCto 3H-CC) and Hole 1015B (Samples 167-1015B-1H-CC to 4H-CC)contains relatively warm-water planktonic foraminifers includingNeogloboquadrina pachyderma (dextral) and N. dutertrei. Belowthis level, the sequence contains cooler water planktonic foraminifersincluding N. pachyderma (sinistral). The base of the warm-water as-semblages in the upper part of the sequence is considered to representthe base of the Holocene (~11 ka). This shows that the Holocene is~31 m thick at Site 1015. Changes in composition of planktonic for-aminifers before the Holocene reflect oscillations in climatic condi-tions during the last glaciation that require documentation. The in-ferred coldest assemblages occur between Samples 167-1015A-8H-CC and 12H-CC. There is no evidence for interglacial planktonic for-aminifer assemblages near the bottom of the cored sequence thatmight indicate presence of the last interglacial episode (oxygen iso-tope Stage 5).
Benthic foraminifers occur in all hemipelagic sediment intervalsin variable abundances. They are often abundant, diverse, and wellpreserved, and are especially well preserved in the Holocene sedi-ments. Holocene assemblages are dominated by Bolivina spp., espe-cially B. spissa and B. argentea which, in Santa Barbara Basin Site893, are associated in abundance with laminated sediments, repre-senting very low oxygen levels of bottom waters (Kennett, Baldauf,Lyle, et al., 1995). This also appears to be the case in Santa MonicaBasin Site 1015. The preliminary evidence from Site 1015 also indi-cates that the benthic foraminifer assemblages inferred to be closelyassociated with very low oxygen levels in basinal waters are also as-sociated with the warmest intervals based upon planktonic foramini-fer assemblages. Holocene (interglacial) assemblages are dominatedby Bolivina spp. and also include Globobulimina, Rutherfordoides,Buliminella, Cassidulina, and Uvigerina. Such an assemblage indi-cates low-oxygen bottom waters during the Holocene. In contrast, as-semblages of glacial age are often dominated by Uvigerina and haveOridorsalis, Globobulimina, Epistominella, Baggina, Cibicidoides,
Table 3. Distribution and abundances of planktonic foraminifers in Hole 1015A.
Note: See “Explanatory Notes” chapter for abbreviations.
ZoneCore, section,
intervalDepth(mbsf) A
bund
ance
Pres
erva
tion
Neo
glob
oqua
drin
a du
tert
rei
Glo
boro
tali
a in
flat
a
Neo
glob
oqua
drin
a pa
chyd
erm
a de
x.
Neo
glob
oqua
drin
a pa
chyd
erm
a si
n.
Glo
bige
rina
bul
loid
es
Orb
ulin
a un
iver
sa
Glo
bige
rino
ides
rub
er
Glo
boro
tali
a sc
itul
a
Glo
bige
rini
ta g
luti
nata
Glo
bige
rina
qui
nque
loba
Glo
boro
tali
a tr
unca
tuli
noid
es
Has
tige
rina
aeq
uila
tera
lis
Glo
bige
rina
falc
onen
sis
167-1015A-1H-CC 7.0 A G R C R F R2H-CC 17.0 C G F C F R A3H-CC 26.0 C G F C F C F R R R4H-CC 36.0 B5H-CC 45.0 F G R C F R C R6H-CC 54.0 F G F F R R R7H-CC 64.0 F G C F F C
N22/23 8H-CC 74.0 C G A C R R9H-CC 83.0 A G A A R R R A10H-CC 93.0 F G C A C11H-CC 102.0 A G A A R A12H-CC 112.0 A G A A R A13H-CC 121.0 B14H-CC 131.0 B15H-CC 140.0 C G R F C C R R16H-CC 150.0 F G F C F

SITE 1015
g
d se
les6ge
om4- toine
scalelottedcur aten-
w sear thaton arethe
ter-nce
l sup-ea-
re- scaleoids
. Thep toeachd be-
Pyrgo, and other forms indicative of more oxygenated waters. As-semblages of intermediate character also occur during the glacial in-terval. Therefore, the late Quaternary sequence at Site 1015 suggeststhat the glacial-interglacial episodes are associated with changes incirculation of upper intermediate waters that affect changes in oxy-gen levels of the basins of the California Borderland.
Calcareous Nannofossils
The calcareous nannofossils at Site 1015 are abundant to absentand generally well preserved throughout the sequence. Holes 1015Aand 1015B represent an interval spanning the latest Pleistocene toHolocene Zone CN15 (Table 4).
Nannofossil assemblages are marked by a dominance of Emilian-ia huxleyi, the presence of Helicosphaera carteri, and several mor-photypes of Gephyrocapsa spp. The dominance of E. huxleyi indi-cates an age younger than 85 ka (bottom of acme of E. huxleyi). Inaddition, several specimens of E. huxleyi are large (4 µm), supportinthis younger age.
Diatoms
Diatoms are either absent or occur only in trace amounts anof no value for biostratigraphy at Site 1015 (Table 5). Those preare very poorly preserved. The uppermost core-catcher sampHoles 1015A and 1015B (Samples 167-1015A-1H-CC and 11015B-1H-CC) contain common to few siliceous bands dislodfrom the girdles of diatom cells.
arent of
7-d
COMPOSITE DEPTHSAND SEDIMENTATION RATES
Multisensor track (MST) data collected at 5-cm intervals frHoles 1015A and 1015B and color reflectance data collected at 6-cm intervals from Holes 1015A and 1015B were used to determdepth offsets in the composite section. On the composite depth (expressed as mcd, meters composite depth), features of the pMST data present in adjacent holes are aligned so that they ocapproximately the same depth. Working from the top of the sedimtary sequence, a constant was added to the mbsf (meters belofloor) depth for each core in each hole to arrive at a mcd depth focore. The depths offsets that compose the composite depth sectigiven in Table 6 (also on CD-ROM, back pocket). Continuity of sedimentary sequence was documented for the upper 36 mcd.
Magnetic susceptibility was the primary parameter used for inhole correlation purposes. GRAPE bulk density and color reflectameasurements were used in a few intervals to provide additionaport for composite construction. Natural gamma-ray activity msurements were made only in Hole 1015B.
The magnetic susceptibility, GRAPE bulk density, and colorflectance records for Site 1015 are shown on a composite depthin Figure 6. The GRAPE data were used to identify intervals of vand highly disturbed sediments (values <1.4 g/cm3) and these inter-vals were culled from all the MST and color reflectance data setscores from Holes 1015A and 1015B provide continuous overlaabout 36 mcd. Below 36 mcd, some cores were correlated to other, but composite records and splices could not be constructe
Table 4. Distribution and abundances of calcareous nannofossils in Holes 1015A and 1015B.
Note: See “Explanatory Notes” chapter for abbreviations.
ZoneCore, section,
intervalDepth(mbsf) Pr
eser
vati
on
Abu
ndan
ce
Em
ilia
nia
huxl
eyi
Pse
udoe
mil
iani
a la
cuno
sa
Hel
icos
phae
ra c
arte
ri
Hel
icos
phae
ra s
elli
i
Gep
hyro
caps
a oc
eani
ca s
.l.
Gep
hyro
caps
a sp
. 3
Gep
hyro
caps
a sm
all
Gep
hyro
caps
a la
rge
Coc
coli
thus
pel
agic
us
167-1015A-CN15 1H-CC 7 G A A P C A C/FCN15 2H-CC 16.5 G/M R P R R CCN15 3H-CC 26 G RR P P P 4H-CC 35.5 P/M RR RR RCN15 5H-CC 45 M/G F P P PCN15 6H-CC 54 G R P P PCN15 7H-CC 64 M/G RR P P PCN15 8H-CC 73.5 M F C P CCN15 9H-top M/G F C P CCN15 9H-CC 83 G C C P C 10H-CC 92.5 P RR PCN15 11H-CC 102 M/G F/C P P PCN15 12H-CC 111.5 G F P P PCN15 13H-CC 121 G RR PCN15 14H-CC 130.5 P RR P PCN15 15H-CC 140 G A C R P A CCN15 16H-CC 149.5 G R P P
167-1015B-CN15 1H-CC 2.3 G F/C C R P CCN15 2H-CC 11.8 G A A R C P CCN15 3H-CC 21.3 M R P P PCN15 4H-CC 30.8 P RR P P 5H-CC 40.3 BCN15 6H-CC 49.8 G RR P P R FCN15 7H-CC 59.3 M/G A A P C C 8H-CC 68.8 B 9H-CC 78.3 BCN15 10H-CC 87.8 G C C R P CCN15 11H-CC 99.3 P/M RR P PCN15 12H-CC 106.8 G C C C C
229

SITE 1015
230
No viations.
Table 5. Distribution and abundances of diatoms in Holes 1015A and 1015B.
tes: P = present; more detailed abundance information not available. See “Explanatory Notes” chapter for other abbre
Core, section, interval
Depth (mbsf) A
bund
ance
Pres
erva
tion
Cos
cino
disc
us m
argi
natu
s
Cos
cino
disc
us r
adia
tus
Den
ticu
lops
is c
f. h
yali
na
Den
ticu
lops
is la
uta
s.l.
Rhi
zoso
leni
a ba
rboi
Tha
lass
ione
ma
nitz
schi
oide
s
Tha
lass
iosi
ra s
p.
Dia
tom
fra
gmen
ts (
gird
le b
ands
)
Dia
tom
fra
gmen
ts
Spon
ge s
picu
les
167-1015A-1H-CC 7.0 T P P P P C R2H-CC 16.5 T P P P T R3H-CC 26.0 T P P P4H-CC 35.5 B5H-CC 45.0 T P P P
6H-CC 56.0 T P P P7H-CC 64.0 B8H-CC 73.5 T P P9H-CC 83.0 T P P P10H-CC 92.5 B T
11H-CC 102.0 B T12H-CC 111.5 B T T13H-CC 121.0 B T14H-CC 130.5 B15H-CC 140.0 B T T
16H-CC 149.5 B P
167-1015B-1H-CC 2.3 T P F R R2H-CC 11.8 T P T T F3H-CC 21.3 B4H-CC 30.8 B5H-CC 40.3 B
6H-CC 49.8 B T7H-CC 59.3 B T T8H-CC 68.8 B9H-CC 78.3 B10H-CC 87.8 T P P P P
11H-CC 97.3 B12H-CC 106.8 T P P T
.
Table 6. Site 1015 composite depth section.
Note: This table is also on CD-ROM, back pocket, this volume
Core, sectionOffset(m)
Depth
(mbsf) (mcd)
167-1015A-1H-1 0.00 0.00 0.002H-1 0.58 7.00 7.583H-1 0.99 16.50 17.494H-1 1.98 26.00 27.985H-1 1.98 35.50 37.486H-1 1.98 45.00 46.987H-1 1.98 54.50 56.489H-1 1.98 73.50 75.4810H-1 1.98 83.00 84.9812H-1 1.98 102.00 103.9814H-1 1.98 121.00 122.9815H-1 1.98 130.50 132.4816H-2 1.98 140.92 142.90
167-1015B-1H-1 0.00 0.00 0.002H-1 –0.05 2.30 2.253H-1 1.33 11.80 13.134H-1 2.48 21.30 23.785H-2 2.48 31.43 33.916H-1 2.48 40.30 42.787H-1 2.01 49.80 51.818H-1 2.01 59.30 61.319H-1 2.01 68.80 70.8110H-1 –3.63 78.30 74.6711H-1 –3.63 87.80 84.17
cause the thicker sandy turbidite sequences were too disturbed bydrilling or not recovered at all.
Following construction of the composite depth section for Site1015, a single spliced record was assembled from the aligned coresdown to 36 mcd. Hole 1015A was used as the backbone of the sam-pling splice. Hole 1015B was used to splice across core gaps in Hole1015A. The composite depths were aligned so that tie points betweenadjacent holes occurred at exactly the same depths in meters compos-ite depth. Intervals having significant disturbance or distortion wereavoided if possible. The Site 1015 splice (Table 7, also on CD-ROM,back pocket) can be used as a sampling guide to recover a single con-tinuous sedimentary sequence between 0 and 36 mcd.
INORGANIC GEOCHEMISTRY
We collected nine interstitial water samples from Hole 1015A atdepths ranging from 4.45 to 134.90 mbsf. Although the chemicalcomposition of interstitial waters at this site (Table 8) indicates thatorganic matter diagenesis, biogenic opal dissolution, and authigenicmineral precipitation and/or ion exchange reactions are significantinfluences, the nature of the sediments and the effects of drilling andrecovery on them make it problematic to distinguish primarygeochemical signals from contamination by seawater drilling fluid.
Chlorinity increases from 541 mM at 4.45 mbsf to ≥550 mM from39.78 to 134.90 mbsf (Fig. 7). Salinity, measured refractively as totaldissolved solids, ranges from 31 to 33. Sodium concentrations bycharge balance (Table 8) generally agreed within <5% with those

SITE 1015
20 80 1400
20
40
Magnetic susceptibility
(10– 6 SI)
Dep
th (
mcd
)
A
B
A
1.4 1.8 2.2 2.6
GRAPE bulk density
(g/cm3)
B
A
B
2 8 14
Reflectance (% 650–700nm)
A
B
C
Figure 6. A. Smoothed (15-cm Gaussian) magnetic susceptibility data for the upper 36 m from Site 1015 on the mcd scale. Holes 1015A and 1015B are offset from each other by a constant (40 × 10−6 SI). B. Smoothed (15-cm Gaussian) GRAPE bulk density data for the upper 36 m from Site 1015 on the mcd scale. Holes 1015A and 1015B are offset from each other by a constant (0.4 g/cm3). C. Smoothed (5-point running average) color reflectance (% 650−700 nm band) data for the upper 36 m from Site 1015 on the mcd scale. Holes 1015A and 1015B are offset from each other by a constant (5%).
Table 7. Site 1015 splice tie points.
Note: This table is also on CD-ROM, back pocket, this volume.
Hole, core, section, interval (cm)
Depth Hole, core, section, interval (cm)
Depth
(mbsf) (mcd) (mbsf) (mcd)
1015A-1H-5, 12 6.12 6.12 tie to 1015B-2H-3, 87 6.17 6.121015B-2H-5, 7 8.44 8.39 tie to 1015A-2H-1, 81 7.81 8.391015A-2H-7, 22 16.22 16.8 tie to 1015B-3H-3, 67 15.47 16.81015B-3H-4, 52 16.82 18.15 tie to 1015A-3H-2, 27 17.16 18.151015A-3H-7, 117 25.56 26.55 tie to 1015B-4H-2, 127 24.07 26.551015B-4H-4, 92 26.72 29.2 tie to 1015A-4H-1, 122 27.22 29.21015A-4H-6, 97 34.38 36.36
231

SITE 1015
Table 8. Interstitial water geochemical data, Hole 1015A.
Note: ND = value not determined.
Core, section,interval (cm)
Depth(mbsf) pH
Alkalinity(mM) Salinity
Cl–
(mM)Na+
(mM)SO4
2–
(mM)HPO4
2–
(µM)NH4
+
(mM)H4SiO4(µM)
Ca2+
(mM)Mg2+
(mM)Sr2+
(µM)Li+
(µM)K+
(mM)
167-1015A-1H-3, 145–150 4.45 7.37 38.5 33.0 541 462 <0.7 101 2.7 595 5.96 48.0 98 13 9.82H-3, 145–150 11.45 7.38 31.8 32.5 546 466 <0.7 93 3.6 667 5.15 45.6 94 14 10.53H-3, 145–150 19.84 7.81 13.7 31.5 550 464 <0.7 15 4.3 355 3.88 40.7 89 14 10.14H-3, 140–150 30.40 7.42 11.3 31.0 547 461 <0.7 34 4.6 595 4.05 40.0 94 13 9.25H-3, 128–138 39.78 7.41 11.8 32.0 551 468 <0.7 26 6.9 493 3.99 38.5 94 13 9.56H-3, 124–134 49.24 7.50 13.7 32.0 551 467 <0.7 35 7.0 501 4.60 39.6 103 15 9.79H-3, 135–145 77.22 7.56 ND 32.0 554 <0.7 17 6.2 438 4.13 35.9 94 15 9.912H-4, 127–137 106.84 7.66 16.8 32.0 550 478 <0.7 27 9.4 559 3.92 35.3 98 17 10.415H-3, 140–150 134.90 7.80 15.9 32.0 553 479 <0.7 17 7.7 491 4.55 35.3 103 19 10.0
e
as
m
y-
measured by flame emission spectrophotometry were on average<4% higher than those estimated by charge balance (Table 8).
Alkalinity is >30 mM in the shallowest two samples from 4.45 to11.45 mbsf, then decreases to values generally <15 mM at 19.84mbsf and deeper (Fig. 7). The decline in alkalinity corresponds to in-creasingly sandy sediments in the interstitial water whole rounds anda drop in the “water yield” achieved by squeezing. Sulfate concentra-tions are below the detection limit (approximately 0.7 mM) in allsamples. Phosphate concentrations are >90 µM in the two shallowestsamples from 4.45 to 11.45 mbsf with high alkalinity, then decreasto <40 µM, with sample to sample variability. Ammonium concen-trations increase with increasing depth to values as high as 9 mM at106.84 mbsf. Like the phosphate profile, the ammonium profileshows sample to sample variability not consistent with simple diffu-sive control of these profil es, suggesting variable contamination byseawater drilling fluid.
Dissolved silicate concentrations range from 355 to 667 µM (Fig.7). Strontium concentrations are slightly elevated over seawater val-ues (Table 8).
Calcium concentrations decrease to 3.9 mM at 19.84 mbsf, thengenerally increase with increasing depth to values up to 4.6 mM inthe deepest sample at 134.90 mbsf (Fig. 7). Magnesium concentra-tions generally decrease with increasing depth to values as lowmM at 134.90 mbsf.
ORGANIC GEOCHEMISTRY
The organic geochemistry analyses performed at Site 1015 in-clude measurements of volatile hydrocarbons, elemental composi-tion, and Rock-Eval pyrolysis (for methods see “Organic Geocheistry” section, “Explanatory Notes” chapter, this volume).
Volatile Hydrocarbons
Because of shipboard safety and pollution prevention consider-ations, the concentrations of methane, ethane, propane, and highermolecular weight hydrocarbons were routinely monitored in Hole1015A. The results are displayed in Figure 8 and Table 9. Headspacemethane concentrations are high (5,429−44,236 ppm) throughout theentire core. No significant amounts of higher weight molecular hdrocarbons were observed, indicating that the methane was derivedfrom biogenic degradation of organic matter, and thus is not signifi-cant for safety and pollution investigations. Whenever gas voids oc-curred, vacutainer samples were taken. Because of the direct gas sam-pling method, the methane concentrations of the vacutainer samplesare higher than those of headspace samples. Methane/ethane ratiosare high and show a gradual decrease from top to bottom of the hole.
232
35
-
Elemental Compositions
At Site 1015, 43 sediment samples were analyzed for total carbon,inorganic carbon, total nitrogen, and total sulfur. The results are pre-sented in Table 10 (also on CD-ROM, back pocket, this volume) andFigure 9.
The percentage of calcium carbonate (CaCO3) was calculatedfrom the inorganic carbon concentrations by assuming that all car-bonate occurs in the form of calcite. CaCO3 concentrations are low(2.08−7.25 wt%) within the entire section. Turbidite sands generallyshow slightly lower CaCO3 contents than turbidite silts and hemipe-
0 40Alkalinity (mM)
8000NH4+ (mM)
0 60HPO4
2– (µM)
0 20Ca2+ and Mg2+ (mM)
560520Cl– (mM)
40H4SiO4 (µM)
0
40
80
Dep
th (
mbs
f)D
epth
(m
bsf)
0
40
80
120
120
20 120
8 6040400 1200
Figure 7. Interstitial water geochemical data, Site 1015. Solid circles = Ca,open circles = Mg.

SITE 1015
t 2
db0
c
Fo kilyTvt earre
nts oar pe
tioFutrle
dc
olw)
ias
olsmo
roisheF t
ity
re-ow-rbid-hinhicif- flat
lagic clays. This coincides with the occurrence of foraminifers andcalcareous nannofossils (see “Biostratigraphy” section, this chap
Total organic carbon (TOC) content varies between 0.21 andwt% (Table 10, also on CD-ROM, back pocket; Fig. 9). High TOcontent of a turbidite sand (Sample 167-1015B-8H-4, 39−40 cm) isattributed to a high proportion of terrigenous organic matter, baseits high TOC/TN ratio (Table 10). Total nitrogen content varies tween 0.06 and 0.28 wt%. Total sulfur content ranges from 0.10.80 wt% (Table 10).
Type of Organic Matter
In order to characterize the organic matter, TOC/TN ratio, RoEval hydrogen index (HI), oxygen index (OI), and S2/S3 ratio wereused. Results of Rock-Eval pyrolysis are shown in Table 11 andures 10 and 11. TOC/TN ratio of most samples range from 5 t(Fig. 9), which indicates a predominant marine origin (Bordovs1965; Emerson and Hedges, 1988). In contrast, Rock-Eval pyroshows that the selected samples are distributed in the region of III kerogen (Fig. 11), indicating that the organic matter was derifrom higher plants such as land plants and/or seagrass (TissoWelte, 1984). These data are consistent with a microscopic obstion of smear slides showing abundant plant debris (see “Lithostrraphy” section, this chapter). The contradicting conclusions infefrom TOC/TN ratio and Rock-Eval pyrolysis likely result from thselective degradation of marine organic matter after depositiomarine organic matter was incorporated into the sediment withouvere degradation, because of the high sedimentation rates at thithe TOC/TN ratio, which reflects mainly the initial compositionorganic matter soon after deposition, shows a predominantly morigin. On the other hand, terrigenous organic matter becamedominant because of its selective preservation during early diagsis. Therefore, Rock-Eval pyrolysis, which reflects the composiof organic matter after deposition, indicates a terrestrial origin. ther shore-based investigations such as the analyses of stable niisotopes, kerogens, and lipids may contribute to solving this prob
PHYSICAL PROPERTIES
Multisensor Track Measurements
The shipboard physical properties program at Site 1015 inclunondestructive measurements of bulk density, bulk magnetic sustibility, P-wave velocity, and natural gamma-ray activity on whsections of all cores using the MST. Magnetic susceptibility measured at 5-cm intervals at low sensitivity (1-s measuring timeall Site 1015 cores. Fluctuations in magnetic susceptibility are mlikely associated with increases in the terrigenous input assocwith the turbidites. For example, the high susceptibility valueabout 55 mbsf (Fig. 12) occur where an abundance of amphiboledetected (see “Lithostratigraphy” section, this chapter).
GRAPE bulk density measurements were made at intervalscm. PWL velocity measurements were made at 20-cm intervaHole 1015A and at 5-cm intervals in Hole 1015B. Natural gamray activity was measured with a 15-s count every 20 cm in H1015B. The abrupt increase in velocity measured by the PWL fan average of 1580 to an average of 4020 m/s at about 5 mbsf the result of a significant change in lithology (see “Lithostratigrapsection, this chapter) nor is it reflected in any associated changthe whole-round wet-bulk density estimates from the GRAPE (12). Rather, it is simply the arrival of the energy traveling aroundcore liner; the sediments were very gassy and attenuated energyeling through the core.
er)..19C
one- to
k-
ig-10y,sisypeedandrva-tig-ed
. If se- site,finere-ne-nr-
ogenm.
edep-eas onosttedatwas
f 5 ina-lem not
y”s inig.hetrav-
Index Properties
Discrete index properties, velocity, and thermal conductivmeasurements were not made on the Site 1015 cores.
Color Reflectance
A 4-cm sampling interval was used for color reflectance measuments at Holes 1015A and 1015B. Large portions of both holes, hever, were not measured because of gas voids and recurring tuites. Reflectance is low at Site 1015, typically less than 10% witthe visible bands (Fig. 13A). Spectral comparison of a sandy litturbidite and a laminated hemipelagic section shows only minor dferences (Figs. 13B and 13C, respectively). Both spectra have a
1 100 104 106
0
60
120
Dep
th (
mbs
f)
C1 (ppm)
Vacutainer
Headspace
Figure 8. Concentrations of methane (C1) obtained by the headspace andvacutainer techniques from Hole 1015B.
Table 9. Concentrations of methane (C1) and ethane/ethene (C2) obtainedby the headspace and vacutainer techniques from Hole 1015A.
Core, section,interval (cm)
Depth(mbsf)
C1(ppm)
C2(ppm) C1/C2
Headspace167-1015A-
1H-4, 0−5 4.53 17,7022H-4, 0−5 11.53 24,9693H-4, 0−5 21.03 5,4294H-4, 0−5 30.53 10,3325H-4, 0−5 40.03 27,7966H-4, 0−5 49.53 10,0797H-4, 0−5 59.03 6,2739H-4, 0−5 78.03 9,38810H-2, 0−5 84.53 19,05511H-3, 0−5 95.53 47,29812H-5, 0−5 108.03 34,69214H-2, 0−5 122.53 20,86515H-4, 0−5 135.03 44,23616H-3, 0−5 143.03 17,081
Vacutainer167-1015A-
3H-4, 100−101 22.01 970,945 3 323,6484H-4, 100−101 31.51 718,221 2 359,1115H-4, 100−101 41.01 999,999 3 333,3336H-4, 100−101 50.51 999,999 3 333,3337H-4, 100−101 59.91 939,957 3 313,3198H-4, 100−101 69.51 852,592 4 213,1489H-4, 100−101 79.01 999,999 3 333,33310H-4, 100−101 88.51 882,727 7 126,10411H-4, 100−101 98.01 972,495 5 194,499
233

SITE 1015
Table 10. Depth variation in concentrations of inorganic carbon, calcium carbonate, total carbon, total organic carbon, total nitrogen, and total sulfurin weight percent (wt%) in Hole 1015B.
Note: This table is also on CD-ROM, back pocket, this volume.
Core, section,interval (cm)
Depth(mbsf)
Inorganic carbon (wt%)
CaCO3(wt%)
Total carbon (wt%)
Total organic carbon (wt%)
Total nitrogen (wt%)
Total organic carbon/total
nitrogen Total sulfur
(wt%)
167-1015B-1H, 65-66 0.65 0.51 4.25 1.74 1.23 0.16 0.37 0.431H-2, 65-66 2.15 0.53 4.41 1.82 1.29 0.18 0.50 0.362H-2, 35-36 2.65 0.57 4.75 1.69 1.12 0.16 0.35 0.462H-2, 35-36 4.15 0.64 5.33 1.97 1.33 0.19 0.53 0.362H-3, 80-81 6.10 0.63 5.25 2.26 1.63 0.22 0.59 0.372H-4, 35-36 7.18 0.70 5.83 1.98 1.28 0.16 0.48 0.332H-5, 80-81 9.17 0.54 4.50 1.66 1.12 0.17 0.38 0.452H-6, 35-36 10.24 0.87 7.25 3.06 2.19 0.28 0.55 0.513H-1, 70-71 12.50 0.61 5.08 1.92 1.31 0.20 0.53 0.383H-2, 70-71 14.00 0.68 5.66 2.01 1.33 0.19 0.43 0.443H-3, 54-55 15.34 0.58 4.83 1.61 1.03 0.16 0.46 0.353H-4, 90-91 17.20 0.63 5.25 1.66 1.03 0.14 0.38 0.373H-5, 103-104 18.83 0.49 4.08 1.41 0.92 0.14 0.64 0.223H-6, 104-105 20.34 0.65 5.41 1.60 0.95 0.14 0.52 0.273H-7, 30-31 21.10 0.51 4.25 1.12 0.61 0.12 0.60 0.204H-1, 30-31 21.60 0.58 4.83 1.51 0.93 0.16 0.70 0.234H-3, 50-51 24.80 0.73 6.08 1.92 1.19 0.17 0.71 0.244H-4, 96-97 26.76 0.70 5.83 2.08 1.38 0.19 1.06 0.184H-5, 42-43 27.72 0.72 6.00 2.18 1.46 0.21 1.11 0.194H-6, 50-51 29.30 0.59 4.91 1.80 1.21 0.18 0.56 0.324H-7, 50-51 30.52 0.45 3.75 1.82 1.37 0.14 0.41 0.345H-1, 43-44 31.23 0.62 5.16 1.99 1.37 0.18 0.23 0.805H-2, 35-36 31.78 0.29 2.42 0.60 0.31 0.06 0.35 0.176H-1, 35-36 40.65 0.65 5.41 1.80 1.15 0.20 0.83 0.246H-2, 35-36 42.11 0.64 5.33 1.78 1.14 0.15 0.47 0.326H-3, 35-36 43.61 0.31 2.58 0.52 0.21 0.06 0.60 0.106H-4, 35-36 45.07 0.61 5.08 1.61 1.00 0.15 0.47 0.327H-1, 35-36 50.15 0.68 5.66 1.75 1.07 0.15 0.50 0.307H-2, 35-36 51.65 0.67 5.58 1.63 0.96 0.20 0.65 0.317H-3, 95-96 53.52 0.64 5.33 1.77 1.13 0.10 0.43 0.237H-4, 35-36 54.42 0.64 5.33 1.70 1.06 0.14 0.42 0.337H-5, 35-36 55.92 0.56 4.66 1.49 0.93 0.19 0.58 0.337H-6, 35-36 57.28 0.34 2.83 0.57 0.23 0.04 0.44 0.098H-2, 40-41 61.15 0.54 4.50 1.61 1.07 0.17 0.52 0.338H-3, 51-52 62.65 0.37 3.08 1.21 0.84 0.11 0.39 0.288H-4, 39-40 63.93 0.50 4.17 2.45 1.95 0.11 0.18 0.629H-1, 5-6 68.85 0.25 2.08 1.17 0.92 0.09 0.26 0.349H-1, 50-51 69.30 0.63 5.25 1.51 0.88 0.23 0.96 0.249H-3, 6-7 71.86 0.57 4.75 1.52 0.95 0.12 0.41 0.2910H-1, 18-19 78.48 0.54 4.50 1.60 1.06 0.14 0.74 0.1910H-2, 60-61 79.59 0.76 6.33 1.77 1.01 0.22 1.16 0.1910H-5, 24-25 83.58 0.70 5.83 1.83 1.13 0.21 0.78 0.2711H-1, 29-30 88.09 0.64 5.33 1.91 1.27 0.15 0.68 0.22
ap-
alel.”es
d, the tomi- tur-be
llowax- sed-gen
pattern between 400 and 950 nm; the average color reflectance is 5%for the turbidite and approximately 7% for the laminated hemipelagicinterval. These low reflectance values and small differences in spec-tral shape are most likely because of the low biogenic calcium car-bonate and opal content at Site 1015. The turbidites are barren ornearly barren of calcareous and siliceous microfossils, and the hemi-
0 10 20TOC/TN
0 1 2 3TOC (wt%)
0 4 80
40
80
Dep
th (
mbs
f)
CaCO3 (wt%)
Figure 9. Depth variations of calcium carbonate (CaCO3) and total organiccarbon (TOC) contents and total organic carbon/total nitrogen (TOC/TN)ratio in sediments from Hole 1015B.
234
pelagic sections are rich in terrigenous clay and contain less than 8%calcium carbonate (see “Organic Geochemistry” section, this chter).
Digital Color Video
All cores from Site 1015 were imaged with the ODP color digitimaging system over 20-cm intervals to provide a 0.25-mm pixDigital color video data of CIELAB L* (see “Physical Propertiessection, “Explanatory Notes” chapter, this volume) from Hol1015A and 1015B show poor hole-to-hole correlation (Fig. 14).
SUMMARY
At Site 1015, in Santa Monica Basin of the California Borderlanwe drilled to sample an upper Pleistocene sedimentary section inhopes of obtaining a sedimentary section with similar resolutionSite 893 in the Santa Barbara Basin. Whereas high-resolution lanated intervals were found in the section, the sediments are ~85%bidites (Fig. 15). Provided that radiocarbon age control can achieved, however, the extremely fast sedimentation rate may areasonably detailed study of the transition from the last glacial mimum to the present. Because the basin sill depth is 740 mbsl, theimentary record was generated near the core of the modern oxyminimum (Emery, 1960).

SITE 1015
Table 11. Results of Rock-Eval pyrolysis for selected samples for Hole 1015B.
Core, section, interval (cm)
Depth(mbsf)
TOC(wt%)
Tmax(°C)
S1(mg/g)
S2(mg/g)
S3 (mg/g)
PI(S1/[S1+S2])
S2/S3 HI(100S2/TOC)
OI(100S3/TOC)
167-1015B-1H-1, 65–66 0.65 1.12 404 0.27 1.40 2.82 0.16 0.50 125 2522H-3, 80–81 6.10 1.55 393 0.70 2.89 3.60 0.19 0.80 186 2323H-2, 70–71 14.00 1.25 405 0.28 1.93 2.89 0.13 0.67 154 2313H-7, 30–31 21.10 0.58 413 0.19 0.96 2.37 0.17 0.41 166 4094H-6, 50–51 29.30 1.15 417 0.27 1.67 3.62 0.14 0.46 145 3156H-1, 35–36 40.65 1.14 416 0.28 1.89 3.56 0.13 0.53 166 3127H-5, 35–36 50.15 0.96 415 0.23 1.54 4.36 0.13 0.35 160 4547H-5, 35–36 55.92 0.84 411 0.18 1.06 3.07 0.15 0.35 126 3658H-3, 51–52 62.65 0.70 418 0.08 0.92 1.35 0.08 0.68 131 1939H-1, 50–51 69.30 0.89 416 0.17 1.23 4.05 0.12 0.30 138 45510H-2, 60–61 79.59 1.04 413 0.24 1.61 4.18 0.13 0.39 155 40211H-1, 29–30 88.09 1.22 417 0.24 1.87 4.28 0.11 0.44 153 351
manan
Site 1015 was double cored to a depth of 98 mbsf and single coredto 150 mbsf. A continuous sedimentary sequence could only be gen-erated to 34 mbsf because of flow-in associated with certain large tur-bidites. The base of the sediment column is very young, less than 85ka by calcareous nannofossil biostratigraphy, giving this site almosttwice the sedimentation rate of Site 893 in the Santa Barbara Basin.
0 0.4 0.8S2/S3
0 200 400
Oxygen index(mg CO
2/g C)
0 100 2000
40
80
Hydrogen index(mg HC/g C)
Dep
th (
mbs
f)
0 300 600
600
300
0
Type III
Type IIType I
Hyd
roge
n in
dex
(mg
HC
/g C
)
Oxygen index (mg CO2/g C)
Figure 10. Depth variations of Rock-Eval hydrogen index (HI), oxygen index(OI), and S2/S3 ratio in sediments from Hole 1015B.
Figure 11. A “van Krevelen” type diagram (HI-OI diagram) for selected saples from Hole 1015B. Types I and II originate mainly from aquatic orgisms, whereas Type III originates from oxidized marine organic matter land plants (Tissot and Welte, 1984).
REFERENCES
Behl, R.J., and Kennett, J.P., 1996. Brief interstadial events in Santa Barbarabasin, NE Pacific, during the past 60 kyr. Nature, 379:243−246.
Bordovskiy, O.K., 1965. Accumulation and transformation of organic sub-stances in marine sediment, 2. Sources of organic matter in marinebasins. Mar. Geol., 3:5−31.
Drake, D.E., Kolpack, R.L., and Fischer, P.J., 1972. Sediment transport onthe Santa Barbara-Oxnard Shelf, Santa Barbara Channel, California. InSwift, D.J.P., Duane, D.B., and Pilkey, O.H. (Eds.), Shelf SedimentTransport: Process and Pattern: Stroudsburg, PA (Dowden, Hutchinson,and Ross), 307−331.
Emerson, S., and Hedges, J.I., 1988. Processes controlling the organic carboncontent of open ocean sediments. Paleoceanography, 3:621−634.
Emery, K.O., 1960. The Sea Off Southern California: A Modern Habitat ofPetroleum: New York (Wiley).
Kennett, J.P., Baldauf, J.G., and Lyle, M. (Eds.), 1995. Proc. ODP, Sci.Results, 146 (Pt. 2): College Station, TX (Ocean Drilling Program).
Kennett, J.P., and Venz, K., 1995. Late Quaternary climatically related plank-tonic foraminiferal assemblage changes: Hole 893A, Santa BarbaraBasin, California. In Kennett, J.P., Baldauf, J.G., and Lyle, M. (Eds.),Proc. ODP, Sci. Results, 146 (Pt. 2): College Station, TX (Ocean DrillingProgram), 281−293.
Lyle, M., Gallaway, P.J., Liberty, L.M., Mix, A., Stott, L., Hammond, D.,Gardner, J., Dean, W., and the EW9504 Scientific Party, 1995a. Data sub-
--d
0 100 2000
40
80
120
Magneticsusceptibility
Dep
th (
mbs
f)
1.0 2.0
GRAPEbulk density
(g/cm3)1400 2900 4400
PWLvelocity(m/s)(10 SI)– 6
Figure 12. MST data from Hole 1015A.
235

SITE 1015
file
cfrt
er
mission. W9406 and EW9504 site surveys of the California margin pro-posed drillsites, Leg 167 (Vol. 1): Site maps and descriptions. Boise StateUniv., CGISS Tech. Rep., 95−11.————, 1995b. Data submission. W9406 and EW9504 site surveys oCalifornia margin proposed drillsites, Leg 167 (Vol. 2): Seismic profBoise State Univ., CGISS Tech. Rep., 95−12.
Savrda, C.E., Bottjer, D.J., and Gorsline, D.S., 1984. Development of aprehensive oxygen-deficient marine biofacies model: evidence Santa Monica, San Pedro and Santa Barbara basins, California Contal Borderland. AAPG Bull., 68:1179−1192.
236
d
thes.
om-ominen-
Stow, D.A.V., and Wetzel, A., 1990. Hemiturbidite: a new type of deep-watsediment. In Cochran, J.R., Stow, D.A.V., et al., Proc. ODP, Sci. Results,116: College Station, TX (Ocean Drilling Program), 25−34.
Tissot, B.P., and Welte, D.H., 1984. Petroleum Formation and Occurrence(2nd ed.): Heidelberg (Springer-Verlag).
Ms 167IR-109
NOTE: For all sites drilled, core-description forms (“barrel sheets”) and core photo-graphs can be found in Section 3, beginning on page 499. Smear-slide data can be foundin Section 4, beginning on page 1327. See Table of Contents for material contained onCD-ROM.
r
0 5 10 150
20
40
60
Dep
th (
mbs
f)
Reflectance(% 450–500 nm)
A
0
5
10
15200 600 1000
Mixed turbidite(7.23 mbsf)
Wavelength (nm)
Ref
lect
ance
(%
)
B
0
5
10
15Laminated interval
(21.83 mbsf)
Ref
lect
ance
(%
)
C
Figure 13. Summary of color reflectance data at Hole 1015A. A. Percentcolor reflectance of the 450−500-nm band average from 0 to 60 mbsf. B.Characteristic spectra of a turbidite. C. Characteristic spectra of a laminateinterval.
30 500
40
80
120
Dep
th (
mbs
f)
AL*
30 500
40
80
BL*
Figure 14. Intensity of color CIELAB L* from the digital color video foHoles 1015A (A) and 1015B (B). Data were decimated at 2-cm intervals.

SITE 1015
362 236 198 152
X line 4X line 5 X line 9
4400 m
Site 1015
Tw
o-w
ay tr
avel
time
(s)
N S
Water depth = 901m Sill depth = 740 m
late
Qu
ate
rna
ry
Tu
rbid
ites
10
20
30
40
50
60
70
80
90
100
110
120
130
140
De
pth
(m
bsf
)
0
X line 6
I
1000
2200
1800
1400
Shotpoints
150
Figure 15. Comparison of the lithostratigraphic column at Site 1015 and a seismic profile through the site (Line EW9504 BA4-1; Lyle et al., 1995a, 1995b). Tiesare calculated assuming 1600 m/s seismic velocity in the sediments. On y-axis, (s) = milliseconds.
237
3UHYLRXV�&KDSWHU3UHYLRXV�&KDSWHU 7DEOH�RI�&RQWHQWV7DEOH�RI�&RQWHQWV 1H[W�&KDSWHU1H[W�&KDSWHU