Embed Size (px)
Citation preview

Chapter 8. Unemployment and Inflation
Link to syllabus

The US Unemployment Rate 1948-2011. Figure 8-1 p. 214.
Confirms – once again - that unemployment rises in recessions, declines in expansions.
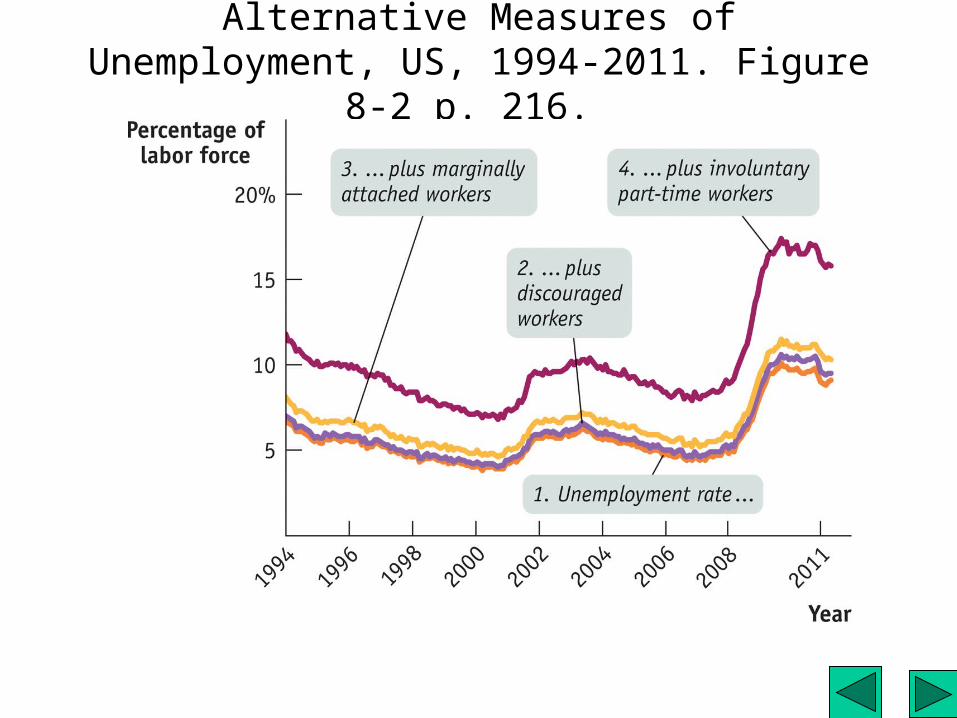
Alternative Measures of Unemployment, US, 1994-2011. Figure 8-2 p. 216.

Unemployment Rates of Different Socio-economic Groups, 2007. Figure 8-3 p. 217.
Groups who have higher unemployment are African Americans andTeens. Gender differences are small, and may favor women.

Unemployment rates by demographic groups, 1999 and 2002 (different textbook)

Unemployment in the U.S.
Source: NYTFeb. 1, 2008.

Michigan & US Unemployment

Figure 8.7 p. 221 Labor Market Flows/month 2007
mt views this as suggesting that the big action isn’t into unemployment,but is people dropping out of the labor force.

Distribution of Unemployment, by Duration of Unemployment. Figure 8-8 p. 222.

Figure 8-9 p. 223. Effect of a Minimum Wage on the Labor Market

Global Comparison, p. 225. Natural Rate of Unemployment among OECD Countries.

Figure 8-10 P. 226. The Changing Makeup of the US Labor Force, 1948-2011.

P. 136BadeParkintext Changes in the Labor Market

EYE ON THE PAST
P. 315(Bade/ParkinText)
Hyperinflation in Germany in the 1920s

German Hyperinflation (p. 480 of K/W)

The Cost of Disinflation. Figure 8-12 p. 233.
Suggestion that in order to lower inflation, there must be higherunemployment.