Embed Size (px)
DESCRIPTION
Chapter 8 Monopoly. Monopoly. exists when a single firm is the sole producer of a product for which there are no close substitutes. Characteristics. Single seller No close substitutes “Price maker” Blocked entry. Barriers to entry. Economies of scale Legal barriers - PowerPoint PPT Presentation
Citation preview

1
exists when a single firm is the sole producer of a product for which there are no close substitutes.
2

1. Single seller
2. No close substitutes
3. “Price maker”
4. Blocked entry
3

1. Economies of scale
2. Legal barriers
3. Ownership or control of resources
4. Strategic barriers
4

Occurs when lowest unit costs depend on the existence of a small number of larger firms or one firm.◦ New firms cannot afford to enter the market
◦ Public utilities
5

Patents provide the exclusive right to produce a product for a fixed number of years.
licenses
6
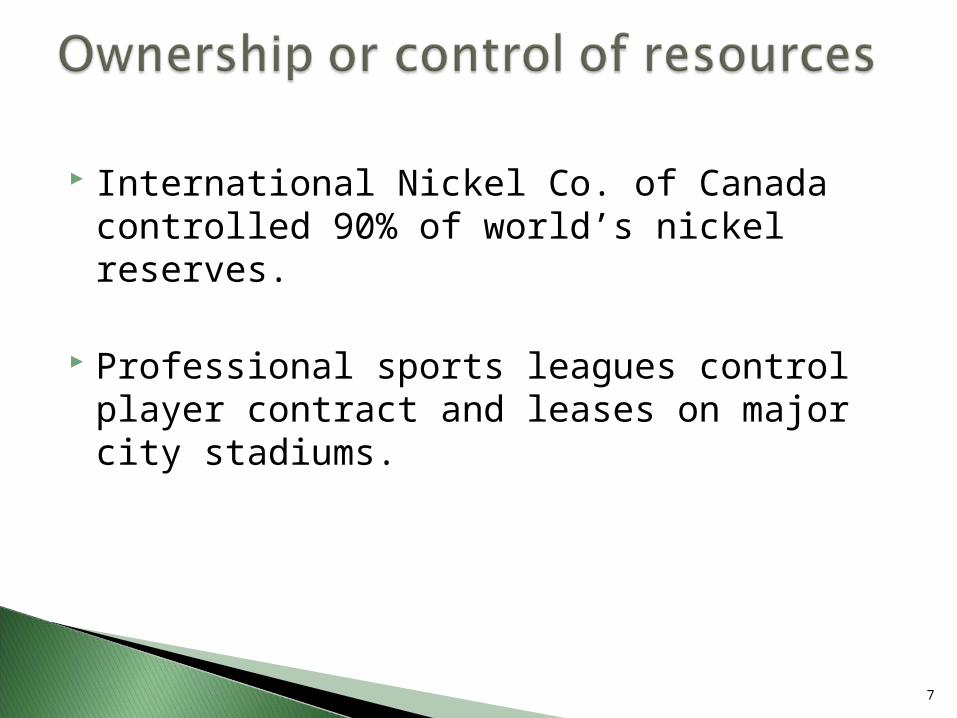
International Nickel Co. of Canada controlled 90% of world’s nickel reserves.
Professional sports leagues control player contract and leases on major city stadiums.
7

Monopoly firms use price & other strategic barriers to keep competition out of the industry.
8

3 assumptions
1. Monopoly is secured by patents, economies of scale, or resource ownership.
2. firm is not regulated by government.
3. a single‑price monopolist
9

Why?
monopolist must lower the price to sell an additional unit.
Added revenue will be price of last unit sold
10

(1)QuantityOf Output
(2)Price
(AverageRevenue)
(3)Total
Revenue(1) X (2)
(4)MarginalRevenue
(5)Average
Total Cost(6)
Total Cost(1) X (5)
(7)Marginal
Cost(8)
Profit (+)or Loss (-)
0123456789
10
$172162152142132122112102
928272
$0162304426528610672714736738720
$162142122102
826242222
-18
$190.00135.00113.33100.0094.0091.6791.4393.7597.78
103.00
$100190270340400470550640750880
1030
$90807060708090
110130150
$-100-28
+34+86
+128+140+122+74-14
-142-310
Revenue Data Cost Data
]]]]]]]]]]
]]]]]]]]]]
Can you See Profit Maximization?11

LO 8.1 12
PP
DD
132132
When price decreases When price decreases from $142 to $132, one from $142 to $132, one more unit is sold…more unit is sold…
Gain = $132Gain = $132
$142$142
1 2 3 4 5 6 1 2 3 4 5 6
Revenue will increase by $132Revenue will increase by $132with the extra unit soldwith the extra unit sold
Figure 8-2
LO 8.1 13
1 2 3 4 5 6 1 2 3 4 5 6
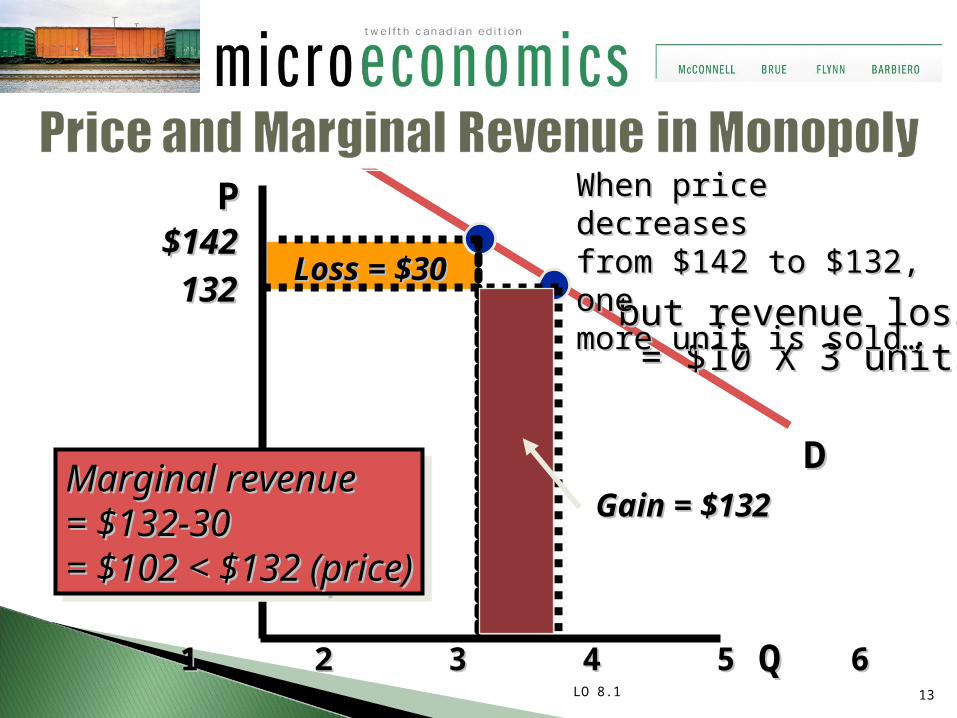
PP
DD
but revenue lossbut revenue loss= $10 X 3 units= $10 X 3 units
Loss = $30Loss = $30
When price decreases When price decreases from $142 to $132, onefrom $142 to $132, onemore unit is sold…more unit is sold…
Gain = $132Gain = $132Marginal revenue Marginal revenue = $132-30= $132-30= $102 < $132 (price)= $102 < $132 (price)
132132$142$142

firm controls output and price
but is not free of market forces, since the combination of output and price that can be sold depends on demand.
14

Total revenue test
15

LO 8.1 16
0 1 2 3 4 5 6 7 8 9 10 11 12 13 14 15 16 17 18QQ
Tota
l rev
enue
Tota
l rev
enue
Pric
e pe
r uni
tPr
ice
per u
nit
200
150
200
50
750
500
250 TRTR
DD
Inelastic
0 1 2 3 4 5 6 7 8 9 10 11 12 13 14 15 16 17 18QQ
MRMR
Elastic
TRTR
Figure 8-3

MR = MC rule
No supply curve
17

Cannot charge the highest price it can get◦ Profits are max where MR = MC
Total profit is the goal◦ Not unit profit
Monopolists can receive economic profits greater than zero in the long run. ◦ Losses can also occur → shut down in LR
18

Monopolist produces less
Monopolist charges higher price
P > MC
19

Productive efficiency?
Allocative efficiency?
20

More unequal
Transfer of income from consumers to business owners
21

Regulatory commission ◦ socially optimal price◦ Fair-return price
22