Embed Size (px)
Citation preview

CHAPTER 7: THE FEEDBACK LOOP
When I complete this chapter, I want to be able to do the following.
• Identify the major elements in the feedback loop
• Select appropriate candidate variables to be controlled and manipulated
• Evaluate the control performance data using standard measures of dynamic performance

Outline of the lesson.
• Typical loop elements
• Relating variables to control objectives
- Examples
• Typical control performance measures
• Five approaches to feedback control
CHAPTER 7: THE FEEDBACK LOOP

CHAPTER 7: THE FEEDBACK LOOP
TC
A
v1
v2
The Concept: We show limited detail in the piping and instrumentation (P&I) drawing. We see the sensor location, variable measured, connection to the final element (valve) and the location of the final element.

CHAPTER 7: THE FEEDBACK LOOP
T
A
v1
v2
The Reality: Many elements in the loop affect the safety, reliability, accuracy, dynamics and cost. Engineers need to understand the details!
4-20 mA
4-20 mA
3-15 psi

CHAPTER 7: THE FEEDBACK LOOP
Sensor &transmitter
electronictransmission
input and A/Dconversion
computingnetwork
electronictransmission
I/Pconversion
pneumatictransmission
final element
THE PROCESS
Make a step(without feedback control)
What affects the response to the computer?
output and D/A

CHAPTER 7: THE FEEDBACK LOOP
Class exercise: Given the following dynamics, sketch the responses for a step in manual station to the displayed value.

CHAPTER 7: THE FEEDBACK LOOP
Class exercise: Given the following dynamics, sketch the responses for a step in manual station to the displayed value.
What you see (from the display) is not always what is occurring!!

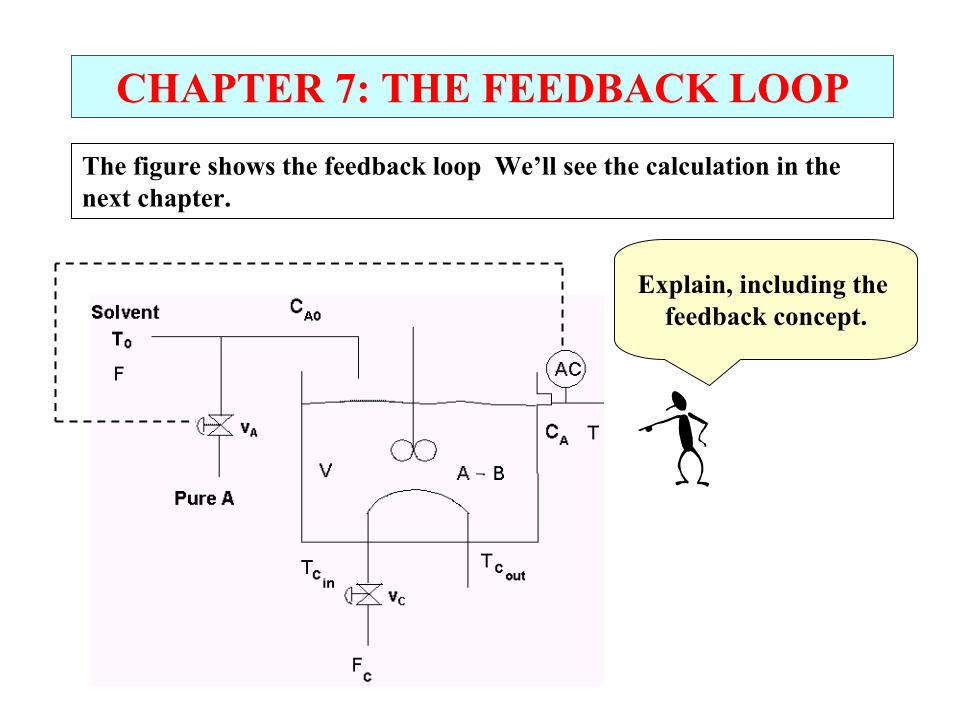
CHAPTER 7: THE FEEDBACK LOOPThe engineer must decide what measurement to control and what valve to adjust (and provide the equipment to support the decisions).

CHAPTER 7: THE FEEDBACK LOOPThe engineer must decide what measurement to control and what valve to adjust (and provide the equipment to support the decisions).
CV to control ? Use seven categories of control objectives!
control objective process variable sensor1) Safety2) Environmental protection3) Equipment protection4) Smooth plant operation
and production rate5) Product quality Concentration of reactant A
in the effluentAnalyzer in reactor effluentmeasuring the mole % A
6) Profit optimization7) Monitoring and diagnosis
CHAPTER 7: THE FEEDBACK LOOPThe engineer must decide what measurement to control and what valve to adjust (and provide the equipment to support the decisions).
MV to adjust ?1. Causal relationship
2. Automated
3. Fast dynamics
4. Compensate for large disturbances
5. Can adjust quickly with little adverse affect on process performance

CHAPTER 7: THE FEEDBACK LOOPThe engineer must decide what measurement to control and what valve to adjust (and provide the equipment to support the decisions).
Input variables that affectthe measured variable
Selected adjustable flow Manipulated valve
Feed temperatureSolvent flow rateFeed composition, before mix
dist
urba
nces
Coolant inlet temperature
Flow of pure A Flow of pure A vA
adju
stab
le
Flow of coolant
We could use either valve.We will revisit this choice
later (Chapter13)
CHAPTER 7: THE FEEDBACK LOOP
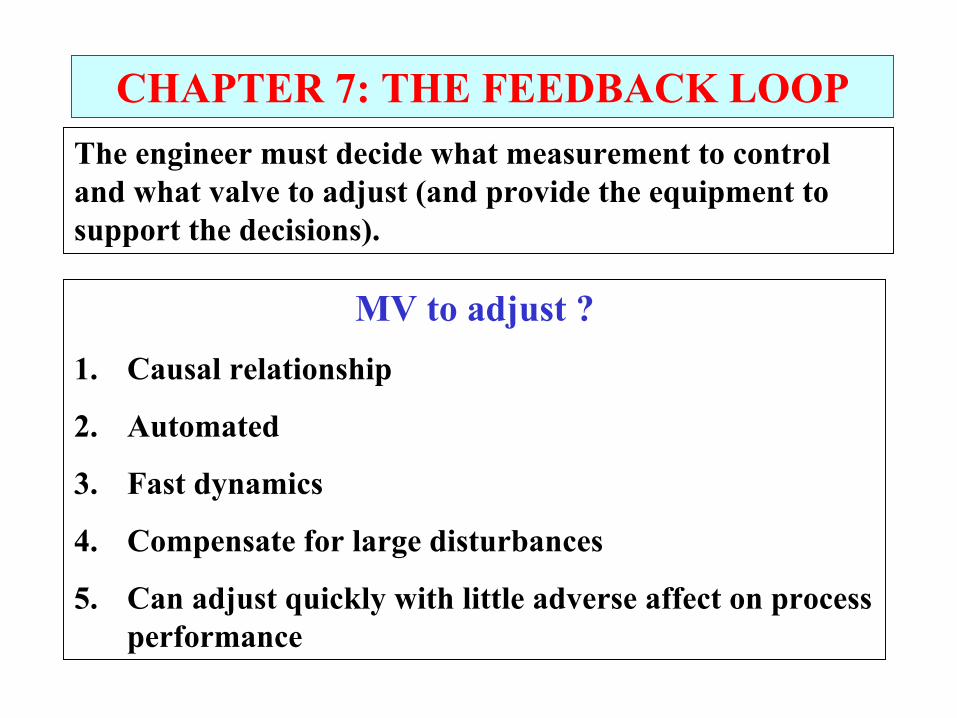
The figure shows the feedback loop We’ll see the calculation in the next chapter.
Explain, including the feedback concept.

FT1
FT2
PT1
AT1
TI1
TI2
TI3
TI4
PI2
PI3
PI4
TI5
TI6
TI7
TI8
TI9
FI3
TI10
TI11
PI5
PI6
Class exercise on the feedback loop: Using the methods just described, select ONE variable to be controlled and for that variable, ONE valve to be manipulated.
feed
airfuel
Flue gas
burner

FT1
FT2
PT1
AT1
TI1
TI2
TI3
TI4
PI2
PI3
PI4
TI5
TI6
TI7
TI8
TI9
FI3
TI10
TI11
PI5
PI6
Class exercise on the feedback loop: Using the methods just described, select ONE variable to be controlled and for that variable, ONE valve to be manipulated.
feed
airfuel
Flue gas
burner
TC

FT1
FT2
PT1
AT1
TI1
TI2
TI3
TI4
PI2
PI3
PI4
TI5
TI6
TI7
TI8
TI9
FI3
TI10
TI11
PI5
PI6
Class exercise on the feedback loop: Using the methods just described, select ONE variable to be controlled and for that variable, ONE valve to be manipulated.
feed
airfuel
Flue gas
burner
ACO2

CHAPTER 7: THE FEEDBACK LOOPMusic: “I cannot define good music, but I know what I like.”
Control Performance: We must be able to define what we desire, so that we can design equipment and controls to achieve our objectives.
0 5 10 15 20 25 30 35 40 45 500
0.5
1
1.5
Time
Con
trolle
d Va
riabl
e
0 5 10 15 20 25 30 35 40 45 500
0.5
1
1.5
2
Time
Man
ipul
ated
Var
iabl
e
Controlled variable, value from a sensor
Manipulated variable, usually a valve
Set pointentered byperson

0 5 10 15 20 25 30 35 40 45 500
0.5
1
1.5
2
Time
Man
ipul
ated
Var
iabl
e
0 5 10 15 20 25 30 35 40 45 500
0.5
1
1.5
Time
Con
trolle
d V
aria
ble
CHAPTER 7: THE FEEDBACK LOOPLet’s be sure we understand the
variables in the plot. We will see thisplot over and over and over …!

CHAPTER 7: THE FEEDBACK LOOPSet point Change
0 5 10 15 20 25 30 35 40 45 500
0.5
1
1.5
Time
0 5 10 15 20 25 30 35 40 45 500
0.5
1
1.5
2
Time
= IAE = ⌠⌡
|SP(t)-CV(t)| dt
Return to set point, “zero offset
Rise time
D
B
B/A = Decay ratio
C/D = Maximum overshoot of manipulated variable
C
A0
∞
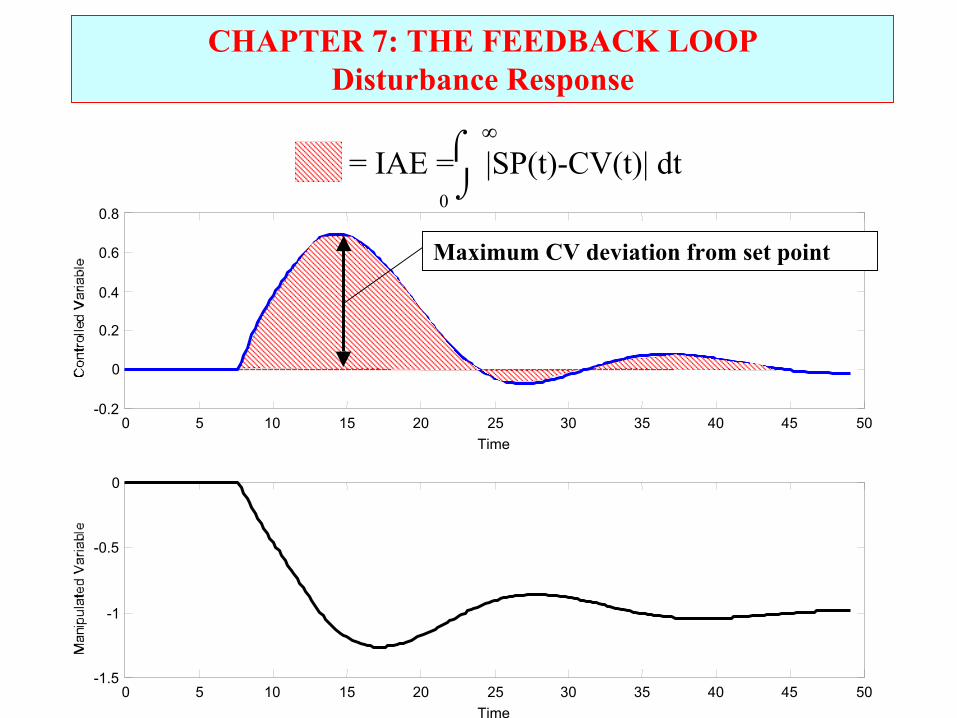
CHAPTER 7: THE FEEDBACK LOOPDisturbance Response
0 5 10 15 20 25 30 35 40 45 50-0.2
0
0.2
0.4
0.6
0.8
Time
0 5 10 15 20 25 30 35 40 45 50-1.5
-1
-0.5
0
Time
= IAE = |SP(t)-CV(t)| dt
Maximum CV deviation from set point
⌠⌡0
∞

CHAPTER 7: THE FEEDBACK LOOPDisturbance Response
0 100 200 300 400 500 600 700 800 900 1000-20
-10
0
10
20S-LOOP plots deviation variables (IAE = 5499.9786)
Time
Con
trolle
d Va
riabl
e
0 100 200 300 400 500 600 700 800 900 1000-20
-10
0
10
20
Time
Man
ipul
ated
Var
iabl
e
Variance or standard deviation of CV
Variance or standard deviation of MV
Often, the process is subject to many large and small disturbances and sensor noise. The performance measure characterizes the variability.

CHAPTER 7: THE FEEDBACK LOOP• To reduce the variability in the CV,
we increase the variability in the MV. • We must design plant with MV’s
that can be adjusted at low cost.
0 100 200 300 400 500 600 700 800 900 1000-20
-10
0
10
20
Time
Con
trolle
d V
aria
ble
0 100 200 300 400 500 600 700 800 900 1000-20
-10
0
10
20
Time
Man
ipul
ated
Var
iabl
e

CHAPTER 7: THE FEEDBACK LOOP
Class exercise: For each of the performance measures below, determine a good value, i.e., large/small, positive/negative, etc.
• Offset
• IAE
• Decay ratio
• Rise time
• Settling time
• MV overshoot
• Maximum CV deviation
• CV variance
• MV variance
Can we achieve good values for all at the same time?What are the tradeoffs?

Class exercise: Comment on the quality of control for the four responses below.
0 20 40 60 80 100 120-0.5
0
0.5
1
1.5S-LOOP plots deviation variables (IAE = 17.5417)
Time
Con
trolle
d Va
riabl
e
0 20 40 60 80 100 120-0.5
0
0.5
1
1.5
2
Time
Man
ipul
ated
Var
iabl
e
A0 20 40 60 80 100 120
-1
0
1
2
3S-LOOP plots deviation variables (IAE = 43.9891)
Time
Con
trolle
d Va
riabl
e
0 20 40 60 80 100 120-1
0
1
2
3
4
Time
Man
ipul
ated
Var
iabl
e
B
0 20 40 60 80 100 120-0.5
0
0.5
1
1.5S-LOOP plots deviation variables (IAE = 34.2753)
Time
Con
trolle
d V
aria
ble
0 20 40 60 80 100 120-0.5
0
0.5
1
Time
Man
ipul
ated
Var
iabl
e
C0 20 40 60 80 100 120
-0.5
0
0.5
1
1.5S-LOOP plots deviation variables (IAE = 24.0376)
Time
Con
trolle
d Va
riabl
e
0 20 40 60 80 100 120-0.5
0
0.5
1
1.5
Time
Man
ipul
ated
Var
iabl
e
D
Too oscillatoryGenerally acceptable
Too slow Gets close quickly; Gets to set point slowly

CHAPTER 7: THE FEEDBACK LOOP
We can apply feedback via many approaches
1, No control - The variable responds to all inputs, it “drifts”.
2. Manual - A person observes measurements and introduces changes to compensate, adjustment depends upon the person.
3. On-Off - The manipulated variable has only two states, this results in oscillations in the system.
4. Continuous, automated - This is a modulating control that has corrections related to the error from desired.
5. Emergency - This approach takes extreme action (shutdown) when a dangerous situation occurs.

CHAPTER 7: THE FEEDBACK LOOP, WORKSHOP 1
The control valve is used to introduce a variable resistance to flow.
• What is the body of the valve?
• Describe three bodies and what factors are important in selecting.
• What is the actuator?
• What power source is used? What happens when the power source fails?

CHAPTER 7: THE FEEDBACK LOOP, WORKSHOP 2
Recommend the correct failure position (open or closed) for each of the circled control valves.
FT1
FT2
PT1
PI1
AT1
TI1
TI2
TI3
TI4
PI2
PI3
PI4
TI5
TI6
TI7
TI8
TI9
FI3
TI10
TI11
PI5
PI6air fuel
feedproduct
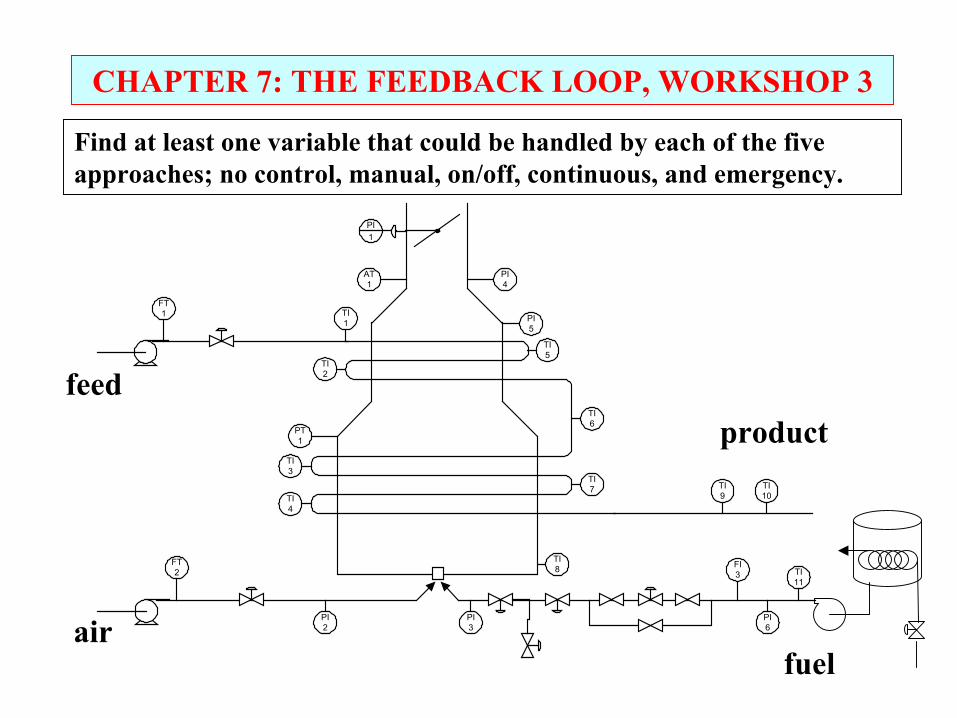
CHAPTER 7: THE FEEDBACK LOOP, WORKSHOP 3
Find at least one variable that could be handled by each of the five approaches; no control, manual, on/off, continuous, and emergency.
FT1
FT2
PT1
PI1
AT1
TI1
TI2
TI3
TI4
PI2
PI3
PI4
TI5
TI6
TI7
TI8
TI9
FI3
TI10
TI11
PI5
PI6air
fuel
feedproduct

CHAPTER 7: THE FEEDBACK LOOP, WORKSHOP 4
CA0
CA
A → B
Solvent
Pure A
vc
TvA
vS
F
V
FC TCin
TCout
Select several pairs of controlled and manipulated variables for the following process.

Lot’s of improvement, but we need some more study!• Read the textbook• Review the notes, especially learning goals and workshop• Try out the self-study suggestions• Naturally, we’ll have an assignment!
CHAPTER 7: THE FEEDBACK LOOP
When I complete this chapter, I want to be able to do the following.
• Identify the major elements in the feedback loop
• Select appropriate candidate variables to be controlled and manipulated
• Evaluate the control performance data using standard measures of dynamic performance

CHAPTER 7: LEARNING RESOURCES
• SITE PC-EDUCATION WEB - Instrumentation Notes- Interactive Learning Module (Chapter 7)- Tutorials (Chapter 7)

CHAPTER 7: SUGGESTIONS FOR SELF-STUDY
1. Find a sample process in each of your previous courses and select a pair of controlled and manipulated variables- Heat Transfer (heat exchanger)- Fluid Mechanics (flow in a pipe- Mass Transfer (stripper, distillation)- Reaction Engr. (packed bed reactor)
2. Compare the measures of control performance in this chapter with the seven control objectives given in Chapter 2.
3. Describe the actions you would take if you measured a disturbance and did not want to wait for feedback corrections.