Embed Size (px)
Citation preview

1
Chapter 7: Surveillance—Data Sources and Indicators
Chronic disease surveillance—the ongoing data collection, analysis, interpretation, and translation
for decision-making is the most important function of a lead chronic disease epidemiologist. Your
essential role as the lead chronic disease epidemiologist is to identify, quantify and monitor
chronic disease risk factors and disorders; to inform program planning and make the case for
public health intervention; and to evaluate program effectiveness and document successes.
Without relevant, reliable data, you and your department could not practice evidence -based public
health.
As a lead chronic disease epidemiologist, become an expert in several data sources used for
chronic disease surveillance and their analyzed results in the form of standard indicators used in
chronic disease epidemiology, oral health, and maternal and child health. Ask colleagues and the
senior epidemiologist (or your supervisor) which data sources and standard indictors are routinely
used for chronic disease surveillance in your state. Familiarize yourself with data sources the
department manages, which data sources need to be overhauled and which ones are going
through major changes, such as the hospitals implementing ICD-10-CM by October 1, 2014. Ask for
examples of an integrated data product from the department that used indicators on chronic
diseases, oral health, and maternal and child health together. For the entry-level epidemiologist,
learn about one data source unfamiliar to you and one set of standard indicators.
This chapter reviews the uses of surveillance and its scope, describes data sources commonly used
for chronic disease epidemiology and state surveillance in terms of the topic and population
covered. This chapter highlights existing standard indicator sets for chronic disease, maternal and
child health, and oral health surveillance and illustrates them with a few example indicators.
Review the Purpose of Surveillance Chronic disease surveillance is relatively new compared with infectious or communicable disease
surveillance and very needed.1 Its overall purpose, however, is the same: to monitor risk factor
and disease trends to inform the development of prevention and control programs, as detailed in
Table 7-1 below.
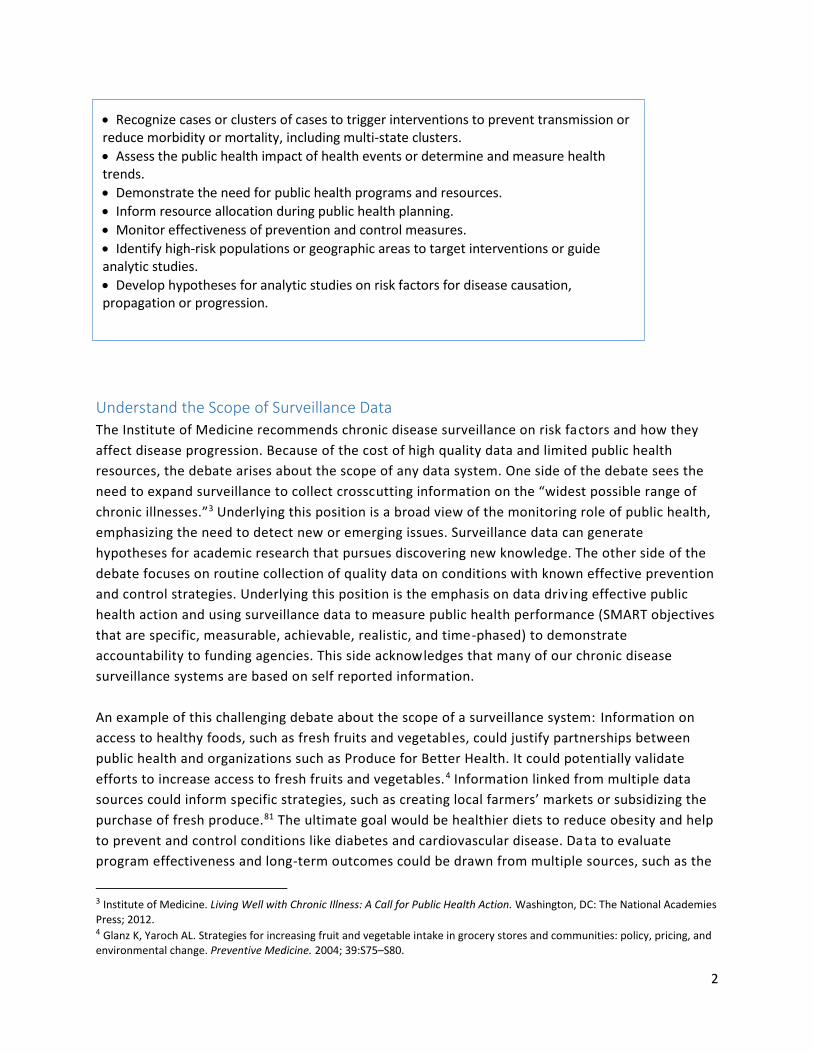
Table 7-1. Uses for Surveillance2
1 World Health Organization. 2008-2013 Action Plan for the Global Strategy for the Prevention and Control of Non-
Communicable Diseases. Geneva, Switzerland: WHO Press; 2008. 2 The World Bank Website. Public Health Surveillance Toolkit. Available at:
http://web.worldbank.org/WBSITE/EXTERNAL/TOPICS/EXTHEALTHNUTRITIONANDPOPULATION/0,,contentMDK:20740013~pagePK:210058~piPK:210062~theSitePK:282511,00.html Accessed February 16, 2015.
2
Understand the Scope of Surveillance Data
The Institute of Medicine recommends chronic disease surveillance on risk factors and how they
affect disease progression. Because of the cost of high quality data and limited public health
resources, the debate arises about the scope of any data system. One side of the debate sees the
need to expand surveillance to collect crosscutting information on the “widest possible range of
chronic illnesses.”3 Underlying this position is a broad view of the monitoring role of public health,
emphasizing the need to detect new or emerging issues. Surveillance data can generate
hypotheses for academic research that pursues discovering new knowledge. The other side of the
debate focuses on routine collection of quality data on conditions with known effective prevention
and control strategies. Underlying this position is the emphasis on data driv ing effective public
health action and using surveillance data to measure public health performance (SMART objectives
that are specific, measurable, achievable, realistic, and time-phased) to demonstrate
accountability to funding agencies. This side acknowledges that many of our chronic disease
surveillance systems are based on self reported information.
An example of this challenging debate about the scope of a surveillance system: Information on
access to healthy foods, such as fresh fruits and vegetables, could justify partnerships between
public health and organizations such as Produce for Better Health. It could potentially validate
efforts to increase access to fresh fruits and vegetables.4 Information linked from multiple data
sources could inform specific strategies, such as creating local farmers’ markets or subsidizing the
purchase of fresh produce.81 The ultimate goal would be healthier diets to reduce obesity and help
to prevent and control conditions like diabetes and cardiovascular disease. Data to evaluate
program effectiveness and long-term outcomes could be drawn from multiple sources, such as the
3 Institute of Medicine. Living Well with Chronic Illness: A Call for Public Health Action. Washington, DC: The National Academies
Press; 2012. 4 Glanz K, Yaroch AL. Strategies for increasing fruit and vegetable intake in grocery stores and communities: policy, pricing, and environmental change. Preventive Medicine. 2004; 39:S75–S80.
Recognize cases or clusters of cases to trigger interventions to prevent transmission or reduce morbidity or mortality, including multi-state clusters.
Assess the public health impact of health events or determine and measure health trends.
Demonstrate the need for public health programs and resources.
Inform resource allocation during public health planning.
Monitor effectiveness of prevention and control measures.
Identify high-risk populations or geographic areas to target interventions or guide analytic studies.
Develop hypotheses for analytic studies on risk factors for disease causation, propagation or progression.

3
Behavioral Risk Factor Surveillance System and point-of-sale receipts. Does the scientific literature
provide strong evidence that solely access to fresh fruits and vegetables improves dietary
behaviors in individuals and if a large number of individuals in the population make these
improvements that the population prevalence of obesity, diabetes, and cardiovascular disease will
decrease or at least stop increasing? To help answer this question, multiple well-designed
evaluation studies are needed.
A caution to both sides of the debate: do not collect more data than you can analyze and
disseminate effectively.5 This chapter does not resolve this healthy debate. However, you as the
lead chronic disease epidemiologist will face this challenge.
Selecting a Health Problem for Surveillance and Public Health Action
If a disease, injury, or condition affects adversely one of the following criteria, 6 public health
professionals create a surveillance system to track it and control it:
Morbidity as measured by increased incidence and/or prevalence
Mortality as measured by increased death rate
Case fatality rate as measured by decreased recovery rates
Lost productivity and/or decreased functioning and quality of life
Preventability
Medical costs
Premature mortality as measured by years of potential life lost, or
Socio-economic impact (health disparities or inequitable distribution among
subpopulations
As demonstrated at the beginning of this manual, the burden of chronic diseases meets almost all
of these criteria. They are leading causes of morbidity, mortality, disability, and decreased quality
of life in the United States.7 Chronic diseases account for 70% of all deaths, and about 75% of
health spending in the United States.1,8 Additionally, they are responsible for the widest health
disparity gap among racial/ethnic groups in the United States. While chronic diseases are
prevalent, costly, and potentially debilitating or fatal, they and/or their sequelae are, in part,
preventable.
5 Remington PL, Simoes E, Brownson RC, Siegel PZ. The role of epidemiology in chronic disease prevention and health
promotion programs. J Public Health Manag Pract. 2003; 9(4):258-265. 6 Principles of Epidemiology in Public Health Practice, 3rd Edition. Lesson 5: Public Health Surveillance. Self-Study Course
SS1978. Centers for Disease Control and Prevention Website. Available at: http://www.cdc.gov/osels/scientific_edu/SS1978/Lesson5/Section3.html Updated May 18, 2012. Accessed March 1,2014. 7 CSTE. Essential Functions of Chronic Disease Epidemiology in State Health Departments. 2004. 8 Chronic Disease Prevention and Health Promotion. Centers for Disease Control and Prevention Website. Available at: http://www.cdc.gov/chronicdisease/about/ Updated November 14, 2014 and http://www.cdc.gov/chronicdisease/overview/ Updated August 13, 2012 and http://www.cdc.gov/chronicdisease/resources/publications/aag/chronic.htm Updated December 17, 2009. Accessed March 1, 2014.
4
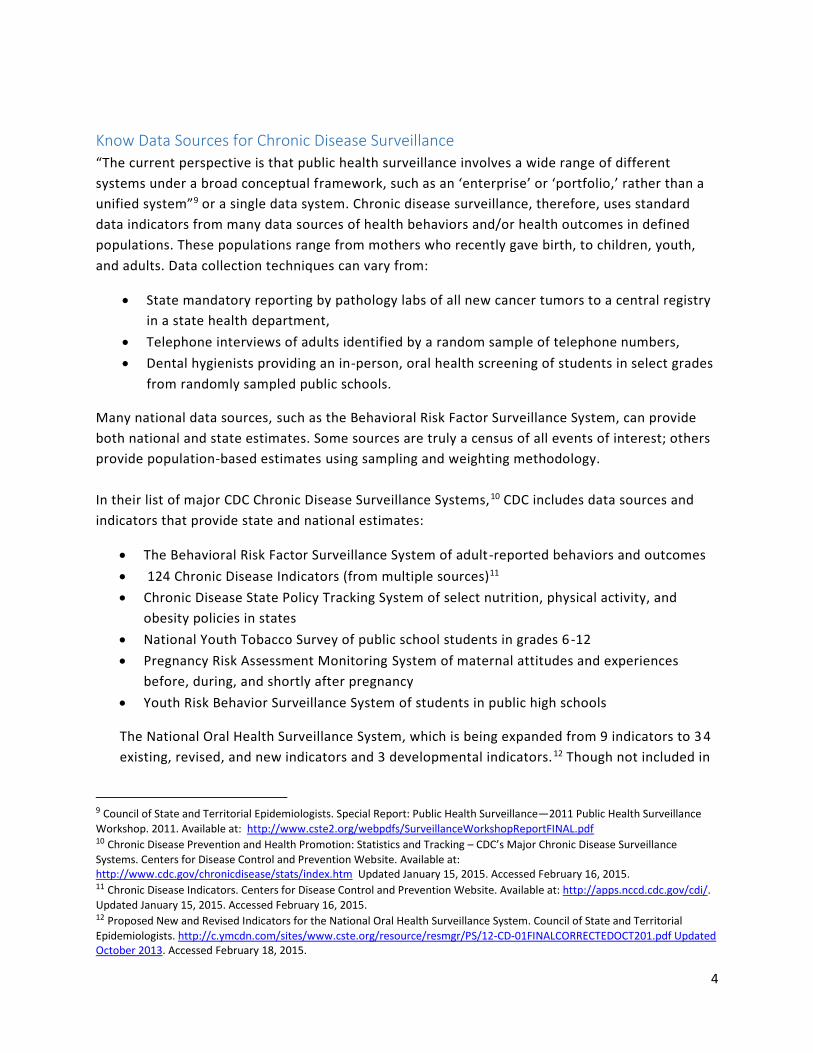
Know Data Sources for Chronic Disease Surveillance
“The current perspective is that public health surveillance involves a wide range of different
systems under a broad conceptual framework, such as an ‘enterprise’ or ‘portfolio,’ rather than a
unified system”9 or a single data system. Chronic disease surveillance, therefore, uses standard
data indicators from many data sources of health behaviors and/or health outcomes in defined
populations. These populations range from mothers who recently gave birth, to children, youth,
and adults. Data collection techniques can vary from:
State mandatory reporting by pathology labs of all new cancer tumors to a central registry
in a state health department,
Telephone interviews of adults identified by a random sample of telephone numbers,
Dental hygienists providing an in-person, oral health screening of students in select grades
from randomly sampled public schools.
Many national data sources, such as the Behavioral Risk Factor Surveillance System, can provide
both national and state estimates. Some sources are truly a census of all events of interest; others
provide population-based estimates using sampling and weighting methodology.
In their list of major CDC Chronic Disease Surveillance Systems,10 CDC includes data sources and
indicators that provide state and national estimates:
The Behavioral Risk Factor Surveillance System of adult-reported behaviors and outcomes
124 Chronic Disease Indicators (from multiple sources)11
Chronic Disease State Policy Tracking System of select nutrition, physical activity, and
obesity policies in states
National Youth Tobacco Survey of public school students in grades 6-12
Pregnancy Risk Assessment Monitoring System of maternal attitudes and experiences
before, during, and shortly after pregnancy
Youth Risk Behavior Surveillance System of students in public high schools
The National Oral Health Surveillance System, which is being expanded from 9 indicators to 3 4
existing, revised, and new indicators and 3 developmental indicators.12 Though not included in
9 Council of State and Territorial Epidemiologists. Special Report: Public Health Surveillance—2011 Public Health Surveillance
Workshop. 2011. Available at: http://www.cste2.org/webpdfs/SurveillanceWorkshopReportFINAL.pdf 10 Chronic Disease Prevention and Health Promotion: Statistics and Tracking – CDC’s Major Chronic Disease Surveillance
Systems. Centers for Disease Control and Prevention Website. Available at: http://www.cdc.gov/chronicdisease/stats/index.htm Updated January 15, 2015. Accessed February 16, 2015. 11 Chronic Disease Indicators. Centers for Disease Control and Prevention Website. Available at: http://apps.nccd.cdc.gov/cdi/.
Updated January 15, 2015. Accessed February 16, 2015. 12 Proposed New and Revised Indicators for the National Oral Health Surveillance System. Council of State and Territorial
Epidemiologists. http://c.ymcdn.com/sites/www.cste.org/resource/resmgr/PS/12-CD-01FINALCORRECTEDOCT201.pdf Updated October 2013. Accessed February 18, 2015.

5
the list of CDC’s major chronic disease surveillance systems referenced above, this surveillance
system is useful to chronic disease epidemiologists at the state and local level, as they pursue
collaboration and integration.
CDC provides disease and risk factor statistics from several sources in a variety of formats for the
following topics and more: cancer, diabetes, reproductive health, smoking, physical activity,
alcohol consumption, tobacco use, and water fluoridation.13
Given the variety and volume of data sources that can inform chronic disease prevention and
control, the following examples highlight data sources for risk factors and outcomes, disease
registries, and health care that states commonly use.
13 Chronic Disease Prevention and Health Promotion: Statistics and Tracking. Centers for Disease Control and Prevention
Website. Available at: http://www.cdc.gov/chronicdisease/stats/index.htm Updated January 15, 2015. Accessed February 16, 2015.

6
Table 7-2. Sources with Data on Risk Factors and Chronic Diseases across the Lifespan
Data Source Examples of Interest Population Overview
Birth Certificates
Mother’s weight pre-pregnancy and at delivery, diabetes, hypertension, tobacco use
Newborns with information about the mother and father
State and national vital records departments collect a census of live births using a standard form, including mother’s information. The standard birth certificate was revised in 2003, though states implemented it in different years. www.cdc.gov/nchs/births.htm or a state web site
National Survey of Children’s Health
Asthma, physical activity, obesity, medical home, parent’s health
Children ages 0 to 17 years old The federal Maternal and Child Health Bureau and CDC collaborate to collect national and state data on child well being, including physical and emotional health, social context of family, school, and neighborhood in 2003-04, 2007-08, and 2011-12. www.childhealthdata.org/ includes a survey of children with special health care needs. Some states have their own child health survey, such as a callback to eligible BRFSS respondents.
Youth Risk Behavior Surveillance System
Asthma, physical activity, obesity, alcohol use, tobacco use, dietary behaviors
Sample of students in grades 9-12 in public high schools
CDC and state, territorial, and tribal governments collect priority health risk behaviors every other year from 1991 to 2013. www.cdc.gov/HealthyYouth/yrbs/index.htm Some states and cities conduct a version for middle school. http://www.cdc.gov/healthyyouth/yrbs/participation_ms.htm http://www.cdc.gov/healthyyouth/yrbs/history-states_ms.htm
Youth Tobacco Survey and National Youth Tobacco Survey
Tobacco use, minors’ access to tobacco, secondhand smoke exposure, media exposure, quit attempts
Sample of students in grades 6-12 in public high schools
The Youth Tobacco Survey began with data collection in 2011. States can conduct the survey to learn about initiation of tobacco use, tobacco products used, media influences, and attempts to quit. The National Youth Tobacco Survey provides similar national data for 8 years during 1999-2012. www.cdc.gov/tobacco/data_statistics/surveys/index.htm
Behavioral Risk Factor Survey
Cholesterol, hypertension, chronic conditions, tobacco use, alcohol use, arthritis, physical activities, fruits and vegetables eaten
Adults 18 and older CDC and states collect health conditions, preventive practices, and risk behaviors via a telephone interview of adults identified by and sampled from telephone numbers, since 1984. Core questions are asked either every year or rotate every other year. The majority of the core questions are related to chronic disease epidemiology, and a few are related to general health. www.cdc.gov/brfss/
National Adult Tobacco Survey
Tobacco use, initiation, quit attempts, media exposure, secondhand smoke exposure
Adults 18 and older CDC via a contractor interviews a stratified sample of adults that provides state and national estimates, including tobacco-related disparities, related to CDC’s goals for tobacco prevention and control. www.cdc.gov/tobacco/data_statistics/surveys/nats/ For a comparison of tobacco surveys, see: www.cdc.gov/tobacco/data_statistics/surveys/pdfs/surveys-brochure.pdf
Pregnancy Risk Assessment Monitoring System
Pre-pregnancy weight, Body Mass Index, gestational diabetes, Breastfeeding, tobacco use
Women of reproductive age who gave birth recently
CDC and 40 states collect maternal attitude and experiences before, during, and shortly after pregnancy by sampling birth certificates. www.cdc.gov/prams/
Death Certificates
Mortality due to chronic diseases, tobacco
All ages State vital records units collect causes and factors (like tobacco) contributing to the death and use these data to estimate life expectancy of people with chronic diseases. www.cdc.gov/nchs/deaths.htm or a state web site

7
Table 7-3. Clinical Registries of Specific Chronic Diseases
Source Disease Overview
National Program of Cancer Registries
cancer CDC administers funding to state registries in 45 states that collect data on the cancer occurrence, type, extent, and location (body organ or system), the type of initial treatment, and outcome. These registry jurisdictions cover 96% of the U.S. population. www.cdc.gov/cancer/npcr/
Surveillance, Epidemiology and End Results (SEER) Program
cancer The National Cancer Institute collects and publishes cancer incidence and survival data from population-based cancer registries covering about 28% of the U.S. population. www.seer.cancer.gov/
Paul Coverdell National Acute Stroke Registry
stroke State registries collect data on adults ages 18 and older who have a clinical diagnosis of acute ischemic stroke, intracerebral hemorrhage, subarachnoid hemorrhage, or transient ischemic attack. The purpose is to improve quality of care and thereby reduce premature disability and death due to stroke. As of July 10, 2013, CDC funds 11 states: Arkansas, California, Georgia, Iowa, Massachusetts, Michigan, Minnesota, New York, North Carolina, Ohio, and Wisconsin. www.cdc.gov/DHDSP/programs/stroke_registry.htm
CDC and the National Cancer Institute provide cancer statistics at http://apps.nccd.cdc.gov/uscs/
and dynamic state profiles at http://statecancerprofiles.cancer.gov/ States have cancer registries
and also provide statistics. These cancer registries might participate in the programs described in
the table below of example clinical registries that provide data on specific chronic diseases.
Health Care Data Sources
An example of health care data is the administrative claims or billing data for health care or health
system records. This can be claims data submitted by hospitals or outpatient providers for
reimbursement for the health care services that they provide or it can be the other side of the
same business transaction. It can be claims data reimbursed by the payers of health care services:
private health plans or health insurance companies or the federal government (the Center for
Medicaid and Medicare Services). Claims or billing data include basic demographics, dates of
service, diagnoses, procedures, and possibly charges (the list price of a service), cost, or
reimbursed costs. The claims or billing data must provide information on the standard Uniform
Billing form, the 2004 version (“UB-04”) required by the Centers for Medicare and Medicaid
Services for reimbursement. Diagnoses are coded using the International Classification of Diseases,
Ninth Version, Clinical Modification (ICD-9-CM). No earlier than October 1, 2015, hospitals must
use the Tenth Version (ICD-10-CM) codes to report required diagnoses when they submit claims
for reimbursement by the federal government. ICD-10-CM is a completely different coding scheme
from the previous version. These administrative billing data exist in different collections or data

8
sets, at the national level. Several national sources do not provide state-specific results, because
they are based on a representative sample of all claims for a specific type or setting of care, such
as care provided in emergency departments. For example, the National Hospital Discharge Survey
was a national probability sample survey of discharges from nonfederal short -stay hospitals or
general hospitals in the United States. It is now combined with the National Hospital Ambulatory
Medical Care Survey to create the National Health Care Survey.14
Many states have electronic sources of hospital discharges, emergency department visits,
observation visits, and outpatient surgeries. The organization responsible for these data sources
can vary from state to state: a state government agency, a private hospital trade association in the
state, or a quasi-governmental agency. These data sets can be useful to describe health care
utilizations rates for specific chronic diseases. Another example of how to use these data sources is
to assess the need for improved chronic disease self-management, based on high rates of
emergency department visits for diabetes. Challenges using these data sets and data limitations
exist. Using these types of data sources takes some training. Some data sources have only charge
data, not cost data, and cost-to-charge ratios can be difficult to get. Some of these claims data
sources lack a single, unique person identifier, making it difficult to change the unit of analysis
from visits or admissions to persons. The primary diagnosis or main reason for treatment can be
difficult to determine. Residents living near state borders might receive treatment out of state. As
the lead chronic disease epidemiologist, you might want to know about co-morbidity indexes that
can be used with administrative data, such as the Charlson Comorbidity Index and the Elixhauser
Comorbidity Measure, to group the detailed ICD codes into meaningful clinical morbidities.
A state’s all-payer claims database (APCD) compiles claims data from private and public health
insurance payers to provide comprehensive data of costs and service use in a state. The APCD
Council website provides information about states’ implementation of an all -payer claims database
and related resources: http://www.apcdcouncil.org/
Through the Affordable Care Act, there are incentives to use electronic health records in health
care. In addition to being used to improve care of individual patients with chronic diseases through
automated reminders to physicians and supportive decision tools, electronic health records might
improve electronic reporting to state and local public health for notifiable conditions or reportable
conditions and/or reporting to state registries for cancer, stroke, or diabetes.15 The caution is that
both the field of public health and health care have limited IT workforce, outdated and/or
customized data systems without interoperability, and many demands on existing sta ff.
Wisconsin’s Division of Public Health has the capability to receive cancer reports through
14 National Health Care Survey. Centers for Disease Control and Prevention Website. Available at:
http://www.cdc.gov/nchs/nhcs.htm Updated January 14, 2015. Accessed on February 16, 2015. 15 Public Health Grand Rounds. Electronic Health Records: What’s In it for Everyone? Centers for Disease Control and
Prevention Website. Available at: http://www.cdc.gov/cdcgrandrounds/archives/2011/july2011.htm or
http://www.cdc.gov/cdcgrandrounds/pdf/grehrallfinal21jul2011.pdf. Updated January 15, 2015. Accessed February 16, 2015.

9
electronic health records.16 Local demonstration projects on meaningful use of electronic health
records provide promise. In Minnesota, they linked pediatric-prescribed asthma action plans to the
appropriate school nurse for students in their schools.17 The use of electronic health records for
public health is still an emerging opportunity and requires you as the lead chronic disease
epidemiologist to keep abreast of changes in this field. For example, look for the future results of
this planned study in New York City to use electronic health records in six outpatient clinics to
improve diabetes screening, follow-up and management.18
Table 7-4. Health Care Data Sources that Provide State Estimates
Source Examples of interest Brief Description
State hospital inpatient discharges
Counts and rates of admissions for specific chronic diseases
Administrative claims of information based on the national Uniform Billing form (UB-04)
State Emergency Department visits
Counts and rates of visits for acute complications of asthma or diabetes
Administrative claims of information based on the national Uniform Billing form (UB-04)
State Emergency Medical Services
Ambulance trip reports for stroke or heart attacks
This data source might match the national standards for emergency medical services
information system. See www.nemsis.org
Medicare, Medicaid, and State Children’s Health Insurance
Enrollment by demographics, number of providers by county, diagnosis of chronic conditions, use of clinical and dental services (e.g., mammography screening)
The federal Centers for Medicare and Medicaid Services has publicly available data on beneficiaries, claims, providers, and clinical care.
HEDIS performance measures on health plans
Blood pressure control, comprehensive diabetes care, beta-blocker treatment after a heart attack, breast cancer screening, weight/BMI assessment, immunization status
Healthcare Effectiveness Data and Information Set (HEDIS): The National Committee on Quality Assurance collects 76 performance measures on health plans through surveys, medical charts, and insurance payments for inpatient and outpatient services.
MEPS Dental and health insurance coverage, use of clinical and dental services and costs by demographics and source of payment
Medical Expenditure Panel Survey (MEPS) describes the cost and use of health care and health insurance coverage.
http://meps.ahrq.gov/mepsweb/
State data available when its sample is large.
HCUP Cost-to-charge ratios, Healthcare Cost and Utilization Project (HCUP) contains state and national data on inpatient
16 Public Health Meaningful Use. Wisconsin Department of Health Services Website. Available at: http://www.dhs.wisconsin.gov/eHealth/PHMU/index.htm. Updated February 10, 2015. Accessed April 11, 2015. 17 Care Beyond the Clinic: Public Health Lessons from Electronic Health Record Data. Robert Wood Johnson Foundation
Website. Available at: http://www.rwjf.org/en/blogs/new-public-health/2013/07/care_beyond_the_clin.html. Updated July 23, 2013. Accessed April 11, 2015. 18 Albu J, Sohler N, Matti-Orozco B, Sill J, Baxter D, Burke G, et al. Expansion of Electronic Health Record-Based Screening, Prevention, and Management of Diabetes in New York City. Prev Chronic Dis 2013;10:120-148.

10
downloadable file to translate ICD-9-CM codes into chronic vs. non-chronic conditions, downloadable software (2 SAS programs) that identify comorbidities using ICD-9-CM codes and the Elixhauser comorbidity scheme
stays, emergency department visits, and ambulatory surgery care.
http://www.hcup-us.ahrq.gov/reports/methods/methods.jsp.
AHRQ quality indicators of hospital care
Rates of admissions, complications, and mortality for select conditions, amputation among persons with diabetes, low birth weight
The Agency for Healthcare Research and Quality provides risk-adjusted indicators of the quality of hospital care.
http://qualityindicators.ahrq.gov/
Use Chronic Disease Indicators for Surveillance or Guidance
The Chronic Disease Indicators reflect the collaboration of CSTE, the National Association of
Chronic Disease Directors, and CDC’s National Center for Chronic Disease Prevention and Health
Promotion.19 They comprise a cross-cutting set of 124 measures developed by consensus and
based on importance to public health practice and data availability. States can use the Chronic
Disease Indicators to develop state- and local-level chronic disease surveillance systems, to plan
programs to target at risk populations, and to improve program evaluation. The indicators also
enable public health jurisdictions to uniformly define, collect, and report data on conditions and
their risk factors that fall into 18 topic groups: alcohol; arthritis; asthma; cancer; cardiovascular
disease; chronic kidney disease; chronic obstructive pulmonary disease; diabetes; immunization;
nutrition, physical activity, and weight status; oral health; tobacco; overarching conditions;
disability; mental health; older adults; reproductive health; and school health.
The data sources for the chronic disease indicators include: the Behavioral Risk Factor Surveillance
System (BRFSS), state cancer registries, the American Community Survey (ACS), birth and death
certificates data in the National Vital Statistics System (NVSS), the State Tobacco Activities Tracking
and Evaluation System, the United States Renal Data System, the Youth Risk Behavior Surveillance
System, the Pregnancy Risk Assessment Monitoring System, the Alcohol Epidemiologic Data
System, the Alcohol Policy Information System, alcohol policy legal research, the National Survey
of Children's Health, State Emergency Department Databases, State Inpatient Databases, the
Centers for Medicare and Medicaid Services Chronic Condition Warehouse and the Medicare
Current Beneficiary Survey, the U.S. Department of Agriculture, the CDC School Health Profiles,
Achieving a State of Healthy Weight, Maternal Practices in Infant Nutrition and Care, the
Breastfeeding Report Card, the Health Resources and Services Administration Uniform Data
System, the National Immunization Survey, and the Water Fluoridation Reporting System.
19 Chronic Disease Indicators. Centers for Disease Control and Prevention Website. Available at: http://www.cdc.gov/cdi/index.html Updated January 15, 2015. Accessed February 16, 2015.
11
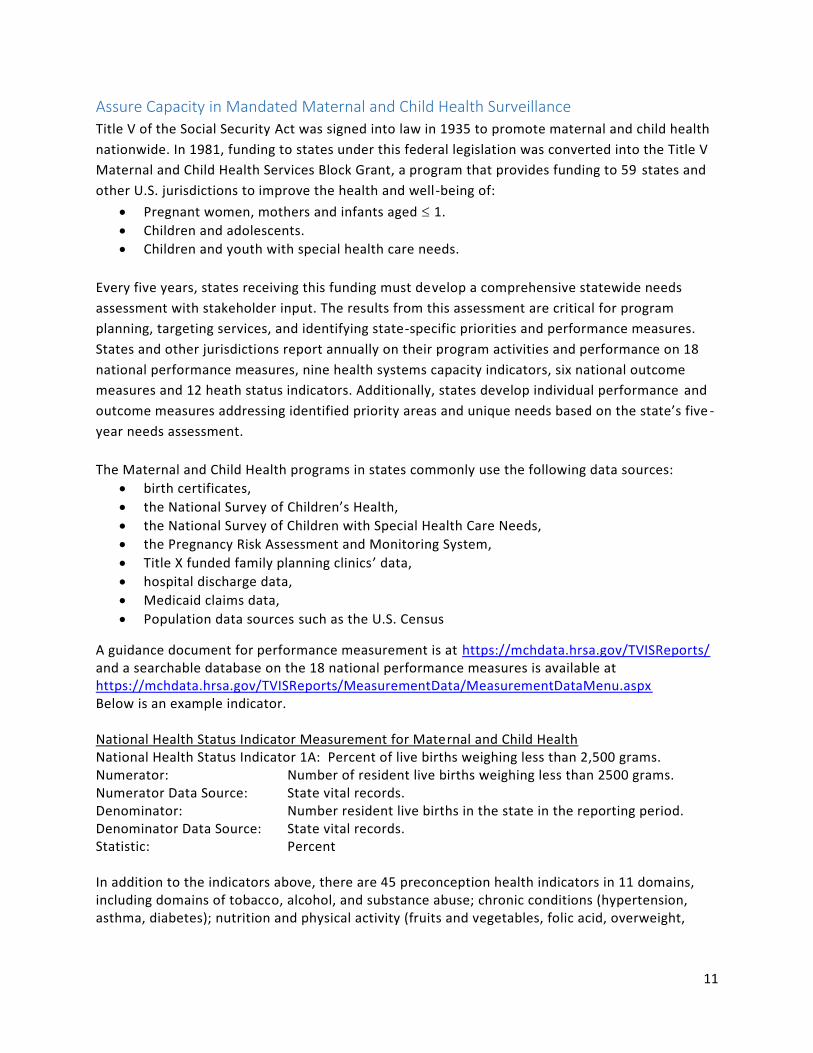
Assure Capacity in Mandated Maternal and Child Health Surveillance
Title V of the Social Security Act was signed into law in 1935 to promote maternal and child health
nationwide. In 1981, funding to states under this federal legislation was converted into the Title V
Maternal and Child Health Services Block Grant, a program that provides funding to 59 states and
other U.S. jurisdictions to improve the health and well-being of:
Pregnant women, mothers and infants aged 1.
Children and adolescents.
Children and youth with special health care needs.
Every five years, states receiving this funding must develop a comprehensive statewide needs
assessment with stakeholder input. The results from this assessment are critical for program
planning, targeting services, and identifying state-specific priorities and performance measures.
States and other jurisdictions report annually on their program activities and performance on 18
national performance measures, nine health systems capacity indicators, six national outcome
measures and 12 heath status indicators. Additionally, states develop individual performance and
outcome measures addressing identified priority areas and unique needs based on the state’s five -
year needs assessment.
The Maternal and Child Health programs in states commonly use the following data sources:
birth certificates,
the National Survey of Children’s Health,
the National Survey of Children with Special Health Care Needs,
the Pregnancy Risk Assessment and Monitoring System,
Title X funded family planning clinics’ data,
hospital discharge data,
Medicaid claims data,
Population data sources such as the U.S. Census
A guidance document for performance measurement is at https://mchdata.hrsa.gov/TVISReports/ and a searchable database on the 18 national performance measures is available at https://mchdata.hrsa.gov/TVISReports/MeasurementData/MeasurementDataMenu.aspx Below is an example indicator. National Health Status Indicator Measurement for Maternal and Child Health National Health Status Indicator 1A: Percent of live births weighing less than 2,500 grams. Numerator: Number of resident live births weighing less than 2500 grams. Numerator Data Source: State vital records. Denominator: Number resident live births in the state in the reporting period. Denominator Data Source: State vital records. Statistic: Percent In addition to the indicators above, there are 45 preconception health indicators in 11 domains, including domains of tobacco, alcohol, and substance abuse; chronic conditions (hypertension, asthma, diabetes); nutrition and physical activity (fruits and vegetables, folic acid, overweight,
12
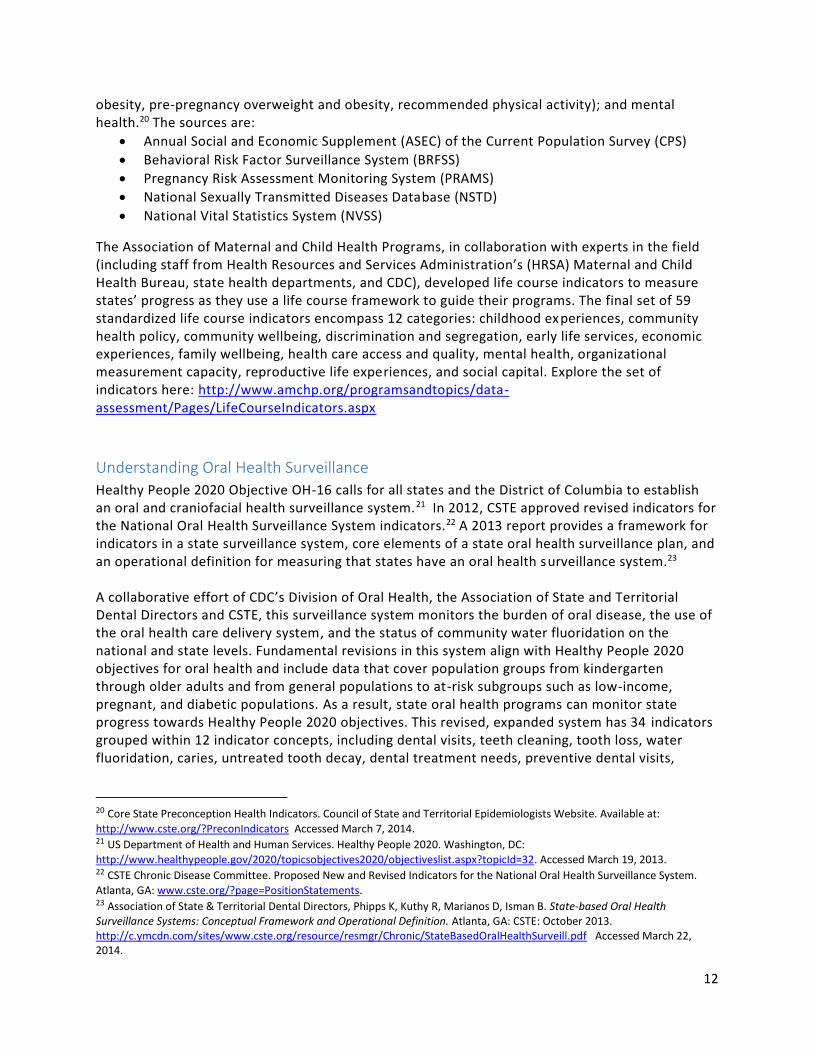
obesity, pre-pregnancy overweight and obesity, recommended physical activity); and mental health.20 The sources are:
Annual Social and Economic Supplement (ASEC) of the Current Population Survey (CPS)
Behavioral Risk Factor Surveillance System (BRFSS)
Pregnancy Risk Assessment Monitoring System (PRAMS)
National Sexually Transmitted Diseases Database (NSTD)
National Vital Statistics System (NVSS)
The Association of Maternal and Child Health Programs, in collaboration with experts in the field (including staff from Health Resources and Services Administration’s (HRSA) Maternal and Child Health Bureau, state health departments, and CDC), developed life course indicators to measure states’ progress as they use a life course framework to guide their programs. The final set of 59 standardized life course indicators encompass 12 categories: childhood experiences, community health policy, community wellbeing, discrimination and segregation, early life services, economic experiences, family wellbeing, health care access and quality, mental health, organizational measurement capacity, reproductive life experiences, and social capital. Explore the set of indicators here: http://www.amchp.org/programsandtopics/data-assessment/Pages/LifeCourseIndicators.aspx
Understanding Oral Health Surveillance
Healthy People 2020 Objective OH-16 calls for all states and the District of Columbia to establish an oral and craniofacial health surveillance system.21 In 2012, CSTE approved revised indicators for the National Oral Health Surveillance System indicators.22 A 2013 report provides a framework for indicators in a state surveillance system, core elements of a state oral health surveillance plan, and an operational definition for measuring that states have an oral health surveillance system.23 A collaborative effort of CDC’s Division of Oral Health, the Association of State and Territorial Dental Directors and CSTE, this surveillance system monitors the burden of oral disease, the use of the oral health care delivery system, and the status of community water fluoridation on the national and state levels. Fundamental revisions in this system align with Healthy People 2020 objectives for oral health and include data that cover population groups from kindergarten through older adults and from general populations to at-risk subgroups such as low-income, pregnant, and diabetic populations. As a result, state oral health programs can monitor state progress towards Healthy People 2020 objectives. This revised, expanded system has 34 indicators grouped within 12 indicator concepts, including dental visits, teeth cleaning, tooth loss, water fluoridation, caries, untreated tooth decay, dental treatment needs, preventive dental visits,
20 Core State Preconception Health Indicators. Council of State and Territorial Epidemiologists Website. Available at:
http://www.cste.org/?PreconIndicators Accessed March 7, 2014. 21 US Department of Health and Human Services. Healthy People 2020. Washington, DC:
http://www.healthypeople.gov/2020/topicsobjectives2020/objectiveslist.aspx?topicId=32. Accessed March 19, 2013. 22 CSTE Chronic Disease Committee. Proposed New and Revised Indicators for the National Oral Health Surveillance System.
Atlanta, GA: www.cste.org/?page=PositionStatements. 23 Association of State & Territorial Dental Directors, Phipps K, Kuthy R, Marianos D, Isman B. State-based Oral Health Surveillance Systems: Conceptual Framework and Operational Definition. Atlanta, GA: CSTE: October 2013. http://c.ymcdn.com/sites/www.cste.org/resource/resmgr/Chronic/StateBasedOralHealthSurveill.pdf Accessed March 22, 2014.

13
dental sealants, dental treatment visits, school-based health center dental services and oral and pharyngeal cancer.
Oral Health Basic Screening Survey
The Basic Screening Survey is a standardized set of surveys on observed oral health of participants.
The Association of State and Territorial Dental Directors with technical assistance from CDC
developed these surveys. They collect self-report or observed information on age, gender, race
and Hispanic ethnicity, and self-report information on access to care for preschool, school-age, and
adult populations. The most common administration of this survey in states is among 3 rd grade
students. The surveys are cross-sectional and descriptive. In the observed oral health survey,
dentists and dental hygienists, (or other appropriate health care workers in accordance with state
law) record gross dental or oral lesions. The examiner records presence of untreated cavities and
urgency of need for treatment for all age groups; caries experience (treated and untreated decay)
for preschool and school-age children; the presence of sealants on permanent molars for school-
age children; and edentulism (no natural teeth) for adults.
States might use one or more of the surveys to obtain oral health status and dental care access
data for monitoring Healthy People 2010 objectives. The surveys come with training materials. The
Association of State and Territorial Dental Directors provides technical assistance on sampling and
analysis using the standard protocol. Some states collect height and weight as part of this observed
survey.
Source: CDC Oral Health Resources website, www.cdc.gov/nohss/DSMain.htm
The data sources for the National Oral Health Surveillance Indicators are:
Basic Screening Survey
Behavioral Risk Factor Surveillance System
Centers for Medicare and Medicaid Services
National Assembly on School-Based Health Care
National Survey of Children’s Health
Pregnancy Risk Assessment Monitoring System
Surveillance, Epidemiology and End Results and National Program of Cancer Registries
Water Fluoridation Reporting System
The full list of indicators and their sources is at www.cdc.gov/nohss/ Below is an example indicator. Example Indicator Measurement Indicator 1A: Percentage of adults 18 years and older with a dental visit in the past year. Numerator: Number adults ≥ 18 years reporting they had a dental visit in the past year. Data Source: BRFSS Denominator: Number adults ≥ 18 years responding to this question on the BRFSS. Data Source: BRFSS Statistic: Percent

14
Using the Healthy People Objectives as Targets
The Healthy People Objectives for 2020 provides a warehouse of national baseline data on the
objectives from a variety of sources.24 Healthy People 2020 provides standard data definitions and
conceptual information about the indicators or objectives. Including national objectives with state
chronic disease data can elevate the importance of a chronic disease problem and give a national
comparison for state results. The Healthy People 2020 goals or targets can become the state goal,
depending upon the state baseline results.
Find Additional Indicators and Interventions at the Health Indicators Warehouse
At the Health Indicators Warehouse, the National Center for Health Statistics provides public
access to community health indicators from initiatives, such as the Healthy People 2020, county
health rankings, and community indicators from the Centers for Medicare and Medicaid Services. 25
The purpose is to improve understanding of a community’s health status and determinants and
links indicators with evidence-based interventions. Search by topic, by geography, and/or by
initiative. Topics include chronic diseases, maternal and infant health, oral health, health
behaviors, and health outcome. For example, if you wanted to know about stroke mortality in your
state and initiatives to prevent it or if you wanted to know the percent of Medicare beneficiaries
with arthritis in a selected state, this warehouse is helpful. The content and purpose of this
warehouse reflect its partners.
Centers for Medicare & Medicaid Services Department of Health and Human Services:
o Office of the Deputy Secretary o Office of Adolescent Health o Office of Disease Prevention and Health Promotion o Office of Minority Health o Office of the Assistant Secretary for Planning and Evaluation
Health Resources and Services Administration
24 HealthyPeople.gov. U.S. Department of Health and Human Services Website. Available at:
http://www.healthypeople.gov/2020/default.aspx Updated August 28, 2013. Accessed March 7, 2014. 25 Health Indicators Warehouse developed by the National Center for Health Statistics. Version 1.11. U.S. Department of Health
and Humans Services Website. Available at: http://www.healthindicators.gov/ Updated February 15, 2014. Accessed March 7, 2014.
15
Summary
Understanding the history, purpose, and indicators used for surveillance of chronic diseases, maternal and child health, and oral health builds your capacity as a lead chronic disease epidemiologist in assessment and analysis and can fuel your systems thinking. Cross -training and collaboration on using multiple data systems can expand capacity without adding s taff.26
Surveillance: In general, you as the lead chronic disease epidemiologist need to become an expert in interpreting results from Behavioral Risk Factor Surveillance System and any chronic disease-specific data system in your state, such as a cancer registry. To further integration efforts in your state, add a working knowledge of relevant health care data, the basic screening survey for oral health, and the Pregnancy Risk Assessment and Monitoring System. Learn about successes in using data to drive action from other states, the data coordinators in your state, and through CDC and CSTE websites. Use these data sources to identify tested questions that might be appropriate to add to the Behavioral Risk Factor Surveillance System in your state.
Communication: Use multiple data systems to communicate a more comprehensive picture of chronic disease issues across the life span and to highlight specific opportunities to prevent and control chronic diseases. Disseminate relevant chronic disease indicators to colleagues addressing oral health and maternal and child health. The relevancy might simply be the same target age group, such as obesity prevalence in school -age children.
Consultation: Meet the state coordinators of the Behavioral Risk Factor Surveillanc e System, the oral health surveillance system, and the maternal and child health measures. Ask them to read this chapter and discuss their work with you. Remember that they might not be located in your part of the department or anywhere in your department. Consult with them to learn and to expand the use of their data systems, which helps them justify the continued investment in their data system. Share ideas with them about potential ways to enhance the system and creatively maintain funding. Identify together ways to leverage resources and cross promote data results.
26 Duffy RE, Siegel PZ. Increasing chronic disease epidemiology capacity without increasing workforce: a success story in Ohio. J Public Health Manag Pract. 2009; 15(2): 123-6.