Embed Size (px)
Citation preview

1
Prof. Yechiam Yemini (YY)
Computer Science DepartmentColumbia University
Chapter 7: Regulatory Networks
7.2 Analyzing Regulation
2
The Challenge How do we discover regulatory mechanisms? Complexity: hundreds of cooperating factors Cis-regulation can extend over long stretches Trans-regulation involves long-distance interactions Many-to-many relationship between TF and genes

2
3
OverviewGenomic techniquesSequence analysis: finding regulatory motifs
Based in part on slides of: S. Batzoglou, Kellis/Indyk, Benos…
4
Genomic Techniques

3
5
Perturbation Techniques
Mutagenesis: modify DNA and monitor resultsMonod & Jacob: the lac operon
lacO lacAlacYlacZ
repressor Operator
Lactose activatesrepressor
lacI
Lactose
n y
OFF
n y
OFF ON
Glucose
Mutant
6
Perturbations
Perturb DNA: regulatory gene, promoter region…
Perturb RNA expression: RNAi…
Key challenge: high-thruput techniques

4
7
Chromatin Immunoprecipitation (CHIP)
Key idea: take in-vivo snapshots of TF-DNA binding
Crosslink TF with chromatin (formaldehyde)
Break DNA (sonication)
Select TF with antibody
Unlink;Recover DNA;Amplify (PCR);
Label
Hybridize withmicroarray
Filter
8
CHIP-on-Chip Example
http://www.nature.com/jid/journal/v125/n2/extref/5603467x1.jpg
Learning More from Microarrays: Insights from Modules and NetworksDavid J Wong and Howard Y Chang

5
9
Notes
CHIP-on-Chip technologyKey value: high-thruput in-vivo measurementsKey limiting factor: library of antibodiesProject ENCODE
Biological techniques are complex and costly
Can in-silico techniques help?
10
Regulatory motifs

6
11
Transcription Factors (TF) Bind To DNATF active site binds with DNA Several binding mechanisms exist
Helix-Turn-Helix Leucine zipper Zinc finger
How do TFs know where to bind? Find sequence motifs (signals) GCN4 Leucine zipper
…TCTTgaAT…
12
DNA Motifs Signal Binding Sites
Crp DNA binding
TF recognize motifs

7
13
The Process
G. Thijs Tutorial: www.estat.kuleuven.ac.be/~dna/Bioll
Measure temporalexpression of genes
Extract co-expressed genes Find upstream sequences
Discover motifs
14
Discovering Motifs
Why is it difficult to discover motifs?Short sequences; noisy; can be located far away from gene

8
15
Characterizing Motifs Using Consensus (If the motifs locations are known, then…)A consensus may be computed using MSA
E.g., TATA boxBut the motif locations are not known
Suppose one looks for motifs of length kNeed to search all positions of all sequences Limited by complexity
T A GT A TT A AT A TT A AT A TT A TA A TT A AT A TT A AT A TT A TT A TG A AT A TG A AT C TT A GC A T0 10 61 9 00 0 1 1 02 0 10 0 08 0 28 0 10
ACGT
0
T A AT A TConsensus
Segments at -10
16
Example: Generic Bacterial Motifs

9
17
From Consensus To Probability Profiles Consensus sequences do not provide the full story Probability of nucleotides is more telling Binding motifs may be represented by probability matrices
(aka weight/frequency matrix)
1 2 3 4 5 6
A 0 1 0.1 0.6 0.9 0
C 0 0 0.1 0 0.1 0
G 0.2 0 0 0.1 0 0
T 0.8 0 0.8 0.2 0 1
1 2 3 4 5 6
A 0 0 0 0.6 0 0.4
C 0 0 0 0.1 0.8 0.1
G 0 0 0.9 0 0.2 0.1
T 1 1 0.1 0.3 0 0.4
Position Weight Matrix (PWM)
18
From Probability To Log-odds Scoring
1 2 3 4 5 6
A 0 1 0.1 0.6 0.9 0
C 0 0 0.1 0 0.1 0
G 0.2 0 0 0.1 0 0
T 0.8 0 0.8 0.2 0 1
Log-odds
PWM
Position SpecificScoring Matrix
(PSSM)pα= probability of nucleotide αbα= background probability of α
A -3.32 2.04 -1 1.32 1.89 -3.32
C -3.32 -3.32 -1 -3.32 -1 -3.32
G -0.15 -3.32 -3.32 -1 -3.32 -3.32
T 1.72 -3.32 1.72 -0.15 -3.32 2.04
Score=log(pα/bα)
The background probability may be computedfrom the sequences. In here we use bα=0.25 forall nucleotides α.

10
19
Logo Profiles Represent Motif Signal
1 2 3 4 5 6
A 0 1 0.1 0.6 0.9 0
C 0 0 0.1 0 0.1 0
G 0.2 0 0 0.1 0 0
T 0.8 0 0.8 0.2 0 1
1 2 3 4 5 6
A 0.0 1.9 0.1 0.4 1.3 0.0
C 0.0 0.0 0.1 0.0 0.2 0.0
G 0.3 0.0 0.0 0.1 0.0 0.0
T 1.0 0.0 0.9 0.1 0.0 1.9
1 Bit
2 BitsLogo
D(p||b)=Σαε{A,C,T,G}pαlog(pα/bα)
The expected log-odds score of a position(column) corresponds to its relative entropy,aka Kullback-Liebler divergence:
pα*D(p||b)
PWM
PSSMA -3.32 2.04 -1 1.32 1.89 -3.32
C -3.32 -3.32 -1 -3.32 -1 -3.32
G -0.15 -3.32 -3.32 -1 -3.32 -3.32
T 1.72 -3.32 1.72 -0.15 -3.32 2.04
Contribution of a given nucleotide to the signal
D(p||b) measures the informationsignal of a position.
20
PSSM Profile May Be Aligned With SequenceTo Detect Signal (Motif)
Score=1.72+2.04 -1-1+1.89+2.04=5.69
A -3.32 2.04 -1 1.32 1.89 -3.32
C -3.32 -3.32 -1 -3.32 -1 -3.32
G -0.15 -3.32 -3.32 -1 -3.32 -3.32
T 1.72 -3.32 1.72 -0.15 -3.32 2.04
T A GA A T
C A T G AC G T A A AG T A C A AA T C-1-10-20
C A T G ACA T G AC G
T G AC G T
T A A AG T……..
Score=5.69
A -3.32 2.04 -1 1.32 1.89 -3.32
C -3.32 -3.32 -1 -3.32 -1 -3.32
G -0.15 -3.32 -3.32 -1 -3.32 -3.32
T 1.72 -3.32 1.72 -0.15 -3.32 2.04
C A GT C AScore=-3.32+2.04+1.72-1-1-3.32=-4.88
Score=-4.88Score=-17.6
Score=-2.56
5.69
-17.6-12.11
C A T G AC G T A A AG T A C A AA T C
-7.6-9.92
-12.39
2.65

11
21
The Motif Finding ProblemMotif finding algorithm:
Input: a set of sequences X1,…Xn ; a motif length kOutput: PSSM motif M of length k, and its positions in the sequences1: actcgtcggggcgtacgtacgtaacgtacgtaCGGACAACTGTTGACCG2: cggagcactgttgagcgacaagtaCGGAGCACTGTTGAGCGgtacgtac3: ccccgtaggCGGCGCACTCTCGCCCGggcgtacgtacgtaacgtacgta4: agggcgcgtacgctaccgtcgacgtcgCGCGCCGCACTGCTCCGacgct
If we knew the positions the problem would be easy Align the sequences and extract PSSM
If we knew the PSSM, the problem would be easy Align the PSSM with the sequences to find positions
The problem is that both the motif PSSM and positions are unknown
22
Finding PSSM MotifsBrute force search:
Consider all k-mers; compute PSSM M for each subset of k-mers Find M which maximizes the expected relative entropy D(M||b)=Σposition-iD(mi||b)
Impractical complexity
Recast the problem: Estimate the parameters M (PSSM), p (positions) and b (background probability)
that best explain the sample sequence S. Maximize the log likelihood L(M,p,b|S)
Strategy: iterate the following two steps Estimate p from (M,b) and S (M,b) p Estimate (M,b) from p and S p (M,b)
This yields a family of solutions, depending on the estimation technique Gibbs sampling, EM….

12
23
Gibbs Sampling
Detecting subtle sequence signals: a Gibbs sampling strategy for multiple alignmentCE Lawrence, SF Altschul, MS Boguski, JS Liu, AF Neuwald, and JC Wootton
Science, October 1993; vol 262, 5131, pp 208-214
24
Basic Algorithm
1. Initialization:a. Compute background noise probabilities b from Sb. Select random locations in sequences S={x1, …, xN } (p)
2. Sampling:a. Remove one sequence xi from S to get S’b. Compute PWM M’ for S’c. Sample a location p’i in xi from a probability A(M’,b)
(This is the key step!! see following slides)d. Stop if no improvements in log likelihood

13
25
Initialization
Select random locations a1,…, aN in x1, …, xN
sequence 1
sequence 2
sequence 3
sequence 4
sequence 5
ACAGTGTTTAGACCGTGACCAACCCAGGCAGGTTT
26
Iteration: Remove A Sequence (2a,b)
Select a sequence x = xi
Remove xi and compute PWM
sequence 1
sequence 2
sequence 3
sequence 4
sequence 5
.5.25.5.0.0.5.25
.0.25.0.75.5.0.25
.25.5.25.0.0.25.25
.25.0.25.25.5.25.25
ACAGTGTTTAGACCGTGACCA*******CAGGTTT
ACGT

14
27
Sampling Step (2c)
ACGT .5.25.5.0.0.5.25
.0.25.0.75.5.0.25
.25.5.25.0.0.25.25
.25.0.25.25.5.25.25
Starting position jsequence 4
Key idea: sample position that maximizes likelihoodCompute sampling probability Aj from (M’,b)
For every k-mer xj,…,xj+k-1 in sequence 4:Qj = Prob[ k-mer | M’ ] = M’(1,xj)×…×M’(k,xj+k-1)Pi = Prob[ k-mer | b ]= b(xj)×…×b(xj+k-1)
Let
!+"
=
=1||
1
/
/kx
j
jj
jj
j
PQ
PQA =Probability of motif at location j
Aj
.25
.25
.25
.25M’ b
28
NotesKey idea: exploit randomness in searching for Motif positions Why?
E.g., instead of sampling positions, why not select the best position? If one selects best position this becomes gradient search (max score) Very complex search space; may converge to a local optimum The idea of sampling permits the search to avoid local optimum This goes back to Metropolis Algorithm and Simulated Annealing
Starting position jsequence 4
Aj
Initialparameters
Local max
Gradient search

15
29
Advantages / Disadvantages Implemented in various systems: AlignAce, Bioprospector…
Advantages: Easy to implement Less sensitive to initial parameters Admits flexible enhancements with heuristics
Disadvantages: All sequences must exhibit the motif
30
Improving The Background Model Repeat DNA may be confused as motif
Especially low-complexity CACACA… AAAAA, etc.
Solution:Use more elaborate background model
0th order: B = { pA, pC, pG, pT }1st order: B = { P(A|A), P(A|C), …, P(T|T) }…Kth order: B = { P(X | b1…bK); X, bi∈{A,C,G,T} }
Has been applied to EM and Gibbs (up to 3rd order)

16
31
AligAce
Tavazoie et al., Nature Genetics 22, 281 – 285 (1999)
32
Strategy
Measure microarray expressionIdentify co-expressed genesSearch sequences for motifs using Gibbs Sampler

17
33
Correlation of Expression Profiles
0 5 10 15-2
-1
0
1
2
3
4
Time
expr
essi
on le
vel
34
AlignAce
Time-point 1
Tim
e-po
int 3
Tim
e-po
int 2
-1.8
-1.3
-0.8
-0.3
0.2
0.7
1.2
1 2 3
-2
-1.5
-1
-0.5
0
0.5
1
1.5
1 2 3
-1.5
-1
-0.5
0
0.5
1
1.5
1 2 3
Time -pointTime -point
Time -point
Nor
mal
ized
Expr
essio
n
Nor
mal
ized
Expr
essio
nN
orm
aliz
edEx
pres
sion
Tavazoie et al., Nature Genetics 22, 281 – 285 (1999)

18
35
5’- TCTCTCTCCACGGCTAATTAGGTGATCATGAAAAAATGAAAAATTCATGAGAAAAGAGTCAGACATCGAAACATACAT
5’- ATGGCAGAATCACTTTAAAACGTGGCCCCACCCGCTGCACCCTGTGCATTTTGTACGTTACTGCGAAATGACTCAACG
5’- CACATCCAACGAATCACCTCACCGTTATCGTGACTCACTTTCTTTCGCATCGCCGAAGTGCCATAAAAAATATTTTTT
5’- TGCGAACAAAAGAGTCATTACAACGAGGAAATAGAAGAAAATGAAAAATTTTCGACAAAATGTATAGTCATTTCTATC
5’- ACAAAGGTACCTTCCTGGCCAATCTCACAGATTTAATATAGTAAATTGTCATGCATATGACTCATCCCGAACATGAAA
5’- ATTGATTGACTCATTTTCCTCTGACTACTACCAGTTCAAAATGTTAGAGAAAAATAGAAAAGCAGAAAAAATAAATAA
5’- GGCGCCACAGTCCGCGTTTGGTTATCCGGCTGACTCATTCTGACTCTTTTTTGGAAAGTGTGGCATGTGCTTCACACA
…HIS7
…ARO4
…ILV6
…THR4
…ARO1
…HOM2
…PRO3
300-600 bp of upstream sequence per gene are searchedin Saccharomyces cerevisiae.
Search for Motifs in Promoter Regions
The problem: finding motifs Use Gibbs sampling
Source: G.M. Church
36
AAAAGAGTCA
AAATGACTCA
AAGTGAGTCA
AAAAGAGTCAGGATGAGTCA
AAATGAGTCA
GAATGAGTCA
AAAAGAGTCA
**********
5’- TCTCTCTCCACGGCTAATTAGGTGATCATGAAAAAATGAAAAATTCATGAGAAAAGAGTCAGACATCGAAACATACAT
5’- ATGGCAGAATCACTTTAAAACGTGGCCCCACCCGCTGCACCCTGTGCATTTTGTACGTTACTGCGAAATGACTCAACG
5’- CACATCCAACGAATCACCTCACCGTTATCGTGACTCACTTTCTTTCGCATCGCCGAAGTGCCATAAAAAATATTTTTT
5’- TGCGAACAAAAGAGTCATTACAACGAGGAAATAGAAGAAAATGAAAAATTTTCGACAAAATGTATAGTCATTTCTATC
5’- ACAAAGGTACCTTCCTGGCCAATCTCACAGATTTAATATAGTAAATTGTCATGCATATGACTCATCCCGAACATGAAA
5’- ATTGATTGACTCATTTTCCTCTGACTACTACCAGTTCAAAATGTTAGAGAAAAATAGAAAAGCAGAAAAAATAAATAA
5’- GGCGCCACAGTCCGCGTTTGGTTATCCGGCTGACTCATTCTGACTCTTTTTTGGAAAGTGTGGCATGTGCTTCACACA
…HIS7
…ARO4
…ILV6
…THR4
…ARO1
…HOM2
…PRO3
Motif Found by AlignACE
19
37
Yeast Motifs: Periodic ClustersTavazoie et al., Nature Genetics 22, 281 – 285 (1999)
38
Motifs in Non-periodic Clusters

20
39
Expectation Maximization
MEME: Baily & Elkan 1995
40
Back To Fundamentals The problem:
Estimate M (PSSM/PWM), p (positions) and b (background probability)
That maximize the log likelihood L(M,p,b|S)
Strategy: iterate the following two steps:
Expectation: Estimate (M,b) from p and S p (M,b) Given positions p, consider k-mers in these positions of S Compute PWM for these k-mers and background probabilities b
(by counting frequencies)
Maximization: Estimate p from (M,b) and S (M,b) p Given (M,b), consider a sequence Xi in S Find position pi in Xi which would maximize the score D(M||b) of respective k-mer
Stop when parameters stop changing
21
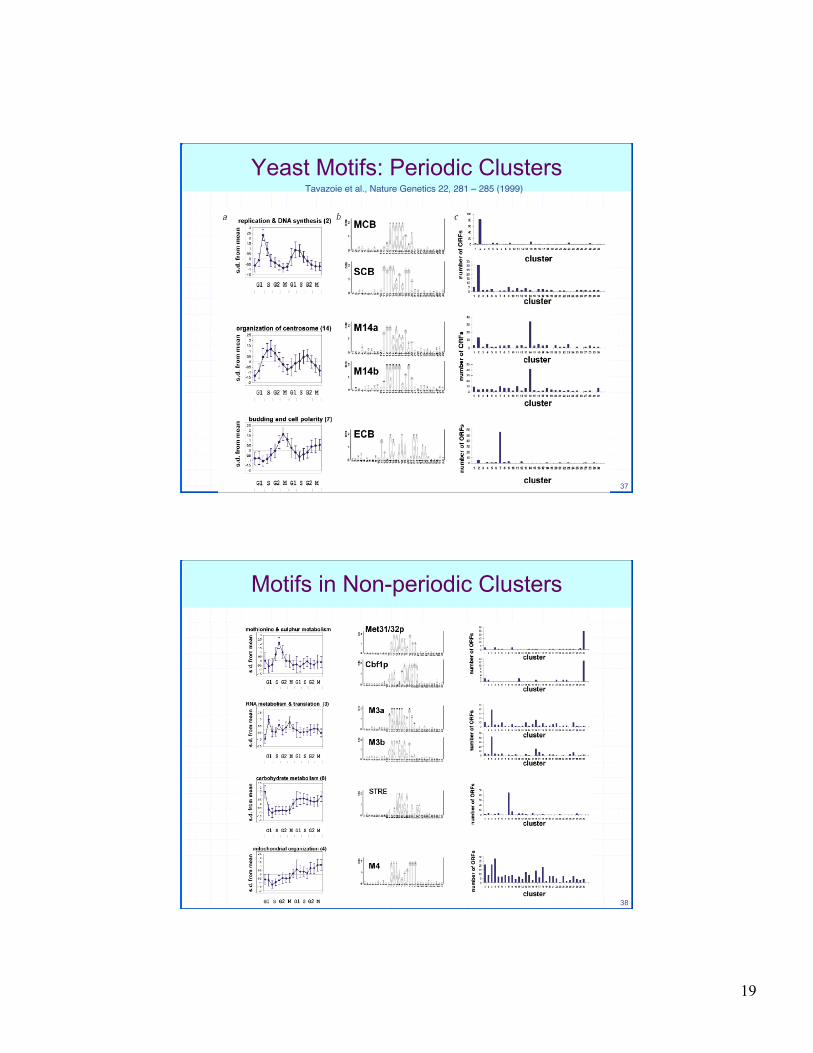
41
Expectation StepEstimate M from the positions p
Estimate PWM: Estimate b: Compute PSSM .7500.75T
001.25G.25000C0100A
PWM
.35
.17
.31
.17b
Frequency of T in column 4
Frequency of T
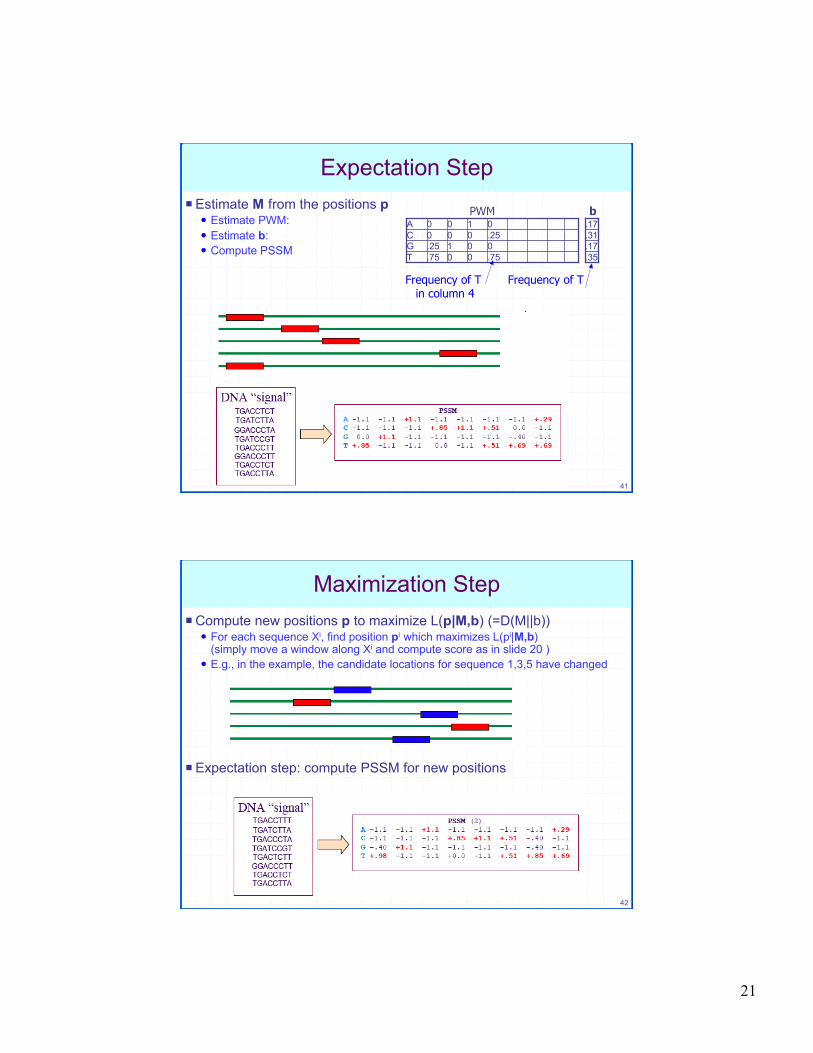
42
Maximization StepCompute new positions p to maximize L(p|M,b) (=D(M||b))
For each sequence Xi, find position pi which maximizes L(pi|M,b)(simply move a window along Xi and compute score as in slide 20 )
E.g., in the example, the candidate locations for sequence 1,3,5 have changed
Expectation step: compute PSSM for new positions

22
43
Example: Discovering Motif With MEME MEME an EM based motif finder Below is a sample output
44
Notes EM is essentially a gradient optimization search
May settle on a local maximumResult may depend on initial conditions
Artificial example: X1, …, Xn; (n = 200) k=6;suppose initial selection of k-mers 99 words “AAAAAA” 99 words “CCCCCC” 2 words “ACACAC”
.51.49.51.49.51.49C
.49.51.49.51.49.51A
Which motif will be discovered?
ChallengesHandling 0, or 2+ binding sitesGapped binding sites

23
45
Conclusions Motif finders can help discover binding sites
Provide powerful analysis of microarray data Use microarray to determine co-expressed genes Apply motif finders to upstream sequences Discover regulation structure
(but what if co-expressed genes are not co-regulated)
Open research questions