Embed Size (px)
Citation preview

177
Chapter 7: Attempts to develop a FRET assay for the GPCR-G protein interaction
7.1 Abstract
The interaction between GPCRs and their cognate G proteins is the critical
junction between sensing a stimulus from the extracellular environment and intracellular
signaling. The atomic-level details of this interaction and the mechanism by which an
active GPCR induces G protein activation are poorly understood. An assay was devised
to probe this interaction by unnatural amino acid mutagenesis, which would allow
detailed chemical-scale insights into the processes. The proposed assay is based on GTP-
induced dissociation of a stable GPCR-G protein complex on isolated plasma membranes.
A fluorescence readout was chosen drawing on precedent for detecting receptor-G
protein interactions by FRET between fluorescent protein fusions. Fluorescent protein
fusions were constructed of the β2 adrenergic receptor, D2 dopamine receptor, and a
variety of G protein subunits. When expressed in Xenopus laevis oocytes and assayed at
the plasma membrane by fluorescence lifetime imaging microscopy (FLIM), no
interaction between receptors and G proteins was detected, and the assay was not pursued
further.
7.2 Introduction
While our knowledge of atomic-scale details of ligand binding to GPCRs is
rapidly expanding, a similar understanding of the interaction between the receptor and the
G protein lags far behind. The association of the active receptor with the G protein is the

178
key event relaying agonist binding to induction of a cellular response. The active
receptor effectively catalyzes G protein activation – that is, the exchange of GDP for
GTP that induces dissociation of Gα from Gβγ (Figure 7.1).
Figure 7.1. Cycle of G protein (αβγ) activation by an activated GPCR (R*)
In a landmark achievement, Kobilka and coworkers in 2011 obtained a crystal
structure for the intermediate in this process: the complex of a nucleotide-free G protein
(Gs) in complex with an active, agonist-bound GPCR (the β2 adrenergic receptor, β2AR)
(Figure 7.2).1 This structure should provide a starting point for well-informed structure-
function studies of the receptor-G protein interface.
Figure 7.2. Crystal structure of the β2 adrenergic receptor (green) in complex with Gαs (blue), Gβ1 (yellow), and Gγ2 (orange)

179
Many intriguing questions remain with regard to G protein-receptor coupling.2
Most fundamentally, it is largely unknown which residues mediate functionally important
interactions across the protein-protein interface. Second, the determinants of receptor
specificity for a particular G protein are not well defined. A fascinating additional layer
to this problem exists for receptors able to activate more than one type of G protein. In a
principle known as signaling bias, different ligands can preferentially activate one
signaling partner (G protein, arrestin, kinase, etc.) over another.3 Unnatural amino acid
mutagenesis of the receptor-G protein interface would be a powerful tool to tackle these
issues at a chemical scale, but an assay is not readily available to probe this interaction.
Assay considerations and proposed design
An ideal assay would isolate G protein activation from the larger signaling
cascade of ligand binding, receptor activation, and G protein activation of cellular targets.
An attractive in vitro system has been described involving a GPCR (the β2AR) and its
cognate G protein (Gs) reconstituted into a nanodisc4 (a small protein-ringed patch of
lipid bilayer).5 The receptor and G protein form a stable complex when all GDP and
GTP is removed from the system by treatment with apyrase, a nonspecific nucleotide
phosphatase.6 This complex (Figure 7.1, boxed species) essentially represents the
“transition state” for G protein activation – GDP has been expelled from the G protein’s
nucleotide binding site. This is the state that was captured in the β2AR-Gs crystal
structure; apyrase digestion was required to form a stable receptor-G protein complex for
crystallography.1 In a cellular context this would be a transient intermediate: GTP binds
next, inducing dissociation of the G protein from the receptor and the Gα subunit from
Gβγ (Figure 7.1). In the nanodisc system, the G protein can be dissociated from the

180
receptor by addition of GDP or the nonhydrolyzable GTP analog GTPγS in a dose-
dependent fashion (Figure 7.3). In the general scheme envisioned for the desired assay,
the GTPγS EC50 for dissociation of the nucleotide-free complex is measured: loss of
function mutations destabilizing the complex will lower the EC50, while mutations
stabilizing the complex will raise it.
Figure 7.3. Dissociation of the nucleotide free nanobody-supported β2AR-Gs complex by GDP or GTPγS. Dissociation is monitored by fluorescence intensity of a bimane fluorophore on the β2AR. Reproduced from Yao et al. (2009), copyright (2009) by the National Academy of Sciences.
An ideal assay for structure-function studies will allow for unnatural amino acid
mutagenesis of the receptor and of the G protein. In vivo expression of both receptor and
G protein in Xenopus laevis oocytes is attractive, as this system is well suited to GPCR
unnatural amino acid mutagenesis by nonsense suppression.7-9 The assay proposed in
this chapter involves GTPγS dissociation of a receptor-G protein complex in plasma
membranes derived from Xenopus laevis oocytes. FRET between fluorescent protein (FP)
fusions of the receptor and the G protein could afford a readout for dissociation of the
complex. Of course, the large size of FPs is undesirable, but FP fusions of both GPCRs
and G proteins are well documented and several sites for FP incorporation are reported
that permit receptor activation of the G protein.10-12

181
Figure 7.4. Hypothetical fluorescence decay traces. (A) Fluorescence decay of an isolated fluorophore. (B) Fluorescence lifetime shortened by the presence of a FRET acceptor. (C) Fluorescence decay of a mixed population of fluorophores A and B.
Fluorescence lifetime imaging microscopy (FLIM) will be the principle method
used to probe for an association between FP-tagged receptors and G proteins. FLIM
exploits the fact that a donor fluorophore participating in FRET has its fluorescence
lifetime shortened relative to an isolated donor fluorophore (Figure 7.4).13 A
fluorophore’s fluorescence decay as a function of time, F(t), is described by:
€
F(t) = Ae−tτ
Where t is time, A is the fluorescence peak amplitude, and τ is the fluorescence lifetime.
FRET will decrease the value of τ and the FRET efficiency is conventionally given by:
€
FRET efficiency =1− τFRETτD
Where τFRET is the fluorescence lifetime corresponding to the FRET condition and τD is
the fluorescence lifetime corresponding to a donor fluorophore in the absence of a FRET
acceptor.
182
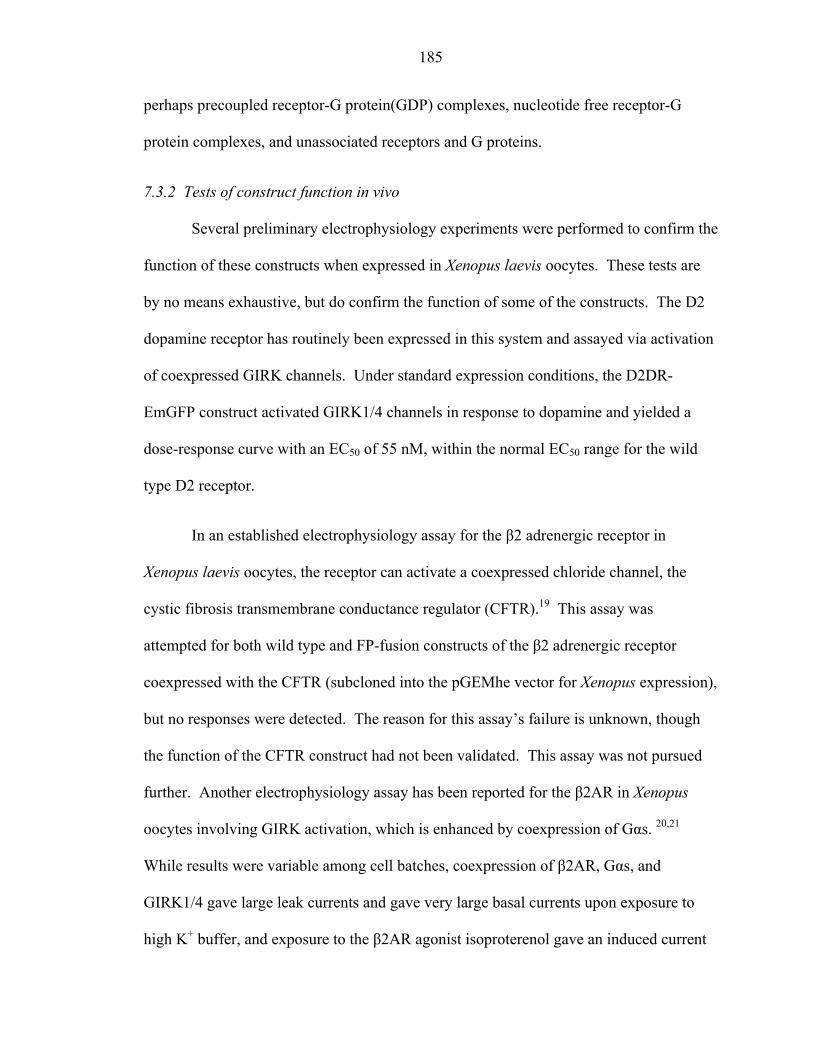
A significant advantage of the FLIM technique compared to other methods for
FRET measurement is the ability to discriminate populations of donor fluorophores
participating in FRET from non-interacting donors in a mixed population (and to
determine the FRET efficiencies for each population).13 In a two-component sample
(Figure 7.4 C) the fluorescence decay is simply fit to a double exponential and the size of
each population is given by their relative peak amplitudes, A1 and A2. In the desired
FRET assay for dissociation of a nucleotide-free G protein/receptor complex, most donor
fluorophores will initially participate in FRET, and the interacting population will
decrease as GTPγS is added.
In the assay envisioned, plasma membrane sheets from oocytes expressing FP
fusions of a receptor and a G protein are immobilized on a glass surface, exposing the
intracellular side of the membrane to solution. The sheets are treated with apyrase to
form stable receptor-G protein complexes, the initial FRET reading is established, and the
sheets are subsequently treated with GTPγS to dissociate the complexes. Such glass-
immobilized sheets of Xenopus lavevis membranes have previously been reported for
fluorescence imaging of membrane proteins. 14,15 FLIM imaging of the membrane sheets
using a confocal fluorescence microscope can be used to detect the receptor-G protein
interaction by FRET. The receptor-G protein system chosen for these experiments is the
β2 adrenergic receptor with Gαs, Gβ1, and Gγ2 – the same proteins crystallized in the β2
adrenergic receptor-G protein structure.1 The D2 dopamine receptor paired with Gαi2
was also explored, as this receptor has been amenable to expression and characterization
in Xenopus oocytes in our hands. 8,16

183
7.3 Results and Discussion
7.3.1 Construction of Fluorescent Protein Fusions
Sites for fluorescent protein fusion to the receptors and G proteins were selected
based on literature reports of maintained function and of positioning that yields FRET in
vivo. 10,12 The chosen sites (Figure 7.5) have direct precedent for the β2 adrenergic
receptor,10 D2 dopamine receptor,17 Gβ1,10 and Gγ2. 10,12 For Gαi2 and Gαs, the FP was
inserted into a site that yielded robust FRET with a GPCR, though for a different G
Construct Protein Insertion Site Linker
β2AR-FP human β2 adrenergic receptor
C terminus -AGS-
D2DR-FP human D2 dopamine receptor, long isoform
C terminus -AGS-
Gαs-FP human Gαs, short (isoform 3)
loop between helices A and B (residues 99 and 100)
-AGSG-, -GSGA-
Gαi2-FP human Gαi2, isoform 1
loop between helices A and B (residues 91 and 92)
-AGSG-, -GSGA-
FP-Gβ1 bovine Gβ1
N terminus -GSGA-
FP-Gγ2 human Gγ2
N terminus -GSGA-
Gγ2-FP human Gγ2
C terminus -AGSG-
Figure 7.5. Fluorescent protein fusions created. Each fusion noted was made for EmGFP, EYFP, and mCherry. Approximate locations for fluorescent protein insertion are denoted by colored stars on the crystal structure of the β2AR-Gs complex.

184
protein (Gαi1). 11 All genes were subcloned into the pGEMhe vector for optimal
expression in Xenopus laevis oocytes.18 For a wide range of options for FRET pairs,
every fusion was prepared with each of three different fluorescent proteins: engineered
monomeric green fluorescent protein (EmGFP), engineered yellow fluorescent protein
(EYFP), and monomeric Cherry (mCherry). Both EmGFP and EYFP can serve as FRET
donors for mCherry.
Several previous studies provide guidance on which construct combinations
should afford the most robust FRET signals. Michel Bouvier and co-workers have
studied associations between FP-tagged G proteins and GPCRs by FRET, principally
using the FRET pair of Luciferase (a protein yielding bioluminescence when supplied
with the substrate coelenterazine) as the donor and GFP as the acceptor. 10,11 This
technique is termed bioluminescence resonance energy transfer (BRET) as donor
emission occurs via bioluminescence. For each condition they quantify a BRET value:
the ratio of GFP emission intensity to Luciferase emission intensity. All measurements
were made in vivo in human embryonic kidney 293 cells. They quantified a modest
BRET value of 0.15 for β2AR-GFP coexpressed with Gαi1-Luciferase (same insertion
sites as in Figure 7.5),11 and a more robust BRET value of 0.4 for β2AR-Luciferase with
GFP-Gγ2.10 Both measurements were made in the presence of agonist, but only modestly
lower values were measured under ligand-free conditions. A strong BRET value of 0.4
was measured for both α2A-adrenergic receptor-GFP/Gαi1-Luciferase and α2A-
adrenergic receptor-Luciferase/GFP-Gγ2 combinations.11 It should be noted that these
BRET values in vivo likely encompass receptors and G proteins in a variety of states –
185
perhaps precoupled receptor-G protein(GDP) complexes, nucleotide free receptor-G
protein complexes, and unassociated receptors and G proteins.
7.3.2 Tests of construct function in vivo
Several preliminary electrophysiology experiments were performed to confirm the
function of these constructs when expressed in Xenopus laevis oocytes. These tests are
by no means exhaustive, but do confirm the function of some of the constructs. The D2
dopamine receptor has routinely been expressed in this system and assayed via activation
of coexpressed GIRK channels. Under standard expression conditions, the D2DR-
EmGFP construct activated GIRK1/4 channels in response to dopamine and yielded a
dose-response curve with an EC50 of 55 nM, within the normal EC50 range for the wild
type D2 receptor.
In an established electrophysiology assay for the β2 adrenergic receptor in
Xenopus laevis oocytes, the receptor can activate a coexpressed chloride channel, the
cystic fibrosis transmembrane conductance regulator (CFTR).19 This assay was
attempted for both wild type and FP-fusion constructs of the β2 adrenergic receptor
coexpressed with the CFTR (subcloned into the pGEMhe vector for Xenopus expression),
but no responses were detected. The reason for this assay’s failure is unknown, though
the function of the CFTR construct had not been validated. This assay was not pursued
further. Another electrophysiology assay has been reported for the β2AR in Xenopus
oocytes involving GIRK activation, which is enhanced by coexpression of Gαs. 20,21
While results were variable among cell batches, coexpression of β2AR, Gαs, and
GIRK1/4 gave large leak currents and gave very large basal currents upon exposure to
high K+ buffer, and exposure to the β2AR agonist isoproterenol gave an induced current

186
above this basal current. Coexpression of Gαs with GIRK1/4 or β2AR with GIRK1/4
gave markedly smaller leak and basal currents, suggesting that β2AR was signaling
through expressed Gαs. Large basal currents and a measurable induced current from
isoproterenol were measured when β2AR-EYFP and Gαs-mCherry were coexpressed
with GIRK1/4, suggesting that these FP-tagged constructs are functional as well.
Figure 7.6. Average currents detected by electrophysiology from coexpression of G protein subunits with D2DR and GIRK1/4 in Xenopus laevis oocytes. Equimolar amounts of each G protein mRNA were injected.
Preliminary electrophysiology data for D2DR coexpressed with GIRK1/4 and
various G protein subunits suggest that wild type Gαi2, Gβ1, and Gγ2 are likely
functional in this expression system (Figure 7.6). Coexpression of wild type Gβ1, and
Gγ2 significantly increased basal currents in the D2DR/GIRK1/4 system, though

187
elevation of basal currents was not significant when FP-tagged EmGFP-Gβ1 and
mCherry-Gγ2 were expressed instead. Also, coexpression of wild type Gαi2 with Gβ1
and Gγ2 significantly reduced basal currents and caused a borderline significant increase
of dopamine-induced currents. While these data validate the function of the wild type G
protein constructs in this system, they do not establish whether FP-Gβ1 and FP-Gγ2 are
functional.
7.3.3 Formation and fluorescence imaging of plasma membrane sheets
Several methods were investigated for the formation of glass-supported plasma
membrane sheets.15,22 The cleanest and most reproducible was found to be the method of
Singer-Lahat et al.,14 in which a devitellinized oocyte is laid on a glass cover slip in
buffer, allowed to adhere, and then forcefully aspirated away. This yields a patch of
plasma membrane with its intracellular face exposed to solution, which can be imaged by
fluorescence microscopy.
All constructs tested (at least one FP fusion for each G protein or receptor) could
be visualized in membrane patches by fluorescence microscopy, suggesting that they
indeed express and are present in the plasma membrane. Representative images are
shown in Figure 7.7.

188
Figure 7.7. Fluorescence images of two different membrane patches, one expressing the D2DR-EmGFP construct and the other expressing the Gαi2-mCherry construct. Membrane patch boundary is visible in the Gai2-mCherry image.
7.3.4 Attempts to measure FRET between G protein and receptor
Several control experiments suggested that FLIM should be a viable assay for this
system. FLIM on membrane sheets from cells expressing the β2AR-EmGFP construct
generally gave a single-component fluorescence decay with a lifetime of approximately
2.5 ns (Table 7.1). A positive control in which mCherry was fused directly to EmGFP
(via a -AGS- linker) on the β2AR-EmGFP construct had an additional short component
(approximately 1 ns) in its fluorescence decay, consistent with FRET between EmGFP
and mCherry. The fact that this shorter component comprised only half of the
fluorescence amplitude probably indicates that approximately half of the mCherry
molecules are “dark” – either unfolded or do not have mature chromophores. This is
consistent with an earlier report of a FLIM measurement in mammalian cells for this
same FRET pair, which indicated that only 55% of mCherry chromophores were
functional.23 Thus, the actual fraction of interacting donors should be approximately
double that suggested by FLIM.

189
Table 7.1. FLIM data from representative membrane sheets
Construct Expressed Normalized A1 τ1 (ns) Normalized A2 τ2 (ns) β2AR-EmGFP 1 2.53 -- --
β2AR-EmGFP-mCherry 0.52 2.28 0.48 0.98
Inspired by the high BRET signals reported for coexpressed β2AR-luciferase and
GFP-Gγ2 by Bouvier and coworkers, the constructs EmGFP-Gγ2 and β2AR-mCherry
were explored for FRET in the Xenopus membrane sheet system. These constructs use
the identical G protein and receptor as in the Bouvier system with fluorescent proteins
appended at identical sites. EmGFP-Gγ2 expressed alone gave a single exponential
fluorescence decay of approximately 2.5 ns (Table 7.2). Coexpression of β2AR-mCherry
did not markedly change the fluorescence decay; no obvious second component was
present. When the decay traces were fit to a single exponential, the condition in which
the β2AR-mCherry FRET acceptor was present gave a very slightly shorter lifetime
(Table 7.2), perhaps reflecting a small degree of FRET between the two proteins. If a
shorter lifetime component was present at all it was too small to be reliably fit as a
second component to the fluorescence lifetime, and thus not useful for a G protein-
receptor assay. Note that for the oocytes from which these membrane sheets derived, a
significant excess of the FRET acceptor β2AR-mCherry mRNA was injected, with the
aim of minimizing the fraction of unpaired EmGFP-Gγ2 donor. These measurements
were made in the presence of apyrase (2U/mL) and the β2AR agonist isoproterenol (100
µM), conditions that should promote formation of nucleotide free G protein-receptor
complexes. For the cells used in these experiments, wild type Gαs and Gβ1 were also
coexpressed with the FP constructs EmGFP-Gγ2 and β2AR-mCherry, which Bouvier and
coworkers found to modestly increase BRET efficiency. A cursory attempt to measure

190
FRET by a ratiometric method instead (NFRET)24 – comparing donor and acceptor
fluorescence emission intensities – also did not indicate FRET between EmGFP-Gγ2 and
β2AR-mCherry.
Table 7.2. FLIM data for membrane sheets incubating in 2 U/mL apyrase and 100 µM of the β2AR agonist isoproterenol. mRNA injection amounts were 0.25 ng EmGFP-Gγ2 and 10 ng β2AR-mCherry per oocyte. Every oocyte was also coinjected with 0.25 ng Gαs and 0.25 ng Gβ1 mRNA. All fluorescence decay traces were fit to a single exponential.
Construct(s) Expressed τ (ns) EmGFP-Gγ2 2.49 ± 0.05 n = 9
EmGFP-Gγ2 + β2AR-mCherry 2.37 ± 0.05 n = 9
Myriad other conditions were tested, none of which yielded fluorescence decay
traces consistent with FRET. Similar traces were measured from intact cells imaged by
FLIM: whole devitellinized oocytes were laid on glass coverslips and the portion of the
cell directly contacting the coverslip was imaged. FLIM experiments were also
conducted in the absence of apyrase or agonist, and in the presence of GTPγS – none of
which changed the fluorescence decays. EYFP was also tried as a donor fluorophore
instead of GFP (the excitation wavelength and emission filters used in the FLIM
experiments are suitable for both fluorophores). EYFP gave a slightly longer
fluorescence lifetime than GFP (~2.8 ns), but no difference was observed between donor-
only conditions and conditions in which the FRET acceptor was also present.
A second fluorescence lifetime component of small amplitude (often
approximately 20% that of the principle component) and a shorter lifetime (1 - 1.6 ns)
was occasionally detected. However, this feature was not associated with any particular
sample type or conditions: it was found in donor-only samples as well as samples in
which both donor and accepter were present and also seen with both GFP and YFP as

191
donors. The origin of this component is unknown; it is assumed to derive from
background fluorescence in the membrane patch.
Finally, a wide array of other FP construct combinations were expressed and
imaged by FLIM, though none of these yielded fluorescence decay traces consistent with
FRET either. These combinations (Table 7.3), were not explored in as extensive detail as
the EmGFP-Gγ2/β2AR-mCherry pair, but some conditions varied include ratios of
mRNA injected and the presence of agonst, apyrase, or GTPγS – none of which altered
the FLIM traces. Additionally, a modified β2AR-EYFP was tested in which the C
terminus of the receptor (to which EYFP is appended) was truncated by 48 residues
(everything after amino acid 365 was removed). This truncated version of the β2AR is
known to be functional and is the form in which the receptor was co-crystallized with its
G protein.1 It was hoped that having a shorter C terminus would position the appended
YFP closer to the G protein, giving a higher FRET efficiency. Unfortunately, no FRET
was observed for this construct either.
Table 7.3. Other construct combinations tested for FRET
Donor Acceptor β2AR-EYFP mCherry-Gγ2
Gγ2-EYFP β2AR-mCherry
D2DR-EYFP mCherry-Gγ2
Gγ2-EYFP D2DR-mCherry
D2DR-EYFP Gαi2-mCherry
Gαi2-EYFP D2DR-mCherry
β2AR-EYFP Gαs-mCherry
β2AR[truncated]-EYFP mCherry-Gγ2

192
One possible reason for the failure of these experiments is that the distances
between fluorescent proteins in these G protein/receptor complexes are beyond the
working distance of the donor/acceptor pairs chosen. The Bouvier BRET experiments
were conducted primarily using the Renilla luciferase/GFP10 BRET pair. The Förster
distance (R0) for this exact pair has not been reported in the literature, but luciferase
paired with a related GFP analog (GFP2) has a R0 of 75 Å.25 In contrast, R0 for
EmGFP/mCherry and EYFP/mCherry are 51 Å and 57 Å, respectively. The shorter
working distance of these pairs would result in lower FRET efficiencies, perhaps below
the threshold of detection for this system.
7.4 Conclusions
As FRET was not convincingly observed between any receptor and G protein under
any of the conditions tested, this assay for probing the interaction between GPCRs and
their cognate G proteins was not pursued further. As no conditions tested yielded a
measurable amount of FRET, no starting point was found for further optimization, we
can only speculate about the reasons for the failure of the assay. FLIM, the method of
FRET measurement, was validated by the positive control of EmGFP fused to mCherry,
confirming that FRET can be detected by this experimental apparatus on fluorescent
proteins expressed in these membrane patches. The electrophysiology experiments
described above suggest that at least some of the FP constructs tested are functional in the
Xenopus system, though not all (and very few in combination with each other) were
evaluated. In literature reports, fluorescent protein fusions involving identical GPCRs
and G proteins with (different) FPs placed at identical locations were functional and

193
yielded FRET in mammalian cells. 10,11 Most likely, either the fusions of receptors and G
proteins interact differently in the Xenopus system - they do not readily couple to one
another or interact more transiently – or the working distances of the fluorescent protein
donor/acceptor pairs investigated here are too short for the interactions probed.
7.5 Experimental
7.5.1 Molecular biology and in vivo expression
All constructs were in the pGEMhe vector. Fluorescent protein fusions were
assembled by PCR subcloning with correct insertions verified by sequencing. cDNA was
linearized with the appropriate restriction enzyme, purified (Qiagen), and used as a
template for in vitro runoff transcription using the T7 mMessage mMachine Kit (Life
Technologies). Stage V–VI Xenopus laevis oocytes were harvested and injected with
RNAs as described previously.7 Each oocyte was injected with 0.5–20 ng of each
appropriate mRNA 24-72 hrs before recording or imaging.
7.5.2 Electrophysiology
Oocyte recordings were made in two-electrode voltage clamp mode using the
OpusXpress 6000A (Axon Instruments). Recording buffers were ND96 (96 mM NaCl, 2
mM KCl, 1 mM MgCl2, 5 mM HEPES, 1.8 mM CaCl2, pH 7.5) and high K+ ringer (96
mM NaCl, 24 mM KCl, 1 mM MgCl2, 5 mM HEPES, 1.8 mM CaCl2, pH 7.5). Solution
flow rates were 2 mL min–1 and drug application flow rates were 2.5 mL min–1. Initial
holding potential was −60 mV. Cells were subjected to a ND96 pre-wash for 10 s, a high
K+ application for 50 s to establish basal currents, and agonist (dopamine for D2DR,

194
isoproterenol for β2AR) application in high K+ ringer for 25 s, followed by high K+ and
ND96 washings for 45 and 90 s in duration, respectively. Agonist-induced currents were
measured over the basal K+ current as described previously.8
7.5.3 Membrane preparation:
Glass-supported plasma membrane sheets were prepared by the method of Singer-
Lahat et al.14 A devitellinized oocyte is laid on a glass cover slip embedded in a plastic
petri dish in ND96 buffer for approximately 15 min. The oocyte is forcefully aspirated
into a Pasteur pipette, leaving behind a patch of membrane adhered to the cover slip,
which is further aspirated and then forcefully rinsed with ND96 using a pipette.
7.5.4 FLIM imaging:
A commercial FLIM system (PicoQuant) was used, interfaced with a confocal
fluorescence microscope (Nikon Eclipse TE 2000-U), and using a pulsed 488 nm
excitation laser and a time-resolved single photon avalanche diode detector with filters
suitable for both GFP and YFP emission. In a typical experiment, a Xenopus oocyte
plasma membrane sheet from an oocyte expressing FP constructs was imaged at 60x
magnification and a fluorescence decay profile was generated for a region of strong
fluorescence.
7.6 References 1. Rasmussen, S. G. et al. Crystal structure of the beta2 adrenergic receptor-Gs
protein complex. Nature 477, 549–555 (2011). 2. Oldham, W. M. & Hamm, H. E. Heterotrimeric G protein activation by G-protein-
coupled receptors. Nat Rev Mol Cell Biol 9, 60–71 (2008). 3. Kenakin, T. & Christopoulos, A. Signalling bias in new drug discovery: detection,
quantification and therapeutic impact. 1–12 (2012). doi:10.1038/nrd3954

195
4. Ritchie, T. K. et al. Chapter 11 - Reconstitution of membrane proteins in phospholipid bilayer nanodiscs. Meth. Enzymol. 464, 211–231 (2009).
5. Whorton, M. R. et al. A monomeric G protein-coupled receptor isolated in a high-density lipoprotein particle efficiently activates its G protein. Proceedings of the National Academy of Sciences 104, 7682–7687 (2007).
6. Yao, X. J. et al. The effect of ligand efficacy on the formation and stability of a GPCR-G protein complex. Proc. Natl. Acad. Sci. U.S.A. 106, 9501–9506 (2009).
7. Nowak, M. W. et al. In vivo incorporation of unnatural amino acids into ion channels in Xenopus oocyte expression system. Meth. Enzymol. 293, 504–529 (1998).
8. Torrice, M. M., Bower, K. S., Lester, H. A. & Dougherty, D. A. Probing the role of the cation-pi interaction in the binding sites of GPCRs using unnatural amino acids. Proc. Natl. Acad. Sci. U.S.A. 106, 11919–11924 (2009).
9. Torrice, M. M. Chemical-Scale Studies of the Nicotinic and Muscarinic Acetylcholine Receptors. Division of Chemistry and Chemical Engineering (California Institute of Technology, 2009).
10. Gales, C. et al. Real-time monitoring of receptor and G-protein interactions in living cells. Nat Methods 2, 177–184 (2005).
11. Gales, C. et al. Probing the activation-promoted structural rearrangements in preassembled receptor-G protein complexes. Nat Struct Mol Biol 13, 778–786 (2006).
12. Bunemann, M., Frank, M. & Lohse, M. J. Gi protein activation in intact cells involves subunit rearrangement rather than dissociation. Proceedings of the National Academy of Sciences 100, 16077–16082 (2003).
13. Morton, P. E. & Parsons, M. Measuring FRET Using Time-Resolved FLIM. Methods Mol. Biol. 769, 403–413 (2011).
14. Singer-Lahat, D., Dascal, N., Mittelman, L., Peleg, S. & Lotan, I. Imaging plasma membrane proteins in large membrane patches of Xenopus oocytes. Pflugers Arch 440, 627–633 (2000).
15. Ottolia, M., Philipson, K. D. & John, S. Xenopus oocyte plasma membrane sheets for FRET analysis. Am J Physiol Cell Physiol 292, C1519–22 (2007).
16. Van Arnam, E. B., Lester, H. A. & Dougherty, D. A. Dissecting the functions of conserved prolines within transmembrane helices of the D2 dopamine receptor. ACS Chem. Biol. 6, 1063–1068 (2011).
17. Wurch, T., Matsumoto, A. & Pauwels, P. J. Agonist-independent and -dependent oligomerization of dopamine D(2) receptors by fusion to fluorescent proteins. FEBS Lett. 507, 109–113 (2001).
18. Liman, E. R., Tytgat, J. & Hess, P. Subunit stoichiometry of a mammalian K+ channel determined by construction of multimeric cDNAs. Neuron 9, 861–871 (1992).
19. Riordan, J. R. The cystic fibrosis transmembrane conductance regulator. Annu. Rev. Physiol. 55, 609–630 (1993).
20. Lim, N. F., Dascal, N., Labarca, C., Davidson, N. & Lester, H. A. A G protein-gated K channel is activated via beta 2-adrenergic receptors and G beta gamma subunits in Xenopus oocytes. J Gen Physiol 105, 421–439 (1995).
21. Mullner, C. et al. Heterologous facilitation of G protein-activated K(+) channels

196
by beta-adrenergic stimulation via cAMP-dependent protein kinase. J Gen Physiol 115, 547–558 (2000).
22. Perez, J. B., Martinez, K. L., Segura, J. M. & Vogel, H. Supported cell-membrane sheets for functional fluorescence imaging of membrane proteins. Adv Funct Mater 16, 306–312 (2006).
23. Yasuda, R. et al. Supersensitive Ras activation in dendrites and spines revealed by two-photon fluorescence lifetime imaging. Nat Neurosci 9, 283–291 (2006).
24. Xia, Z. & Liu, Y. Reliable and global measurement of fluorescence resonance energy transfer using fluorescence microscopes. Biophysj 81, 2395–2402 (2001).
25. Dacres, H., Michie, M., Wang, J., Pfleger, K. D. G. & Trowell, S. C. Effect of enhanced Renilla luciferase and fluorescent protein variants on the Förster distance of Bioluminescence resonance energy transfer (BRET). Biochemical and Biophysical Research Communications 425, 625–629 (2012).