Embed Size (px)
Citation preview
Chapter 7: Inference for Numerical Data
Chapter 7: Inference for Numerical DataMath 140 · Fall ’21
Based on content in OpenIntro Stats, 4th Ed
Hitchman
November 3, 2021

Chapter 7: Inference for Numerical Data
Section 7.2Paired t-test

Chapter 7: Inference for Numerical Data
Paired data
Paired observations
Q: 200 students were randomly sampled from a “High School andBeyond survey.” Each student had taken a reading and writing test andtheir scores are shown below. At a first glance, does there appear to be adifference between the average reading and writing test score?
y
scor
es
read write
20
40
60
80

Chapter 7: Inference for Numerical Data
Paired data
Paired observations
The same students took the reading and writing tests and their scoresare shown below. Are the reading and writing scores independent of eachother?
id read write
1 70 57 522 86 44 333 141 63 444 172 47 52...
......
...200 137 63 65
No, the scores are linked by the student. Each student took the readingand writing tests.
Chapter 7: Inference for Numerical Data
Paired data
Paired observations
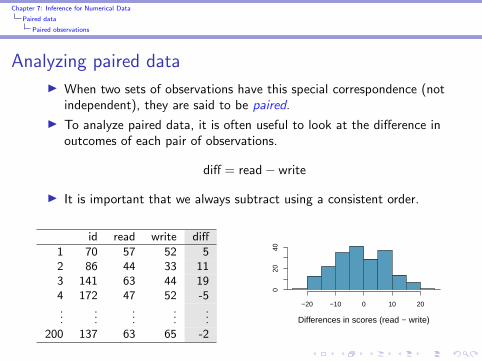
Analyzing paired data
I When two sets of observations have this special correspondence (notindependent), they are said to be paired.
I To analyze paired data, it is often useful to look at the difference inoutcomes of each pair of observations.
diff = read− write
I It is important that we always subtract using a consistent order.
id read write diff
1 70 57 52 52 86 44 33 113 141 63 44 194 172 47 52 -5...
......
......
200 137 63 65 -2Differences in scores (read − write)
−20 −10 0 10 20
020
40
Chapter 7: Inference for Numerical Data
Paired data
Paired observations
Parameter and point estimate
I Parameter of interest: Average difference between the reading andwriting scores of all high school students.
µdiff
I Point estimate: Average difference between the reading and writingscores of sampled high school students.
x̄diff

Chapter 7: Inference for Numerical Data
Paired data
Inference for paired data
Setting the hypotheses
Q: If in fact there was no difference between the scores on the readingand writing exams, what would you expect the average difference to be?
0
Q: What are the hypotheses for testing if there is a difference betweenthe average reading and writing scores?
H0: There is no difference between the average reading and writing score.
µdiff = 0
HA: There is a difference between the average reading and writing score.
µdiff 6= 0

Chapter 7: Inference for Numerical Data
Paired data
Inference for paired data
Setting the hypotheses
Q: If in fact there was no difference between the scores on the readingand writing exams, what would you expect the average difference to be?0
Q: What are the hypotheses for testing if there is a difference betweenthe average reading and writing scores?
H0: There is no difference between the average reading and writing score.
µdiff = 0
HA: There is a difference between the average reading and writing score.
µdiff 6= 0
Chapter 7: Inference for Numerical Data
Paired data
Inference for paired data
Nothing new here
I The analysis is no different than what we have done before.
I We have data from one sample: differences.
I We are testing to see if the average difference is different than 0.
Chapter 7: Inference for Numerical Data
Paired data
Inference for paired data
Checking assumptions & conditions
Which of the following is true?
(a) Since students are sampled randomly and are less than 10% of allhigh school students, we can assume that the difference between thereading and writing scores of one student in the sample isindependent of another.
(b) The distribution of differences is bimodal, therefore we cannotcontinue with the hypothesis test.
(c) In order for differences to be random we should have sampled withreplacement.
(d) Since students are sampled randomly and are less than 10% allstudents, we can assume that the sampling distribution of theaverage difference will be nearly normal.
Chapter 7: Inference for Numerical Data
Paired data
Inference for paired data
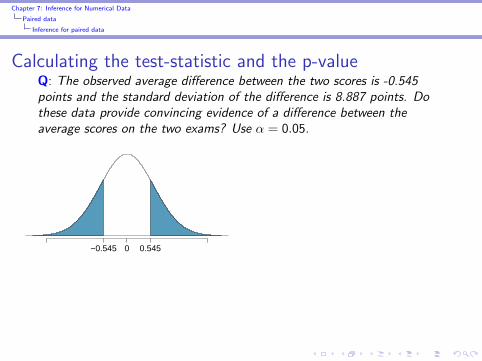
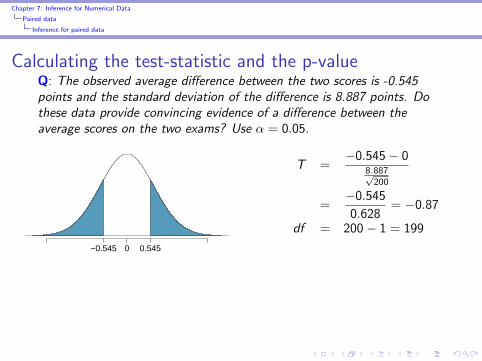
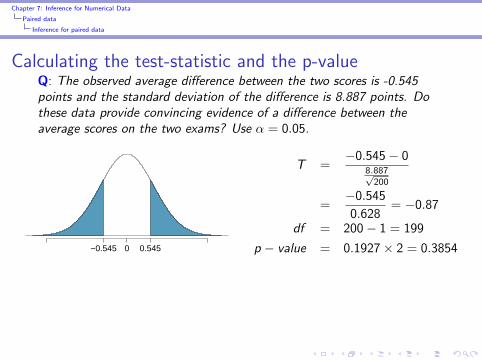
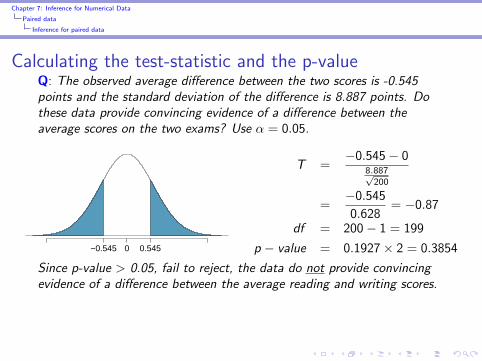
Calculating the test-statistic and the p-valueQ: The observed average difference between the two scores is -0.545points and the standard deviation of the difference is 8.887 points. Dothese data provide convincing evidence of a difference between theaverage scores on the two exams? Use α = 0.05.
−0.545 0 0.545
T =−0.545− 0
8.887√200
=−0.545
0.628= −0.87
df = 200− 1 = 199
p − value = 0.1927× 2 = 0.3854
Since p-value > 0.05, fail to reject, the data do not provide convincingevidence of a difference between the average reading and writing scores.
Chapter 7: Inference for Numerical Data
Paired data
Inference for paired data
Interpretation of p-value
Which of the following is the correct interpretation of the p-value?
(a) Probability that the average scores on the reading and writing examsare equal.
(b) Probability that the average scores on the reading and writing examsare different.
(c) Probability of obtaining a random sample of 200 students where theaverage difference between the reading and writing scores is at least0.545 (in either direction), if in fact the true average differencebetween the scores is 0.
(d) Probability of incorrectly rejecting the null hypothesis if in fact thenull hypothesis is true.

Chapter 7: Inference for Numerical Data
Paired data
Inference for paired data
HT ↔ CI
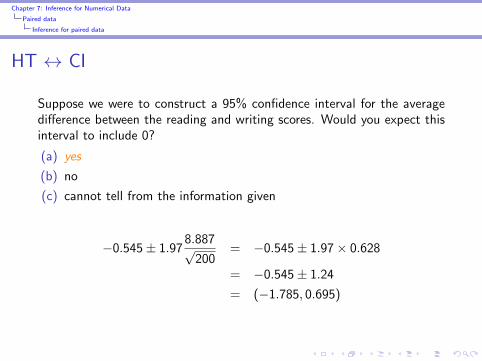
Suppose we were to construct a 95% confidence interval for the averagedifference between the reading and writing scores. Would you expect thisinterval to include 0?
(a) yes
(b) no
(c) cannot tell from the information given
−0.545± 1.978.887√
200= −0.545± 1.97× 0.628
= −0.545± 1.24
= (−1.785, 0.695)
Chapter 7: Inference for Numerical Data
Paired data
Inference for paired data
HT ↔ CI
Suppose we were to construct a 95% confidence interval for the averagedifference between the reading and writing scores. Would you expect thisinterval to include 0?
(a) yes
(b) no
(c) cannot tell from the information given
−0.545± 1.978.887√
200= −0.545± 1.97× 0.628
= −0.545± 1.24
= (−1.785, 0.695)
Chapter 7: Inference for Numerical Data
Paired data
Inference for paired data
Section 7.3Inference on two means
Chapter 7: Inference for Numerical Data
Difference of two means
Diamonds
I Weights of diamonds are measured in carats.
I 1 carat = 100 points, 0.99 carats = 99 points, etc.
I The difference between the size of a 0.99 carat diamond and a 1carat diamond is undetectable to the naked human eye, but does theprice of a 1 carat diamond tend to be higher than the price of a 0.99diamond?
I We are going to test to see if there is a difference between theaverage prices of 0.99 and 1 carat diamonds.
I In order to be able to compare equivalent units, we divide the pricesof 0.99 carat diamonds by 99 and 1 carat diamonds by 100, andcompare the average point prices.

Chapter 7: Inference for Numerical Data
Difference of two means
Data
carat = 0.99 carat = 1
20
30
40
50
60
70
80
0.99 carat 1 carat
pt99 pt100
x̄ 44.50 53.43s 13.32 12.22n 23 30
Note: These data are a random sample from the diamonds data set inggplot2 R package.

Chapter 7: Inference for Numerical Data
Difference of two means
Parameter and point estimate
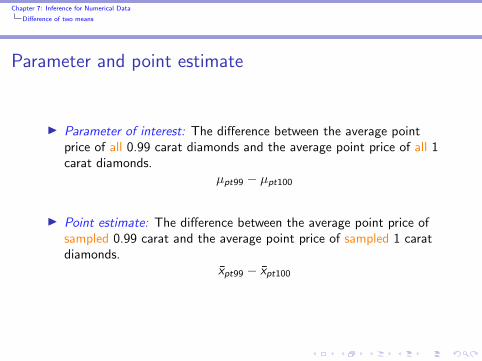
I Parameter of interest: The difference between the average pointprice of all 0.99 carat diamonds and the average point price of all 1carat diamonds.
µpt99 − µpt100
I Point estimate: The difference between the average point price ofsampled 0.99 carat and the average point price of sampled 1 caratdiamonds.
x̄pt99 − x̄pt100
Chapter 7: Inference for Numerical Data
Difference of two means
Parameter and point estimate
I Parameter of interest: The difference between the average pointprice of all 0.99 carat diamonds and the average point price of all 1carat diamonds.
µpt99 − µpt100
I Point estimate: The difference between the average point price ofsampled 0.99 carat and the average point price of sampled 1 caratdiamonds.
x̄pt99 − x̄pt100
Chapter 7: Inference for Numerical Data
Difference of two means
Hypotheses
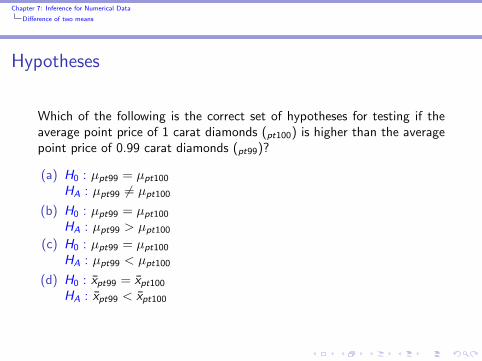
Which of the following is the correct set of hypotheses for testing if theaverage point price of 1 carat diamonds (pt100) is higher than the averagepoint price of 0.99 carat diamonds (pt99)?
(a) H0 : µpt99 = µpt100
HA : µpt99 6= µpt100
(b) H0 : µpt99 = µpt100
HA : µpt99 > µpt100
(c) H0 : µpt99 = µpt100
HA : µpt99 < µpt100
(d) H0 : x̄pt99 = x̄pt100
HA : x̄pt99 < x̄pt100
Chapter 7: Inference for Numerical Data
Difference of two means
Hypotheses
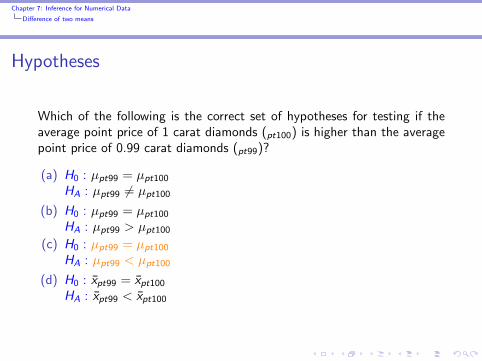
Which of the following is the correct set of hypotheses for testing if theaverage point price of 1 carat diamonds (pt100) is higher than the averagepoint price of 0.99 carat diamonds (pt99)?
(a) H0 : µpt99 = µpt100
HA : µpt99 6= µpt100
(b) H0 : µpt99 = µpt100
HA : µpt99 > µpt100
(c) H0 : µpt99 = µpt100
HA : µpt99 < µpt100
(d) H0 : x̄pt99 = x̄pt100
HA : x̄pt99 < x̄pt100
Chapter 7: Inference for Numerical Data
Difference of two means
Conditions
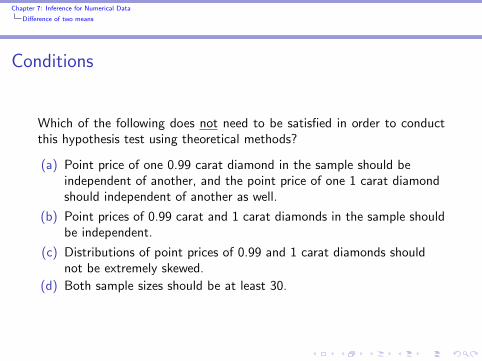
Which of the following does not need to be satisfied in order to conductthis hypothesis test using theoretical methods?
(a) Point price of one 0.99 carat diamond in the sample should beindependent of another, and the point price of one 1 carat diamondshould independent of another as well.
(b) Point prices of 0.99 carat and 1 carat diamonds in the sample shouldbe independent.
(c) Distributions of point prices of 0.99 and 1 carat diamonds shouldnot be extremely skewed.
(d) Both sample sizes should be at least 30.
Chapter 7: Inference for Numerical Data
Difference of two means
Conditions
Which of the following does not need to be satisfied in order to conductthis hypothesis test using theoretical methods?
(a) Point price of one 0.99 carat diamond in the sample should beindependent of another, and the point price of one 1 carat diamondshould independent of another as well.
(b) Point prices of 0.99 carat and 1 carat diamonds in the sample shouldbe independent.
(c) Distributions of point prices of 0.99 and 1 carat diamonds shouldnot be extremely skewed.
(d) Both sample sizes should be at least 30.
Chapter 7: Inference for Numerical Data
Difference of two means
Sampling distribution for the difference of two means
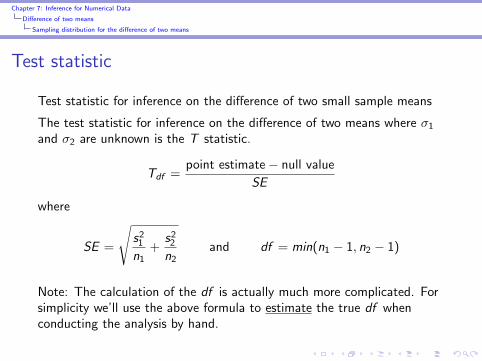
Test statistic
Test statistic for inference on the difference of two small sample means
The test statistic for inference on the difference of two means where σ1
and σ2 are unknown is the T statistic.
Tdf =point estimate− null value
SE
where
SE =
√s2
1
n1+
s22
n2and df = min(n1 − 1, n2 − 1)
Note: The calculation of the df is actually much more complicated. Forsimplicity we’ll use the above formula to estimate the true df whenconducting the analysis by hand.

Chapter 7: Inference for Numerical Data
Difference of two means
Hypothesis testing for the difference of two means
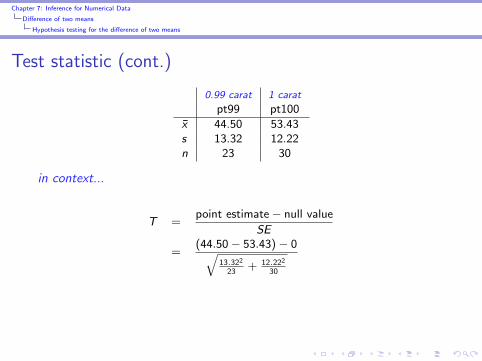
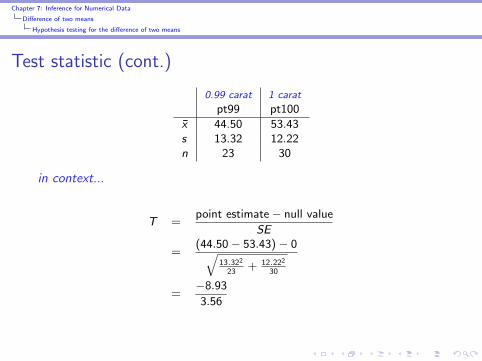
Test statistic (cont.)
0.99 carat 1 carat
pt99 pt100
x̄ 44.50 53.43s 13.32 12.22n 23 30
in context...
T =point estimate − null value
SE
=(44.50 − 53.43) − 0√
13.322
23+ 12.222
30
=−8.93
3.56= −2.508

Chapter 7: Inference for Numerical Data
Difference of two means
Hypothesis testing for the difference of two means
Test statistic (cont.)
0.99 carat 1 carat
pt99 pt100
x̄ 44.50 53.43s 13.32 12.22n 23 30
in context...
T =point estimate − null value
SE
=(44.50 − 53.43) − 0√
13.322
23+ 12.222
30
=−8.93
3.56= −2.508
Chapter 7: Inference for Numerical Data
Difference of two means
Hypothesis testing for the difference of two means
Test statistic (cont.)
0.99 carat 1 carat
pt99 pt100
x̄ 44.50 53.43s 13.32 12.22n 23 30
in context...
T =point estimate − null value
SE
=(44.50 − 53.43) − 0√
13.322
23+ 12.222
30
=−8.93
3.56
= −2.508

Chapter 7: Inference for Numerical Data
Difference of two means
Hypothesis testing for the difference of two means
Test statistic (cont.)
0.99 carat 1 carat
pt99 pt100
x̄ 44.50 53.43s 13.32 12.22n 23 30
in context...
T =point estimate − null value
SE
=(44.50 − 53.43) − 0√
13.322
23+ 12.222
30
=−8.93
3.56= −2.508

Chapter 7: Inference for Numerical Data
Difference of two means
Hypothesis testing for the difference of two means
Test statistic (cont.)
Which of the following is the correct df for this hypothesis test?
(a) 22
(b) 23
(c) 30
(d) 29
(e) 52

Chapter 7: Inference for Numerical Data
Difference of two means
Hypothesis testing for the difference of two means
Test statistic (cont.)
Which of the following is the correct df for this hypothesis test?
(a) 22
(b) 23
(c) 30
(d) 29
(e) 52
→ df = min(npt99 − 1, npt100 − 1)= min(23− 1, 30− 1)= min(22, 29) = 22

Chapter 7: Inference for Numerical Data
Difference of two means
Hypothesis testing for the difference of two means
p-value
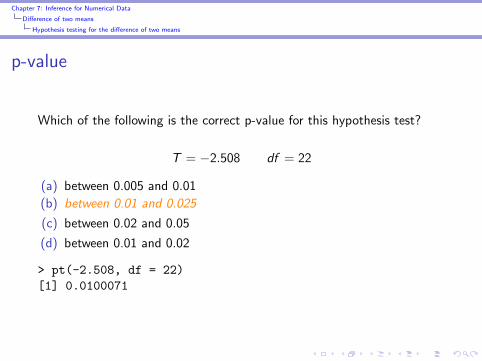
Which of the following is the correct p-value for this hypothesis test?
T = −2.508 df = 22
(a) between 0.005 and 0.01
(b) between 0.01 and 0.025
(c) between 0.02 and 0.05
(d) between 0.01 and 0.02
> pt(-2.508, df = 22)
[1] 0.0100071
Chapter 7: Inference for Numerical Data
Difference of two means
Hypothesis testing for the difference of two means
p-value
Which of the following is the correct p-value for this hypothesis test?
T = −2.508 df = 22
(a) between 0.005 and 0.01
(b) between 0.01 and 0.025
(c) between 0.02 and 0.05
(d) between 0.01 and 0.02
> pt(-2.508, df = 22)
[1] 0.0100071
Chapter 7: Inference for Numerical Data
Difference of two means
Hypothesis testing for the difference of two means
Synthesis
Q: What is the conclusion of the hypothesis test? How (if at all) wouldthis conclusion change your behavior if you went diamond shopping?
Chapter 7: Inference for Numerical Data
Difference of two means
Hypothesis testing for the difference of two means
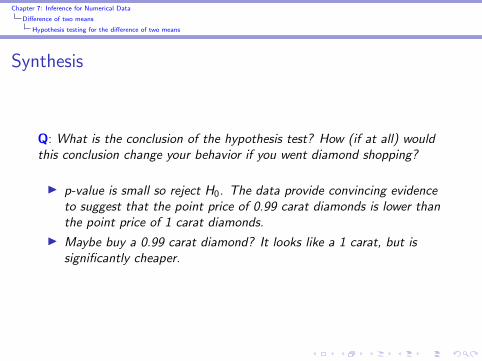
Synthesis
Q: What is the conclusion of the hypothesis test? How (if at all) wouldthis conclusion change your behavior if you went diamond shopping?
I p-value is small so reject H0. The data provide convincing evidenceto suggest that the point price of 0.99 carat diamonds is lower thanthe point price of 1 carat diamonds.
I Maybe buy a 0.99 carat diamond? It looks like a 1 carat, but issignificantly cheaper.
Chapter 7: Inference for Numerical Data
Difference of two means
Summary
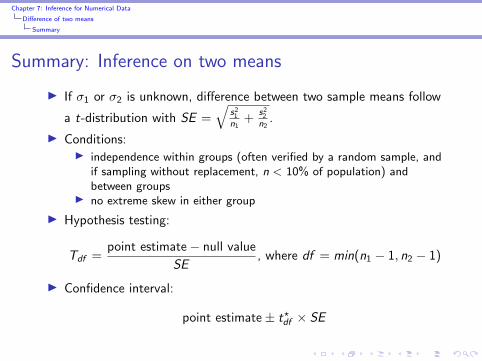
Summary: Inference on two means
I If σ1 or σ2 is unknown, difference between two sample means follow
a t-distribution with SE =√
s21
n1+
s22
n2.
I Conditions:I independence within groups (often verified by a random sample, and
if sampling without replacement, n < 10% of population) andbetween groups
I no extreme skew in either group
I Hypothesis testing:
Tdf =point estimate− null value
SE, where df = min(n1 − 1, n2 − 1)
I Confidence interval:
point estimate± t?df × SE