Embed Size (px)
DESCRIPTION
CHAPTER 7. EDUCATION. Real Annual Expenditure Per Pupil in Public Elementary and Secondary Schools (selected years). Justifying Government Intervention in Education. Is Education a Public Good? Does Education Generate Positive Externalities? The Conventional Wisdom - PowerPoint PPT Presentation
Citation preview

McGraw-Hill/Irwin Copyright © 2008 by The McGraw-Hill Companies, Inc. All rights reserved.
CHAPTER 7
EDUCATIONEDUCATION

7-2
Real Annual Expenditure Per Pupil in Public Elementary and Secondary Schools (selected years)
School Year Expenditure per pupil (2004 dollars)
1980 4,9171985 $5,6871990 $6,7461995 $6,8492000 $7,5742003 $8,2422004 $8,248
Source: Computed from US Census Bureau, Statistical Abstract of the United States 2006. Washington, DC 2006, p. 155
7-3
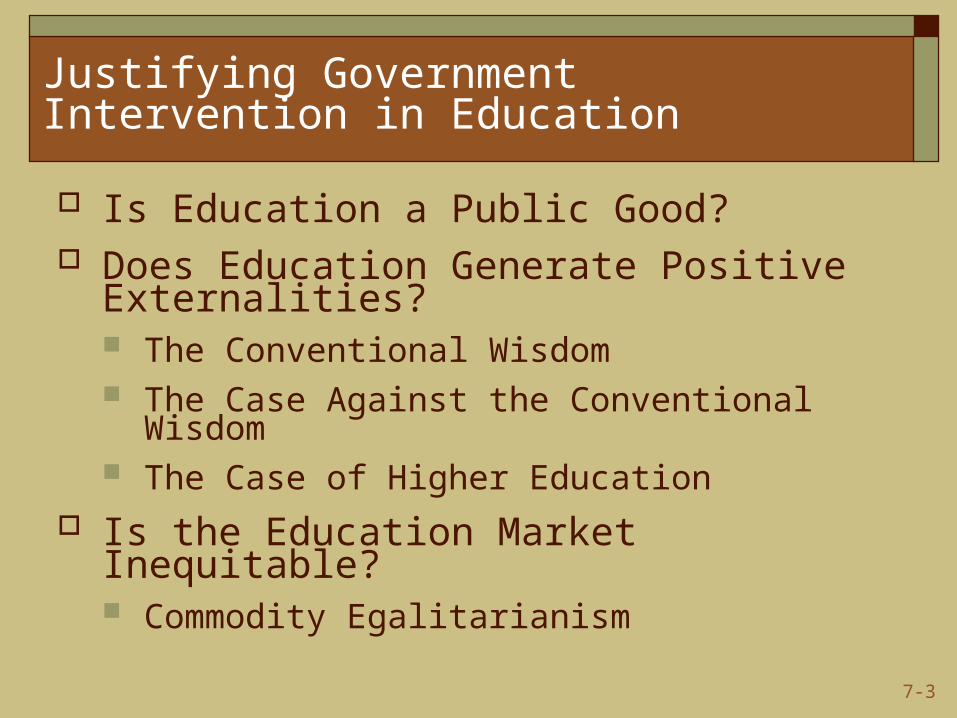
Justifying Government Intervention in Education
Is Education a Public Good? Does Education Generate Positive
Externalities? The Conventional Wisdom The Case Against the Conventional Wisdom The Case of Higher Education
Is the Education Market Inequitable? Commodity Egalitarianism

7-4
What Can Government Intervention in Education Accomplish?
Should public education be free and compulsory?
Should government produce public education?

7-5
Does Government Intervention Crowd Out Private Education?
Quantity of Education
Qua
ntity
of
all o
ther
goo
ds
A
B
i
e0ep
ii
x
Private School quantity of education
Public schooling “crowds out”
education

7-6
Does Government Intervention Crowd Out Private Education?
Quantity of Education
Qua
ntity
of
all o
ther
goo
ds
A
B
i
e0 ep
ii
x
Public schooling increases quantity of education

7-7
Does Government Intervention Crowd Out Private Education?
Quantity of Education
Qua
ntity
of
all o
ther
goo
ds
A
B
i
e0ep
ii
x
Public schooling does not increase
quantity of education

7-8
Does Government Spending Improve Educational Outcomes?
Figure 7.2: Real annual expenditures on public and private schools per student,all levels of education, selected countries (2002)
0
2,000
4,000
6,000
8,000
10,000
12,000
Switzer
land
United
Stat
es
Norway
Denm
ark
Austri
a
Sweden
Belgium
Italy
Icela
nd
Franc
e
Japan
Finlan
d
Nether
lands
Austra
lia
German
y
United
King
dom
Portuga
l
Spain
Irelan
d
Korea
Greec
e
Hunga
ry
Czech
Rep
ublic
Poland
Slova
k Rep
ublic
Mex
ico
Exp
endi
ture
per
stu
dent
(U
S do
llar
s)
SOURCE: Organization for Economic Cooperation and Development [2005, Table B1.1].

7-9
Does Government Spending Improve Educational Outcomes?
Comparative educational outcomes Empirical Evidence: Does Spending on
Education Improve Student Test Scores?
7-10
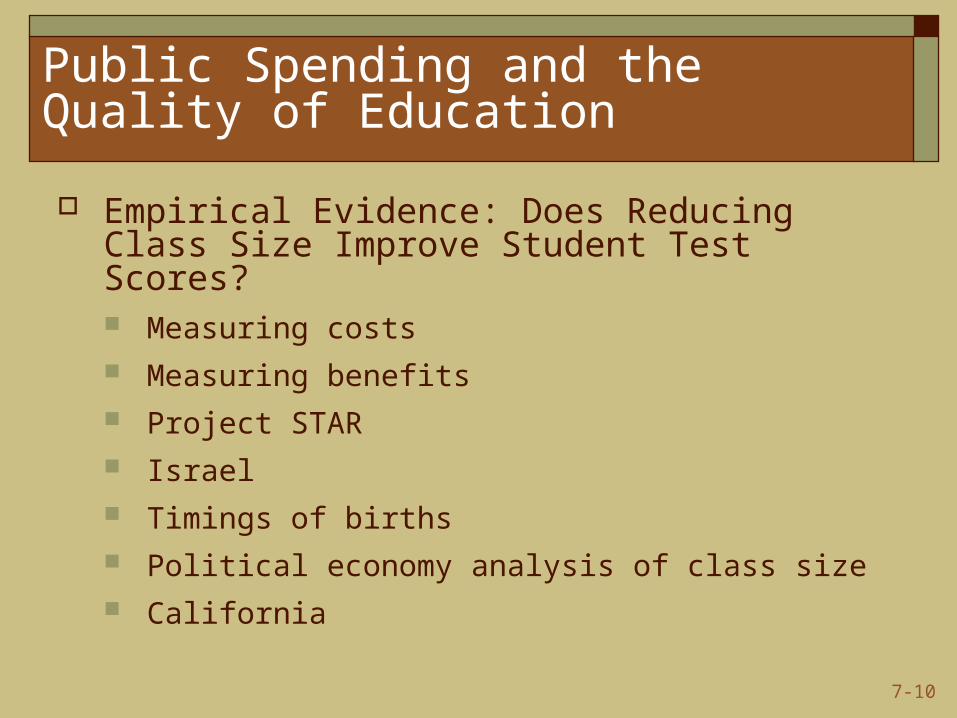
Public Spending and the Quality of Education
Empirical Evidence: Does Reducing Class Size Improve Student Test Scores? Measuring costs Measuring benefits Project STAR Israel Timings of births Political economy analysis of class size California
7-11
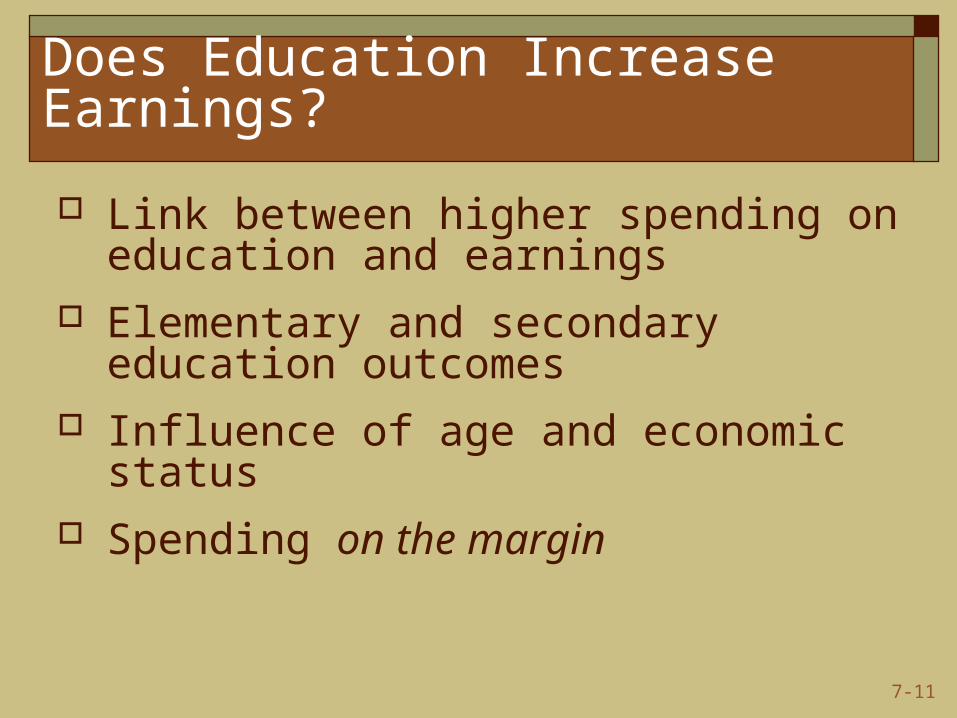
Does Education Increase Earnings?
Link between higher spending on education and earnings
Elementary and secondary education outcomes
Influence of age and economic status Spending on the margin

7-12
New Directions for Public Education-Charter Schools
Charter Schools- public schools operating under special state charters that permit experimentation and allow independence
Empirical evidence Diversity of choice Student outcomes

7-13
New Directions for Public Education-Vouchers
Vouchers – financial grants to families that can be used to pay their children’s tuition at (nearly) any school
Argument in favor Vouchers create competition in educational marketplace
Arguments opposing Parents might not be well-enough informed to make good choices Moving children to private schools might reduce positive
externalities of education If good students escape bad schools, weaker students left behind may
received even worse educations Inequitable
Empirical evidence on the effect of vouchers
7-14
New Directions for Public Education-School Accountability
School accountability – monitoring student and school performance via standardized tests
No Child Left Behind Act (2001) Empirical evidence on the effectiveness of
school accountability


![Chapter 7 [Chapter 7]](https://img.dokumen.tips/doc/110x75/61cd5ea79c524527e161fa6d/chapter-7-chapter-7.jpg)