Embed Size (px)
Citation preview
Copyright © 2011 Pearson Education, Inc.
Publishing as Prentice Hall
Chapter 6
Strategy Analysis & Choice
Strategic Management:
Concepts & Cases
13th Edition
Fred David
Copyright © 2011 Pearson Education, Inc.
Publishing as Prentice Hall
Copyright © 2011 Pearson Education, Inc.
Publishing as Prentice Hall
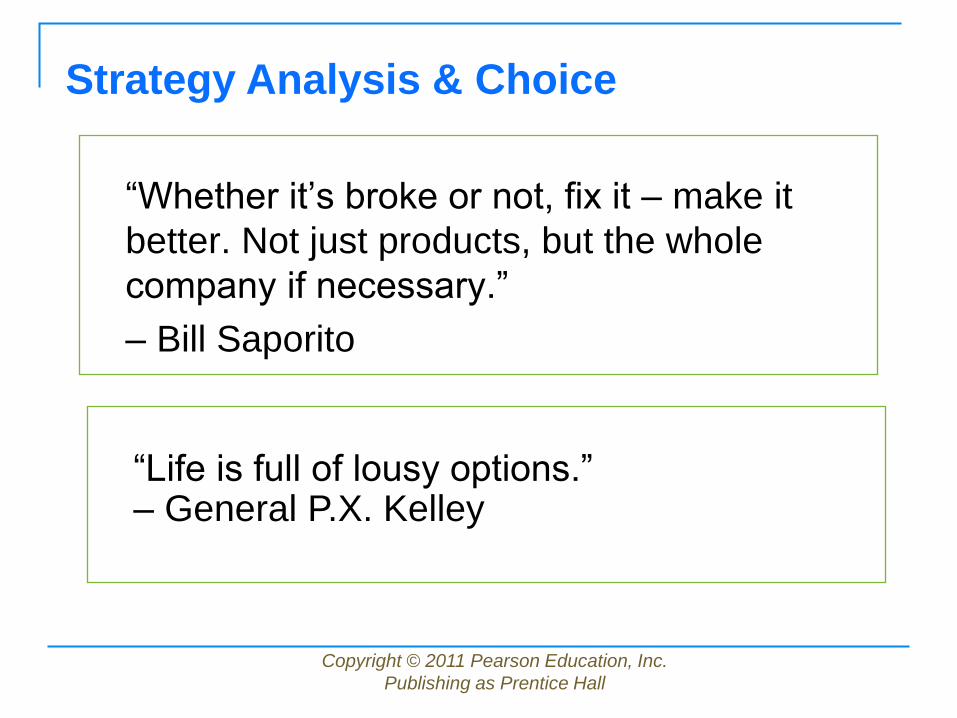
“Whether it’s broke or not, fix it – make it
better. Not just products, but the whole
company if necessary.”
– Bill Saporito
Strategy Analysis & Choice
“Life is full of lousy options.” – General P.X. Kelley

Copyright © 2011 Pearson Education, Inc.
Publishing as Prentice Hall
Subjective decisions based on objective
information
Generating alternative strategies
Selecting strategies to pursue
Best alternative course of action to
achieve mission & objectives
Derived from vision, mission, objectives,
external audit, and internal audit
Strategy Analysis & Choice
Copyright © 2011 Pearson Education, Inc.
Publishing as Prentice Hall
Strategy Analysis & Choice
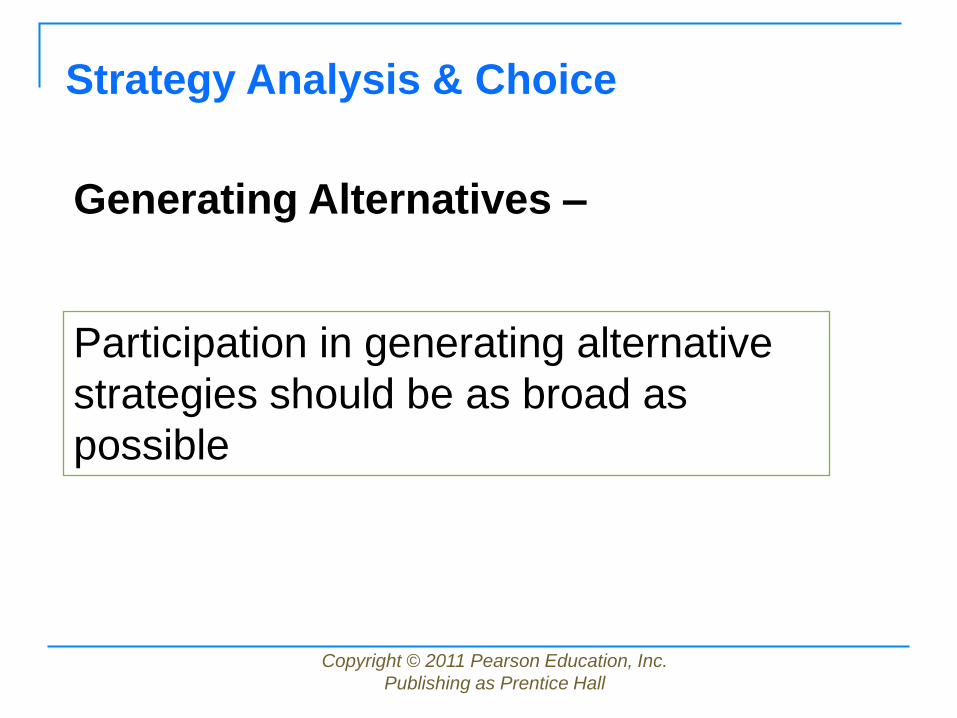
Generating Alternatives –
Participation in generating alternative
strategies should be as broad as
possible

Copyright © 2011 Pearson Education, Inc.
Publishing as Prentice Hall
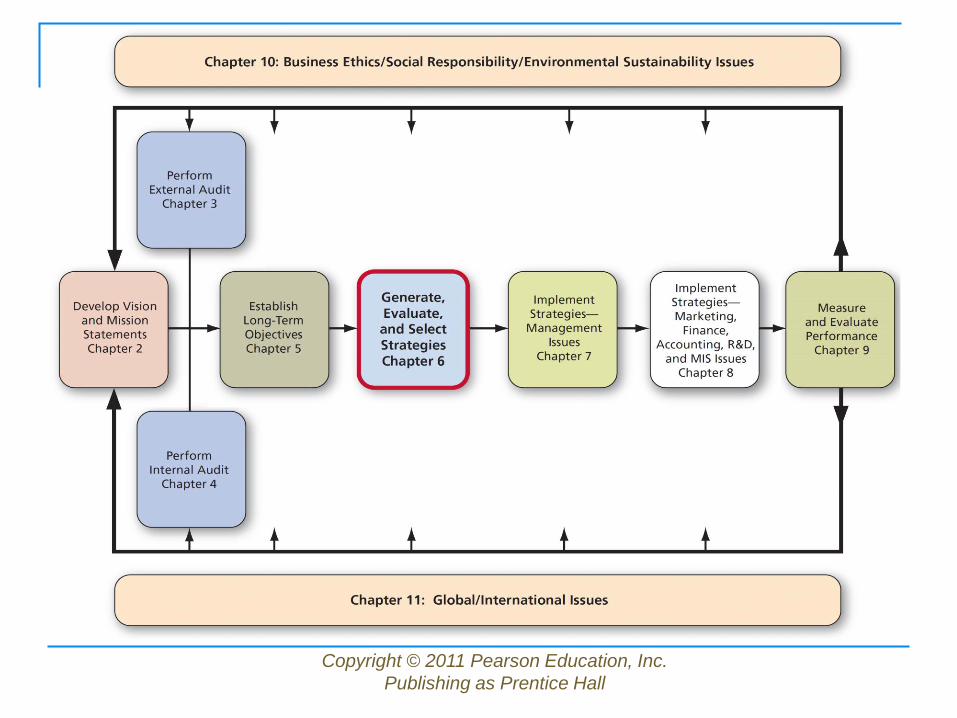
Comprehensive Strategy-
Formulation Framework Stage 1 - Input Stage
EFE Matrix
IFE matrix
CPM
Stage 2 - Matching Stage SWOT
SPACE matrix
BCG matrix
IE Matrix
Grand strategy matrix
Stage 3 - Decision Stage QSPM

Copyright © 2011 Pearson Education, Inc.
Publishing as Prentice Hall
Strategy-Formulation Framework
External Factor Evaluation
Matrix (EFE)
Internal Factor Evaluation
Matrix (IFE)
Competitive Profile Matrix
(CPM)
Stage 1:
The Input Stage

Copyright © 2011 Pearson Education, Inc.
Publishing as Prentice Hall
Stage 2: The Matching Stage
Match between organization’s internal
resources & skills and the opportunities &
risks created by its external factors

Copyright © 2011 Pearson Education, Inc.
Publishing as Prentice Hall
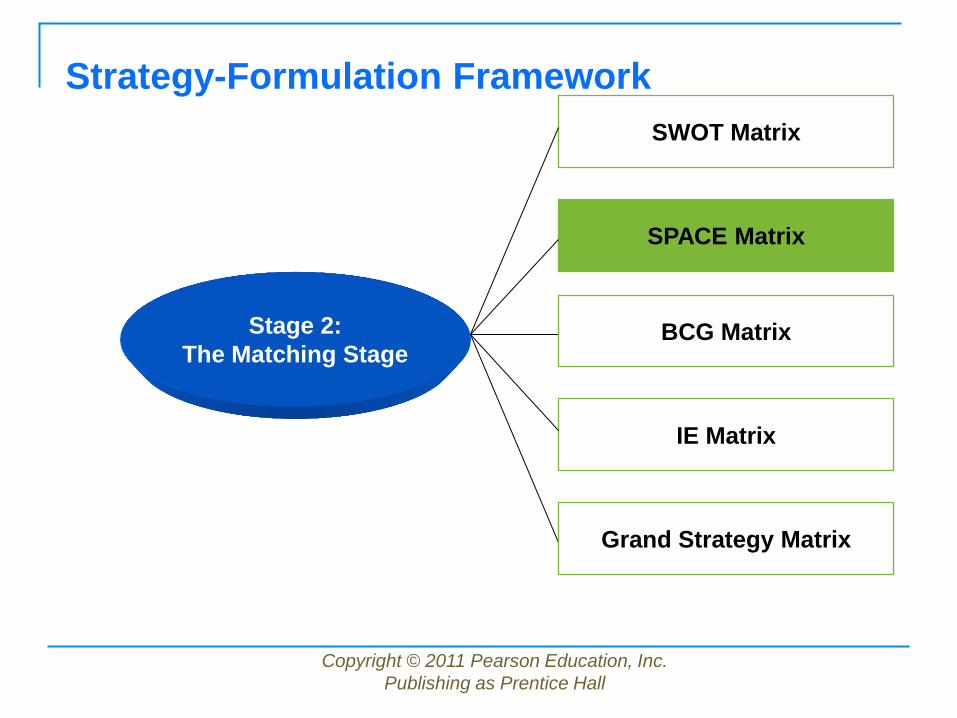
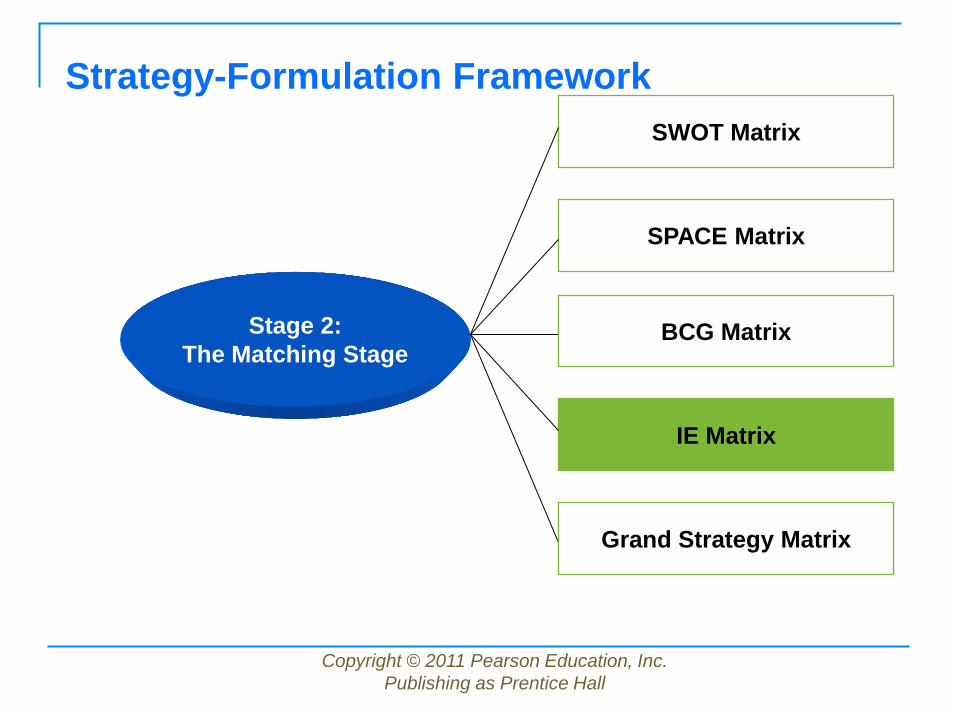
Strategy-Formulation Framework
SWOT Matrix
SPACE Matrix
BCG Matrix
IE Matrix
Grand Strategy Matrix
Stage 2:
The Matching Stage
Copyright © 2011 Pearson Education, Inc.
Publishing as Prentice Hall
Stage 2: The Matching Stage
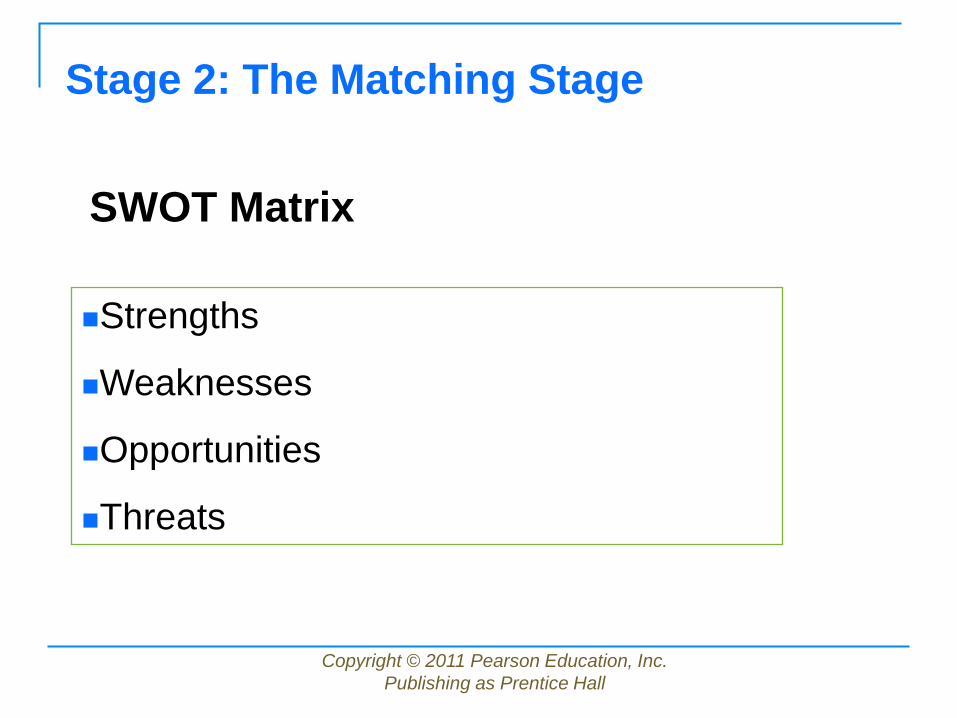
Strengths
Weaknesses
Opportunities
Threats
SWOT Matrix

Copyright © 2011 Pearson Education, Inc.
Publishing as Prentice Hall
SWOT Matrix
Strengths-Opportunities (SO)
Weaknesses-Opportunities (WO)
Strengths-Threats (ST)
Weaknesses-Threats (WT)
Four Types of Strategies
Copyright © 2011 Pearson Education, Inc.
Publishing as Prentice Hall
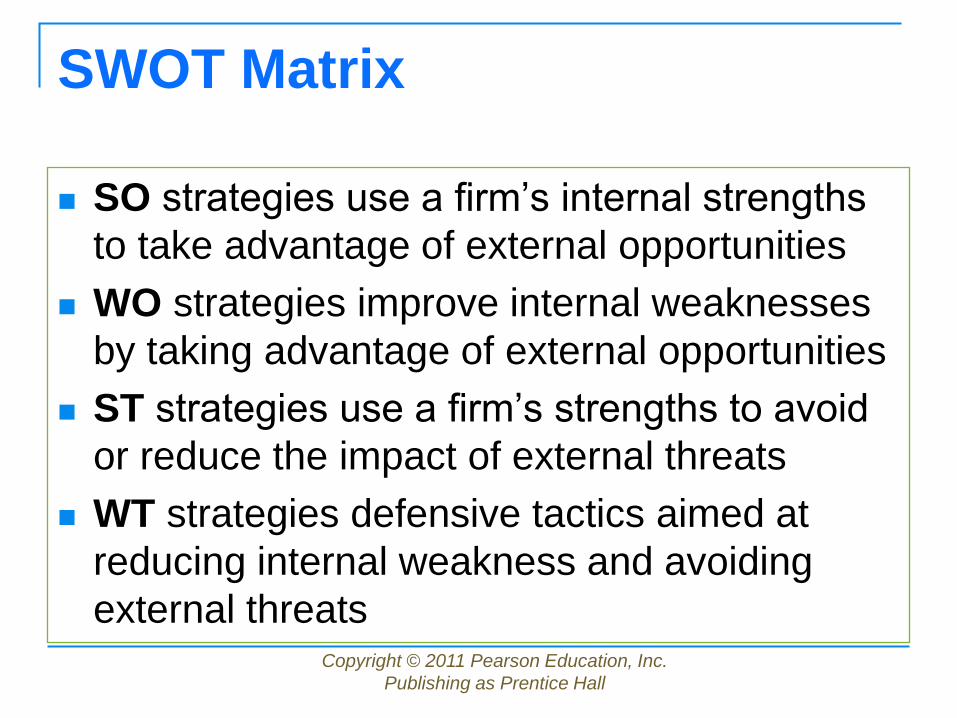
SWOT Matrix
SO strategies use a firm’s internal strengths
to take advantage of external opportunities
WO strategies improve internal weaknesses
by taking advantage of external opportunities
ST strategies use a firm’s strengths to avoid
or reduce the impact of external threats
WT strategies defensive tactics aimed at
reducing internal weakness and avoiding
external threats
Copyright © 2011 Pearson Education, Inc.
Publishing as Prentice Hall
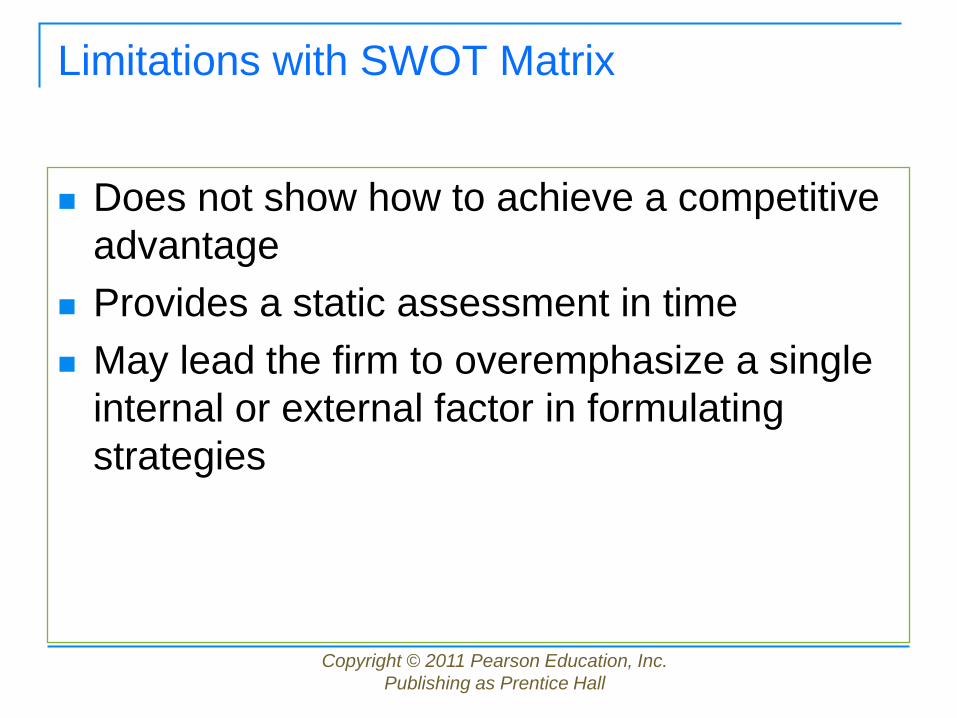
Limitations with SWOT Matrix
Does not show how to achieve a competitive
advantage
Provides a static assessment in time
May lead the firm to overemphasize a single
internal or external factor in formulating
strategies
Copyright © 2011 Pearson Education, Inc.
Publishing as Prentice Hall
Strategy-Formulation Framework
SWOT Matrix
SPACE Matrix
BCG Matrix
IE Matrix
Grand Strategy Matrix
Stage 2:
The Matching Stage
Copyright © 2011 Pearson Education, Inc.
Publishing as Prentice Hall
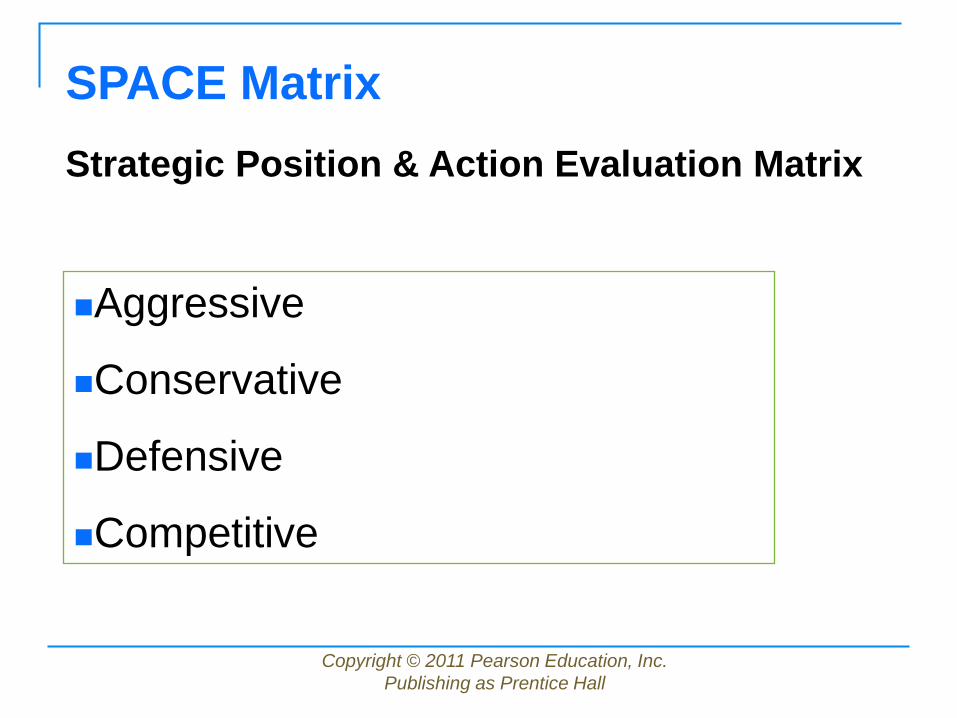
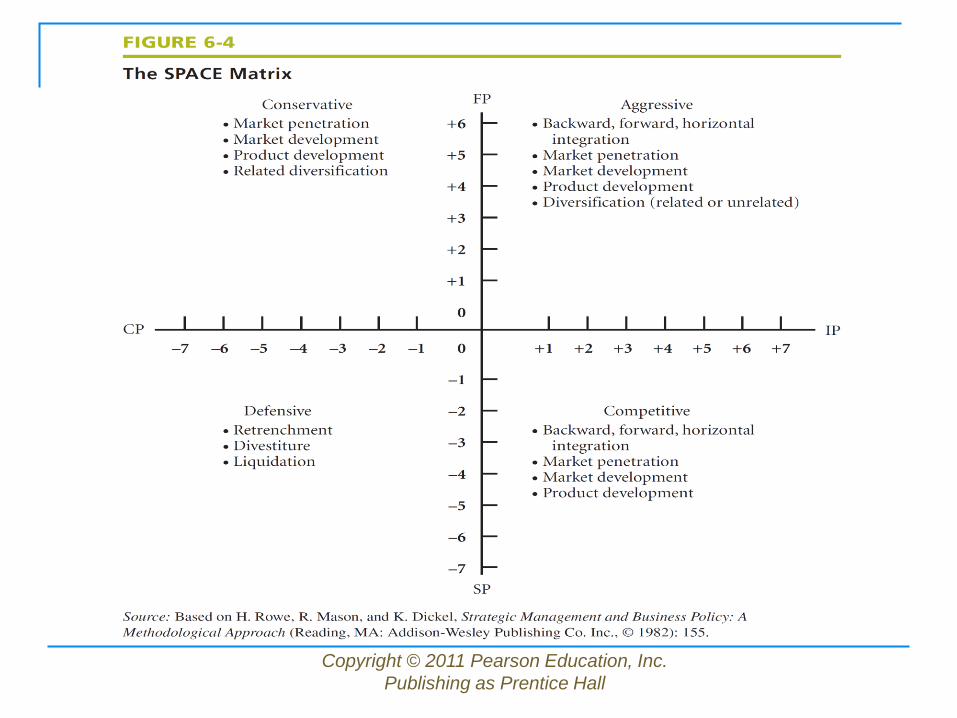
SPACE Matrix
Strategic Position & Action Evaluation Matrix
Aggressive
Conservative
Defensive
Competitive
Copyright © 2011 Pearson Education, Inc.
Publishing as Prentice Hall
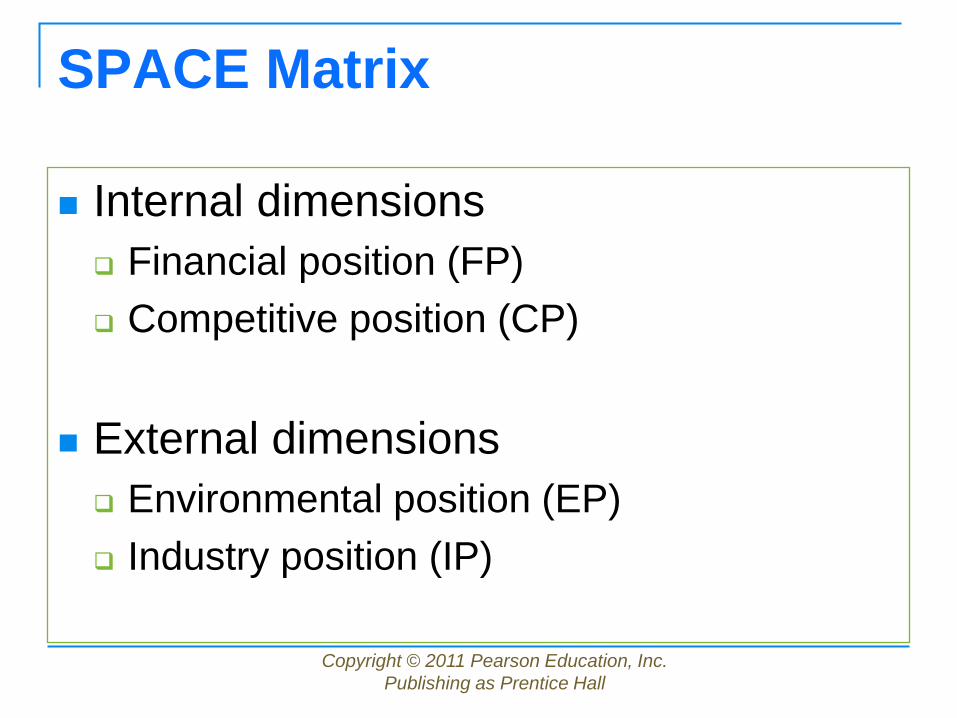
SPACE Matrix
Internal dimensions
Financial position (FP)
Competitive position (CP)
External dimensions
Environmental position (EP)
Industry position (IP)
Copyright © 2011 Pearson Education, Inc.
Publishing as Prentice Hall

Copyright © 2011 Pearson Education, Inc.
Publishing as Prentice Hall
Strategy-Formulation Framework
SWOT Matrix
SPACE Matrix
BCG Matrix
IE Matrix
Grand Strategy Matrix
Stage 2:
The Matching Stage
Copyright © 2011 Pearson Education, Inc.
Publishing as Prentice Hall
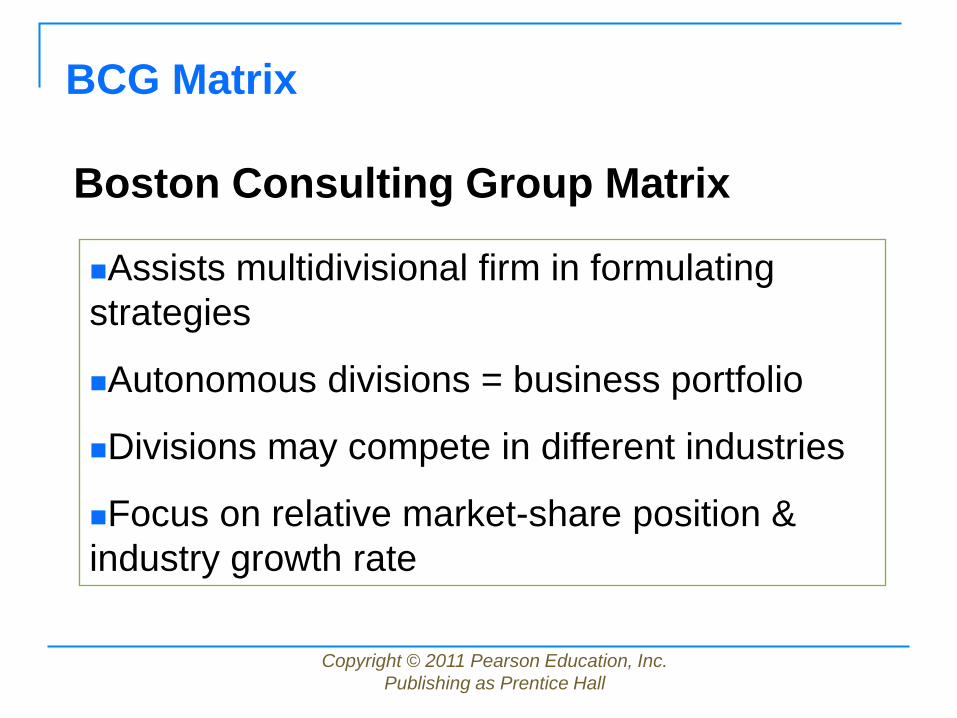
BCG Matrix
Boston Consulting Group Matrix
Assists multidivisional firm in formulating
strategies
Autonomous divisions = business portfolio
Divisions may compete in different industries
Focus on relative market-share position &
industry growth rate

Copyright © 2011 Pearson Education, Inc.
Publishing as Prentice Hall
BCG Matrix
Question Marks – low relative market share
in a high-growth industry
Stars – high relative market share in a high-
growth industry
Cash Cows – high relative market share in a
low-growth industry
Dogs – Low relative market share in a slow or
no growth industry

Copyright © 2011 Pearson Education, Inc.
Publishing as Prentice Hall
Copyright © 2011 Pearson Education, Inc.
Publishing as Prentice Hall
Strategy-Formulation Framework
SWOT Matrix
SPACE Matrix
BCG Matrix
IE Matrix
Grand Strategy Matrix
Stage 2:
The Matching Stage

Copyright © 2011 Pearson Education, Inc.
Publishing as Prentice Hall
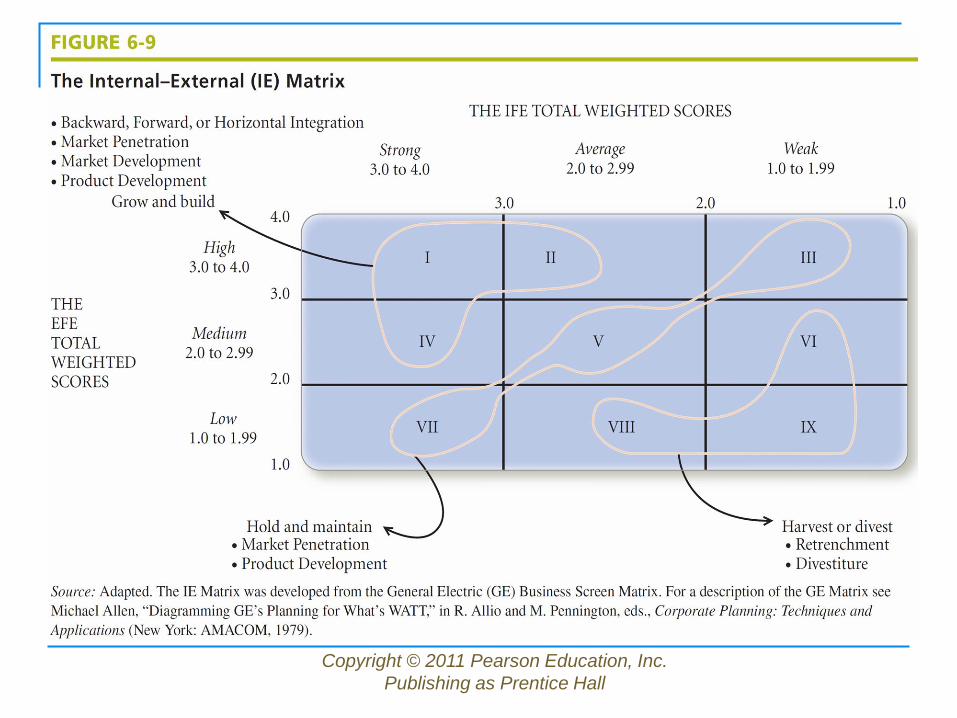
The Internal-External Matrix
Positions an organization’s various divisions
in a nine-cell display
Similar to BCG Matrix except the IE Matrix:
Requires more information about the divisions
Strategic implications of each matrix are different
Copyright © 2011 Pearson Education, Inc.
Publishing as Prentice Hall
Copyright © 2011 Pearson Education, Inc.
Publishing as Prentice Hall
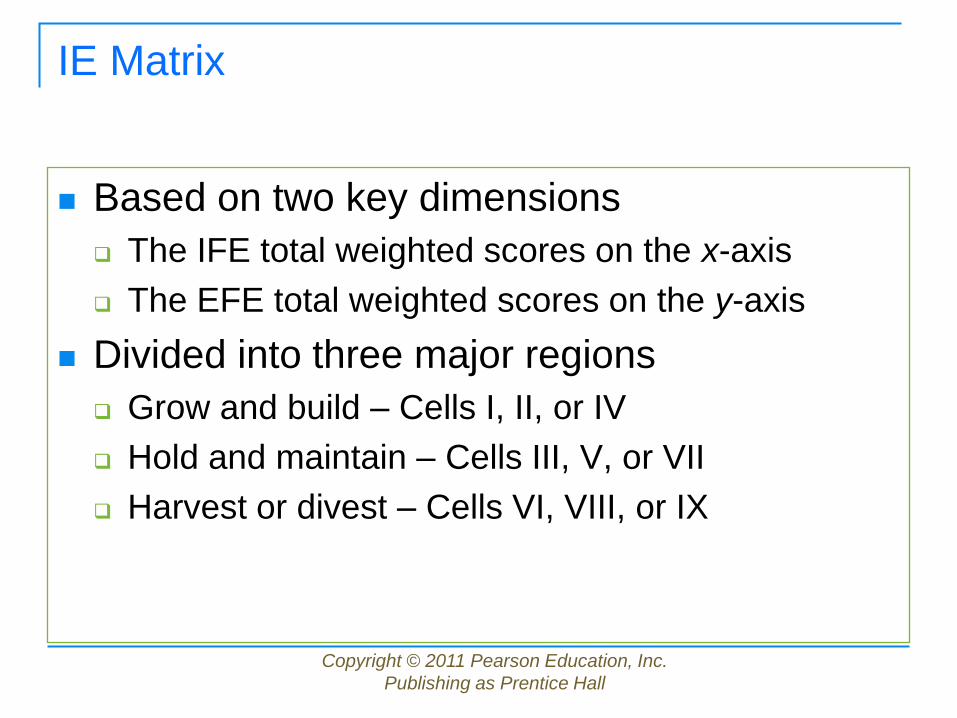
IE Matrix
Based on two key dimensions
The IFE total weighted scores on the x-axis
The EFE total weighted scores on the y-axis
Divided into three major regions
Grow and build – Cells I, II, or IV
Hold and maintain – Cells III, V, or VII
Harvest or divest – Cells VI, VIII, or IX

Copyright © 2011 Pearson Education, Inc.
Publishing as Prentice Hall
Strategy-Formulation Framework
SWOT Matrix
SPACE Matrix
BCG Matrix
IE Matrix
Grand Strategy Matrix
Stage 2:
The Matching Stage

Copyright © 2011 Pearson Education, Inc.
Publishing as Prentice Hall
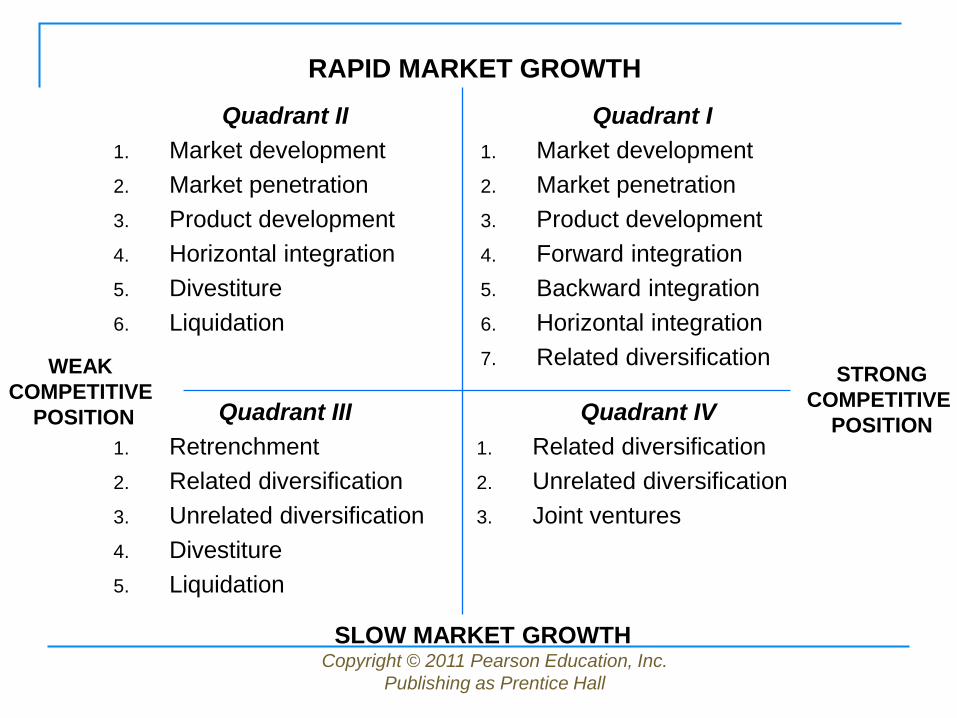
Grand Strategy Matrix
Tool for formulating alternative
strategies
Based on two dimensions
Competitive position
Market growth
Copyright © 2011 Pearson Education, Inc.
Publishing as Prentice Hall
Quadrant IV
1. Related diversification
2. Unrelated diversification
3. Joint ventures
Quadrant III
1. Retrenchment
2. Related diversification
3. Unrelated diversification
4. Divestiture
5. Liquidation
Quadrant I
1. Market development
2. Market penetration
3. Product development
4. Forward integration
5. Backward integration
6. Horizontal integration
7. Related diversification
Quadrant II
1. Market development
2. Market penetration
3. Product development
4. Horizontal integration
5. Divestiture
6. Liquidation
RAPID MARKET GROWTH
SLOW MARKET GROWTH
WEAK
COMPETITIVE
POSITION
STRONG
COMPETITIVE
POSITION

Copyright © 2011 Pearson Education, Inc.
Publishing as Prentice Hall
Grand Strategy Matrix
Excellent strategic position
Concentration on current
markets/products
Take risks aggressively when
necessary
Quadrant I

Copyright © 2011 Pearson Education, Inc.
Publishing as Prentice Hall
Grand Strategy Matrix
Evaluate present approach
How to improve
competitiveness
Rapid market growth requires
intensive strategy
Quadrant II

Copyright © 2011 Pearson Education, Inc.
Publishing as Prentice Hall
Grand Strategy Matrix
Compete in slow-growth industries
Weak competitive position
Drastic changes quickly
Cost & asset reduction
(retrenchment)
Quadrant III

Copyright © 2011 Pearson Education, Inc.
Publishing as Prentice Hall
Grand Strategy Matrix
Strong competitive position
Slow-growth industry
Diversification to more
promising growth areas
Quadrant IV
Copyright © 2011 Pearson Education, Inc.
Publishing as Prentice Hall
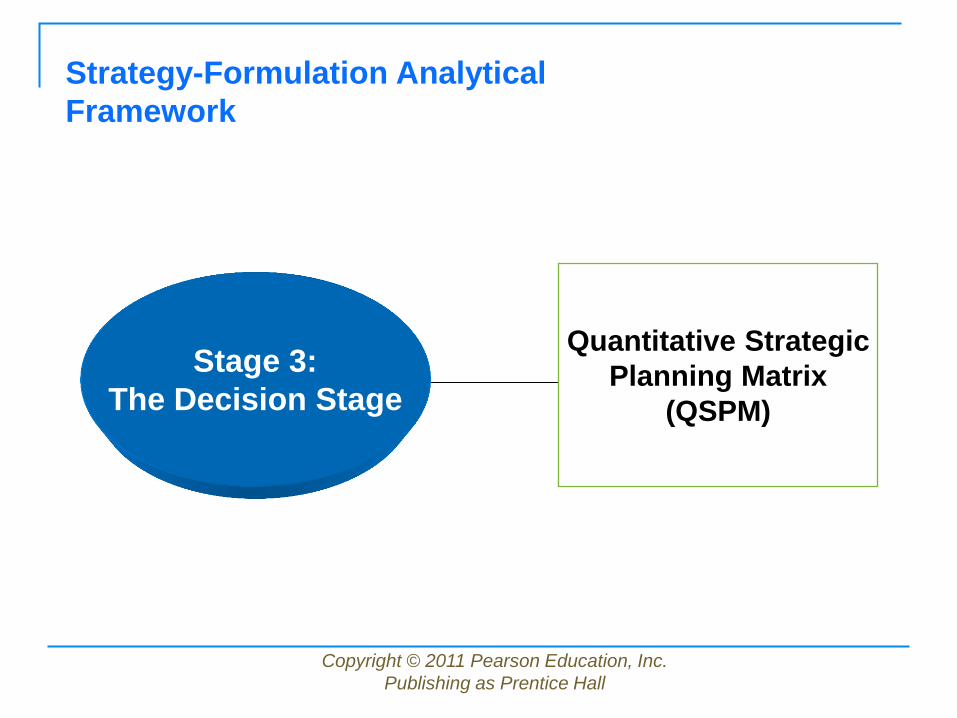
Strategy-Formulation Analytical
Framework
Stage 3:
The Decision Stage
Quantitative Strategic
Planning Matrix
(QSPM)

Copyright © 2011 Pearson Education, Inc.
Publishing as Prentice Hall
QSPM
Technique designed to determine
the relative attractiveness of feasible
alternative actions
Quantitative Strategic Planning Matrix

Copyright © 2011 Pearson Education, Inc.
Publishing as Prentice Hall
QSPM
Key Internal Factors
Management
Marketing
Finance/Accounting
Production/Operations
Research and Development
Management Information
Systems
Strategy 3 Strategy 2 Strategy 1 Weight Key External Factors
Economy
Political/Legal/Governmental
Social/Cultural/Demographic/
Environmental
Technological
Competitive
Strategic Alternatives
Copyright © 2011 Pearson Education, Inc.
Publishing as Prentice Hall
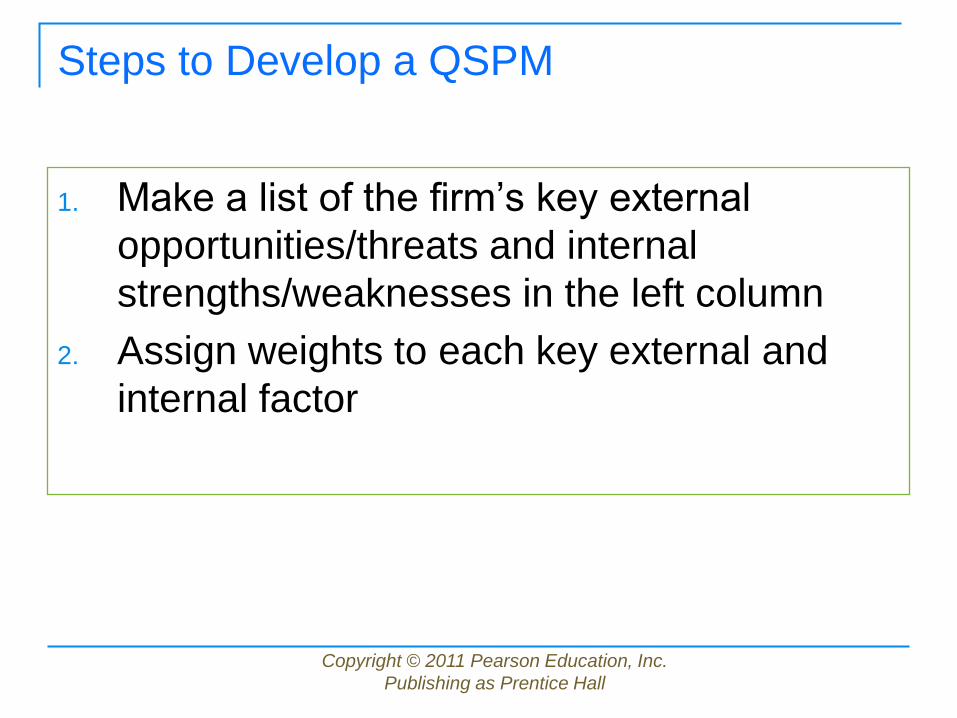
Steps to Develop a QSPM
1. Make a list of the firm’s key external
opportunities/threats and internal
strengths/weaknesses in the left column
2. Assign weights to each key external and
internal factor
Copyright © 2011 Pearson Education, Inc.
Publishing as Prentice Hall
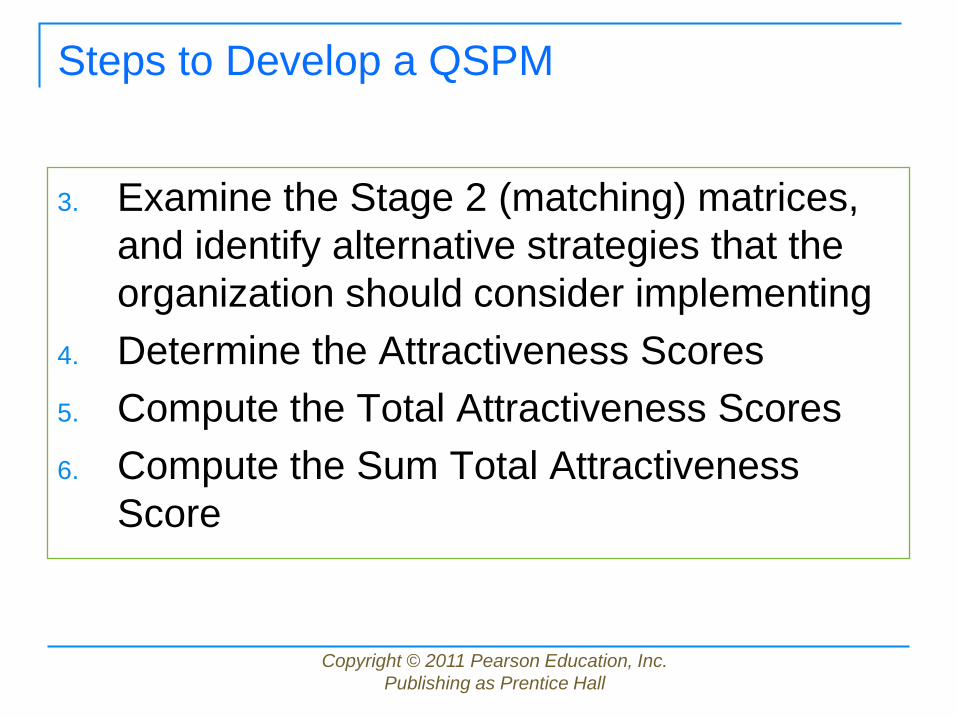
Steps to Develop a QSPM
3. Examine the Stage 2 (matching) matrices,
and identify alternative strategies that the
organization should consider implementing
4. Determine the Attractiveness Scores
5. Compute the Total Attractiveness Scores
6. Compute the Sum Total Attractiveness
Score
Copyright © 2011 Pearson Education, Inc.
Publishing as Prentice Hall
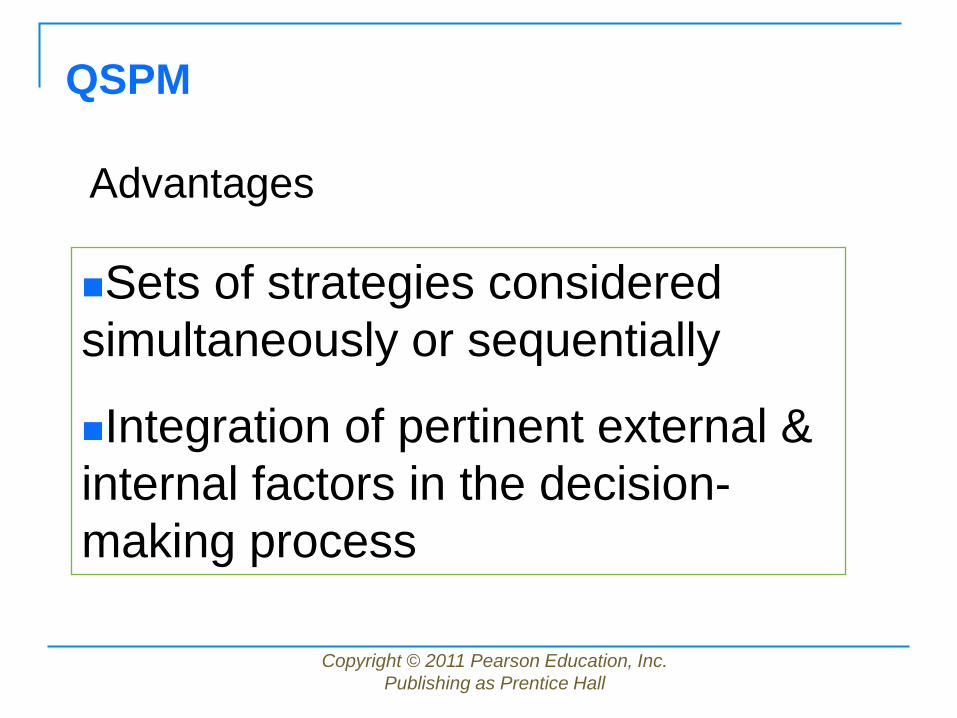
QSPM
Sets of strategies considered
simultaneously or sequentially
Integration of pertinent external &
internal factors in the decision-
making process
Advantages

Copyright © 2011 Pearson Education, Inc.
Publishing as Prentice Hall
QSPM
Requires intuitive judgments &
educated assumptions
Only as good as the prerequisite
inputs
Limitations

Copyright © 2011 Pearson Education, Inc.
Publishing as Prentice Hall
Cultural Aspects of Strategy
Choice
A set of values, beliefs, attitudes,
customs, norms, personalities,
heroes and heroines that describe a
firm
Successful strategies depend on
support of the firm’s culture
Organization Culture

Copyright © 2011 Pearson Education, Inc.
Publishing as Prentice Hall
Politics of Strategy Choice
Hierarchy of command
Career aspirations
Allocation of scarce resources
Politics in Organizations
Copyright © 2011 Pearson Education, Inc.
Publishing as Prentice Hall
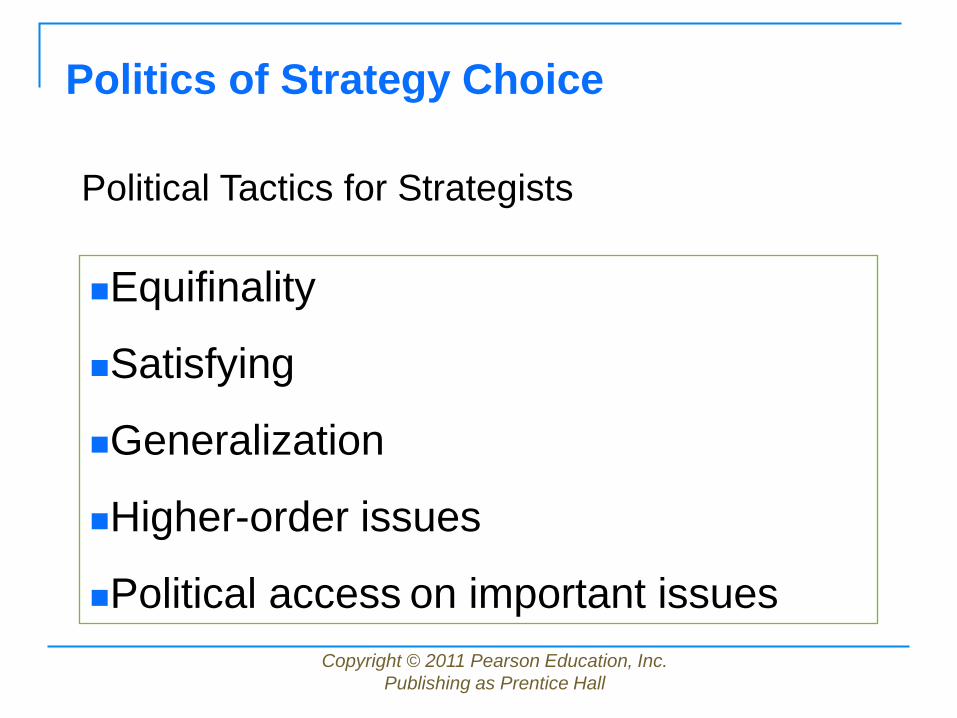
Politics of Strategy Choice
Equifinality
Satisfying
Generalization
Higher-order issues
Political access on important issues
Political Tactics for Strategists
Copyright © 2011 Pearson Education, Inc.
Publishing as Prentice Hall
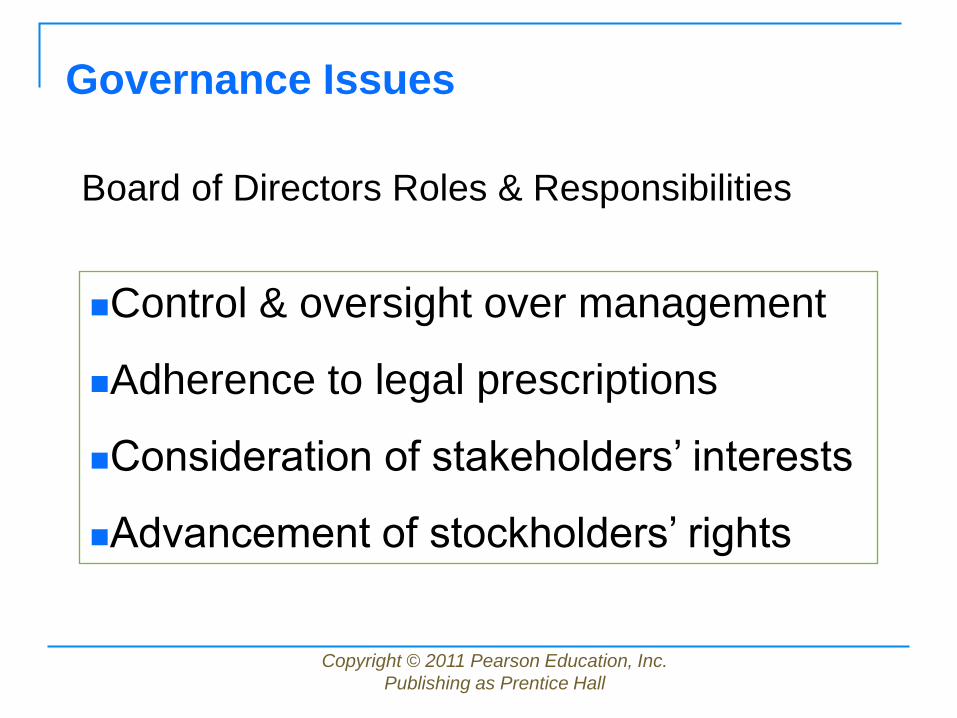
Governance Issues
Control & oversight over management
Adherence to legal prescriptions
Consideration of stakeholders’ interests
Advancement of stockholders’ rights
Board of Directors Roles & Responsibilities

Reference
David, Fred. R. (2009). Strategic
Management Concepts (12th ed.). Upper
Saddle River, NJ: Prentice Hall.
Copyright © 2011 Pearson Education, Inc.
Publishing as Prentice Hall


![[PPT]Pepsi Co. - University of Maine Systemperleybrook.umfk.maine.edu/.../BUS411/PepsiCo.pptx · Web viewBalance Sheet Financial ratios IFE Matrix Strategy Formulation SWOT Matrix](https://img.dokumen.tips/doc/110x75/5ad6d34d7f8b9a32618b8f24/pptpepsi-co-university-of-maine-viewbalance-sheet-financial-ratios-ife-matrix.jpg)