Embed Size (px)
Citation preview
CHAPTER 6: Karnataka case study summary
Tanya Seshadri, Gayatri Ganesh, Anil MH, Mahesh Kadammanvar, Maya Elias, Manoj Kumar Pati, Thriveni BS, Arun Nair, N Devadasan
The Karnataka context
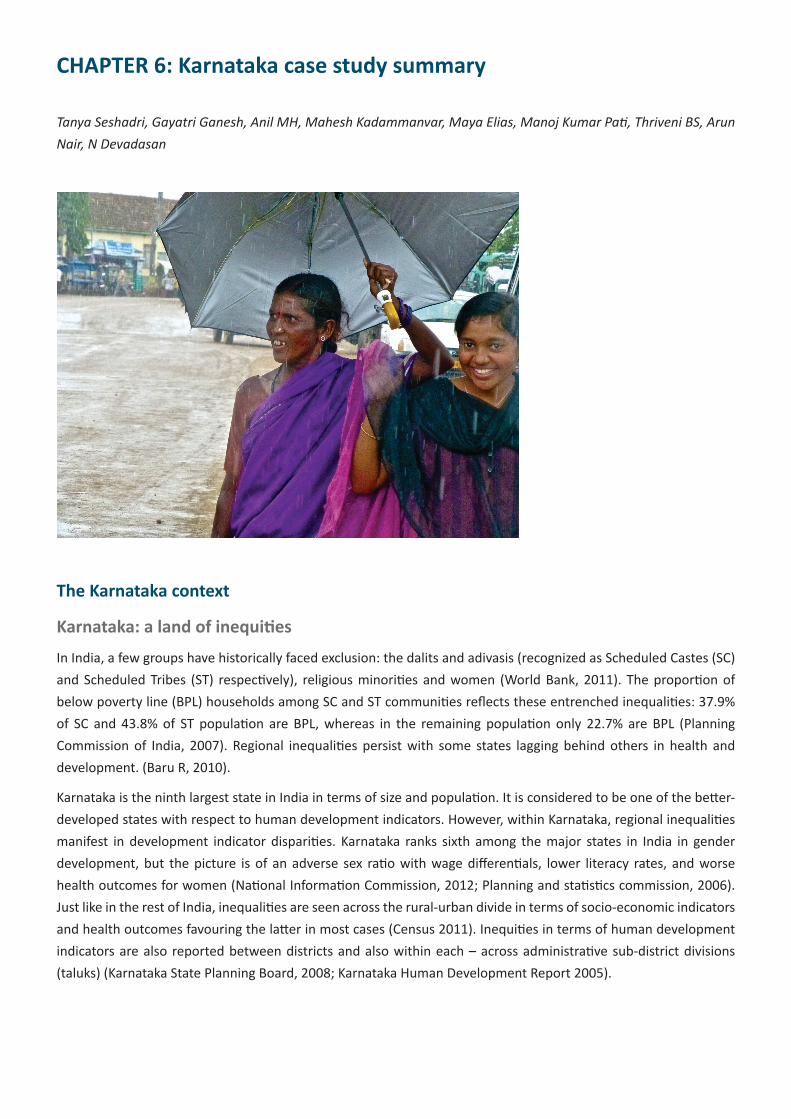
Karnataka: a land of inequities
In India, a few groups have historically faced exclusion: the dalits and adivasis (recognized as Scheduled Castes (SC) and Scheduled Tribes (ST) respectively), religious minorities and women (World Bank, 2011). The proportion of below poverty line (BPL) households among SC and ST communities reflects these entrenched inequalities: 37.9% of SC and 43.8% of ST population are BPL, whereas in the remaining population only 22.7% are BPL (Planning Commission of India, 2007). Regional inequalities persist with some states lagging behind others in health and development. (Baru R, 2010).
Karnataka is the ninth largest state in India in terms of size and population. It is considered to be one of the better-developed states with respect to human development indicators. However, within Karnataka, regional inequalities manifest in development indicator disparities. Karnataka ranks sixth among the major states in India in gender development, but the picture is of an adverse sex ratio with wage differentials, lower literacy rates, and worse health outcomes for women (National Information Commission, 2012; Planning and statistics commission, 2006). Just like in the rest of India, inequalities are seen across the rural-urban divide in terms of socio-economic indicators and health outcomes favouring the latter in most cases (Census 2011). Inequities in terms of human development indicators are also reported between districts and also within each – across administrative sub-district divisions (taluks) (Karnataka State Planning Board, 2008; Karnataka Human Development Report 2005).

Health financing in India: focus Karnataka
Health related expenditure, or ‘iatrogenic poverty’, is identified as a key reason for impoverishment in India with studies reporting that it affects nearly 2-3% of the population every year (Van Doorslaer, 2006; Central Bureau of Health Intelligence, 2011; Meessen B, 2003). In India, people contribute 71% of the total health expenditure through out-of-pocket (OOP) payments at the time of illness; while the federal, state and local governments combined contribute only 27% (High level expert group committee, 2011; Central Bureau of Health Intelligence, 2011). The high level of OOP expenditure by individuals is one of the highest reported among low- and middle-income countries. To address this issue, especially in rural India, the federal government launched the National Rural Health Mission in 2005, which aimed to increase the share of GDP spent on health from 0.9% to 3% thereby increasing resource allocation (Ministry of Health and Family Welfare, 2005). In addition, the federal and various state governments initiated different health insurance programmes targeted at various groups to provide social health protection, such as the Universal Health Insurance Scheme by the Ministry of Finance, Rashtriya Swasthya Bima Yojana by the Ministry of Labour & Employment (explained later), and Rajiv Arogyashri Yojna by the state government in Andhra Pradesh, etc.
In Karnataka, the picture is similar with the government spending only 28% of the total health expenditure (Karnataka Knowledge Commission, 2010). The recent budgetary allocation on health decreased to 3.4% in 2008-09, a decrease from 5.1% a decade earlier (Yareseeme AS, 2010). With high OOP expenditure and the risk of impoverishment, financial protection for the poorest section of society, i.e. below poverty line (BPL) households, was a priority; subsequently, the government introduced various financing schemes, listed below, for vulnerable sections of society, including a few health insurance schemes like Rashtriya Swasthya Bima Yojana and Vajpayee Arogyasri Yojana.
Rashtriya Swasthya Bima Yojana
In 2007, the Ministry of Labour and Employment, Government of India, launched Rashtriya Swasthya Bima Yojna (RSBY), translated as National Health Insurance Scheme, for BPL households with the aim of improving access for BPL households to quality medical care for treatment of conditions involving hospitalisation through an identified network of health service providers. The scheme is completely subsidised by the central and state governments and contribute 75% and 25% of the premium respectively. A nominal yearly adherence fee of Rs. 30 per five-member family is paid. A summary of the design of RSBY is provided in Figure 1.

Figure 1. Diagrammatic representation of RSBY programme
Claims
&
Reimbursement
(smart card)
Regist
ratio
n fee
–Rs 3
0
BPL familiesBPL families Public and PrivateProviders
Public and PrivateProvidersCARE
Hospitalisation expenses Select day care proceduresMax – 30,000 – family floaterTransportation costsMax 100 per trip and totally 1000Pre-hospitalisation (1 day) & Post-hospitalisation (5 days) expensesMinimum exclusions
Insurance companyInsurance company
Central government Central government
State governmentState government
Premium – 75%
Premium – 25%
Source: Devadasan N, 2008
As of December 2012, the scheme is functioning in twenty-six states and union territories covering 439 districts. Around 33.2 million households have been enrolled across the country with more than 12,500 hospitals empaneled and 4.3 million hospitalisations recorded. In Karnataka, RSBY was implemented from early 2010 and is administrated by the Department of Labour. Details of programme implementation in Karnataka are shown in Table 1.
Table 1. Status of RSBY implementation in Karnataka since launch
Policy year Year 1 Year 2
No. of districts 5 30
Geographical area covered Rural only Both rural and urban
Type of eligible households BPL households BPL and MNREGS beneficiaries
No. of eligible households 338,931 4,076,642
Enrolment rate 46.4% 41.2%
No. of hospitals empaneled Public 66 318
Private 113 478
Source: Karnataka status on RSBY website 2012
The Health Inc. team in Karnataka, led by the Institute of Public Health Bangalore aimed to identify the type of households and groups who are excluded from accessing RSBY at various stages of implementation, and we attempt to understand the mechanism of their exclusion. Ultimately, the goal of this research is to help make RSBY and similar programmes more inclusive.

Methods
We conducted our study in four districts of the southern Indian state of Karnataka as shown in Figure 2. We applied a mixed methods approach based on an explanatory sequential design (Creswell et al. 2003), making use of household surveys across four districts followed by in-depth interviews and focus group discussions with stakeholders.
Figure 2. Study districts shown on the Karnataka map
Source: Constructed with maps from Wikimedia commons, User:Planemad.
While the quantitative arm seeks to identify and quantify the exclusion faced by people at each step of RSBY implementation, the qualitative arm then takes the study to the next level to try and uncover the mechanisms of that exclusion.
Quantitative arm
We conducted a baseline household survey in four districts of Karnataka (Bangalore Rural, Belgaum, Mysore, and Shimoga) where RSBY was in its second round of implementation. Using the state government list of eligible households in 2011-12 as our sampling frame, we surveyed 6040 households across both rural and urban areas. We selected the study households using a multi-stage sampling strategy, first at the administrative sub-division (taluk) level, then at the Gram Panchayat (GP) (first level of government comprising a cluster of villages), and finally randomly sampling households within the GP. Based on the probability proportional to size approach, we sampled the required number of households at each level.
Through an initial baseline survey, we collected demographic, socio-cultural, economic and political characteristics of the households along with their engagement with RSBY. In three monthly follow-up surveys, we checked for hospital utilisation among all surveyed households. From households who had experienced hospitalisation, we collected information on their inpatient event through a semi-structured interview.
All questionnaires were administered in two local languages: Kannada (all districts) and Marathi (Marathi-speaking population in Belgaum district). Survey data at household and household-members levels were entered using Epidata v3.1 and analysed using SPSS v20. We prepared descriptive and inferential statistics to gain a preliminary idea about the interactions among the different variables across social, political, economic and cultural dimensions of social exclusion. Following this, we explored the interaction between certain variables, and also with outcome variables such as presence of awareness and being enrolled in RSBY. We selected multivariate analyses (logistic regression) to take this forward to identify possible predictors of exclusion. Identification of the key predictor variables mainly followed from the existing research questions of the study, literature review, and the initial preliminary analyses. This further helped frame specific hypotheses, like ST households are less likely to be enrolled in the scheme than general category households; households with political contacts/networks are more likely to be aware of the scheme than those without etc. (Katz HM, 1999; Menard S, 1995) (elaborated in chapter 8).
Qualitative arm
We used the preliminary quantitative findings from the household surveys to develop a matrix consisting of a basic social profile and the performance of RSBY implementation in each GP for all districts. We held additional discussions among a few excluded groups identified during the survey (such as with tribal communities, with women, and in areas with high migration). In total, we conducted 22 focus group discussions with eligible beneficiaries across the four selected districts. We also conducted in-depth interviews with stakeholders, including GP members, women self-help group leaders, local village administrators and implementers of RSBY, including field key officers, Third Party Administrators (TPA) and insurance company representatives (n=32).
Following informed consent, the discussions and interviews were audio-recorded while the researchers also took notes. Recordings were translated from the local language Kannada (and Marathi in Belgaum) to English, and then transcribed verbatim. The transcriptions and their translations were checked by the interviewers/moderators for errors. Three researchers coded these transcripts using deductive coding with an a priori coding frame (Miles & Huberman, 1994). The study team jointly devised a coding scheme based on the interview guides, background literature, hypotheses and preliminary findings from the quantitative survey. Periodically cross-checking each other’s work to maintain consistency, the team members coded the material and then further grouped material into emerging topics and themes in an iterative manner. Eventually, the qualitative findings were triangulated with the quantitative results.
The Institutional Ethics Committee of the Institute of Public Health Bangalore provided ethical approval to the study on 24 March 2012.
Results
Our study population consisted of 6040 households eligible for RSBY (5217 rural, 913 urban) comprising 33,117 people. The study was conducted across 15 sub-divisions of the four districts. The general profile of the study population is shown in Table 2. Only 9.1% of households belonged to religious minorities, while 32% households belonged to the disadvantaged social categories called Scheduled Caste (SC) & Scheduled Tribe (ST). The median household size was 5 ranging from 1-30. Around 40% of the population are dependents (age <18 and >60 years); 47.6% of the adult women never went to school, twice the proportion among men (26.5%). A similar pattern was also seen among earning patterns across the genders with 64.6% (nearly two-thirds) of adult women not earning,

nearly thrice the proportion among men (23.4%). Among the earners, 29.7% of the adults are casual wage labourers (37.3% among men, 21.9% among women). Another point to note is that a quarter of the study households do not speak Kannada (i.e. the state’s official language), which is used for information campaigns. The other common languages spoken are Marathi (11.5%, mainly in Belgaum) and Urdu (6.8%, mainly in urban areas) among others.
Table 2. General profile of study population
Characteristics Frequency Per cent (%)
Total number of households 6,040
Total population included 33,117
District Bangalore rural 499 8.3
Belgaum 3,018 50.0
Mysore 1,504 24.9
Shimoga 1,019 16.9
Religion Hindu 5,487 90.8
Muslim 431 7.1
Christian 17 0.3
Others 105 1.7
Social category General category 672 11.1
Other Backward Caste (OBC) 3,268 54.1
Scheduled Caste (SC) 1,378 22.8
Scheduled Tribe (ST) 553 9.2
Median household size 5 (1-30)
Household size Small (5 members or less) 3,772 62.5
Large (more than 5 members) 2,268 37.5
Age group Less than 18 years 10,067 30.4
18 – 59 years 19,515 58.9
60 years & above 3,535 10.7
Sex ratio (No. of females per 1000 males) 968
Adult literacy rate 57.7
Education
(18 years & above)
Never Went to School 8,497 36.9
Up to primary school 3,398 14.7
Up to high school 7,487 32.5
Above high school 3,668 15.9
Occupation
(18 years & above)
Not earning 10,062 43.7
Casual wage labourer 6,853 29.7
Self employed 4,963 21.5
Salaried 1,172 5.1
Kannada speaking households 4,412 73.0
Household has a ration card 5,801 96.0
Type of ration card ‘Poorest of poor’ BPL Card 527 8.7
BPL Card 4,395 72.8
APL Card 832 13.8
At least one member migrated for employment 423 7.0
We present the rest of our results as per the SPEC-by-step tool, highlighting the three steps of RSBY’s implementation (awareness, enrolment and utilisation) followed by a description of the type of people excluded at each step and a summary of the reasons for their exclusion.

Step 1: Exclusion from awareness of RSBY
Figure 3. Step 1: Exclusion from becoming aware of RSBY shown using the SPEC-by-step tool
At the first step, we found that 49 % of households were completely unaware of RSBY (i.e. never heard about the scheme and never seen the RSBY card) as seen in Figure 3. Even among those who were familiar with the scheme, awareness about the details of the scheme was patchy. Figure 4 shows the differences in details of awareness among the aware households. Three broad levels emerged: first, 41% who were only familiar with the scheme (i.e. heard about the scheme or seen the card only); second, 9% who were also aware of basic details about the scheme, like eligibility and purpose; and third, 1% who knew about the scheme’s benefits in detail. Furthermore, it was noted that awareness of the scheme did not imply awareness of the enrolment camp, while enrolling in the scheme did not imply awareness of details of how to receive the benefits or what the benefits of the scheme are. Poor depth of awareness of the enrolment camps and how to use the scheme are key barriers to enrolling and benefitting the scheme in the subsequent steps.
As per RSBY guidelines, Insurance companies (and third party administrators, TPA) are responsible for delivering the information, education and communication campaigns (IEC) to make people aware of RSBY and thereby enrol in the scheme. Field key officers (FKO) and Gram Panchayat (GP) members revealed that the camp organisers delegate this responsibility either to them or health workers a few days to a week prior to the enrolment camp with little-to-nil incentives. Nearly half of the households (44%) named the GP members or local officials as their informant about the scheme, followed by word-of-mouth from family or friends (23%) and from local health volunteers (19%).

Figure 4. Details of the scheme known to the aware households (n=3070)
The local socio-political networks are fraught with existing socio-political biases, and relying mainly on these local networks led to the same biases influencing how awareness was spread to all beneficiaries. Most of our discussions revealed that beneficiaries believe that local authorities/GP members mainly share the information within their socio-political networks. A common perception was that authorities tended to favour those whom they perceived to be politically useful–the term ‘useful’ implying being helpful in rallying political support for them or by doing odd jobs for them. The importance of socio-political networks is apparent at this step. When questioned about this perception, GP members/local authorities admitted that they did rely on their networks to get the information across. They reported that they used this strategy due to the short notice provided to them by the camp organisers and not due to vested interests. Both local authorities and health volunteers were provided minimal-to-nil incentives to undertake this work by the organisers. Given their own workload, their own poor awareness of the scheme, and the limited time given to them, they often resort to quick strategies, like spreading the information through their networks or amongst those residing near their office to get the minimum work needed done.
An occupational group found to be on the other side of the political radar were casual wage labourers. Discussions among the community revealed that casual wage labourers are largely unavailable during the day when often information is disseminated or discussions are conducted, prioritising the earning of their wages rather than participation in any local social or political work. Both the local authorities and the beneficiaries themselves recognise this as a reason why casual wage labourers often remain uninformed, but given their poor socio-political participation, they remain neglected.
Given the large number of households left out at this step, the main factors identified as key predictors of exclusion at this step mainly involve socio-cultural and political factors. Social category, language spoken and socio-political participation were identified as key determinants of exclusion at this step, with lower rates of awareness among proportions of non-native Kannada speaking households (45% v 53%), households that did not participate in local

politics (47% v 60%), and households residing more than 5 km from the nearest PHC (44% v 55%). Compared to other social categories, ST households recorded lower awareness rates (47% v 51%), while households in the lowest wealth quintile had poorer awareness when compared to the others (45% v 52%). Key factors are explored in detail in chapter 8, while the experience of ST households is reported in detail in chapter 14.
Step 2: Exclusion from enrolment in RSBY
Figure 5. Step 2: Exclusion from enrolling in RSBY shown using the SPEC-by-step tool
A total of 39% of households finally enrolled in the scheme as seen in Figure 5. This implies that 77% of the aware households enrolled in the scheme. The enrolment rates varied across the districts and across the taluks within a district (more details provided in chapter 8). In rural areas, the scheme was in its second year of implementation, but only 12% reported having enrolled in the previous round of enrolment. The urban enrolment rate was 44%, while the rural enrolment rate was 38%. During discussions, many reported that the main message of the information campaigns were details of the enrolment camp and not the benefits of the scheme. Only 1988 (84%) of enrolled households actually received the required smartcards for utilising the scheme (Figure 6). Of these, only a quarter received them at the camp as per guidelines, while another fifth (19%) received it after a month.

Figure 6. Details of the enrolment camp process (n=2372)
Similar to the step above, the limited lead time provided and reliance on local socio-political networks to inform, organise and even distribute cards after the camp often led to those not on the ‘political radar’ to miss out on the opportunity of enrolling in the scheme or receiving the cards. Of the 671 aware households that did not enrol, 52% reported that they did not know about the enrolment camp being conducted and hence missed the opportunity. Since the enrolment camp is organised on a particular day and time only at the local GP, those who were not available at the village, like casual wage labourers or migrants, have no alternate opportunity to enter the scheme.
During the camp, the discrepancies were often unrecorded, as many of the local organisers had limited-to-nil understanding of the scheme themselves, leading to misinformation being communicated to the beneficiaries (such as children were not eligible, only the head of household needs to enrol, etc.). In some cases from two districts, the camp organisers were reported to not speak the local language, which made communication with beneficiaries tedious and often led to errors in details on the card. Very few respondents reported technical glitches preventing them from receiving the card.
Following the camp, some local authorities and health workers reported poor incentives with high workload and, at times, non-payment of incentives as reasons for being disinterested in actively distributing the cards. Known social contacts and those who actively sought out the cards were given the cards, but those who did not were often not reached. In some villages, beneficiaries reported that local administrators used the cards as leverage to extract unpaid dues and, in some cases, bribes, thus dissuading locals from collecting their cards. Casual wage labourers and a few respondents from SC, ST communities reported being poorly treated by local authorities when they questioned them about schemes. Some reported being made to wait long hours to gain access to the people responsible, which meant having to forfeit their daily wage earnings.
Similar to the previous step, socio-cultural and political factors also determined the odds of enrolment into the scheme (in detail in chapter 8). Households headed by women and the elderly recorded lower enrolment rates than their counterparts (34% v 40%; 36% v 41%). Again, the social category of the household, especially ST households, and the lowest wealth quintile reported poorer enrolment rates in comparison to the other corresponding categories/quintiles (30% v 40%; 33% v 41%). The experience of the former is detailed in chapter 14 exploring the possible mechanisms for this exclusion. In chapter 8, we further explore the determinants of exclusion from enrolment.
Exclusion within the household
In RSBY as per design, up to five members can be registered on each card in a given household. In a large household (more than 5 members), some members are excluded by default. Among households with RSBY cards, 58% of household members (6,221 of 10,704) within these households reported to be registered on their cards; hence, they could potentially benefit from the scheme if hospitalised. Overall, this amounts to 19% of the total study population (33,117) as seen in Figure 5. Given RSBY’s cap on how many in a household can be covered, the term fully-covered is defined as up to 5 members registered on the card in a household. Only 50% of small-sized households (up to 5 members) and 31% of large households (more than 5 members) were fully covered based on this definition, bringing the average card size (average number of household members registered on one RSBY card) to 3.1 members (further elaborated in chapter 8).
Beyond the design, in many cases misinformation about eligibility and enrolment procedures appeared to lead to the exclusion of part of the household. In some large households, decisions on who would register were also looked into. In most instances, the highest earning member of the household (usually the oldest son) would take decisions on welfare schemes, and the women of the household had little to no say in whether they were enrolled. Our data suggests that gender, age and relationship to the head of the household determine one’s chances of being enrolled.
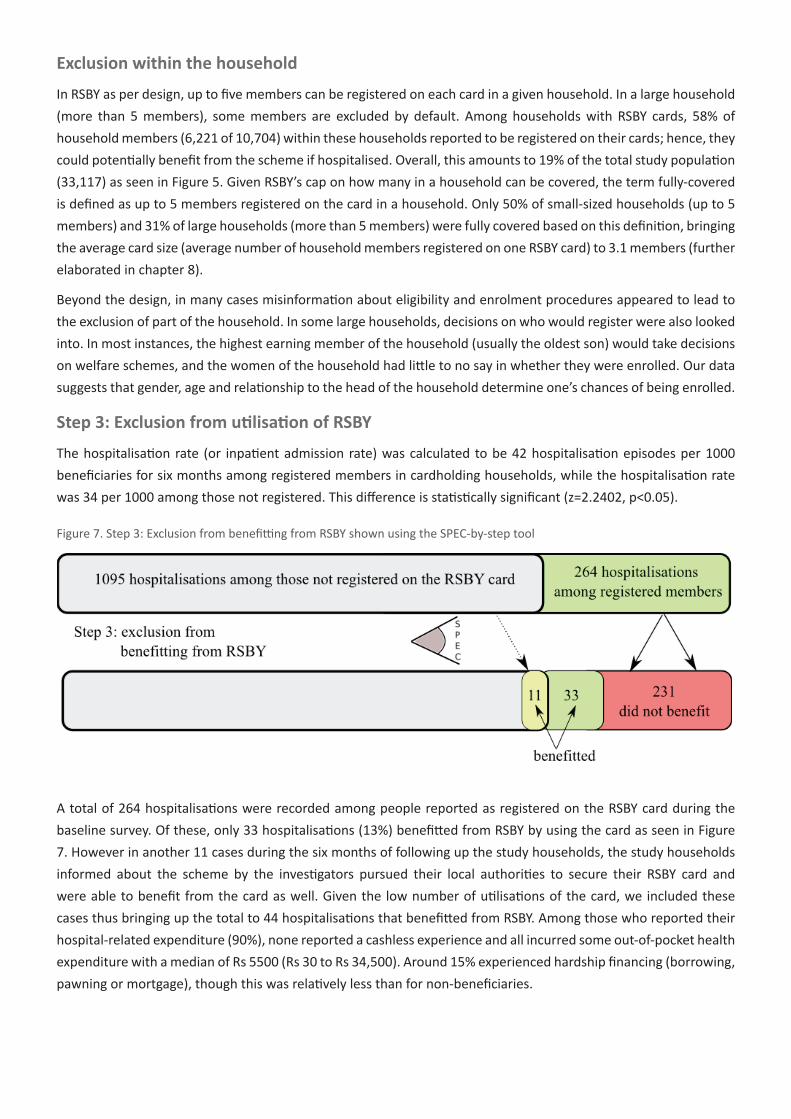
Step 3: Exclusion from utilisation of RSBY
The hospitalisation rate (or inpatient admission rate) was calculated to be 42 hospitalisation episodes per 1000 beneficiaries for six months among registered members in cardholding households, while the hospitalisation rate was 34 per 1000 among those not registered. This difference is statistically significant (z=2.2402, p<0.05).
Figure 7. Step 3: Exclusion from benefitting from RSBY shown using the SPEC-by-step tool
A total of 264 hospitalisations were recorded among people reported as registered on the RSBY card during the baseline survey. Of these, only 33 hospitalisations (13%) benefitted from RSBY by using the card as seen in Figure 7. However in another 11 cases during the six months of following up the study households, the study households informed about the scheme by the investigators pursued their local authorities to secure their RSBY card and were able to benefit from the card as well. Given the low number of utilisations of the card, we included these cases thus bringing up the total to 44 hospitalisations that benefitted from RSBY. Among those who reported their hospital-related expenditure (90%), none reported a cashless experience and all incurred some out-of-pocket health expenditure with a median of Rs 5500 (Rs 30 to Rs 34,500). Around 15% experienced hardship financing (borrowing, pawning or mortgage), though this was relatively less than for non-beneficiaries.

The common reasons cited for not using the card were ignorance of what the card was for, visiting a hospital not empanelled under RSBY, and forgetting to take the card for the hospitalisation, especially during emergencies. Most beneficiaries visited hospitals based on the perceived good reputation of the hospital, referral by doctors, or if near to their house (28%, 16% and 15% respectively) (data not shown). Given the small number of card utilisation, no significant patterns of social exclusion were identified, however some beneficiaries did report in the interviews that having social contacts in or related to the hospital facilitated their accessing appropriate services and hence, the scheme.
Conclusion
We found that exclusionary processes operate at all steps of implementation of the RSBY scheme. These exclusions are driven by social factors (age, gender, language, literacy), political factors (having political contacts), economic factors (being a daily wage earner, subsistence living, migrant labourers, inability to pay bribes), and cultural factors (religion, caste, tribal). Moreover, each step is intrinsically linked with the others so that exclusions in one stage have repercussions on others and vice versa. RSBY itself is not capable of addressing the existing exclusionary processes in society, with implementation often succumbing to these exclusions. Our data shows unequivocally how caste, gender, literacy, religion and socio-political networks influenced access to RSBY at all steps of implementation. By adopting a social exclusion lens, we have tried to uncover the exclusionary processes that impede access to RSBY.
Implementers and policy makers of RSBY should pay special attention to lapses in procedure that aid exclusion and focus on the inclusion of vulnerable groups, given that the scheme targets the lost, disadvantaged (socially, economically and politically) section of society in the first place. Overall, three core strategies emerged that we believe can significantly address the social exclusionary mechanism identified in the study. The first strategy is for the social health protection scheme (RSBY in this case) to make an explicit commitment to cover vulnerable groups that face socio-cultural, political and economic exclusion within the population they target. Second, it is key that such schemes involve civil society and community-based organisations in all stages of implementation of the scheme, starting from the planning itself. The third strategy involves strengthening the monitoring and evaluation processes to ensure redress of grievances from the grassroots to even service providers with transparency of processes and effective utilisation of implementation-related data to ensure informed reforms are made to the scheme on a continuous basis. Hence, the application of a social exclusion lens by policy makers and implementers can help transform existing social health protection schemes into more socially inclusive policies.
ReferencesBaru, R., Acharya, A., Acharya, S., Shiva Kumar A.K., & Nagaraj, K. (2010). “Inequities in access to health
services in India: caste, class and region.” Economic and Political Weekly 45(38): 49-58.
Central Bureau of Health Intelligence (2011). Chapter 9: Health finance indicators. National health profile of India: 143.
Creswell, J. W., Plano Clark, V. L., Gutmann, M. L., & Hanson, W. E. (2003). Advanced mixed methods research designs. In: Tashakkori, A. & Teddlie, C. (Eds.), Handbook of mixed methods in social and behavioral research. Thousand Oaks, CA: Sage
Devadasan, N., & Swarup, A. (2008). “Rashtriya Swasthya Bima Yojna: an overview.” IRDA Journal 6(4): 33-36.
Government of Karnataka (2006). Investing in human development: Karnataka Human Development Report 2005. Karnataka: Planning and Statistics department.
High Level Expert Group committee (2011). High-level expert group report in universal health coverage for India; Nov: 86-196

Karnataka state planning board (2008). Karnataka: a vision for development. Available from: http://www.karunadu.gov.in/spb/Reports/KVD15th%20Jan%20English.pdf.
Karnataka Knowledge Commission (2010). Status report by study group on delivery of health services. Bangalore: Karnataka Knowledge Commission.
Katz, H.M. (1999) Multivariable analysis. A practical guide for clinicians. 2nd ed. Cambridge: Cambridge University Press: 113-7.
Meessen, B., Zhenzhong, Z., Van Damme, W., Devadasan, N., Criel, B., & Bloom, G. (2003) “Iatrogenic poverty.” Tropical Medicine & International Health 8(7):581-84.
Menard, S. (1995) Applied logistic regression analysis. Sage University paper series on quantitative applications in the social sciences. Thousand Oaks, CA: Sage Publications.
Ministry of Health and Family Welfare (2005). National rural health mission: Framework for implementation 2005-12. New Delhi: 4-10.
Ministry of Labour & Employment (2012). Scheme status state wise: Karnataka. Rashtriya Swasthya Bima Yojna; Available from: http://www.rsby.gov.in/Statewise.aspx?state=29.
National Information Commission (2012). India at a glance. Know India; (Cited 2012 Dec 28). Available from: http://knowindia.gov.in/knowindia/profile.php?id=2.
Office of the Registrar General & Census Commissioner. Census of India 2011: Provisional population totals paper 2 of 2011: Karnataka.
Planning Commission of India (2007). Poverty estimates for 2004-05. Press information bureau (English press release) Mar 21 (cited 2011 Mar 24). Available from: http://pib.nic.in/newsite/erelease.aspx?relid=26316.
Preker, A., Langenbrunner, J., & Jakab, M. (2002). Rich-poor differences in health care financing. In: Dror, D., Preker, A. (Eds.). Social reinsurance: a new approach to sustainable community health care financing. Washington DC: The World Bank.
The World Bank (2011). Poverty and social exclusion in India. Washington DC: The World Bank: 8-30.
van Doorslaer, E., O’Donnell, O., Rannan-Eliya, R.P., Somanathan, A., Adhikari, S.R., Garg, C.C. , … Zhao, Y. (2006). “Effect of payments for health care on poverty estimates in 11 countries in Asia: an analysis of household survey data.” The Lancet 368:1357-64.
Yareseeme, A.S., & Aiyer, A. (2010) Analyses of expenditure on health by the government of Karnataka. Bangalore: Centre for budget and policy studies.


![Commerce and Industries Department - Kar and Industries Department, Government of Karnataka [1] 1. Executive Summary Karnataka is at the forefront of industrialization in the country](https://img.dokumen.tips/doc/110x75/5ab912467f8b9a28468da310/commerce-and-industries-department-and-industries-department-government-of-karnataka.jpg)