Embed Size (px)
Citation preview

123
CHAPTER 6
A HYBRID FRAMEWORK FOR ELEPHANT INTRUSION
DETECTION SYSTEM USING ELEPHANT
VOCALIZATION
6.1 INTRODUCTION
In this chapter, a method for detecting and tracking elephants along
the forest border areas using the vocal communication of elephants is
presented. Two approaches are used: one to find the spectral energy threshold
and the other to determine highest pitch frequency produced by elephants. A
threshold is identified for the two approaches; once the elephant vocal signals
crosses the limit an alert is sent to the forest officials notifying them about the
elephant intrusion. Some of the practical issues include the difficulty of
acquiring continuous vocal data and distinguishing elephant sound from other
sounds in the forest environment.
6.2 BACKGROUND
To explore the area of elephant vocalization, in this research work
the recordings of elephant call sounds are used to determine the movement of
elephants in the forest border areas. Elephants use vocalization to
communicate over short and long distances. The elephant vocalization
contains abundance of information about elephant social living. Asian
elephant calls can be categorized in to 4 basic types Trumpet, Roar, Chirp,
and Rumble (Nair et al 2009). The call type and frequency range used by

124
elephants are given in Table 6.1. Call signal frequency vary from 5 Hz to
10,000 Hz which includes harmonics also. Out of the 258 measurable
elephant calls described by (Nair et al., 2009), close to 30% are trumpets,
22%
Table 6.1 Call Type and frequency ranges of asian elephants
Call Type Frequency range(Hz)
Trumpet 405 5879
Roar 305 6150
Chirp (Squeak/Squeal) 313 3370
Rumble 10 173
Elephant uses calls in the context of play, disturbances, presence of
other species or vehicles, interactions within herds and during encounters with
other species. Rumbling is used as an information such as
calling, and greeting. Elephant vocalization can be established with
amplitudes of 112 dB at 1 m and 46 dB at 2,048 m (www.elephantvoices.org).
6.3 ELEPHANT SIGNAL DETECTION SYSTEM
Obtaining high quality, continuous recordings of elephant
vocalization in the wild is a difficult task. The recordings are done using a FM
system unit which contains a FM transmitter and a receiver at the base station.
The audio transmitter is placed in certain pockets where elephants enter into
human living areas from the forest. The FM transmitter is battery driven; the
device is tuned in such a way that it covers an average distance of about 20
meters with a frequency range of 102.3 MHz. The vocal signal is captured via
an audio mike, which converts any audio signal in to electrical variations and
is amplified with gain of 20 times the input signal. Sources of noise like wind

125
and vehicle were noted for filtering during data analysis. The audio input is
given to PC via an audio jack for elephant vocalization analysis. A custom-
written program in Matlab is used to detect the audio features of elephant
calls.
Two approaches are employed for the detection of elephant vocal
communication in the forest border areas.
1. Spectral Energy Thresholding
2. Pitch Frequency Determination
In the first method, the received elephant sound signals are
recorded as a .wav file in the PC and updated in a directory every 5 seconds;
the recorded elephant vocal signal sample is shown in Figure 6.1.
Figure 6.1 Elephant sound recorded sample
The wav file is converted to frequency vectors by FFT and filtered
by bandpass 8th order Butterworth filter and applied for spectral energy
thresholding. To estimate the spectral energy threshold the essential

126
bandwidth of the power spectrum is computed using a Hanning window (40
ms). The frequency that corresponds to the strongest magnitude is determined.
The highest power spectra magnitude obtained is set as the threshold value.
The process proceeds to the next step to calculate the highest pitch
frequency. The lowest frequency of the autocorrelation of each channel gives
an indication of the fundamental frequency component present in that channel
for the particular segment. Autocorrelation performed on each of the channels
with a window size of 40 ms is used, corresponding to N=128 samples in a
signal sampled at 3 kHz. The largest positive peak in the summed
autocorrelation is selected, and the corresponding pitch is calculated and the
time of pitch detection is noted. The pitch frequency threshold is determined
in this work to discriminate other animal sounds present in the wilderness.
Whenever both the spectral energy and pitch frequency crosses certain
threshold values an early warning is sent to the forest officials to take
necessary actions on approaching elephants.
In the first step preprocessing of audio signal is done by filtering
the unwanted signals present in the forest, such as sounds of birds, insects,
trees and wind. The best-known filter approximation is the Butterworth or
maximally-flat response approximation. It exhibits a nearly flat pass band
with no ripple. The Butterworth filter of order n is described by the magnitude
square of its frequency response
(6.1)
where n is the order of the filter, and can be any positive whole number (1, 2,
0 is the -3 dB frequency of the filter (Thede 2005). The transfer
function of for the normalized (De Silva & Kasun de Zoysa, 2009)
Butterworth filter of order 8 is

127
= (6.2)
represent c and the
c. The bandpass filter with transfer
function is given by
= | (6.3)
where and are the lower and upper cutoff frequencies for the
bandpass filter.
6.4 SPECTRAL ENERGY THRESHOLDING
The elephant signal has a unique spectrum associated with it. These
quantities are typically described in the time domain and for every function of
time, an equivalent frequency domain function can be found that specifically
describes the frequency-component in the frequency spectrum. A framework
is established in which elephant signals can be categorized in frequency
domain based on the analysis of
Pattern of energy over the frequency bands
Standard deviation of such energy distribution.
The first metric reveals the energy distribution of the flows over
frequencies. To determine the energy over bands of recorded elephant signal
the FFT is performed to determine the frequency component for the raw data.
It allows to efficiently estimate the frequency component in data from a
discrete set of values sampled at a fixed rate. Taking the square of the
magnitude of spectrum of elephant signal we obtain the energy in the signal.
In other words, it shows at which frequencies variations are strong and at
which frequencies variations are weak. The unit of PSD is energy per
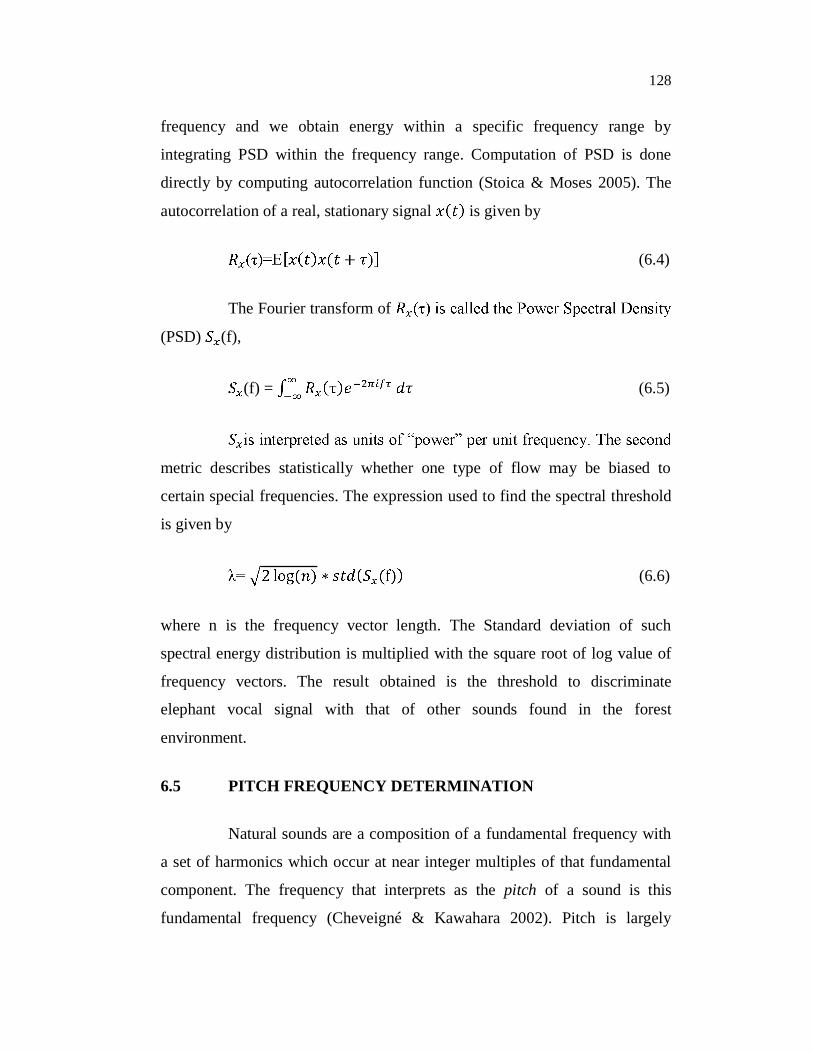
128
frequency and we obtain energy within a specific frequency range by
integrating PSD within the frequency range. Computation of PSD is done
directly by computing autocorrelation function (Stoica & Moses 2005). The
autocorrelation of a real, stationary signal is given by
(6.4)
The Fourier transform of
(PSD) (f),
(f) = (6.5)
metric describes statistically whether one type of flow may be biased to
certain special frequencies. The expression used to find the spectral threshold
is given by
(6.6)
where n is the frequency vector length. The Standard deviation of such
spectral energy distribution is multiplied with the square root of log value of
frequency vectors. The result obtained is the threshold to discriminate
elephant vocal signal with that of other sounds found in the forest
environment.
6.5 PITCH FREQUENCY DETERMINATION
Natural sounds are a composition of a fundamental frequency with
a set of harmonics which occur at near integer multiples of that fundamental
component. The frequency that interprets as the pitch of a sound is this
fundamental frequency (Cheveigné & Kawahara 2002). Pitch is largely
129
responsible for inflections in elephant calls used for communicating and
expressing itself. These inflections also play a role in allowing us to
consistently identify an elephant. Pitch is a perceptive quality that describes
the highness or lowness of a sound. For a harmonic signal this is the lowest
frequency in the harmonic series. The fundamental frequency can be deduced
from the other frequency components provided that they are integer multiples
of f0 (Larson & Maddox 2005). This work attempts to develop a pitch
tracking and detecting method to sense the movement of elephants in the
forest border areas. Although different methods have been proposed for
detecting pitch, the autocorrelation pitch detector is still one of the most
robust and reliable pitch detectors (Tan & Karnjanadecha, 2003). The
autocorrelation computation is made directly on the waveform and is fairly
straightforward in time consumption. For a non-stationary signal, such as an
elephant voice signal the changes are abrupt in time and aperiodic. Thus, it is
reasonable to define a short-time autocorrelation function, which operates on
short segments of the elephant signal given by,
(6.7)
where w(n) is an appropriate window for analysis, N is the section length
being analyzed, l is the number of signal samples used in the computation of
autocorrelation points. 40 ms window size and 200 samples at a 10 kHz
sampling rate per channel (Ellis & Lee, 2012) are taken as parameters.The
input elephant audio signal is expanded into 128 subband signals xl[n], l = 1:
: : 128. The amplitude of the first positive peak in the correlogram of each
channel gives an indication of the fundamental frequency component present
in that channel and the maximum amplitude of the positive peaks in the
correlogram gives an indication of the amount of noise present in the channel
for the analyzed segment. A summed correlogram is calculated by adding all
the autocorrelations of the selected channels together, forming large peaks

130
where peaks in individual channels coincide. The largest positive peak in the
summed correlogram is selected, and the corresponding pitch is determined.
The number of lag steps at which the first positive peak is located can be used
to determine the pitch of the input signal, P= Fs/s with Fs as the sampling
frequency of the input signal and s the number of lag steps before the first
positive peak occurs.
6.6 SPECTROGRAM
A spectrogram is a representation of how the frequency content of a
signal changes with time (Sen & Dengyun 2010). During regions of silence,
and at frequency regions where there is little energy, the spectrogram appears
white; dark regions indicate areas of energy - caused for example by vocal
fold closures, harmonics, or formant vibration in a speech signal. The
spectrogram is built from a sequence of spectra by stacking them together in
time and by compressing the amplitude axis into a 'contour map'. Wide-band
spectrograms are convenient for investigating characteristics of the vocal tract
filter: they highlight the vocal tract resonances by showing how they continue
to vibrate after a vocal fold pulse has passed through. Spectrograms are used
to identify phonetic sounds, to analyse the cries of animals, and in the fields
of music, sonar/radar, speech processing, etc. Spectrograms are usually
calculated from the time signal using the short-time Fourier transform
(STFT). The short-time Fourier transform (STFT) is a Fourier-related
transform used to determine the sinusoidal frequency and phase content of
local sections of a signal as it changes over time (Idicula et al 2013) and is
determined by
(6.8)
where x[n] is the input audio signal and w[n-m] is the hamming window
function. Spectrogram is used in this work to analyze elephant calls and to

131
demonstrate the difference in structure of elephant call with that of other
animal calls.
6.7 RESULTS
The field observations were carried out in the forest border areas in
Mettupalayam which host an elephant camp where 36 temple elephants and
18 kumki elephants were trained during the period of December 2013 to
February 2014 (Figure 6.2). The elephant calls were recorded for the
vocalization produced by three different Asian elephant one male and two
females. Recordings of vocalizations were made using Audacity voice
recorder software. Recordings were done using an audio microphone with
transmitter and a receiver connected to the PC via an audio jack pin.
Figure 6.2 Field testing
The elephants used in the work are trained elephants. When the
mahout gave a command to make calls, the elephants produced various types
of sounds. These sounds were recorded in the PC for further analysis.
Automated acoustic analysis was performed on vocalizations from elephant

132
sounds. Upon reception of calls the software developed runs to detect if an
elephant sound is made. For all measurements, vocalizations showed clear
fundamental frequencies (pitch) along with the spectral magnitude. The
algorithm is developed in such a way once the elephant call crosses the
predefined thresholds an early warning in form of GSM message is sent to the
forest officials. To test for various call types we used the recorded elephant
sample audio from the web site [www.elephantvoices.org].
6.7.1 Spectrogram Analysis
In this work the elephant calls were analyzed by visualizing using
spectrogram. The spectrogram of other sounds were also analyzed.
Spectrograms of calls were first annotated manually on Matlab and later
automatically extracted according to labeled segment boundaries. Sounds can
also be represented visually using spectrograms. Spectrograms have
frequency on the y-axis, time on the x-axis and represent loudness of sound
by the darkness of the display. Figure 6.3 shows a spectrogram of a typical
elephant trumpet.
Figure 6.3 Spectrogram of an elephant trumpet
Time (sec)0.5 1 1.5 2 2.5 3 3.5 4 4.5
0
0.5
1
1.5
2
x 104

133
The elephant produced trumpet at 14 Khz as shown in the
spectrogram. The harmonic nature is shown in the spectrogram. The elephant
trumpet produced twenty harmonics occurring from 0.1 s to 2.4s. The
spectrogram appears after 2.5s and up to 4.5s is the mirror image of the
spectrogram.
Figure 6.4 Spectrogram of an elephant roar
The elephant roar spectrogram was obtained at 9 KHz frequency.
The elephant roar produced twelve harmonics occurring from 0.1 s to 2.4s and
is shown in Figure 6.4.
Figure 6.5 shows a spectrogram for a Monkey signal. The
spectrogram was obtained at 18 KHz of frequency. More harmonics occurred
and each spectral content occurred for short period of time. The largest time
of signal identified is only of 0.6 seconds for the monkey signal.
Time (sec)0.5 1 1.5 2 2.5 3 3.5 4 4.5
0
0.5
1
1.5
2
x 104

134
Figure 6.5 Spectrogram of a monkey
Figure 6.6 Spectrogram of a bird chirp
Figure 6.6 shows a spectrogram for a bird chirp. The spectrogram
obtained at 5 KHz of frequency. More harmonics were produced. Single bird
spectral content occurred for 0.1 seconds of time. For a sound period of 2
seconds the bird produced 20 pitch variations.
Time (sec)0.5 1 1.5 2 2.5 3 3.5 4 4.5 5
0
0.5
1
1.5
2
x 104
Time (sec)0.2 0.4 0.6 0.8 1 1.2 1.4 1.6 1.8 2
0
1000
2000
3000
4000
5000

135
From the above spectrogram results it is evident that the total
harmonics produced and time of each harmonic for elephant vocal sound
differs from the other species.
6.7.2 Estimating Spectral Energy Thresholding
To determine the energy over the band power spectrum of the FFT
is calculated for the raw elephant signal data. The FFT allows to efficiently
estimate component frequencies in data from a discrete set of values sampled
at a fixed rate. A FFT spectrum is a relationship typically represented by a
plot of the power magnitude against frequency. The power spectrum of the
elephant trumpet signal is shown in Figure 6.7. From the fig it is observed that
the dominant frequency components of the signal lie in the range of 650 to
720 Hz with its peak at 687.3137 Hz at 3mW of power.
Figure 6.7 Power spectrum of an elephant trumpet
400 500 600 700 800 900 10000
0.5
1
1.5
2
2.5
3x 10⁻³ Power Spectrum of an Elephant
Frequency (Hz)

136
Figure 6.8 Power spectrum of an elephant rumble
The power spectrum of the elephant rumbles shown in Figure.6.8
depicts that the dominant frequency components of the signal lie in the range
of 10 to 90 Hz with its peak at 32.0029 Hz at 0.8mW of power.
Figure 6.9 Power spectrum of a tiger
0 10 20 30 40 50 60 70 80 90 1000
1
2
3
4
5
6
7
8x 10
-4 Power Spectrum of an Elephant
Frequency (Hz)
0 500 1000 1500 2000 25000
0.5
1
1.5
2
2.5
3
3.5
4x 10
-5 Power Spectrum of a Tiger
Frequency (Hz)

137
The power spectrum of a tiger sound is shown in Fig.6.9 in which
the highest spectral energy magnitude is obtained with 3.8 w in 236.4181 Hz.
The highest magnitude value is determined for each frequency vectors
Figure 6.10 Power spectrum of a bird chirp
The power spectrum of bird chirp is obtained and shown in Figure
6.10. The first highest spectral energy is obtained with 3.3mW at 1750Hz.
The estimated highest magnitude value is determined for each frequency
vector. To determine the spectral energy threshold equation (6.6) is used
which determines the variations in energy available in the given audio signal.
The estimated power spectrum magnitude values for different elephant sounds
are depicted in Figure.6.11. The graph shows that most of the elephant calls
produced energy threshold above 1.0 and some of them were below 1.0. Most
of the rumble, chirp and roar produced lesser threshold as they are made for
short distance communication among the herds.
0 500 1000 1500 2000 25000
0.5
1
1.5
2
2.5
3
3.5x 10
-4 Power Spectrum of a Bird Chirp
Frequency (Hz)

138
Figure 6.11 Estimated power spectrum threshold for elephant calls
The vocal signals of other species were also tested using this
approach. The other type of signals tested were bear, tiger, lion, monkey,
truck passing, human talk etc. These sound signals were got from websites
and some were recorded live. The estimate of spectral energy of other signals
is plotted and shown in Figure 6.12.
Figure 6.12 Estimated power spectrum threshold for other sounds
0
0.2
0.4
0.6
0.8
1
1.2
1.4
1.6
1.8
Spec
tral
ene
rgy
thre
shol
ding
Elephant Call Type
0
0.2
0.4
0.6
0.8
1
1.2
Spec
tral
ene
rgy
thre
shol
ding
Other Sounds

139
The spectral energy produced by cow and human talk have
threshold above 1.0. It is difficult to determine elephant signal in the presence
of other signals using power spectrum. So using only power spectra threshold
the system was not able to detect elephants. So the fundamental frequency
component i.e. the pitch as a feature vector to discriminate elephants from that
of other animals was used in this work which is explained in the next section.
6.7.3 Tracking Pitch Frequency
This work attempts to develop a pitch tracking and detecting
method to sense the movement of elephants in the forest border areas. The
elephant vocal signal samples were used to estimate the pitch frequency using
the algorithm. The pitch estimates were calculated from the fundamental
frequency in each of the channels. All pitch contour measurements obtained
on calls and call segments showed clear fo frequencies in this approach. An
elephant trumpet of duration 3 seconds was given to the pitch tracker which
detected a pitch frequency of 500.3314Hz at 1.6319s as shown in Figure 6.13.
Figure 6.13 Pitch Tracking for an Elephant Trumpet
0 0.5 1 1.5 2 2.5-1
-0.5
0
0.5
1
Time (s)
0 0.5 1 1.5 2 2.50
200
400
600
Time (s)
Pitch plot

140
The system was tested by giving real time recorded multi call types
produced by an elephant. The pitch frequency for the call type occurred at
0.87583s. The tracked pitch frequency was found to be 563.2706 Hz as shown
in Fig 6.14.
Figure 6.14 Pitch Tracking for an Elephant Multiple Call Type
The second segment of elephant calls were also tested in this work
which showed frequencies below 130 Hz and resembled rumbles. However,
from growls. An elephant rumble of duration 2 seconds was given to the pitch
tracker and the pitch occurred at 1.1726s with highest pitch tracked at a
frequency of 41.4827Hz as shown in Figure 6.15.
0 0.5 1 1.5 2 2.5 3 3.5 4 4.5-1
-0.5
0
0.5
1
Time (s)
0 0.5 1 1.5 2 2.5 3 3.5 4 4.50
100
200
300
400
500
600
Time (s)
Pitch plot

141
Figure 6.15 Pitch Tracking for a Rumble
An elephant rumble of duration 2 seconds was given to the pitch
tracker and an elephant rumble pitch occurred at 4.2921s. Highest pitch was
tracked at a frequency of 116.6795Hz as shown in Figure 6.16.
Figure 6.16 Pitch Tracking for a Recorded Rumble
The estimated various rumble pitch frequencies of elephants is
depicted in Figure 6.17 in which we can see the rumble frequencies of
infrasonic range is available from 30 Hz to 130 Hz.
0 0.2 0.4 0.6 0.8 1 1.2 1.4 1.6 1.8 2-1
-0.5
0
0.5
1
Time (s)
0 0.2 0.4 0.6 0.8 1 1.2 1.4 1.6 1.8 20
200
400
600
Time (s)
Pitch plot
0 1 2 3 4 5-1
-0.5
0
0.5
1
Time (s)
0 1 2 3 4 50
200
400
600
Time (s)
Pitch plot

142
Figure 6.17 Estimated pitch frequencies for different rumbles
Figure 6.18 Estimated pitch frequency for elephant call types
A comparison of obtained pitch frequencies for different call types
of elephants is done and is plotted in Figure 6.18. It was observed that most of
the call types produced sounds with fundamental frequency above 400 Hz and
less than 130 Hz. The sounds produced below 130 Hz were elephant call type
growl and rumbles which are low frequency call signals of elephants.
0
20
40
60
80
100
120
140
160
Rumble1 Rumble3 Rumble2 Rumble5 Rumble7 RecordedRumble
Rumble4 Rumble6
Pitc
h Fr
eque
ncy
Elephant Call Type - Rumble
0
200
400
600
800
1000
1200
Pitc
h Fr
eque
ncy
(Hz)
Elephant Call Type

143
Forest borders have got typical living creatures and these creatures
produce sounds for their communication. Such type of sounds will also be
taken as an input to the system and can produce false alarms. Filters cannot be
implemented for different frequencies. To solve this issue we tested the
algorithm developed by giving various animal sounds and other typical
sounds present in the forest borders. The sound samples were given to the
software developed which estimates the pitch frequency. A pitch frequency
comparison was made for different sound signals as shown below.
Figure 6.19. Pitch Frequency Tracking for Cow
The pitch frequency obtained for Cow is shown in Figure 6.19.
Pitch frequency for Cow occurred at 1.18s. Highest pitch was tracked at a
frequency of 129.8164 Hz. All the others are the harmonics in the pitch plot.
0 0.2 0.4 0.6 0.8 1 1.2 1.4 1.6-1
-0.5
0
0.5
1
Time (s)
0 0.2 0.4 0.6 0.8 1 1.2 1.4 1.60
200
400
600
Time (s)
Pitch plot

144
Figure 6.20. Pitch frequency tracking for tiger
The pitch frequency obtained for Tiger is shown in Figure 6.20.
Pitch frequency for Tiger occurred at 0.56018s. Highest pitch was tracked at a
frequency of 236.4181 Hz. All the others are the harmonics in the pitch plot.
Figure 6.21 Estimation of pitch frequency for other sound types
0 1 2 3 4 5 6 7 8 9-1
-0.5
0
0.5
1
Time (s)
0 1 2 3 4 5 6 7 8 90
200
400
600
Time (s)
Pitch plot
0
200
400
600
800
1000
1200
1400
1600
Pitc
h Fr
eque
ncy
(Hz)
Other Sound types

145
A comparison was made for pitch frequency of other sound types
and is shown in Figure 6.21. It was observed that most of the call types
produced sounds with fundamental frequency below 400 Hz. Some of the
sounds also produced pitch above 400 Hz which was undesirable for our
detection process and produced false alarms. But sounds of birds and wolf
produced higher frequency than elephant pitch frequencies. And also weak
elephant rumbles were not detected when their harmonic structure was lost,
and false alarms increased when the pitch of overlapping rumbles had to be
detected. So it was a challenge in discriminating the elephant signals and
other animal sounds. All these signals contain the fundamental frequency and
the harmonics. We tested the system in Mettupalayam elephant camp,
Coimbatore, India, and the system detected only the elephant sound signal.
6.8 HYBRID DETECTION PARAMETERS
From the above two methods it is decided to fix thresholds for
both the spectral energy and pitch frequency. These two
parameters combined together to discriminate elephant sound
signal from that of other animals in the presence of forest
noises such as sounds of birds , insects, trees and wind.
The spectral energy threshold was set to 1.0 and pitch
frequency threshold was set to 400 Hz and 130 Hz for
detecting elephants. Frequency in the range 400Hz to 800 Hz
were used to detect elephant call types like trumpet and roar.
The frequency below 130 Hz was used to detect elephant call
type like rumbles.
When the received audio signal crossed both the thresholds
the system will decide it is an elephant signal. Otherwise it
will not take a decision. This hybrid approach makes the

146
system effective in detecting elephant vocal signals. This
approach also reduces the false alarm.
6.9 ESDS GRAPHICAL USER INTERFACE
A GUI has been developed for the elephant detection system and is
shown in Figure 6.22. This is an automated system which records audio signal
every 5 seconds and tests for elephant signal. The elephant vocal signal is
detected using the hybrid approach. Once the signal received that of an
elephant, an early warning in form of GSM message is sent to the forest
officials.
Figure 6.22 GUI for elephant sound detection system
6.10 CONCLUSION
Elephants use vocalization for both long and short distance
communication. In this work, the vocal repertoire of wild Asian elephants in
southern India was examined. Elephants produce four types of calls namely,
trumpets, chirps, roars, and rumbles, based on quantitative analyses of their

147
spectral and temporal features. These calls were made by elephants in the
context of play, distress, disturbance, aggression, confusion, alarm and
contact calling within and among herds. The spectral and temporal features of
the four call types were used as a feature for detecting elephant even in the
presence of other animals and noise present in the forest. Two spectral
features, spectral energy thresholding and pitch frequency detection were used
in this work in discriminating and detecting the presence of elephants. The
analyses shown for the two methods demonstrate that both peak spectral
magnitude and peak frequency are used as parameters to discriminate
elephant sound signal from that of other sounds of animals, vehicles etc.
Based on the results presented for both the methods the peak spectral
magnitude was set to 1.0 and pitch frequency set from 400 Hz to 800Hz
bandwidth for detecting elephants. The algorithm has been developed such
that it also detects low frequency rumbles in the range of 20 to 130 Hz. In
conclusion, the analysis provides insights to protect elephants from human
activities and reduces the work effort of forest officials and provides solution
for human elephant conflict. The system is completely automated; the
strength of this approach stems from the ability to discriminate elephants
which is the key to avoiding false alarms.