Embed Size (px)
Citation preview

P:\Data\GEN\Lincoln\21307\PDF Documents\Chapter 5 PDF.doc 5-1
CHAPTER 5
WASTEWATER FLOW AND LOAD PROJECTIONS This chapter summarizes the historical flows and loads entering the City’s two wastewater treatment facilities and establishes flows and loading projections associated with anticipated growth. Terminology The terms and abbreviations used throughout this chapter and the remainder of this report are defined in the following paragraphs: Average Daily Flow (ADF). The average daily flow that passes through a facility on an annual basis is expressed as the average daily flow (ADF). The ADF for a particular year is defined as the average of the 365 daily flows treated at the facility. ADFs typically vary from year to year depending on weather conditions and population growth trends. An indication of the overall trend of flows on an annual basis can be observed by plotting these values. The ADF is typically used to determine the long-range planning requirements for wastewater treatment systems. Maximum Monthly Flow (MMF). The maximum monthly flow (MMF) is defined as the average daily flow rate for the 30-day period of maximum wastewater flow occurring within the evaluation period. The MMF is used in combination with the maximum month organic loading to determine design capacity of the organic treatment facilities. MMF is dependent on general climatic conditions, water use pattern in the community, size of the contributing population, and industrial water use patterns in the service area. Peak Daily Flow (PDF). Peak daily flow (PDF) represents the maximum flow entering the treatment facility during a single day. The PDF is used in conjunction with wastewater characteristics to determine aeration system size requirements. Peak Hourly Flow (PHF). The maximum flow entering the treatment facility over a one-hour period at any time during the evaluation period is defined as the peak hourly flow (PHF). Each storm event exhibits unique peak flow characteristics in the collection system that may affect the time and duration of the peak flow period at the treatment facility. The PHF is a combination of wet weather infiltration, direct storm water inflow (infiltration/inflow), and the normal contributions from domestic and industrial dischargers. This parameter is used to establish the hydraulic capacity requirements of pipes, lift stations, and treatment processes. Infiltration and Inflow (I/I). Infiltration and inflow is a term which describes water entering a wastewater collection system as the result of groundwater leaking into the system through leaking pipe joints or manholes and surface water entering the system through leaking manhole covers, roof drains connected to the system, etc.

P:\Data\GEN\Lincoln\21307\PDF Documents\Chapter 5 PDF.doc 5-2
Peak Wet Weather Flow (PWWF). For this evaluation, extremely high flows that occur in conjunction with an unusually large precipitation event are referred to as peak wet weather flows. These flows are greater than typical PHFs and may be handled in a different manner. Existing/Historical Flows Historical flows at the Theresa Street WWTP and the Northeast WWTP from 1978 through 2001 are shown in Table 5-1.
Table 5-1. Historical Wastewater Flows
Year
Theresa Street WWTF Average Daily Flow, mgd
Northeast WWTF* Average Daily Flow, mgd
Total Average Daily Flow, mgd
1978 21.9 -- 1979 22.0 -- 1980 20.1 -- 1981 17.4 4.5 21.9 1982 18.3 6.8 25.1 1983 18.8 6.6 25.4 1984 20.4 7.7 28.1 1985 16.5 6.8 23.3 1986 17.6 6.0 23.6 1987 20.1 5.7 25.8 1988 16.6 5.2 21.8 1989 16.7 5.3 22 1990 17.3 5.5 22.8 1991 17.5 5.3 22.8 1992 17.0 5.7 22.7 1993 20.2 7.4 27.6 1994 17.4 5.4 22.8 1995 20.3 5.4 25.7 1996 19.9 7.3 27.2 1997 18.9 5.0 23.9 1998 20.6 5.1 25.7 1999 18.0 6.4 24.4 2000 16.8 6.8 23.6 2001 19.3 5.1 24.4
*The Northeast WWTF began service in 1981.

P:\Data\GEN\Lincoln\21307\PDF Documents\Chapter 5 PDF.doc 5-3
The flows shown represent ADF in mgd. Over the period from 1978 to 2001, ADFs at the Theresa Street WWTP declined slightly over this period due to a City program to reduce I/I, the Northeast WWTP coming on-line in 1981, and the cessation of operation by three large industrial dischargers. The low flows experienced from 1988 through 1992 may be attributed to the drought conditions experienced in the area during that time. The higher than normal flows in 1987 and 1993 were the result of significant rainfall events and generally wetter than normal conditions. These historical flows are shown graphically in Figure 5-1. As illustrated in Figure 5-1, the average daily flows for both facilities combined have not increased significantly over the last twenty-two years; though the population has increased from 172,000 in 1980 to 226,000 in 2000. Assuming a typical wastewater contribution of 115 gallons per capita per day (gpcd), the total wastewater flow should have increased by approximately 6.2 mgd. As this did not occur, it is speculated that other contributors to wastewater flow must have decreased. Research confirms that I/I has decreased due to collection system repair efforts, per capita flows have decreased due to water conservation efforts, and industrial wastewater discharges have decreased. These factors have combined to produce the flow reductions observed. Design dry weather flow rates have been developed based on historical flow data shown in Table 5-1, the current service population data, and the relationships between ADF and PHF presented in Table 4-3. These design dry weather flow values are shown in Table 5-2.
Table 5-2. Design Dry Weather Flow Values Parameter Theresa Street WWTF Northeast WWTF Average Daily per Capita Dry Weather Flow 105 105 Maximum Month Peaking Factor (MMF/ADF) 1.11 1.15 Peak Hour Peaking Factor (PHF/MMF) 1.74 1.70
Wet Weather Flows Even though considerable effort has been made to reduce I/I, large storm events still have a significant impact on the maximum flows at both wastewater treatment facilities. Over the past fifteen years, the PWWF received at both the Theresa Street and Northeast WWTFs occurred on July 24, 1993 following a rainstorm that produced 2.23 inches of precipitation. The PWWF received at the Theresa Street was approximately 83 mgd and at Northeast facilities it was about 24 mgd. The PWWF experienced on July 24, 1993 resulted from a series of storm events. On July 23, 1993, the day before the PWWFs were recorded, Lincoln received approximately 1.75 inches of rainfall. As a result of the storm on the 23rd, it is estimated that Theresa Street was already receiving approximately 11 mgd above normal dry weather flows when the storm on the 24 th occurred. The peak flow received at the Theresa Street facility on the 24th was estimated to be 83 mgd. Because the magnetic flow meter at the lift stations was set to read a maximum flow of 80 mgd, this peak flow was not precisely measured. The 83 mgd flow rate persisted for between one and two hours before subsiding to less than 80 mgd.

File: Fig 5-1through 5-12.xlsTab: Fig 5-1 AAWF
Figure 5-1Average Annual Wastewater Flow
0
5
10
15
20
25
30
1981
1982
1983
1984
1985
1986
1987
1988
1989
1990
1991
1992
1993
1994
1995
1996
1997
1998
1999
2000
Was
tew
ater
Flo
w (
MG
D)
Theresa St. WWTF
Northeast WWTF
Total CITY OF LINCOLN
Lincoln Wastewater SystemFacilities Plan Update
Legend

P:\Data\GEN\Lincoln\21307\PDF Documents\Chapter 5 PDF.doc 5-5
The flows experienced as a result of the July 24, 1993 storm indicate that the PWWF factors for both the Theresa Street and Northeast WWTFs can be over four times the ADF. Projecting future PWWF values based on the 1993 PWWFs is somewhat conservative because it assumes that the level of I/I experienced from the addition of new service areas will be similar to that which occurs within the historical service area. In fact, the level of I/I occurring within newly developed service areas will likely be significantly lower than that from older areas due to better materials and techniques used in new construction. For the purpose of establishing wastewater treatment facility design treatment capacities, it is recommended that the PHF to MMF ratios presented in Table 5-2 be used to establish treatment system capacities. Peak flows exceeding the design treatment system capacities should be handled separately with a peak wet weather flow system. Historical Wastewater Composition The most significant wastewater characteristics to consider when evaluating a wastewater treatment facility are the influent and effluent values for 5-day biochemical oxygen demand (BOD5), total suspended solids (TSS), COD, and total Kjeldahl nitrogen (TKN). Information on these parameters is needed to evaluate specific process units within the overall treatment facility. Maximum BOD5, TSS, and TKN loading must be determined to ensure proper sizing of treatment units. Maximum month BOD5 loading is used as a design parameter to ensure the facility will meet its effluent permit limits for BOD5. Determining a maximum day BOD5 loading ensures that the aeration system is designed with sufficient capacity. Maximum month TSS loading must be determined to ensure that primary solids handling processes are properly sized. Determining maximum month TKN loading ensures that the facility is designed to meet its effluent permit limitations for ammonia. Finally, peak ammonia loading information is used to determine peak oxygen requirements for the aeration system. This section summarizes historical trends for each of these wastewater characteristics at the Theresa Street and Northeast WWTFs. Theresa Street WWTF Influent Wastewater Composition. Figures 5-2 and 5-3 show the historical trends of influent BOD5 at the Theresa Street facility from 1987 to the present. Figure 5-2 shows the monthly average influent BOD5 concentration in mg/L. This plot shows a trend of increasing influent BOD5 concentrations coinciding with drought conditions in 1987 and 1989. Figure 5-3 indicates the monthly average BOD5 loading in terms of pounds per day. It shows that there has been an increase in BOD5 loading to the facility over time. Figure 5-4 shows that monthly TSS loads have also been increasing; however, the rate of increase is not as extreme as that for BOD5. The term BOD5 loading refers to the quantity of BOD5 entering the treatment facility on a daily basis.

File: Fig 5-1through 5-12.xlsTab: Fig 5-2 AIBOD-T Street
Figure 5-2Monthly Average Influent BOD & COD Concentrations
Theresa Street WWTP
y = 0.2629x + 206.68
y = -0.8658x + 666.47
180
220
260
300
340
380
420
460
500
540
580
620
660
700
740
1987
1988
1989
1990
1991
1992
1993
1994
1995
1996
1997
1998
1999
2000
mg
/l
INF BOD INF COD
Linear (INF BOD) Linear (INF COD)CITY OF LINCOLN
Lincoln Wastewater SystemFacilities Plan Update
Legend

File: Fig 5-1through 5-12.xlsTab: Fig 5-3 BOD5 - TS WWTF (ppd)
Figure 5-3Historical BOD5 Monthly Average Loading
Theresa Street WWTP
y = 59.801x + 30022
0
10,000
20,000
30,000
40,000
50,000
60,000
70,000
1987
1992
1997
BO
D5
(pp
d)
Year
CITY OF LINCOLN
Lincoln Wastewater SystemFacilities Plan Update

File: Fig 5-1through 5-12.xlsTab: Fig 5-4 TSS (ppd) - Theresa St.
Figure 5-4Historical TSS Monthly Average Loading
Theresa Street WWTF
0
10,000
20,000
30,000
40,000
50,000
60,000
70,000
80,000
1987
1992
1997
TS
S (
pp
d)
Year
CITY OF LINCOLN
Lincoln Wastewater SystemFacilities Plan Update

P:\Data\GEN\Lincoln\21307\PDF Documents\Chapter 5 PDF.doc 5-9
Average 1995-2001 BOD5, TSS, and TKN data for the Theresa Street WWTF are shown in Table 5-3.
Table 5-3. 1995 - 2001 Theresa Street WWTF Influent Characteristics
Parameter Values BOD5 Annual Average 240 mg/L Maximum 30-Day Average 300 mg/L TSS Annual Average 270 mg/L Maximum 30-Day Average 430 mg/L TKN Annual Average 35 mg/L Maximum 30-Day Average 45 mg/L
The values shown in Table 5-3 will be used in this facilities plan update to project future loading at the Theresa Street WWTF. Northeast WWTF Influent Wastewater Composition. Figures 5-5 and 5-6 show the historical trends of influent BOD5 and TSS concentrations entering the Northeast WWTP. Figures 5-7 and 5-8 show historical BOD5 and TSS loading trends occurring between 1988 and 2000. Like the Theresa Street WWTP, influent BOD5 loads at the Northeast WWTF have increased with time. In contrast with Theresa Street, TSS loads at Northeast have actually decreased over time. Average BOD5, TSS, and TKN data for the time period from 1995 to 2001 at the Northeast WWTF are shown in Table 5-4.
Table 5-4. 1995 - 2001 Northeast WWTF Influent Characteristics
Parameter Values BOD5 Annual Average 180 mg/L Maximum 30-Day Average 250 mg/L TSS Annual Average 200 mg/L Maximum 30-Day Average 400 mg/L TKN Annual Average 30 mg/L Maximum 30 Day Average 40 mg/L
The values shown in Table 5-4 will be used in this facilities plan update to project future loading at the Northeast WWTF.

File: Fig 5-1through 5-12.xlsTab: Fig 5-5 Infl BOD COD NE WWTP
Figure 5-5Historical Monthly Average Influent BOD & COD Concentrations
Northeast WWTF
100
140
180
220
260
300
340
380
420
460
500
540
580
620
660
700
740
780
820
1988
1989
1990
1991
1992
1993
1994
1995
1996
1997
1998
1999
2000
Year
BO
D &
CO
D, m
g/L
#INF BOD INF CODCITY OF LINCOLN
Lincoln Wastewater SystemFacilities Plan Update
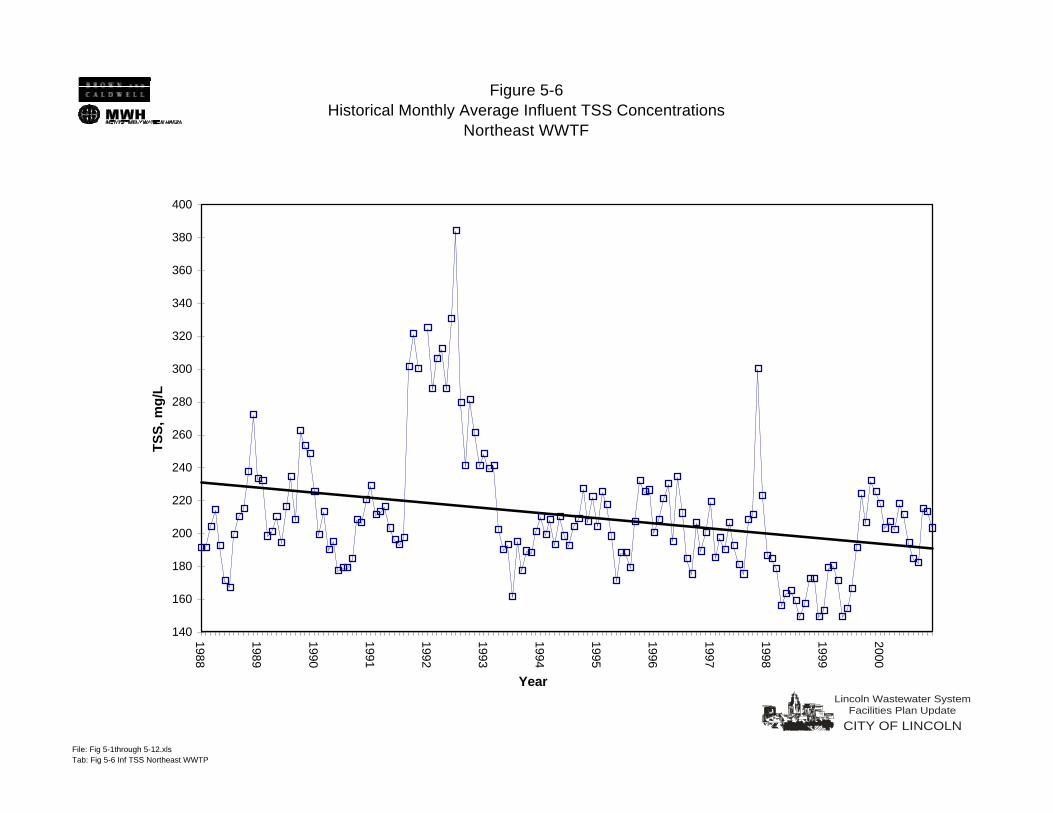
File: Fig 5-1through 5-12.xlsTab: Fig 5-6 Inf TSS Northeast WWTP
Figure 5-6Historical Monthly Average Influent TSS Concentrations
Northeast WWTF
140
160
180
200
220
240
260
280
300
320
340
360
380
400
1988
1989
1990
1991
1992
1993
1994
1995
1996
1997
1998
1999
2000
Year
TS
S, m
g/L
CITY OF LINCOLN
Lincoln Wastewater SystemFacilities Plan Update

File: Fig 5-1through 5-12.xlsTab: Fig 5-7 BOD5 ppd - Northeast
Figure 5-7Historical BOD5 Monthly Average Loading
Northeast WWTF
y = 6.0797x + 7380.7
0
2,000
4,000
6,000
8,000
10,000
12,000
1988
1993
1998
BO
D5
(pp
d)
Year
CITY OF LINCOLN
Lincoln Wastewater SystemFacilities Plan Update

File: Fig 5-1through 5-12.xlsTab: Fig 5-8 Northeast TSS (ppd)
Figure 5-8 Monthly Average TSS Loadings
Northeast WWTF
0
2,000
4,000
6,000
8,000
10,000
12,000
14,000
1988
1989
1990
1991
1992
1993
1994
1995
1996
1997
1998
1999
2000
TS
S (
pp
d)
Year
CITY OF LINCOLN
Lincoln Wastewater SystemFacilities Plan Update

P:\Data\GEN\Lincoln\21307\PDF Documents\Chapter 5 PDF.doc 5-14
Projected Waste Flows and Loads This section presents projected wastewater flows and loads for the next fifty years for both the Theresa Street and Northeast WWTFs. These projections were based on historical data and the results of hydrologic modeling studies correlated with the City of Lincoln’s population growth projections. Projected Flow Rates. The annual average flow has not increased significantly since 1978, though the population has grown from 171,932 in 1980 to 225,581 in 2000. As illustrated in Figure 5-9, the flow per capita has shrunk from an average of 140 gpcd in 1978 to 105 gpcd in 2000. This phenomenon can be attributed to the success of the City’s I/I reduction program, the use of low flow plumbing fixtures in newer homes, and better construction techniques and materials used to install new sewers. The data indicate that the per capita flow in the year 2000 was 105 gpcd. This is the value that has been used to project wastewater flows through the year 2050. The flow projections were developed using the historical average flow rate of 105 gpcd and a projected population growth rate of 1.5 percent per year. Average daily flow (ADF) projections for the years 2000 - 2050 are presented in Figure 5-10. Table 5-5 presents projected wastewater flows based on 2000 per capita flow rates, the service area population projections presented in Chapter 3, and historical dry weather peaking factors.
Table 5-5. Wastewater Flow Projections (mgd)
2000* 2010 2025 2050 Theresa Street WWTF Daily Average (ADF) 16.8 19.5 24 36 Maximum Month (MMF) 18.6 21.6 27 40 Peak Day (PDF) 25.5 29.6 37 54 Peak Hour (PHF) 32.4 37.7 47 69 Northeast WWTF Annual Average (ADF) 6.8 7.9 10 15 Maximum Month (MMF) 7.8 9.1 11 17 Peak Day (PDF) 10.5 12.2 15 23 Peak Hour (PHF) 13.3 15.4 19 28 Total Annual Average (ADF) 23.6 27.4 34 51 Total Maximum Month (MMF) 26.4 30.7 38 57 Total Peak Day (PDF) 36.0 41.8 52 77 Total Peak Hour (PHF) 45.7 53.1 66 97
*Actual Flow

File: Fig 5-1through 5-12.xlsTab: Fig 5-9 Per Capita Flow
Figure 5-9Average Annual Flow and Flow per Capita
0
20
40
60
80
100
120
140
160
180
1978
1979
1980
1981
1982
1983
1984
1985
1986
1987
1988
1989
1990
1991
1992
1993
1994
1995
1996
1997
1998
1999
2000
AAF (mgd) Ave. Flow/CapitaLinear (Ave. Flow/Capita) Linear (AAF (mgd))
Year
MG
DG
al/C
apit
a
CITY OF LINCOLN
Lincoln Wastewater SystemFacilities Plan Update
Legend
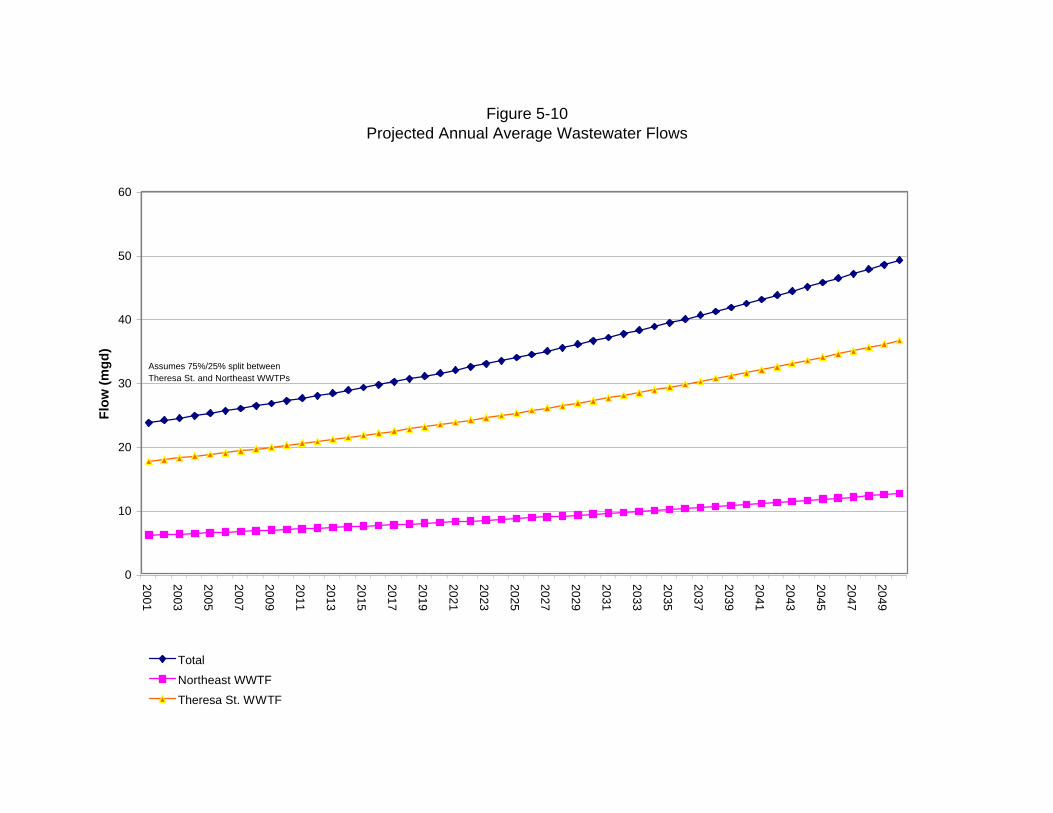
Figure 5-10Projected Annual Average Wastewater Flows
0
10
20
30
40
50
60
2001
2003
2005
2007
2009
2011
2013
2015
2017
2019
2021
2023
2025
2027
2029
2031
2033
2035
2037
2039
2041
2043
2045
2047
2049
Flo
w (
mg
d)
Total
Northeast WWTF
Theresa St. WWTF
Assumes 75%/25% split between Theresa St. and Northeast WWTPs
P:\Data\GEN\Lincoln\21307\PDF Documents\Chapter 5 PDF.doc 5-17
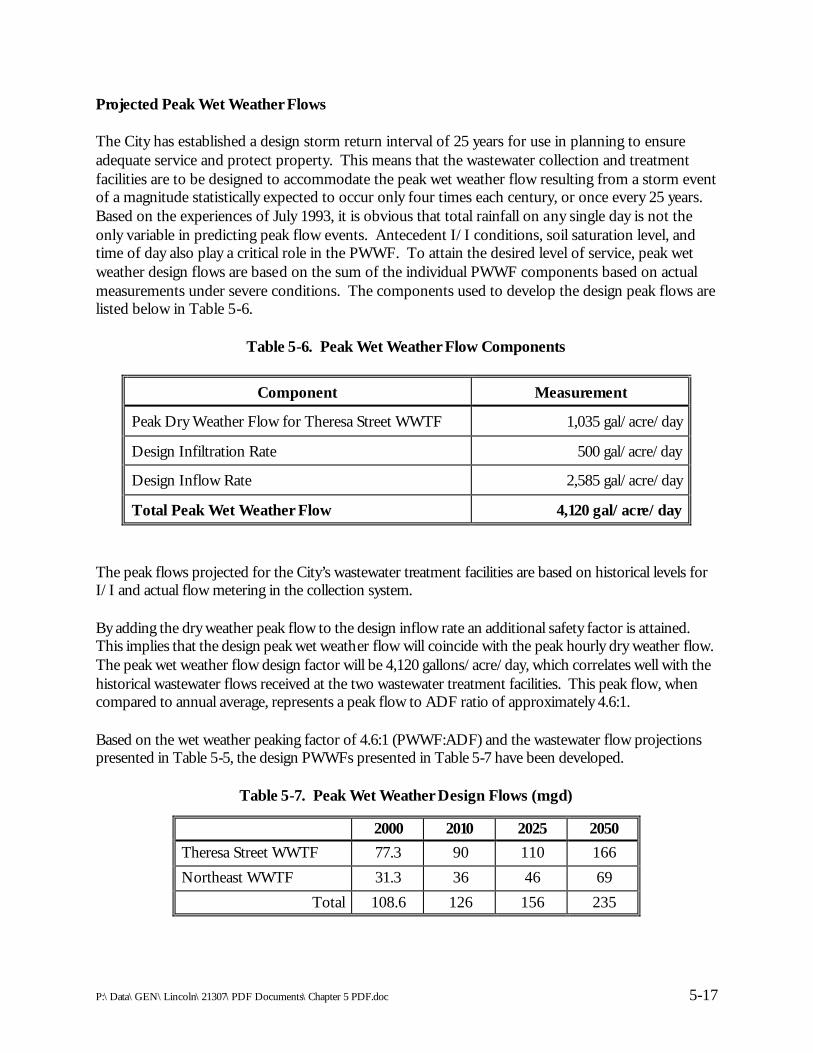
Projected Peak Wet Weather Flows The City has established a design storm return interval of 25 years for use in planning to ensure adequate service and protect property. This means that the wastewater collection and treatment facilities are to be designed to accommodate the peak wet weather flow resulting from a storm event of a magnitude statistically expected to occur only four times each century, or once every 25 years. Based on the experiences of July 1993, it is obvious that total rainfall on any single day is not the only variable in predicting peak flow events. Antecedent I/I conditions, soil saturation level, and time of day also play a critical role in the PWWF. To attain the desired level of service, peak wet weather design flows are based on the sum of the individual PWWF components based on actual measurements under severe conditions. The components used to develop the design peak flows are listed below in Table 5-6.
Table 5-6. Peak Wet Weather Flow Components
Component Measurement
Peak Dry Weather Flow for Theresa Street WWTF 1,035 gal/acre/day
Design Infiltration Rate 500 gal/acre/day
Design Inflow Rate 2,585 gal/acre/day
Total Peak Wet Weather Flow 4,120 gal/acre/day The peak flows projected for the City’s wastewater treatment facilities are based on historical levels for I/I and actual flow metering in the collection system. By adding the dry weather peak flow to the design inflow rate an additional safety factor is attained. This implies that the design peak wet weather flow will coincide with the peak hourly dry weather flow. The peak wet weather flow design factor will be 4,120 gallons/acre/day, which correlates well with the historical wastewater flows received at the two wastewater treatment facilities. This peak flow, when compared to annual average, represents a peak flow to ADF ratio of approximately 4.6:1. Based on the wet weather peaking factor of 4.6:1 (PWWF:ADF) and the wastewater flow projections presented in Table 5-5, the design PWWFs presented in Table 5-7 have been developed.
Table 5-7. Peak Wet Weather Design Flows (mgd)
2000 2010 2025 2050 Theresa Street WWTF 77.3 90 110 166 Northeast WWTF 31.3 36 46 69
Total 108.6 126 156 235

P:\Data\GEN\Lincoln\21307\PDF Documents\Chapter 5 PDF.doc 5-18
It is recommended that the Lincoln WWTFs be designed to treat projected peak hourly flows determined using the PHF/MMF ratios presented in Table 4-3. Wet weather flows in excess of these values should be handled using special wet weather flow facilities. Projected Wastewater Loadings An analysis of the per capita BOD5 and TSS contributions was conducted to aid in establishing a basis for long-term projections of organic loadings to Lincoln’s wastewater treatment facilities. Table 5-8 presents historical and projected loading rates for the Theresa Street and Northeast WWTFs.
Table 5-8. WWTF Loading Rate Projections* 2000 2010 2025 2050
Theresa Street WWTF BOD5 (ppd) 46,500 54,000 67,500 98,000 TSS (ppd) 66,700 77,400 96,800 140,400 NH3–N (ppd) 7,000 8,100 10,100 14,700
Northeast WWTF BOD5 (ppd) 16,300 18,900 23,600 34,300 TSS (ppd) 26,000 30,200 37,800 54,800 NH3–N (ppd) 2,600 3,000 3,800 5,500
Total BOD5 (ppd) 62,800 72,900 91,100 132,300 TSS (ppd) 92,700 107,600 134,600 195,200 NH3–N (ppd) 9,600 11,100 13,900 20,200 Population 225,581 261,796 327,306 474,903
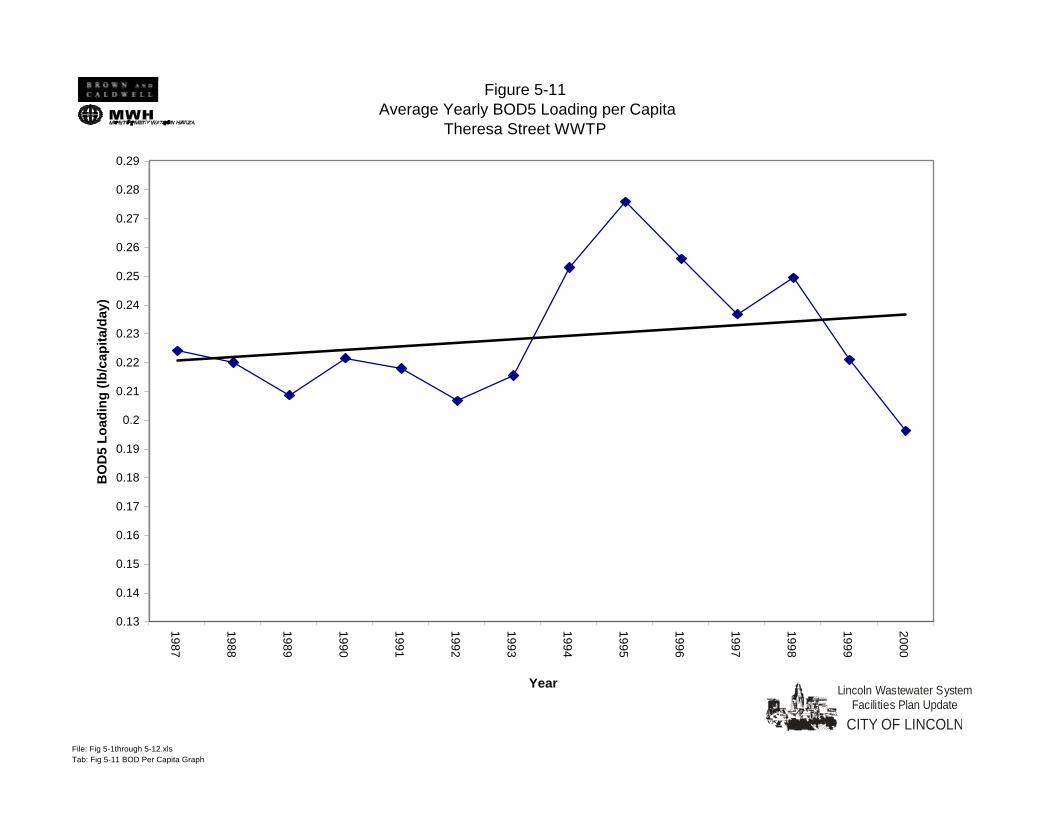
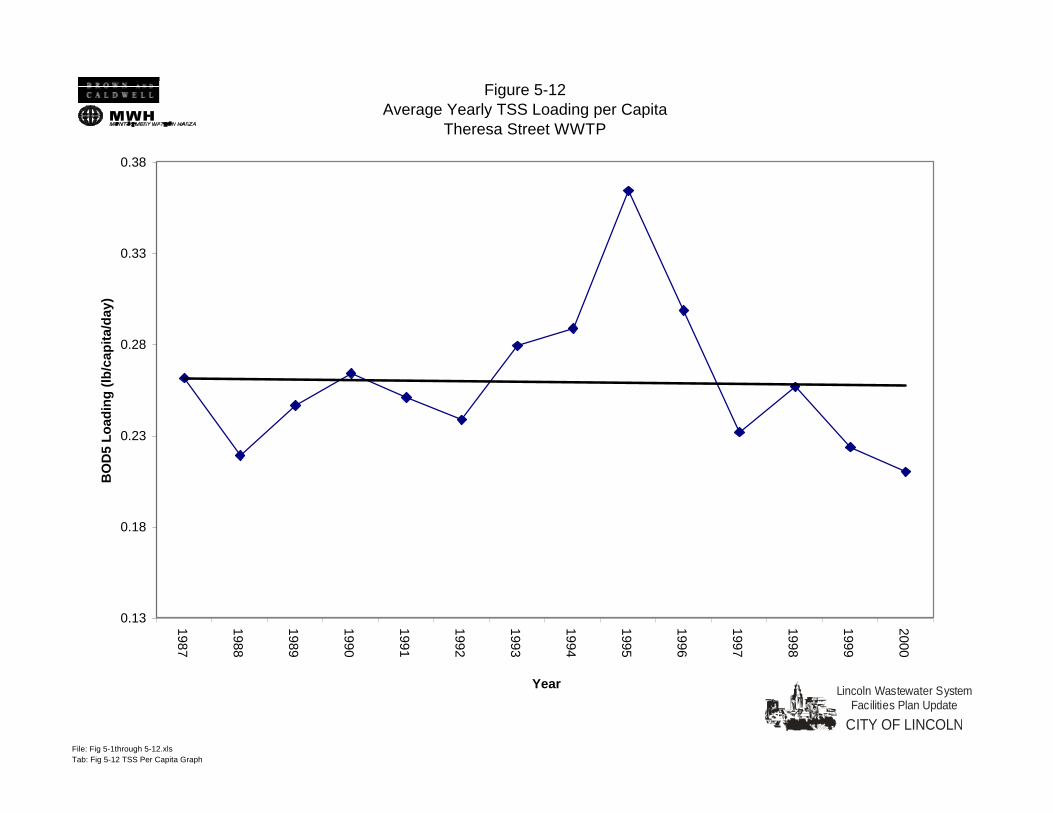
*Loading projections are based on maximum month conditions. The values presented in Table 5-8 represent maximum month loading conditions and are based on the maximum month flows shown in Table 5-5 and the constituent concentrations presented in Tables 5-3 and 5-4. NH3-N represents ammonia nitrogen. Figures 5-11 and 5-12 show the historical trends in per capita contributions for BOD5 and TSS. These values were derived from trends established using historical flow and load data from 1987 through 2001. Since the City has made several changes to the wastewater system over the past few decades, data generated prior to 1987 are not considered to accurately represent current loading conditions. As illustrated in Figure 5-11, the average BOD5 load per capita has generally increased over time. The average BOD5 load per capita during the year 2001 is approximately 0.228 lbs/capita/day. Figure 5-12 shows the long-term trend in per capita TSS loadings. The average TSS loading for the period shown is approximately 0.26 lbs/capita/day.
File: Fig 5-1through 5-12.xlsTab: Fig 5-11 BOD Per Capita Graph
Figure 5-11 Average Yearly BOD5 Loading per Capita
Theresa Street WWTP
0.13
0.14
0.15
0.16
0.17
0.18
0.19
0.2
0.21
0.22
0.23
0.24
0.25
0.26
0.27
0.28
0.29
1987
1988
1989
1990
1991
1992
1993
1994
1995
1996
1997
1998
1999
2000
BO
D5
Lo
adin
g (
lb/c
apit
a/d
ay)
Year
CITY OF LINCOLN
Lincoln Wastewater SystemFacilities Plan Update
File: Fig 5-1through 5-12.xlsTab: Fig 5-12 TSS Per Capita Graph
Figure 5-12Average Yearly TSS Loading per Capita
Theresa Street WWTP
0.13
0.18
0.23
0.28
0.33
0.38
1987
1988
1989
1990
1991
1992
1993
1994
1995
1996
1997
1998
1999
2000
BO
D5
Lo
adin
g (
lb/c
apit
a/d
ay)
Year
CITY OF LINCOLN
Lincoln Wastewater SystemFacilities Plan Update

P:\Data\GEN\Lincoln\21307\PDF Documents\Chapter 5 PDF.doc 5-21
Projected Wastewater Solids Production Rates A projection of future wastewater solids production is necessary to predict when additional sludge handling facilities will be required. Future solids loading will not necessarily correspond to population growth. Loads from other sources such as industrial, commercial, and septage contributors can affect solids loading without an appreciable difference in the population served. Figure 5-13 presents projected solids loads for the Theresa Street WWTF from 2000-2050. Projected solids production rates, measured in dry pounds per day, are based on historical production rates and wastewater flow projections. These values are presented in Table 5-9. TSS represents total suspended solids, and VSS represents volatile suspended solids.
Table 5-9. Projected Solids Production Rates
2000 2010 2025 2050 Theresa Street WWTF
TSS (ppd) 48,500 56,400 70,400 104,400 VSS (ppd) 35,900 41,700 52,100 77,200
Northeast WWTF TSS (ppd) 14,100 16,500 19,900 30,800 VSS (ppd) 10,500 12,200 14,800 22,800
Total TSS (ppd) 62,700 72,900 90,400 135,200 VSS (ppd) 46,400 53,900 66,900 100,000
The values shown in Table 5-9 are based on maximum month flows and loads and on historical solids production rates.

File: Fig 5 - 14.SludgeForecastRegression.xlsTab: Fig 5-14
Figure 5-13Digester Feed Sludge Projections (2000-2050)
Theresa Street WWTF
0.0
10.0
20.0
30.0
40.0
50.0
60.0
70.0
80.0
90.0
100.0
110.0
1985
1990
1995
2000
2005
2010
2015
2020
2025
2030
2035
2040
2045
2050
Year
An
nu
al A
vera
ge
So
lids
(Th
ou
san
ds
of
dry
po
un
ds
per
day
)
Historical Data
Project Total Solids Production Based On1.5% Per Year Growth
59,000 Pounds Digester Capacity
Year 2014
CITY OF LINCOLN
Lincoln Wastewater SystemFacilities Plan Update

P:\Data\GEN\Lincoln\21307\PDF Documents\Chapter 5 PDF.doc 5-23
Summary Projected wastewater flows and loads for the Theresa Street and Northeast WWTFs are presented in Table 5-10.
Table 5-10. Summary of Projected Flows and Loads
2000 2010 2025 2050 Population 225,581 261,796 327,306 474,903 Theresa Street
Flow (max month) 18.6 21.6 27 40 BOD5 (ppd) 46,500 54,000 67,500 98,000 TSS (ppd) 66,700 77,400 96,800 140,400 NH3–N (ppd) 7,000 8,100 10,100 14,700
Northeast Flow (max month) 7.8 9.1 11 17 BOD5 (ppd) 16,300 18,900 23,600 34,300 TSS (ppd) 26,000 30,200 37,800 54,800 NH3–N (ppd) 2,600 3,000 3,800 5,500
Totals Flow (max month) 26.4 30.7 38 57 BOD5 (ppd) 62,800 72,900 91,100 132,300 TSS (ppd) 92,700 107,600 134,600 195,200 NH3–N (ppd) 9,600 11,100 13,900 20,200