Embed Size (px)
Citation preview

188
CHAPTER – 5
SIMULATION RESULTS & DISCUSSION
5.0 INTRODUCTION
This chapter deals with testing of GSHDC algorithm for IEEE
test systems. The standard IEEE 14, 30 and 57 systems are
considered to investigate the effectiveness of the proposed
methodology. The test is carried with a 1.4-GHz Pentium-IV PC. The
GSHDC has been developed by the use of MATLAB version 7. The
simulation results are compared with other popular methodologies in
judicious way.
GSHDC Method is implemented for two Test cases:
Test-1: Suboptimal Solution obtained through IP method
Test-2: Suboptimal Solution obtained through PSO method
Suboptimal solution is obtained for two individual objectives and
one Multi-objective:
Objective-1: Minimum Fuel Cost
Objective-2: Minimum Power Loss
Using the OPF solutions obtained through objective-1 &2 as
parent chromosomes, population is generated for the multi-objective
OPF problem. This is referred as:
Objective-3: Multi-Objective
GSHDC is implemented for each Test case and each objective for
three case studies that is, three IEEE Test systems.
Case-1: IEEE 14-Bus System
189
Case-2: IEEE 30-Bus System
Case-3: IEEE 57-Bus System
In addition to above two tests, GSHDC is also implemented with
suboptimal solution obtained through modified penalty factor method
to test its effectiveness. This case is referred as Test-3.
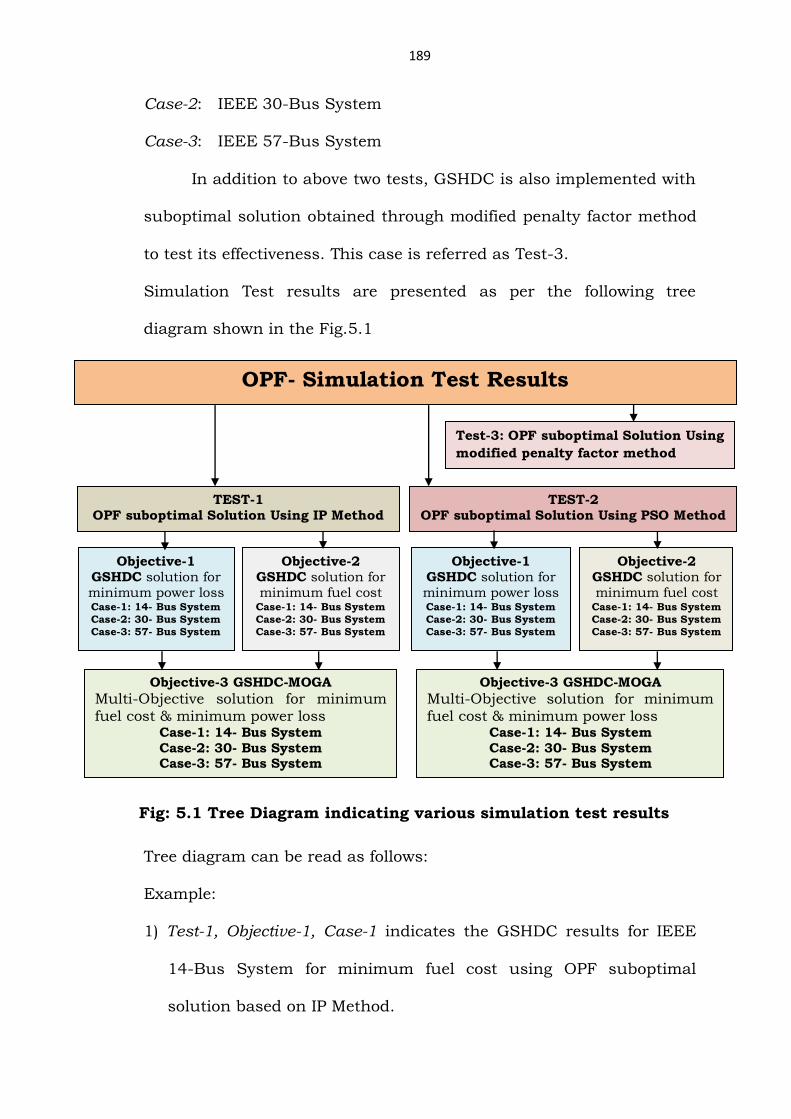
Simulation Test results are presented as per the following tree
diagram shown in the Fig.5.1
Tree diagram can be read as follows:
Example:
1) Test-1, Objective-1, Case-1 indicates the GSHDC results for IEEE
14-Bus System for minimum fuel cost using OPF suboptimal
solution based on IP Method.
Fig: 5.1 Tree Diagram indicating various simulation test results
OPF- Simulation Test Results
Test-3: OPF suboptimal Solution Using
modified penalty factor method
TEST-1
OPF suboptimal Solution Using IP Method
Objective-1
GSHDC solution for minimum power loss Case-1: 14- Bus System
Case-2: 30- Bus System
Case-3: 57- Bus System
Objective-2 GSHDC solution for minimum fuel cost
Case-1: 14- Bus System
Case-2: 30- Bus System
Case-3: 57- Bus System
Objective-3 GSHDC-MOGA
Multi-Objective solution for minimum fuel cost & minimum power loss
Case-1: 14- Bus System Case-2: 30- Bus System Case-3: 57- Bus System
TEST-2 OPF suboptimal Solution Using PSO Method
Objective-1
GSHDC solution for minimum power loss Case-1: 14- Bus System
Case-2: 30- Bus System
Case-3: 57- Bus System
Objective-2 GSHDC solution for minimum fuel cost
Case-1: 14- Bus System
Case-2: 30- Bus System
Case-3: 57- Bus System
Objective-3 GSHDC-MOGA
Multi-Objective solution for minimum fuel cost & minimum power loss
Case-1: 14- Bus System Case-2: 30- Bus System Case-3: 57- Bus System

190
2) Test-1, Objective-2, Case-3 indicates the GSHDC results for IEEE
57-Bus System for minimum power loss using OPF suboptimal
solution based on IP Method.
3) Test-2, Objective-3, Case-1 indicates the multi objective GSHDC-
MOGA results for IEEE 14-Bus System where the OPF for
minimum fuel cost and power loss using suboptimal solution
based on PSO Method.
5.1 OPF SIMULATION RESULTS - IEEE 14 BUS TEST SYSTEM
In this study, the standard IEEE 14-Bus 5 Generator test
system is considered to investigate effectiveness of the GSHDC
approach. The IEEE 14-bus system has 20 transmission lines. The
single line diagram is shown in Fig.5.2. The values of fuel cost
coefficients are given in Table 5.1. The total load demand of the
system is 259 MW and 5 -Generators should share load optimally.
Fig: 5.2 IEEE 14 – Bus Test System [101]

191
Table 5.2: Generator Operating Limits
Minimum or Maximum Generation
limits of Generators are presented
in Table 5.2.
Parameter values for GA are presented in Table 5.3
Table 5.3: Parameter values Genetic Algorithm
5.1.1 Test-1 Objective-1 case-1
Testing of GSHDC Algorithm for OPF Solution using suboptimal
solution obtained by Interior Point Method-Minimum Fuel Cost
For the IEEE 14 Bus Test system initially, an OPF solution is
obtained by using IP method. Taking this as suboptimal solution, a
high density cluster for minimum fuel cost is formed in the vicinity of
suboptimal solution by GSHDC Algorithm. Finally with the help of a
well defined fitness function genetic search is carried out to find the
optimal solution. The results are furnished for the objective namely,
minimum cost. The test results include the total cost of generation,
generation schedule, generator bus voltage magnitudes and CPU
Table 5.1: Generator Fuel Cost Coefficients
Sl.No Generator at bus #
i ($/h) i ($/MWhr) i ($/MWhr2)
1 1 0 20 0.0430293
2 2 0 20 0.25
3 3 0 40 0.01
4 6 0 40 0.01
5 8 0 40 0.01
Sl.No Generator at bus #
PGiMn (MW)
PGiMax
(MW)
1 1 0 332.4
2 2 0 140
3 3 0 100
4 6 0 100
5 8 0 100
Population Size 100 Mutation Probability 0.01
No. of Generations 300 Crossover Probability 0.08
192
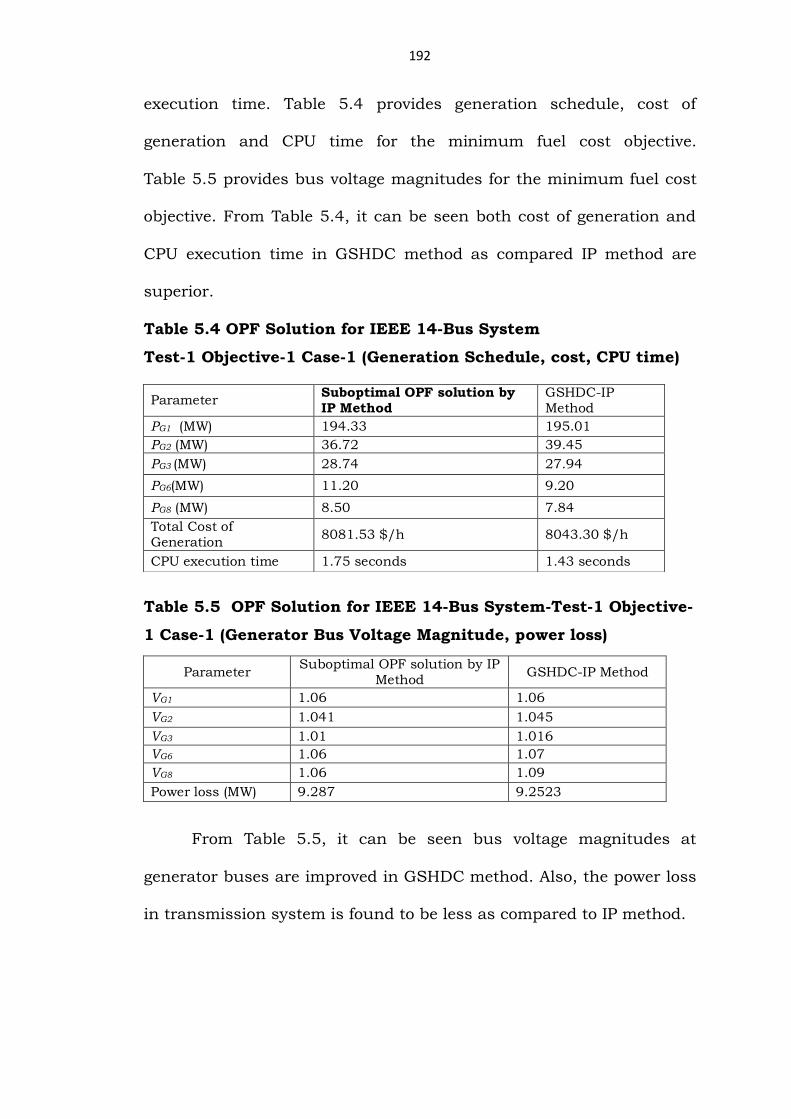
execution time. Table 5.4 provides generation schedule, cost of
generation and CPU time for the minimum fuel cost objective.
Table 5.5 provides bus voltage magnitudes for the minimum fuel cost
objective. From Table 5.4, it can be seen both cost of generation and
CPU execution time in GSHDC method as compared IP method are
superior.
Table 5.4 OPF Solution for IEEE 14-Bus System
Test-1 Objective-1 Case-1 (Generation Schedule, cost, CPU time)
Table 5.5 OPF Solution for IEEE 14-Bus System-Test-1 Objective-
1 Case-1 (Generator Bus Voltage Magnitude, power loss)
From Table 5.5, it can be seen bus voltage magnitudes at
generator buses are improved in GSHDC method. Also, the power loss
in transmission system is found to be less as compared to IP method.
Parameter Suboptimal OPF solution by IP Method
GSHDC-IP Method
PG1 (MW) 194.33 195.01
PG2 (MW) 36.72 39.45
PG3 (MW) 28.74 27.94
PG6(MW) 11.20 9.20
PG8 (MW) 8.50 7.84
Total Cost of Generation
8081.53 $/h 8043.30 $/h
CPU execution time 1.75 seconds 1.43 seconds
Parameter Suboptimal OPF solution by IP
Method GSHDC-IP Method
VG1 1.06 1.06
VG2 1.041 1.045
VG3 1.01 1.016
VG6 1.06 1.07
VG8 1.06 1.09
Power loss (MW) 9.287 9.2523

193
5.1.2 Test-1 Objective-2 case-1
Testing of GSHDC Algorithm for OPF Solution using suboptimal solution
obtained by Interior Point Method-Minimum Power loss
For the IEEE 14 Bus Test system initially, an OPF solution for
minimum power loss is obtained by using IP method. Taking this as
suboptimal solution, a high density cluster for minimum power loss in
the vicinity of suboptimal solution is formed. Finally with the help of
a well defined fitness function for minimum power loss, a genetic
search is carried out to find the optimal solution. The results are
furnished for the objective namely, minimum power loss. The test
results include the total cost of generation, generation schedule,
generator bus voltage magnitudes and CPU execution time. Table 5.6
provides generation schedule, cost of generation and CPU time for the
minimum power loss objective. Table 5.7 provides bus voltage
magnitudes for the minimum power loss objective.
Table 5.6 OPF Solution for IEEE 14-Bus System
Test-1 Objective-2 Case-1 (Generation Schedule, cost, CPU time)
From Table 5.6, it can be seen both cost of generation and CPU
execution time in GSHDC method as compared IP method are
superior.
Parameter Suboptimal OPF solution by
IP Method GSHDC-IP Method
PG1 (MW) 194.32 193.49
PG2 (MW) 40.27 40.20
PG3 (MW) 27.85 28.86
PG6(MW) 10.73 10.66
PG8 (MW) 6.28 6.15
Total Cost of Generation
8082.77 $/h 8043.80 $/h
CPU execution time 1.72 seconds 1.52 seconds
194
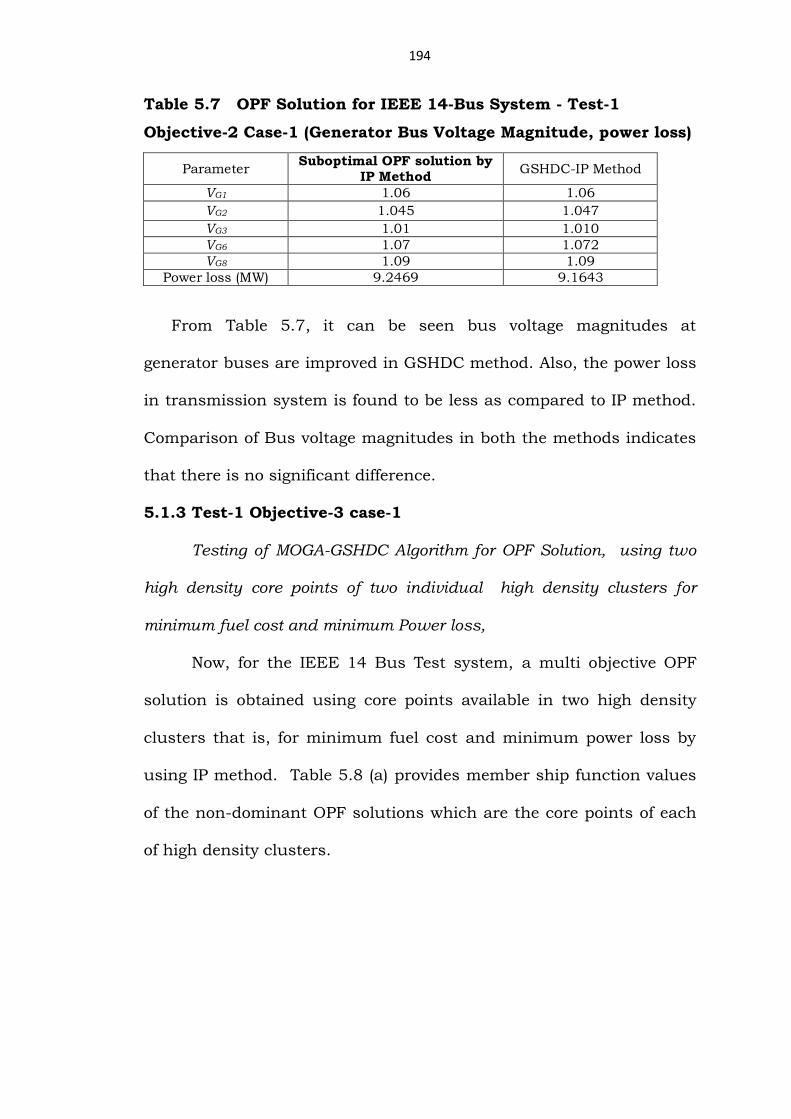
Table 5.7 OPF Solution for IEEE 14-Bus System - Test-1
Objective-2 Case-1 (Generator Bus Voltage Magnitude, power loss)
From Table 5.7, it can be seen bus voltage magnitudes at
generator buses are improved in GSHDC method. Also, the power loss
in transmission system is found to be less as compared to IP method.
Comparison of Bus voltage magnitudes in both the methods indicates
that there is no significant difference.
5.1.3 Test-1 Objective-3 case-1
Testing of MOGA-GSHDC Algorithm for OPF Solution, using two
high density core points of two individual high density clusters for
minimum fuel cost and minimum Power loss,
Now, for the IEEE 14 Bus Test system, a multi objective OPF
solution is obtained using core points available in two high density
clusters that is, for minimum fuel cost and minimum power loss by
using IP method. Table 5.8 (a) provides member ship function values
of the non-dominant OPF solutions which are the core points of each
of high density clusters.
Parameter Suboptimal OPF solution by
IP Method GSHDC-IP Method
VG1 1.06 1.06
VG2 1.045 1.047
VG3 1.01 1.010
VG6 1.07 1.072
VG8 1.09 1.09
Power loss (MW) 9.2469 9.1643

195
Table 5.8 (a) OPF Solution for IEEE 14-Bus System - Test-1
Objective-3 Case-1
f1,max=8063.70 f1,min = 8043.30 f2,max = 9.5041 f2,min = 9.1645
f1,max - f1,min = 20.40
f2,max - f2,min = 0.3396
Membership function Values: Membership function values for the items
in 2nd row are calculated as per the following.
μ1 = (8063.70- 8043.60)/ 20.40 = 0.9852
μ2 = (9.5041 - 9.3725)/ 0.3396 = 0.3875
∑ μ1 +∑ μ2 = 8.1591 + 7.363=15.5221
μD = (0.9852+ 0.3875) / (15.5221) = 0.08843
Multi-Objective OPF Solution-Decision Making
From the Table 5.8, it is observed the μD has maximum value in
7th row. Accordingly the corresponding values of f1 and f2 are taken as
the multi objective OPF solution for the objectives minimum fuel cost
and minimum power loss respectively.
Minimum Fuel Cost Minimum Power Loss
Sl. No.
Total fuel cost for
minimum generation
cost
Member ship
function value
Total fuel cost for
minimum power loss
Member ship
function value
Decision making
f1 μ1 f2 μ2 μD
01 8043.30 1.0 9.3706 0.3931 0.08974
02 8043.60 0.9852 9.3725 0.3875 0.08843
03 8043.80 0.9754 9.5041 0.0 0.06167
04 8044.10 0.9607 9.2523 0.7414 0.10965
05 8044.40 0.9460 9.2737 0.6784 0.10465
06 8045.10 0.9117 9.3039 0.5895 0.09671
07 8046.35 0.8504 9.1900 0.9249 0.11437
08 8047.23 0.8073 9.2069 0.9010 0.11005
09 8055.43 0.4053 9.2469 0.7573 0.07489
10 8057.23 0.3171 9.1645 1.0 0.08485
11 8063.70 0.0 9.1679 0.9899 0.06377
8.1591 7.363

196
The values of f1 and f2 are:
f1 - Minimum Fuel Cost: 8046.35 $/h.
f2 - Minimum Power Loss - 9.1900 MW.
Table 5.8 (b) provides generation schedule, cost of generation and
CPU time, bus voltage magnitudes for the MOGA-IP OPF solution for
IEEE 14- Bus System.
Table 5.8 (b) OPF Solution for IEEE 14-Bus System - Test-1
Objective-3 Case-1
5.1.4 Test-2 Objective-1 case-1
Testing of GSHDC-PSO Algorithm for OPF Solution using suboptimal
solution obtained by Particle Swarm Optimization Method
For the IEEE 14 Bus Test system initially, an OPF solution is
obtained by using PSO method. Taking this as suboptimal solution, a
high density cluster for minimum fuel cost is formed in the vicinity of
suboptimal solution by GSHDC-PSO Algorithm. Finally with the help
of a well defined fitness function genetic search is carried out to find
the optimal solution. The results are furnished for the objective
namely, minimum cost. The test results include the total cost of
generation, generation schedule, generator bus voltage magnitudes
and CPU execution time. Table 5.9 provides generation schedule, cost
Parameter MOGA-IP OPF Result Parameter MOGA-IP OPF Result
PG1 (MW) 195.49 VG1 1.06
PG2 (MW) 40.70 VG2 1.023
PG3 (MW) 29.29 VG3 1.02
PG6(MW) 11.22 VG6 1.072
PG8 (MW) 5.83 VG8 1.09
Total Cost of Generation
8046.35 $/h Power loss (MW)
9.1900 CPU execution
time 1.83 seconds

197
of generation and CPU time for the min. cost objective. Table 5.10
provides bus voltage magnitudes for the min. cost objective.
From Table 5.9, it can be seen both cost of generation and CPU
execution time in GSHDC method as compared PSO method are
superior. From Table 5.10, it can be seen bus voltage magnitudes at
generator buses are improved in GSHDC method. Also, the power loss
in transmission system is found to be less as compared to PSO
method.
Table 5.10 OPF Solution for IEEE 14-Bus System - Test-2
Objective-1 Case-1 (Generator Bus Voltage Magnitude, power loss)
5.1.5 Test-2 Objective-2 case-1
Testing of GSHDC Algorithm for OPF Solution using suboptimal solution
obtained by Interior Point Method-Minimum Power loss
Table 5.9 OPF Solution for IEEE 14-Bus System
Test-2 Objective-1 Case-1 (Generation Schedule, cost, CPU time)
Parameter Suboptimal OPF solution by PSO Method
GSHDC-PSO Method
PG1 (MW) 195.45 193.36
PG2 (MW) 36.93 40.86
PG3 (MW) 29.51 25.51
PG6(MW) 6.64 7.99
PG8 (MW) 11.06 10.67
Total Cost of Generation 8079.40 $/h 8038.80 $/h
CPU execution time 6.00 seconds 1.43 seconds
Parameter Suboptimal OPF solution by PSO Method
GSHDC-PSO Method
VG1 1.06 1.06
VG2 1.042 1.045
VG3 1.012 1.018
VG6 1.05 1.09
VG8 1.062 1.09
Power loss (MW) 9.257 9.1995

198
For the IEEE 14 Bus Test system initially, an OPF solution for
minimum power loss is obtained by using IP method. Taking this as
suboptimal solution, a high density cluster for minimum power loss in
the vicinity of suboptimal solution is formed. Finally with the help of
a well defined fitness function for minimum power loss, a genetic
search is carried out to find the optimal solution. The results are
furnished for the objective namely, minimum power loss. The test
results include the total cost of generation, generation schedule,
generator bus voltage magnitudes and CPU execution time. Table 5.11
provides generation schedule, cost of generation and CPU time for the
minimum power loss objective. Table 5.12 provides bus voltage
magnitudes for the minimum power loss objective. From Table 5.11, it
can be seen both cost of generation and CPU execution time in
GSHDC method as compared PSO method are superior.
Table 5.11 OPF Solution for IEEE 14-Bus System
Test-2 Objective-2 Case-1 (Generation Schedule, cost, CPU time)
Parameter Suboptimal OPF solution by
PSO Method GSHDC-PSO Method
PG1 (MW) 195.32 193.35
PG2 (MW) 39.27 39.80
PG3 (MW) 28.85 27.86
PG6(MW) 09.73 11.66
PG8 (MW) 5.28 5.80
Total Cost of Generation 8072.77 $/h 8042.10 $/h
CPU execution time 6.72 seconds 2.41 seconds

199
Table 5.12 OPF Solution for IEEE 14-Bus System - Test-2
Objective-2 Case-1(Generator Bus Voltage Magnitude, power loss)
From Table 5.12, it can be seen bus voltage magnitudes at
generator buses are improved in GSHDC method. Also, the power loss
in transmission system is found to be less as compared to PSO
method. Comparison of Bus voltage magnitudes in both the methods
indicates that there is no significant difference.
5.1.6 Test-2 Objective-3 case-1
Testing of MOGA-GSHDC Algorithm for OPF Solution, using two
high density core points of two individual high density clusters for
minimum fuel cost and minimum Power loss.
Now, for the IEEE 14 Bus Test system, a multi objective OPF
solution is obtained using core points available in two high density
clusters that is, for minimum fuel cost and minimum power loss by
using PSO method. Table 5.13 (a) provides member ship function
values of the non-dominant OPF solutions which are the core points of
each of high density clusters.
Parameter Suboptimal OPF solution by PSO Method
GSHDC-PSO Method
VG1 1.06 1.06
VG2 1.05 1.047
VG3 1.02 1.010
VG6 1.065 1.072
VG8 1.09 1.09
Power loss (MW) 9.2567 9.1587

200
Table 5.13 (a) OPF Solution for IEEE 14-Bus System - Test-2
Objective-3 Case-1
Minimum Fuel Cost Minimum Power Loss
Sl. No.
Total fuel cost for minimum
generation cost
Member ship
function value
Total Power loss
Member ship
function value
Decision making
f1 μ1 f2 μ2 μD
01 8038.80 1.0 9.3506 0.2212 0.08472
02 8039.60 0.9282 9.3625 0.1729 0.0764
03 8041.80 0.8564 9.4051 0.0 0.059418
04 8042.10 0.8421 9.2423 0.6607 0.093049
05 8042.40 0.8277 9.2747 0.5292 0.08518
06 8043.10 0.7942 9.3139 0.3701 0.075918
07 8044.35 0.7344 9.1800 0.9131 0.114307
08 8046.23 0.6445 9.1881 0.8807 0.10582
09 8048.13 0.5536 9.1981 0.8044 0.09422
10 8053.42 0.3004 9.1587 1.0 0.08987
11 8059.70 0.0 9.1609 0.9910 0.06268
7.4815 6.9308
f1,max=8059.70 f1,min = 8038.80 f2,max = 9.4051 f2,min = 9.1587
f1,max - f1,min = 20.90 f2,max - f2,min = 0.2464
Membership function Values: Membership function values for 2nd row
are calculated as per the following.
μ1 = (8059.70- 8039.60)/ 20.90 = 0.9282
μ2 = (9.4051- 9.3625)/ 0.2464= 0.1729
μD = (0.9282+ 0.1729) / (7.4815+ 6.9308) = 0.0764
Multi-Objective OPF Solution-Decision Making
From the Table 5.13, it is observed the μD has maximum value
in 7th row. Accordingly the corresponding values of f1 and f2 are taken
as the multi objective OPF solution for the objectives minimum fuel
cost and minimum power loss respectively.
The values of f1 and f2 are:
f1 - Minimum Fuel Cost: 8044.35 $/h.
f2 - Minimum Power Loss - 9.1800 MW.
201
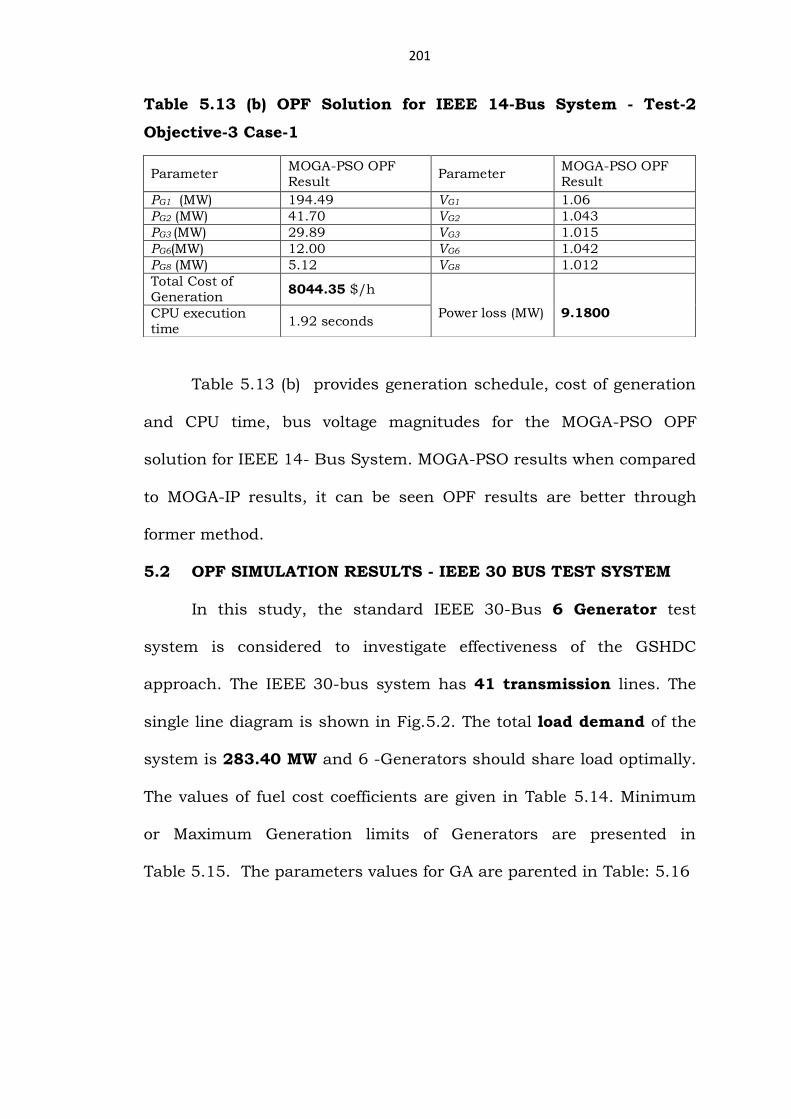
Table 5.13 (b) OPF Solution for IEEE 14-Bus System - Test-2
Objective-3 Case-1
Table 5.13 (b) provides generation schedule, cost of generation
and CPU time, bus voltage magnitudes for the MOGA-PSO OPF
solution for IEEE 14- Bus System. MOGA-PSO results when compared
to MOGA-IP results, it can be seen OPF results are better through
former method.
5.2 OPF SIMULATION RESULTS - IEEE 30 BUS TEST SYSTEM
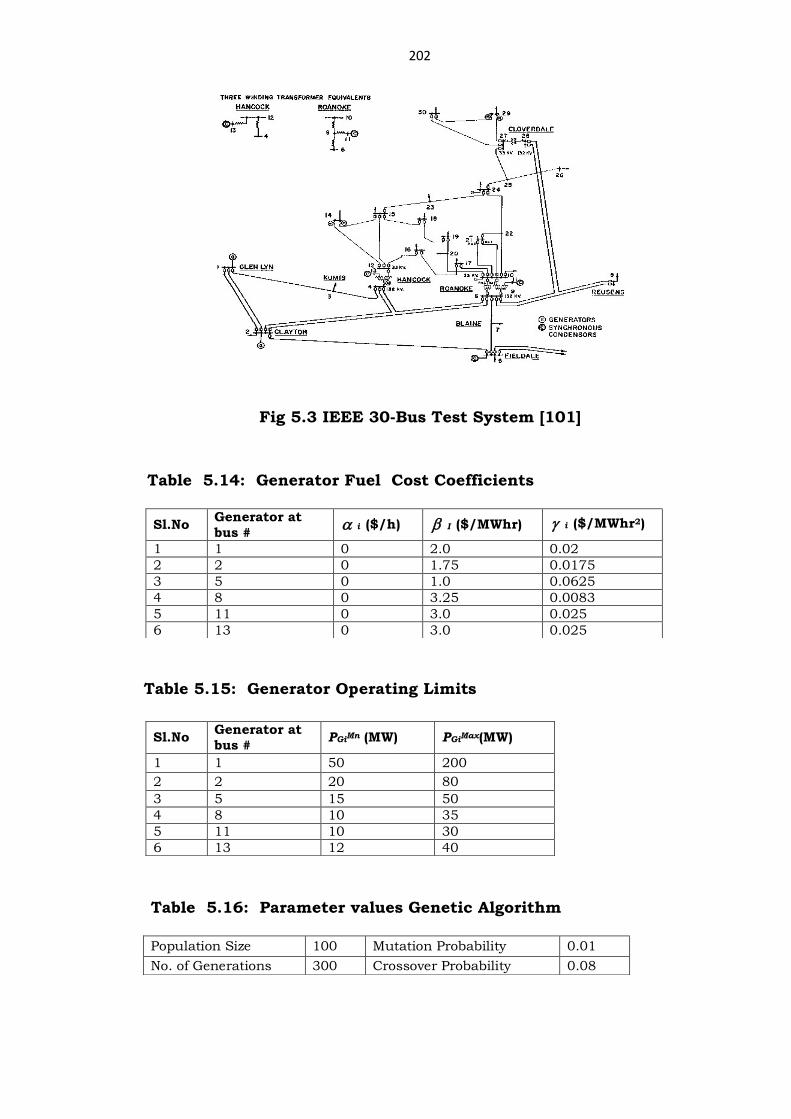
In this study, the standard IEEE 30-Bus 6 Generator test
system is considered to investigate effectiveness of the GSHDC
approach. The IEEE 30-bus system has 41 transmission lines. The
single line diagram is shown in Fig.5.2. The total load demand of the
system is 283.40 MW and 6 -Generators should share load optimally.
The values of fuel cost coefficients are given in Table 5.14. Minimum
or Maximum Generation limits of Generators are presented in
Table 5.15. The parameters values for GA are parented in Table: 5.16
Parameter MOGA-PSO OPF Result
Parameter MOGA-PSO OPF Result
PG1 (MW) 194.49 VG1 1.06
PG2 (MW) 41.70 VG2 1.043
PG3 (MW) 29.89 VG3 1.015
PG6(MW) 12.00 VG6 1.042
PG8 (MW) 5.12 VG8 1.012
Total Cost of Generation
8044.35 $/h Power loss (MW)
9.1800 CPU execution
time 1.92 seconds
202
Fig 5.3 IEEE 30-Bus Test System [101]
Table 5.15: Generator Operating Limits
Table 5.14: Generator Fuel Cost Coefficients
Sl.No Generator at bus #
i ($/h) I ($/MWhr) i ($/MWhr2)
1 1 0 2.0 0.02
2 2 0 1.75 0.0175
3 5 0 1.0 0.0625
4 8 0 3.25 0.0083
5 11 0 3.0 0.025
6 13 0 3.0 0.025
Sl.No Generator at bus #
PGiMn (MW) PGiMax(MW)
1 1 50 200
2 2 20 80
3 5 15 50
4 8 10 35
5 11 10 30
6 13 12 40
Table 5.16: Parameter values Genetic Algorithm
Population Size 100 Mutation Probability 0.01
No. of Generations 300 Crossover Probability 0.08

203
5.2.1 Test-1 Objective-1 case-2
Testing of GSHDC Algorithm for OPF Solution using suboptimal
solution obtained by Interior Point Method-Minimum Fuel Cost.
For the IEEE 30 Bus Test system initially, an OPF solution is
obtained by using IP method. Taking this as suboptimal solution, a
high density cluster for minimum fuel cost is formed in the vicinity of
suboptimal solution by GSHDC Algorithm. Finally with the help of a
well defined fitness function genetic search is carried out to find the
optimal solution. The results are furnished for the objective namely,
minimum cost. The test results include the total cost of generation,
generation schedule, generator bus voltage magnitudes and CPU
execution time. Table 5.17 provides generation schedule, cost of
generation and CPU time for the min. cost objective. Table 5.18
provides bus voltage magnitudes for the min. cost objective.
Table 5.18 OPF Solution for IEEE 30-Bus System - Test-1
Objective-1 Case-2 (Generator Bus Voltage Magnitude, power loss)
Table 5.17 OPF Solution for IEEE 30-Bus System
Test-1 Objective-1 Case-2 (Generation Schedule, cost, CPU time)
Parameter Suboptimal OPF solution by IP Method
GSHDC-IP Method
PG1 (MW) 175.76 175.42
PG2 (MW) 48.81 48.85
PG5 (MW) 21.54 21.71
PG8(MW) 24.71 23.68
PG11 (MW) 12.35 12.71
PG13 (MW) 12 11.62
Total Cost of Generation 810.61 $/h 806.7008
CPU execution time 1.91 seconds 1.70 seconds
Parameter Suboptimal OPF solution by IP Method GSHDC-IP Method
VG1 1.019 1.05
VG2 1.03 1.041
VG5 1.00 1.013
VG8 1.00 1.07
VG11 1.00 1.09
VG13 1.00 1.02
power loss (MW)
11.43 10.5920

204
From Table 5.17, it can be seen both cost of generation and CPU
execution time in GSHDC method as compared IP method are
superior. From Table 5.18, it can be seen bus voltage magnitudes at
generator buses are improved in GSHDC method. Also, the power loss
in transmission system is found to be less as compared to IP method.
5.2.2 Test-1 Objective-2 case-2
Testing of GSHDC Algorithm for OPF Solution using suboptimal
solution obtained by Interior Point Method-Minimum Power loss.
For the IEEE 30 Bus Test system initially, an OPF solution for
minimum power loss is obtained by using IP method. Taking this as
suboptimal solution, a high density cluster for minimum power loss in
the vicinity of suboptimal solution is formed. Finally with the help of
a well defined fitness function for minimum power loss, a genetic
search is carried out to find the optimal solution. The results are
furnished for the objective namely, minimum power loss. The test
results include the total cost of generation, generation schedule,
generator bus voltage magnitudes and CPU execution time. Table 5.19
provides generation schedule, cost of generation and CPU time for the
minimum power loss objective. Table 5.20 provides bus voltage
magnitudes for the minimum power loss objective.

205
From Table 5.19, it can be seen both cost of generation and CPU
execution time in GSHDC method as compared to IP method are
superior. From Table 5.20, it can be seen bus voltage magnitudes at
generator buses are improved in GSHDC method. Also, the power loss
in transmission system is found to be less as compared to IP method.
Comparison of Bus voltage magnitudes in both the methods indicates
that there is no significant difference.
5.2.3 Test-1 Objective-3 case-2
Testing of MOGA-GSHDC Algorithm for OPF Solution, using two
high density core points of two individual high density clusters for
minimum fuel cost and minimum Power loss,
Table 5.19 OPF Solution for IEEE 30-Bus System
Test-1 Objective-2 Case-2 (Generation Schedule, cost, CPU time)
Parameter Suboptimal OPF solution by IP Method
GSHDC-IP Method
PG1 (MW) 175.43 175.44
PG2 (MW) 47.81 48.86
PG5 (MW) 25.54 23.10
PG8(MW) 25.71 23.67
PG11 (MW) 12.56 11.56
PG13 (MW) 12 11.32
Total Cost of Generation
812.00 $/h 806.8495
CPU execution time 3.54 seconds 2.74
Table 5.20 OPF Solution for IEEE 30-Bus System - Test-1
Objective-2 Case-2 (Generator Bus Voltage Magnitude, power loss)
Parameter Suboptimal OPF solution by IP Method
GSHDC-IP Method
VG1 1.012 1.019
VG2 1.000 1.000
VG5 1.000 1.000
VG8 1.000 1.000
VG11 1.000 1.000
VG13 1.000 1.000
power loss (MW) 10.830 10.558
206
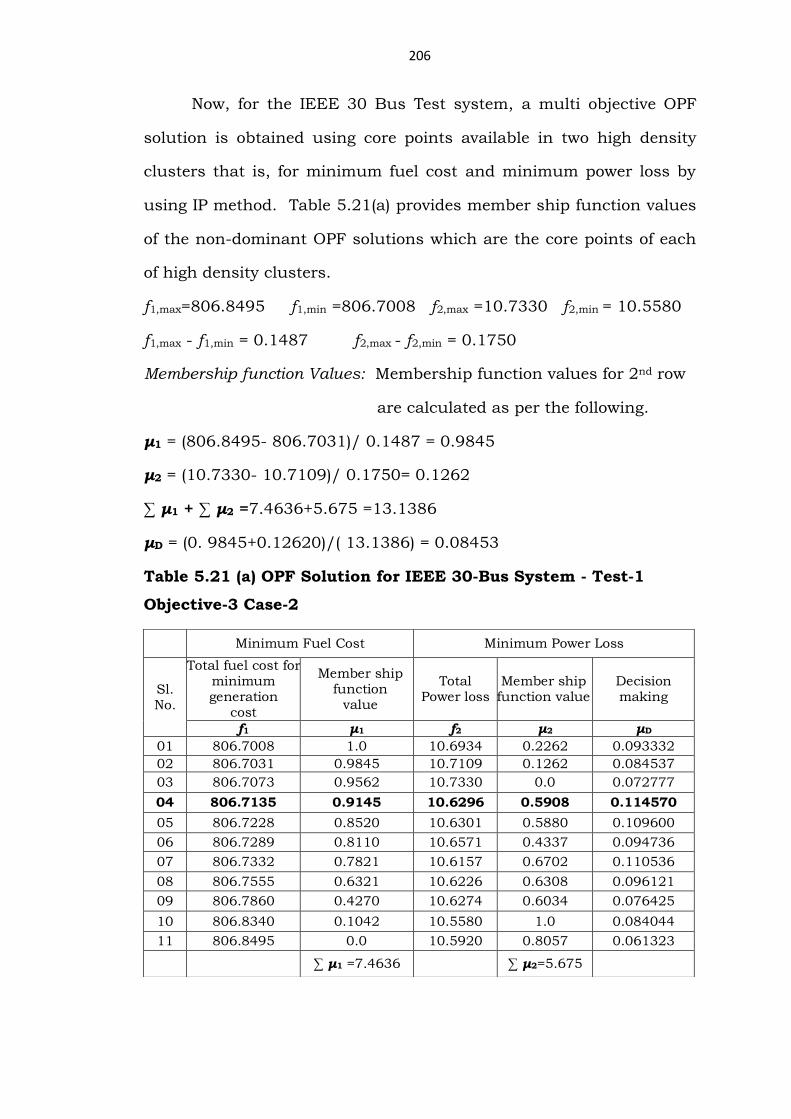
Now, for the IEEE 30 Bus Test system, a multi objective OPF
solution is obtained using core points available in two high density
clusters that is, for minimum fuel cost and minimum power loss by
using IP method. Table 5.21(a) provides member ship function values
of the non-dominant OPF solutions which are the core points of each
of high density clusters.
f1,max=806.8495 f1,min =806.7008 f2,max =10.7330 f2,min = 10.5580
f1,max - f1,min = 0.1487 f2,max - f2,min = 0.1750
Membership function Values: Membership function values for 2nd row
are calculated as per the following.
μ1 = (806.8495- 806.7031)/ 0.1487 = 0.9845
μ2 = (10.7330- 10.7109)/ 0.1750= 0.1262
∑ μ1 + ∑ μ2 =7.4636+5.675 =13.1386
μD = (0. 9845+0.12620)/( 13.1386) = 0.08453
Table 5.21 (a) OPF Solution for IEEE 30-Bus System - Test-1
Objective-3 Case-2
Minimum Fuel Cost Minimum Power Loss
Sl. No.
Total fuel cost for minimum generation
cost
Member ship function
value
Total Power loss
Member ship function value
Decision making
f1 μ1 f2 μ2 μD
01 806.7008 1.0 10.6934 0.2262 0.093332
02 806.7031 0.9845 10.7109 0.1262 0.084537
03 806.7073 0.9562 10.7330 0.0 0.072777
04 806.7135 0.9145 10.6296 0.5908 0.114570
05 806.7228 0.8520 10.6301 0.5880 0.109600
06 806.7289 0.8110 10.6571 0.4337 0.094736
07 806.7332 0.7821 10.6157 0.6702 0.110536
08 806.7555 0.6321 10.6226 0.6308 0.096121
09 806.7860 0.4270 10.6274 0.6034 0.076425
10 806.8340 0.1042 10.5580 1.0 0.084044
11 806.8495 0.0 10.5920 0.8057 0.061323
∑ μ1 =7.4636 ∑ μ2=5.675
207
Multi-Objective OPF Solution-Decision Making
From the Table 5.21, it is observed the μD has maximum value
in 4th row. Accordingly the corresponding values of f1 and f2 are taken
as the multi objective OPF solution for the objectives minimum fuel
cost and minimum power loss respectively.
The values of f1 and f2 are:
f1 - Minimum Fuel Cost: 806.7135 $/h.
f2 - Minimum Power Loss- 10.6296 MW.
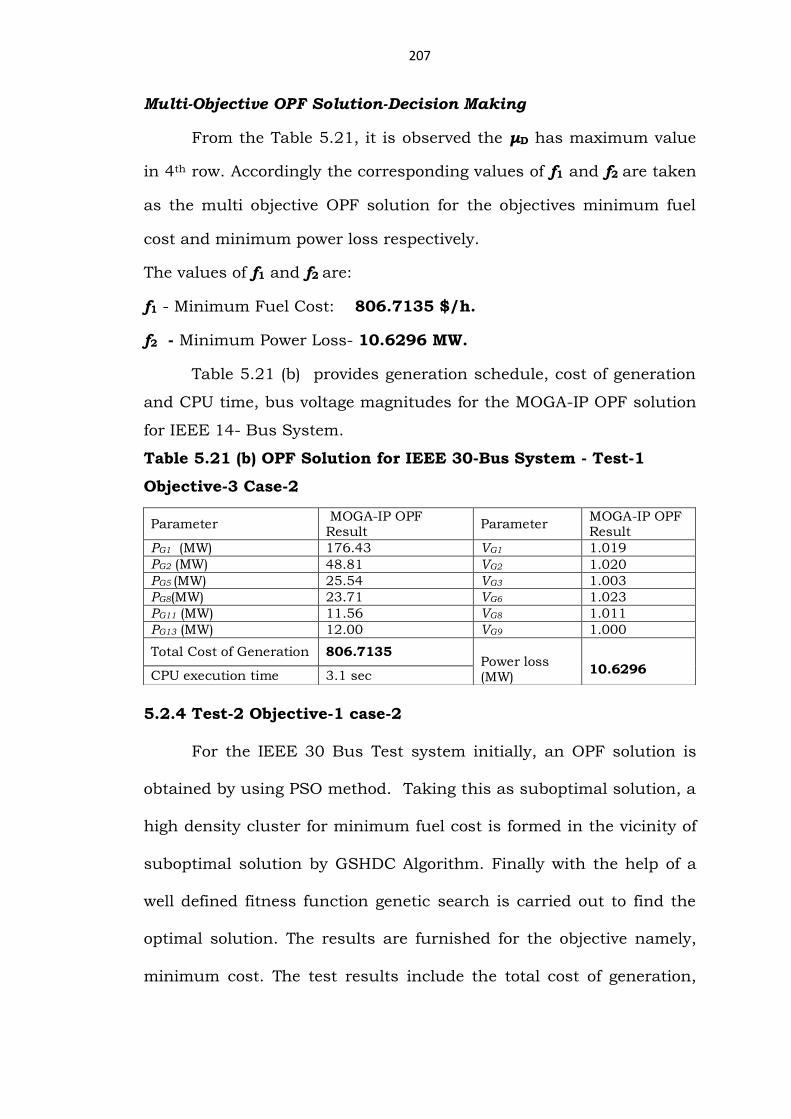
Table 5.21 (b) provides generation schedule, cost of generation
and CPU time, bus voltage magnitudes for the MOGA-IP OPF solution
for IEEE 14- Bus System.
Table 5.21 (b) OPF Solution for IEEE 30-Bus System - Test-1
Objective-3 Case-2
5.2.4 Test-2 Objective-1 case-2
For the IEEE 30 Bus Test system initially, an OPF solution is
obtained by using PSO method. Taking this as suboptimal solution, a
high density cluster for minimum fuel cost is formed in the vicinity of
suboptimal solution by GSHDC Algorithm. Finally with the help of a
well defined fitness function genetic search is carried out to find the
optimal solution. The results are furnished for the objective namely,
minimum cost. The test results include the total cost of generation,
Parameter MOGA-IP OPF Result
Parameter MOGA-IP OPF Result
PG1 (MW) 176.43 VG1 1.019
PG2 (MW) 48.81 VG2 1.020
PG5 (MW) 25.54 VG3 1.003
PG8(MW) 23.71 VG6 1.023
PG11 (MW) 11.56 VG8 1.011
PG13 (MW) 12.00 VG9 1.000
Total Cost of Generation 806.7135 Power loss (MW)
10.6296
CPU execution time 3.1 sec
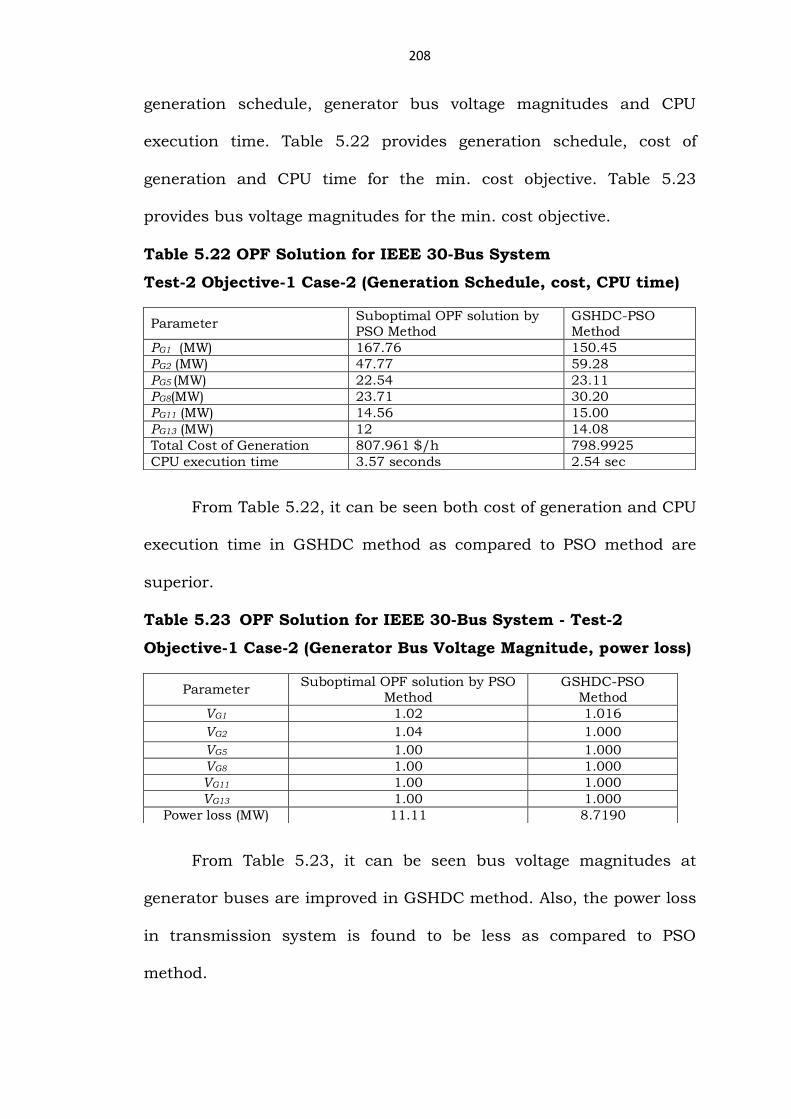
208
generation schedule, generator bus voltage magnitudes and CPU
execution time. Table 5.22 provides generation schedule, cost of
generation and CPU time for the min. cost objective. Table 5.23
provides bus voltage magnitudes for the min. cost objective.
Table 5.22 OPF Solution for IEEE 30-Bus System
Test-2 Objective-1 Case-2 (Generation Schedule, cost, CPU time)
From Table 5.22, it can be seen both cost of generation and CPU
execution time in GSHDC method as compared to PSO method are
superior.
Table 5.23 OPF Solution for IEEE 30-Bus System - Test-2
Objective-1 Case-2 (Generator Bus Voltage Magnitude, power loss)
From Table 5.23, it can be seen bus voltage magnitudes at
generator buses are improved in GSHDC method. Also, the power loss
in transmission system is found to be less as compared to PSO
method.
Parameter Suboptimal OPF solution by PSO Method
GSHDC-PSO Method
PG1 (MW) 167.76 150.45
PG2 (MW) 47.77 59.28
PG5 (MW) 22.54 23.11
PG8(MW) 23.71 30.20
PG11 (MW) 14.56 15.00
PG13 (MW) 12 14.08
Total Cost of Generation 807.961 $/h 798.9925
CPU execution time 3.57 seconds 2.54 sec
Parameter Suboptimal OPF solution by PSO
Method GSHDC-PSO
Method
VG1 1.02 1.016
VG2 1.04 1.000
VG5 1.00 1.000
VG8 1.00 1.000
VG11 1.00 1.000
VG13 1.00 1.000
Power loss (MW) 11.11 8.7190
209
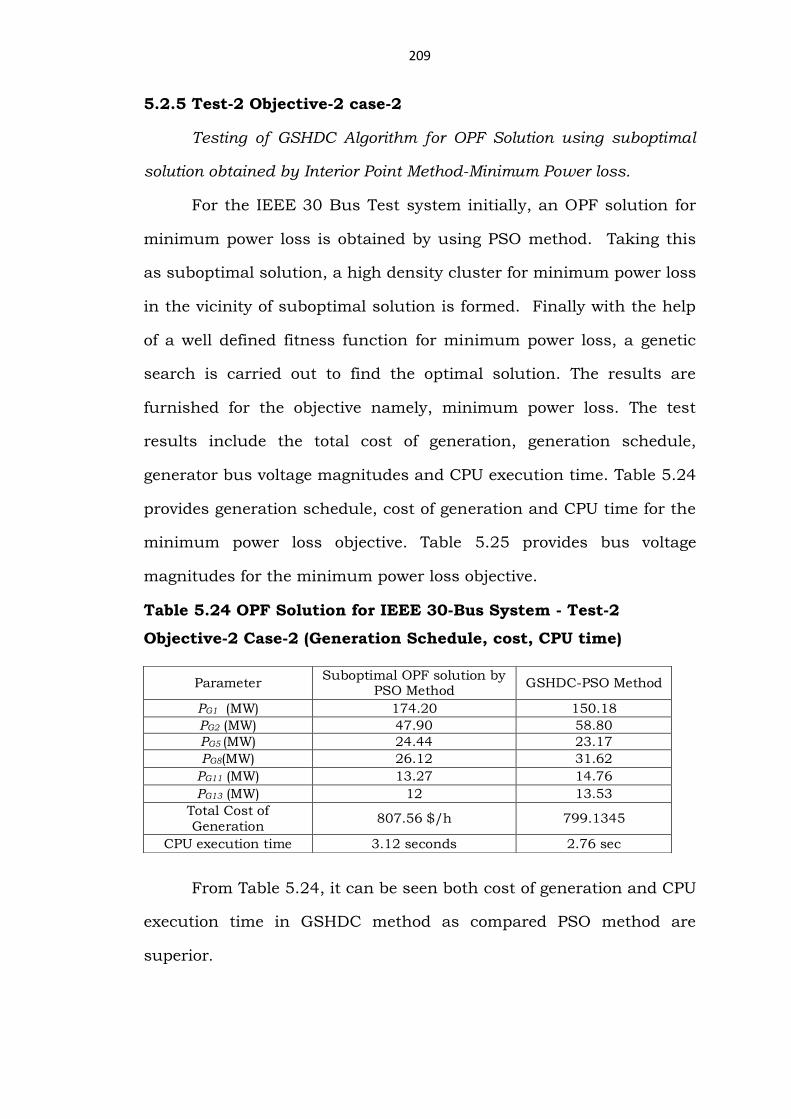
5.2.5 Test-2 Objective-2 case-2
Testing of GSHDC Algorithm for OPF Solution using suboptimal
solution obtained by Interior Point Method-Minimum Power loss.
For the IEEE 30 Bus Test system initially, an OPF solution for
minimum power loss is obtained by using PSO method. Taking this
as suboptimal solution, a high density cluster for minimum power loss
in the vicinity of suboptimal solution is formed. Finally with the help
of a well defined fitness function for minimum power loss, a genetic
search is carried out to find the optimal solution. The results are
furnished for the objective namely, minimum power loss. The test
results include the total cost of generation, generation schedule,
generator bus voltage magnitudes and CPU execution time. Table 5.24
provides generation schedule, cost of generation and CPU time for the
minimum power loss objective. Table 5.25 provides bus voltage
magnitudes for the minimum power loss objective.
Table 5.24 OPF Solution for IEEE 30-Bus System - Test-2
Objective-2 Case-2 (Generation Schedule, cost, CPU time)
From Table 5.24, it can be seen both cost of generation and CPU
execution time in GSHDC method as compared PSO method are
superior.
Parameter Suboptimal OPF solution by
PSO Method GSHDC-PSO Method
PG1 (MW) 174.20 150.18
PG2 (MW) 47.90 58.80
PG5 (MW) 24.44 23.17
PG8(MW) 26.12 31.62
PG11 (MW) 13.27 14.76
PG13 (MW) 12 13.53
Total Cost of Generation
807.56 $/h 799.1345
CPU execution time 3.12 seconds 2.76 sec
210
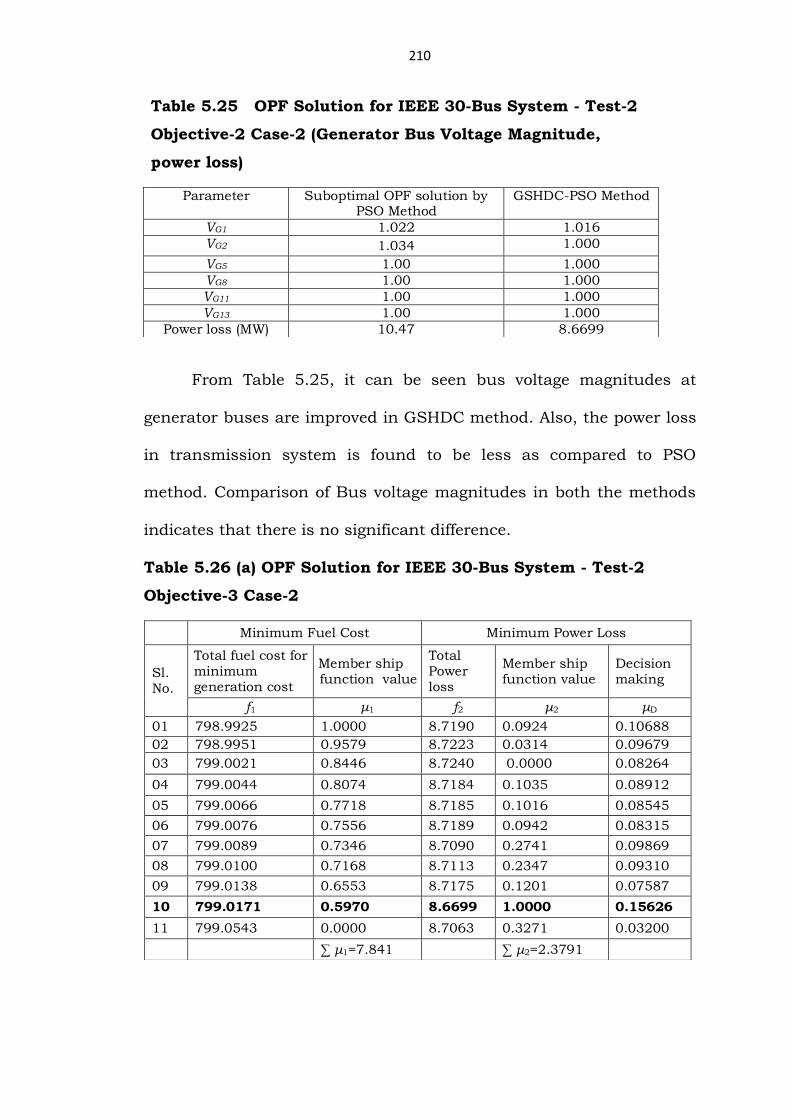
From Table 5.25, it can be seen bus voltage magnitudes at
generator buses are improved in GSHDC method. Also, the power loss
in transmission system is found to be less as compared to PSO
method. Comparison of Bus voltage magnitudes in both the methods
indicates that there is no significant difference.
Table 5.26 (a) OPF Solution for IEEE 30-Bus System - Test-2
Objective-3 Case-2
Table 5.25 OPF Solution for IEEE 30-Bus System - Test-2
Objective-2 Case-2 (Generator Bus Voltage Magnitude,
power loss)
Parameter Suboptimal OPF solution by PSO Method
GSHDC-PSO Method
VG1 1.022 1.016
VG2 1.034 1.000
VG5 1.00 1.000
VG8 1.00 1.000
VG11 1.00 1.000
VG13 1.00 1.000
Power loss (MW) 10.47 8.6699
Minimum Fuel Cost Minimum Power Loss
Sl. No.
Total fuel cost for minimum generation cost
Member ship function value
Total Power loss
Member ship function value
Decision making
f1 μ1 f2 μ2 μD
01 798.9925 1.0000 8.7190 0.0924 0.10688
02 798.9951 0.9579 8.7223 0.0314 0.09679
03 799.0021 0.8446 8.7240 0.0000 0.08264
04 799.0044 0.8074 8.7184 0.1035 0.08912
05 799.0066 0.7718 8.7185 0.1016 0.08545
06 799.0076 0.7556 8.7189 0.0942 0.08315
07 799.0089 0.7346 8.7090 0.2741 0.09869
08 799.0100 0.7168 8.7113 0.2347 0.09310
09 799.0138 0.6553 8.7175 0.1201 0.07587
10 799.0171 0.5970 8.6699 1.0000 0.15626
11 799.0543 0.0000 8.7063 0.3271 0.03200
∑ μ1=7.841 ∑ μ2=2.3791
211
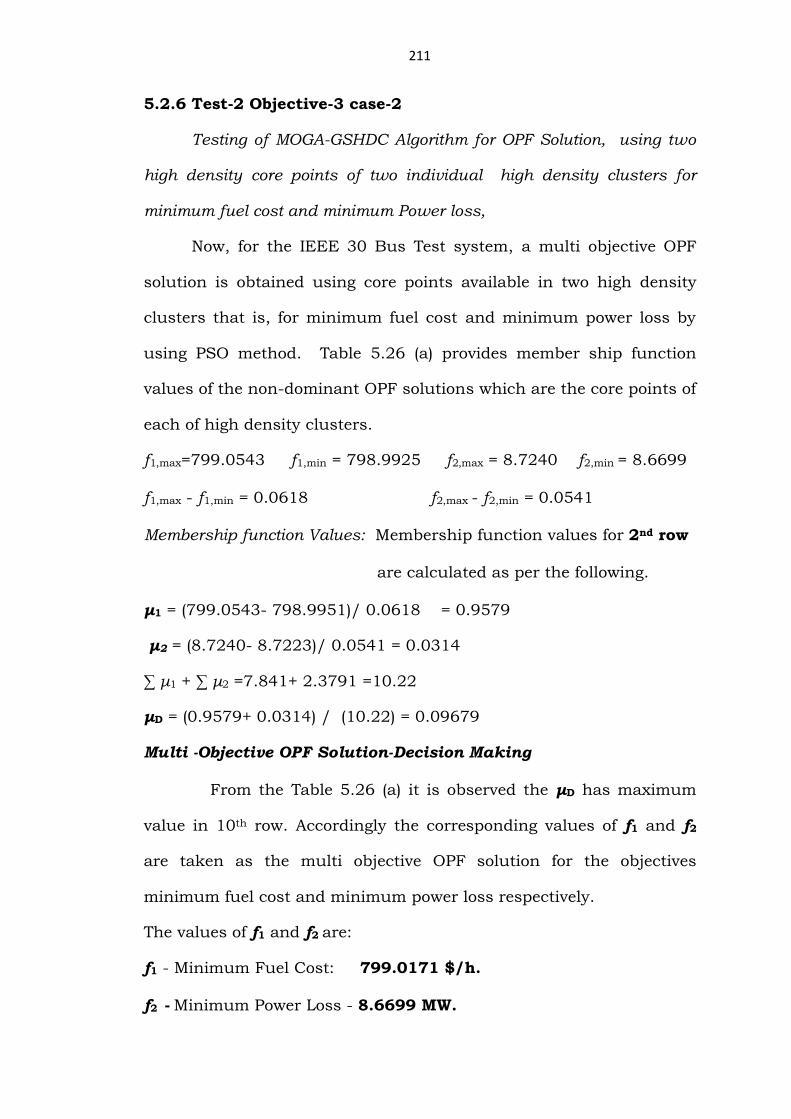
5.2.6 Test-2 Objective-3 case-2
Testing of MOGA-GSHDC Algorithm for OPF Solution, using two
high density core points of two individual high density clusters for
minimum fuel cost and minimum Power loss,
Now, for the IEEE 30 Bus Test system, a multi objective OPF
solution is obtained using core points available in two high density
clusters that is, for minimum fuel cost and minimum power loss by
using PSO method. Table 5.26 (a) provides member ship function
values of the non-dominant OPF solutions which are the core points of
each of high density clusters.
f1,max=799.0543 f1,min = 798.9925 f2,max = 8.7240 f2,min = 8.6699
f1,max - f1,min = 0.0618 f2,max - f2,min = 0.0541
Membership function Values: Membership function values for 2nd row
are calculated as per the following.
μ1 = (799.0543- 798.9951)/ 0.0618 = 0.9579
μ2 = (8.7240- 8.7223)/ 0.0541 = 0.0314
∑ μ1 + ∑ μ2 =7.841+ 2.3791 =10.22
μD = (0.9579+ 0.0314) / (10.22) = 0.09679
Multi -Objective OPF Solution-Decision Making
From the Table 5.26 (a) it is observed the μD has maximum
value in 10th row. Accordingly the corresponding values of f1 and f2
are taken as the multi objective OPF solution for the objectives
minimum fuel cost and minimum power loss respectively.
The values of f1 and f2 are:
f1 - Minimum Fuel Cost: 799.0171 $/h.
f2 - Minimum Power Loss - 8.6699 MW.

212
Table 5.26 (b) OPF Solution for IEEE 30-Bus System - Test-2
Objective-3 Case-2
Table 5.26 (b) provides generation schedule, cost of generation
and CPU time, bus voltage magnitudes for the MOGA-PSO OPF
solution for IEEE 30- Bus System. MOGA-PSO results when compared
to MOGA-IP results, it can be seen OPF results are better through
former method.
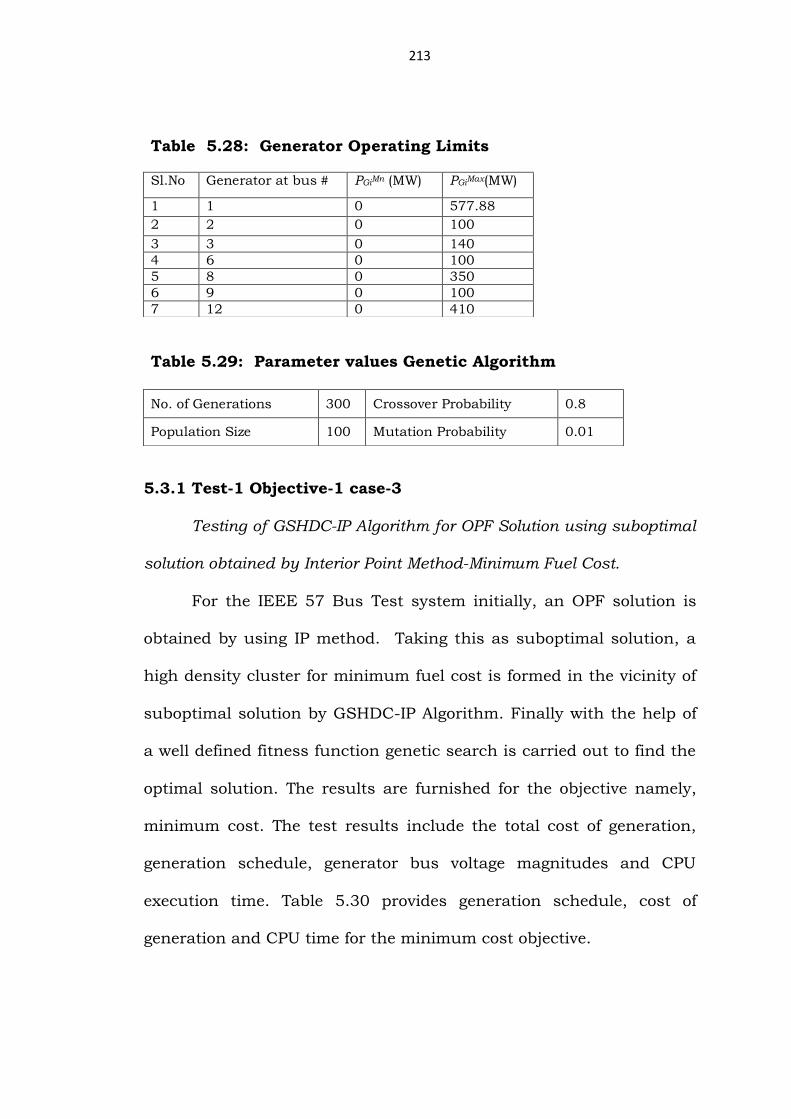
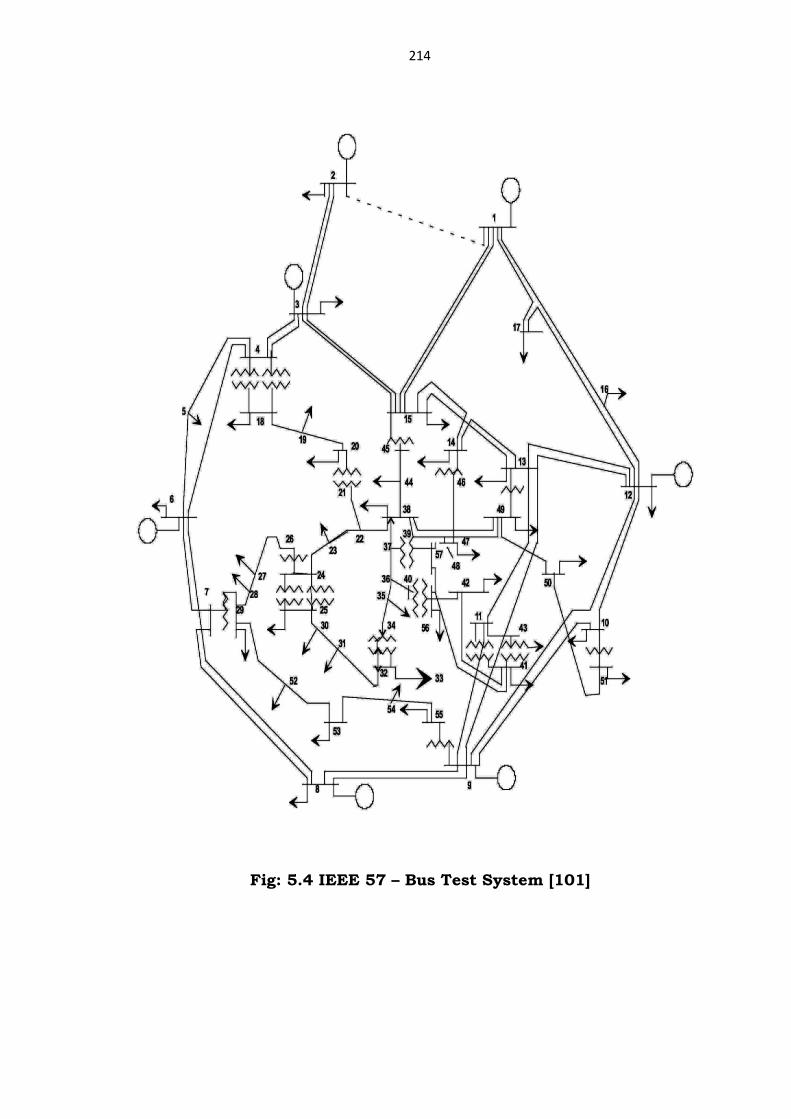
5.3 SIMULATION RESULTS - IEEE 57 BUS TEST SYSTEM
In this study, the standard IEEE 57-Bus 7 Generator test
system is considered to investigate effectiveness of the GSHDC
approach. The IEEE 57-bus system has 80 transmission lines. The
single line diagram is shown in Fig. 5.4. The total load demand of the
system is 259MW and 7-Generators should share load optimally. The
values of fuel cost coefficients are given in Table 5.27. Generator
active power limits are presented in Table 5.28. Table 5.29 provides
Parameter values of Genetic Algorithm.
Parameter MOGA-PSO OPF Result
Parameter MOGA-PSO OPF Result
PG1 (MW) 152.23 VG1 1.016
PG2 (MW) 59.10 VG2 1.001
PG5 (MW) 24.17 VG3 1.020
PG8(MW) 30.62 VG6 1.010
PG11 (MW) 15.70 VG8 1.010
PG13 (MW) 13.23 VG9 1.000
Total Cost of Generation
799.0171 Power loss (MW)
8.6699
CPU execution time 3.2 sec
Table 5.27: Generator Fuel Cost Coefficients
Sl.No Generator at bus #
i ($/h) i ($/MWhr) i ($/MWhr2)
1 1 0 20 0.0775
2 2 0 40 0.01
3 3 0 20 0.25
4 6 0 40 0.01
5 8 0 20 0.0222
6 9 0 40 0.01
7 12 0 20 0.022
213
5.3.1 Test-1 Objective-1 case-3
Testing of GSHDC-IP Algorithm for OPF Solution using suboptimal
solution obtained by Interior Point Method-Minimum Fuel Cost.
For the IEEE 57 Bus Test system initially, an OPF solution is
obtained by using IP method. Taking this as suboptimal solution, a
high density cluster for minimum fuel cost is formed in the vicinity of
suboptimal solution by GSHDC-IP Algorithm. Finally with the help of
a well defined fitness function genetic search is carried out to find the
optimal solution. The results are furnished for the objective namely,
minimum cost. The test results include the total cost of generation,
generation schedule, generator bus voltage magnitudes and CPU
execution time. Table 5.30 provides generation schedule, cost of
generation and CPU time for the minimum cost objective.
Table 5.28: Generator Operating Limits
Sl.No Generator at bus # PGiMn (MW) PGiMax(MW)
1 1 0 577.88
2 2 0 100
3 3 0 140
4 6 0 100
5 8 0 350
6 9 0 100
7 12 0 410
Table 5.29: Parameter values Genetic Algorithm
No. of Generations 300 Crossover Probability 0.8
Population Size 100 Mutation Probability 0.01
214
Fig: 5.4 IEEE 57 – Bus Test System [101]

215
Table 5.30 OPF Solution for IEEE 57-Bus System
Test-1 Objective-1 Case-3 (Generation Schedule, cost, CPU time)
From Table 5.30, it can be seen both cost of generation and CPU
execution time in GSHDC method as compared to IP method are
superior.
From Table 5.31, it can be seen bus voltage magnitudes at
generator buses are improved in GSHDC-IP method. Also, the power
loss in transmission system is found to be less as compared to IP
method.
5.3.2 Test-1 Objective-2 case-3
Testing of GSHDC-IP Algorithm for OPF Solution using suboptimal
solution obtained by Interior Point Method-Minimum Power loss
Parameter IP Method GSHDC -IP Method
PG1 (MW) 146.63 144.89
PG2 (MW) 97.79 93.08
PG3 (MW) 47.07 45.19
PG6 (MW) 72.86 68.15
PG8 (MW) 489.80 476.03
PG9 (MW) 97.63 95.90
PG12 (MW) 361.52 365.97
Total Cost of Generation
42,737.79 $/h 41,873.00 $/h
CPU execution time 3.17 sec 2.89 sec
Table 5.31 OPF Solution for IEEE 57-Bus System
Test-1 Objective-1 Case-3 (Generator Bus Voltage
Magnitude, power loss)
Parameter Suboptimal OPF solution by IP Method GSHDC-IP Method
VG1 1.040 1.050
VG2 1.008 1.010
VG3 0.985 1.003
VG6 0.980 1.026
VG8 1.044 1.050
VG9 0.980 1.044
VG12 0.992 1.015
Power loss (MW) 18.0692 17.4038
216
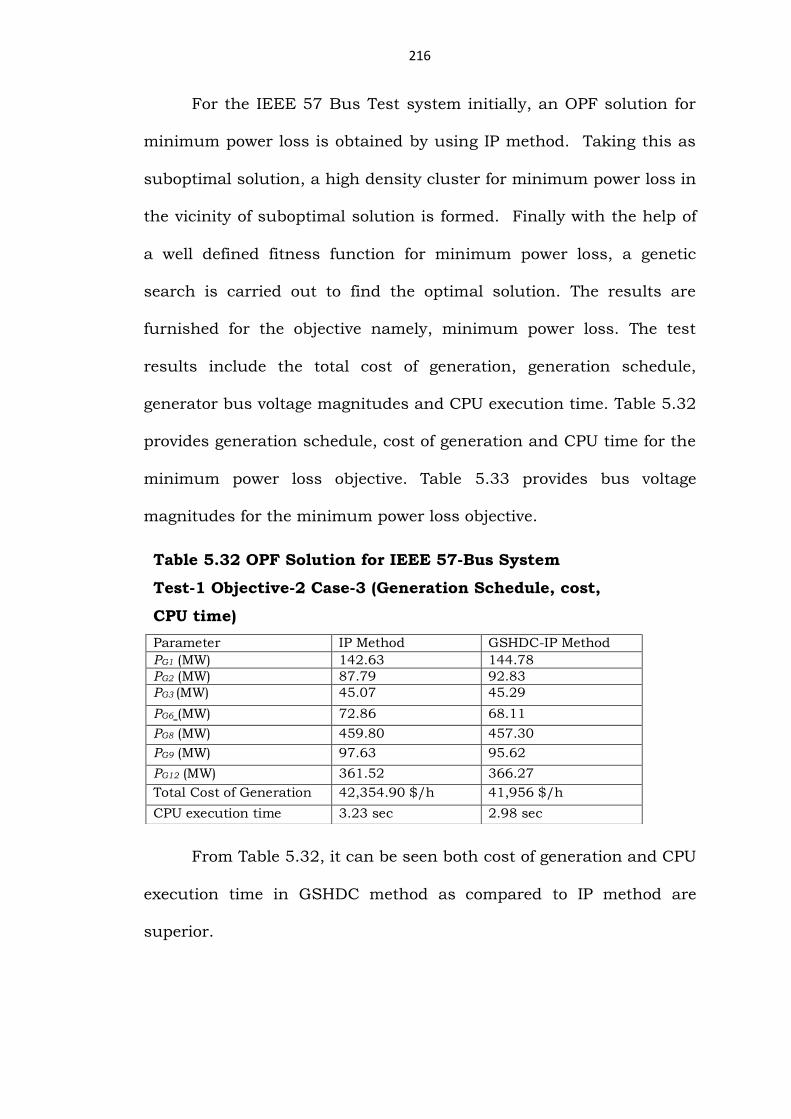
For the IEEE 57 Bus Test system initially, an OPF solution for
minimum power loss is obtained by using IP method. Taking this as
suboptimal solution, a high density cluster for minimum power loss in
the vicinity of suboptimal solution is formed. Finally with the help of
a well defined fitness function for minimum power loss, a genetic
search is carried out to find the optimal solution. The results are
furnished for the objective namely, minimum power loss. The test
results include the total cost of generation, generation schedule,
generator bus voltage magnitudes and CPU execution time. Table 5.32
provides generation schedule, cost of generation and CPU time for the
minimum power loss objective. Table 5.33 provides bus voltage
magnitudes for the minimum power loss objective.
From Table 5.32, it can be seen both cost of generation and CPU
execution time in GSHDC method as compared to IP method are
superior.
Table 5.32 OPF Solution for IEEE 57-Bus System
Test-1 Objective-2 Case-3 (Generation Schedule, cost,
CPU time)
Parameter IP Method GSHDC-IP Method
PG1 (MW) 142.63 144.78
PG2 (MW) 87.79 92.83
PG3 (MW) 45.07 45.29
PG6 (MW) 72.86 68.11
PG8 (MW) 459.80 457.30
PG9 (MW) 97.63 95.62
PG12 (MW) 361.52 366.27
Total Cost of Generation 42,354.90 $/h 41,956 $/h
CPU execution time 3.23 sec 2.98 sec
217
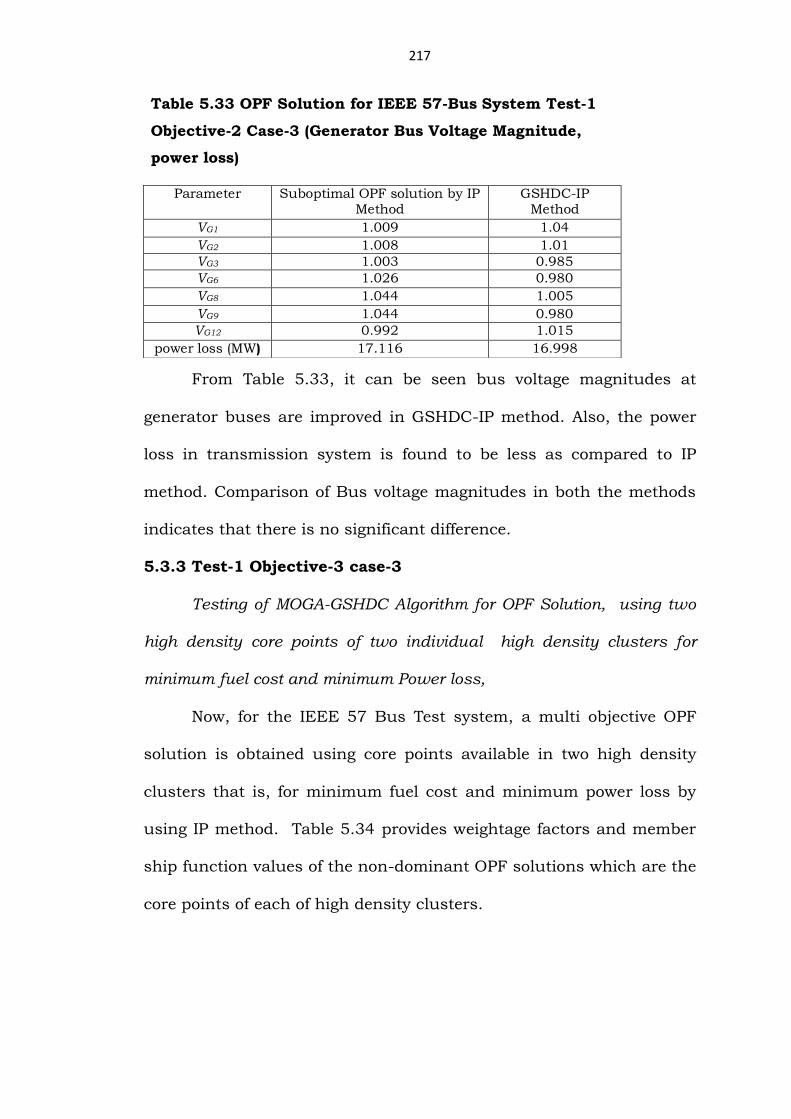
From Table 5.33, it can be seen bus voltage magnitudes at
generator buses are improved in GSHDC-IP method. Also, the power
loss in transmission system is found to be less as compared to IP
method. Comparison of Bus voltage magnitudes in both the methods
indicates that there is no significant difference.
5.3.3 Test-1 Objective-3 case-3
Testing of MOGA-GSHDC Algorithm for OPF Solution, using two
high density core points of two individual high density clusters for
minimum fuel cost and minimum Power loss,
Now, for the IEEE 57 Bus Test system, a multi objective OPF
solution is obtained using core points available in two high density
clusters that is, for minimum fuel cost and minimum power loss by
using IP method. Table 5.34 provides weightage factors and member
ship function values of the non-dominant OPF solutions which are the
core points of each of high density clusters.
Table 5.33 OPF Solution for IEEE 57-Bus System Test-1
Objective-2 Case-3 (Generator Bus Voltage Magnitude,
power loss)
Parameter Suboptimal OPF solution by IP Method
GSHDC-IP Method
VG1 1.009 1.04
VG2 1.008 1.01
VG3 1.003 0.985
VG6 1.026 0.980
VG8 1.044 1.005
VG9 1.044 0.980
VG12 0.992 1.015
power loss (MW) 17.116 16.998
218
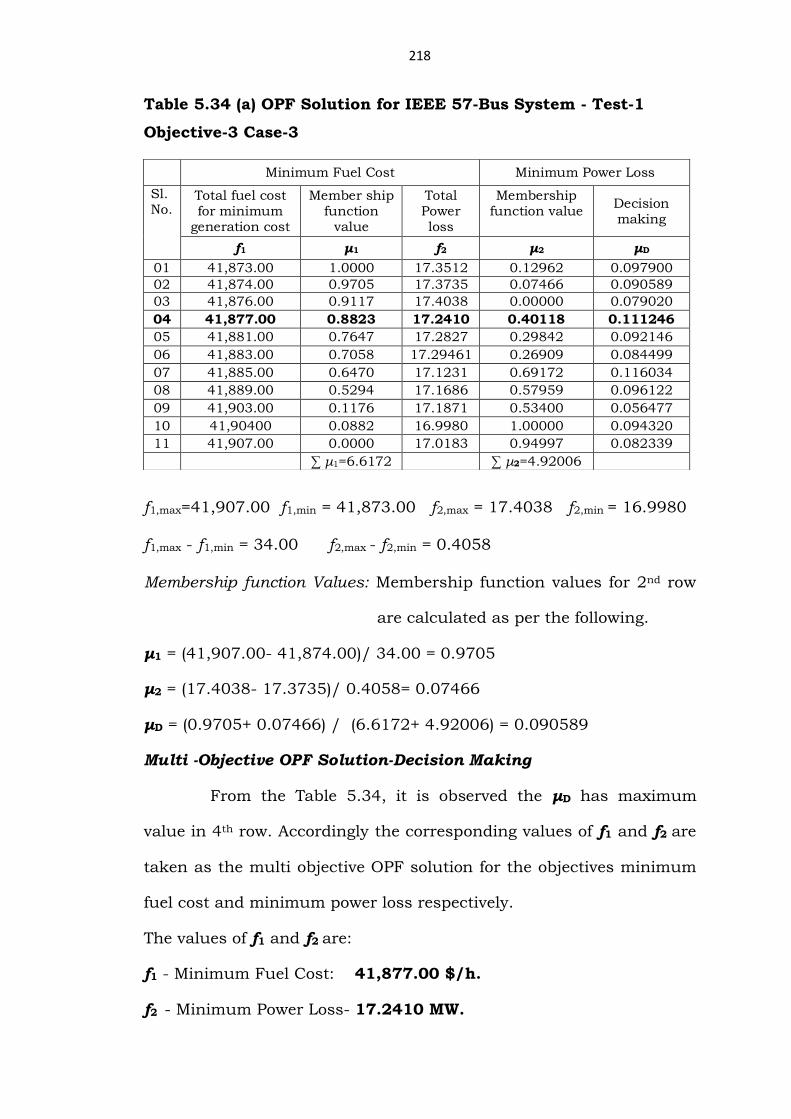
Table 5.34 (a) OPF Solution for IEEE 57-Bus System - Test-1
Objective-3 Case-3
f1,max=41,907.00 f1,min = 41,873.00 f2,max = 17.4038 f2,min = 16.9980
f1,max - f1,min = 34.00 f2,max - f2,min = 0.4058
Membership function Values: Membership function values for 2nd row
are calculated as per the following.
μ1 = (41,907.00- 41,874.00)/ 34.00 = 0.9705
μ2 = (17.4038- 17.3735)/ 0.4058= 0.07466
μD = (0.9705+ 0.07466) / (6.6172+ 4.92006) = 0.090589
Multi -Objective OPF Solution-Decision Making
From the Table 5.34, it is observed the μD has maximum
value in 4th row. Accordingly the corresponding values of f1 and f2 are
taken as the multi objective OPF solution for the objectives minimum
fuel cost and minimum power loss respectively.
The values of f1 and f2 are:
f1 - Minimum Fuel Cost: 41,877.00 $/h.
f2 - Minimum Power Loss- 17.2410 MW.
Minimum Fuel Cost Minimum Power Loss
Sl. No.
Total fuel cost for minimum
generation cost
Member ship function
value
Total Power loss
Membership function value
Decision making
f1 μ1 f2 μ2 μD
01 41,873.00 1.0000 17.3512 0.12962 0.097900
02 41,874.00 0.9705 17.3735 0.07466 0.090589
03 41,876.00 0.9117 17.4038 0.00000 0.079020
04 41,877.00 0.8823 17.2410 0.40118 0.111246
05 41,881.00 0.7647 17.2827 0.29842 0.092146
06 41,883.00 0.7058 17.29461 0.26909 0.084499
07 41,885.00 0.6470 17.1231 0.69172 0.116034
08 41,889.00 0.5294 17.1686 0.57959 0.096122
09 41,903.00 0.1176 17.1871 0.53400 0.056477
10 41,90400 0.0882 16.9980 1.00000 0.094320
11 41,907.00 0.0000 17.0183 0.94997 0.082339
∑ μ1=6.6172 ∑ μ2=4.92006
219
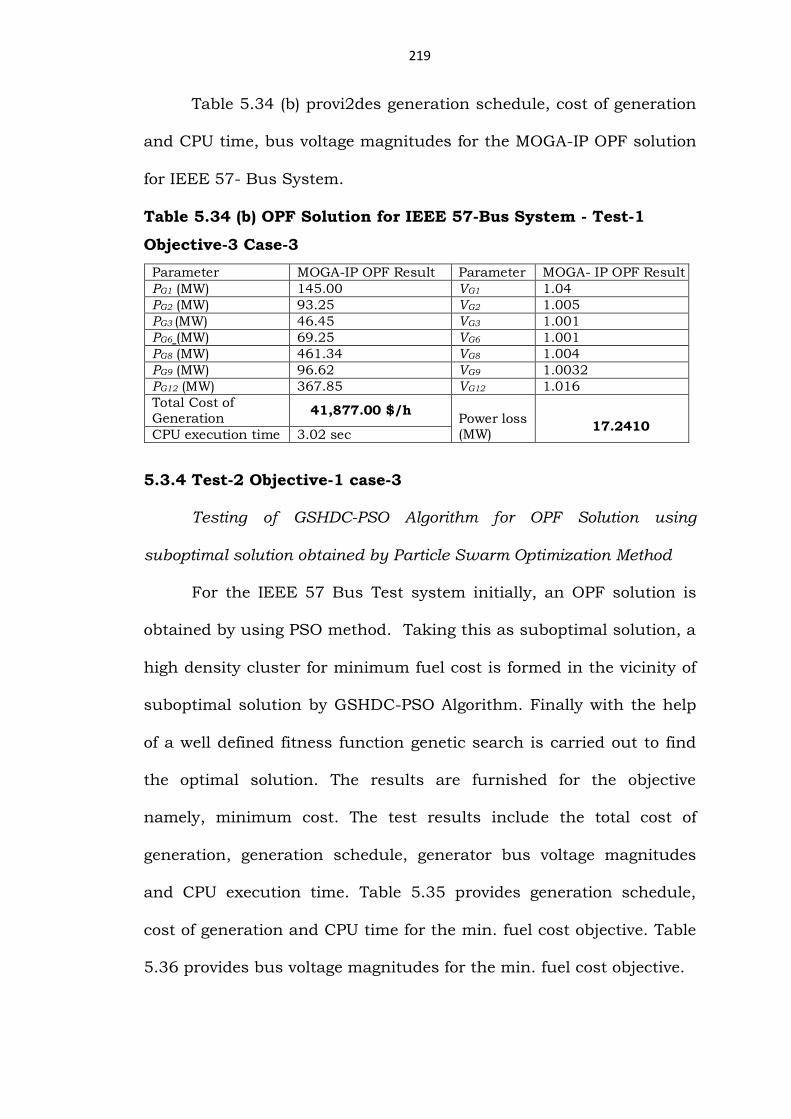
Table 5.34 (b) provi2des generation schedule, cost of generation
and CPU time, bus voltage magnitudes for the MOGA-IP OPF solution
for IEEE 57- Bus System.
Table 5.34 (b) OPF Solution for IEEE 57-Bus System - Test-1
Objective-3 Case-3
5.3.4 Test-2 Objective-1 case-3
Testing of GSHDC-PSO Algorithm for OPF Solution using
suboptimal solution obtained by Particle Swarm Optimization Method
For the IEEE 57 Bus Test system initially, an OPF solution is
obtained by using PSO method. Taking this as suboptimal solution, a
high density cluster for minimum fuel cost is formed in the vicinity of
suboptimal solution by GSHDC-PSO Algorithm. Finally with the help
of a well defined fitness function genetic search is carried out to find
the optimal solution. The results are furnished for the objective
namely, minimum cost. The test results include the total cost of
generation, generation schedule, generator bus voltage magnitudes
and CPU execution time. Table 5.35 provides generation schedule,
cost of generation and CPU time for the min. fuel cost objective. Table
5.36 provides bus voltage magnitudes for the min. fuel cost objective.
Parameter MOGA-IP OPF Result Parameter MOGA- IP OPF Result
PG1 (MW) 145.00 VG1 1.04
PG2 (MW) 93.25 VG2 1.005
PG3 (MW) 46.45 VG3 1.001
PG6 (MW) 69.25 VG6 1.001
PG8 (MW) 461.34 VG8 1.004
PG9 (MW) 96.62 VG9 1.0032
PG12 (MW) 367.85 VG12 1.016
Total Cost of Generation
41,877.00 $/h Power loss (MW)
17.2410
CPU execution time 3.02 sec

220
From Table 5.35, it can be seen both cost of generation and CPU
execution time in GSHDC-PSO method as compared to PSO method
are superior.
Table 5.36 OPF Solution for IEEE 57-Bus System
Test-2 Objective-1 Case-3 (Generator Bus Voltage Magnitude,
power loss)
From Table 5.36, it can be seen bus voltage magnitudes at
generator buses are improved in GSHDC method. Also, the power loss
in transmission system is found to be less as compared to IP method.
5.3.5 Test-2 Objective-2 case-3
Testing of GSHDC-PSO Algorithm for OPF Solution using
suboptimal solution obtained by Particle Swarm Optimization Method -
Minimum Power loss.
Table 5.35 OPF Solution for IEEE 57-Bus System
Test-2 Objective-1 Case-3 (Generation Schedule, cost, CPU time)
Parameter PSO Method GSHDC-PSO Method
PG1 (MW) 145.43 140.24
PG2 (MW) 95.56 81.60
PG3 (MW) 46.12 48.32
PG6 (MW) 69.78 68.72
PG8 (MW) 479.80 476.83
PG9 (MW) 96.63 84.05
PG12 (MW) 363.52 367.69
Total Cost of Generation 42,145.79 $/h 41,327.00 $/h
CPU execution time 3.45 sec 2.98 se
Parameter Suboptimal OPF solution by PSO Method
GSHDC-PSO Method
VG1 1.002 1.050
VG2 1.009 1.015
VG3 0.995 1.025
VG6 0.995 1.030
VG8 1.046 1.050
VG9 0.980 1.050
VG12 1.000 1.030
Power loss (MW) 17.956 16.4471
221
For the IEEE 57 Bus Test system initially, an OPF solution for
minimum power loss is obtained by using PSO method. Taking this
as suboptimal solution, a high density cluster for minimum power loss
in the vicinity of suboptimal solution is formed. Finally with the help
of a well defined fitness function for minimum power loss, a genetic
search is carried out to find the optimal solution. The results are
furnished for the objective namely, minimum power loss. The test
results include the total cost of generation, generation schedule,
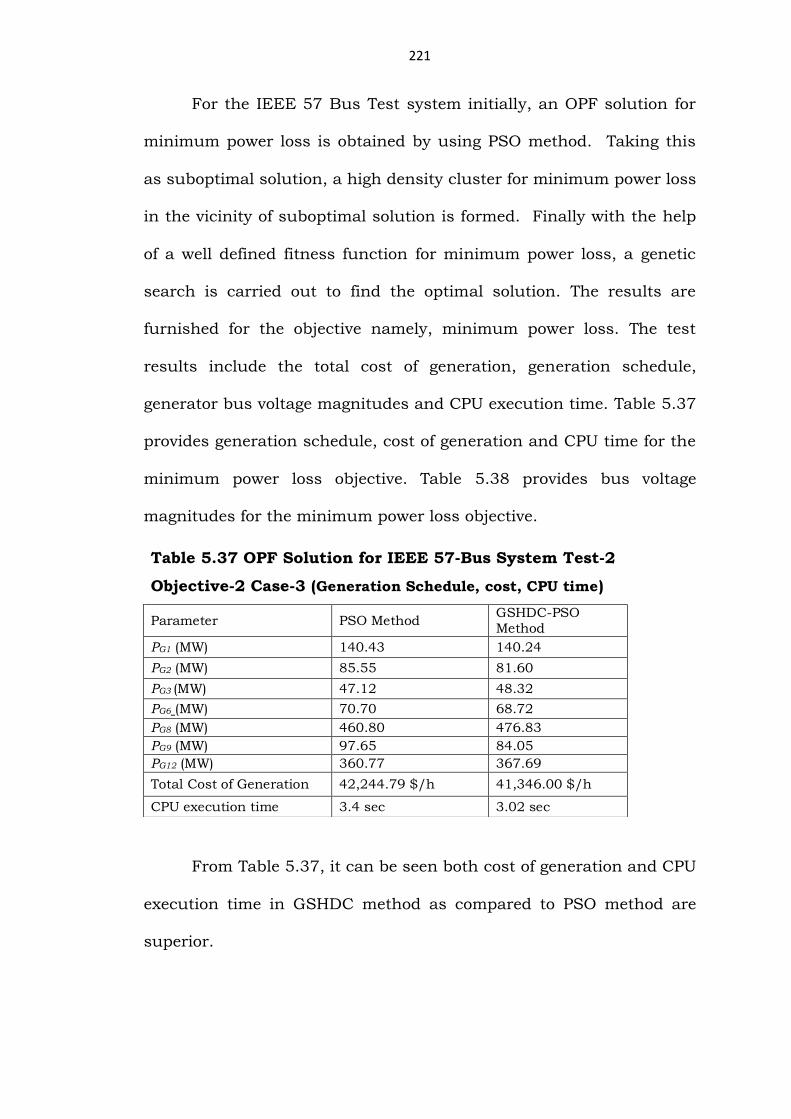
generator bus voltage magnitudes and CPU execution time. Table 5.37
provides generation schedule, cost of generation and CPU time for the
minimum power loss objective. Table 5.38 provides bus voltage
magnitudes for the minimum power loss objective.
From Table 5.37, it can be seen both cost of generation and CPU
execution time in GSHDC method as compared to PSO method are
superior.
Table 5.37 OPF Solution for IEEE 57-Bus System Test-2
Objective-2 Case-3 (Generation Schedule, cost, CPU time)
Parameter PSO Method GSHDC-PSO Method
PG1 (MW) 140.43 140.24
PG2 (MW) 85.55 81.60
PG3 (MW) 47.12 48.32
PG6 (MW) 70.70 68.72
PG8 (MW) 460.80 476.83
PG9 (MW) 97.65 84.05
PG12 (MW) 360.77 367.69
Total Cost of Generation 42,244.79 $/h 41,346.00 $/h
CPU execution time 3.4 sec 3.02 sec

222
Table 5.38 OPF Solution for IEEE 57-Bus System Test-2
Objective-2 Case-3 (Generator Bus Voltage Magnitude, power loss)
From Table 5.38, it can be seen bus voltage magnitudes at
generator buses are improved in GSHDC-PSO method. Also, the power
loss in transmission system is found to be less as compared to PSO
method. Comparison of Bus voltage magnitudes in both the methods
indicates that there is no significant difference.
5.3.6 Test-2 Objective-3 case-3
Testing of MOGA-GSHDC Algorithm for OPF Solution, using two
high density core points of two individual high density clusters for
minimum fuel cost and minimum Power loss.
Now, for the IEEE 57 Bus Test system, a multi objective OPF
solution is obtained using core points available in two high density
clusters that is, for minimum fuel cost and minimum power loss by
using PSO method. Table 5.39 (a) provides member ship function
values of the non-dominant OPF solutions which are the core points of
each of high density clusters.
Parameter Suboptimal OPF solution by PSO
Method GSHDC-PSO
Method
VG1 1.009 1.009
VG2 1.008 1.008
VG3 1.003 1.003
VG6 1.026 1.026
VG8 1.044 1.044
VG9 1.044 1.044
VG12 0.992 0.992
Power loss (MW) 17.0692 16.0692
223
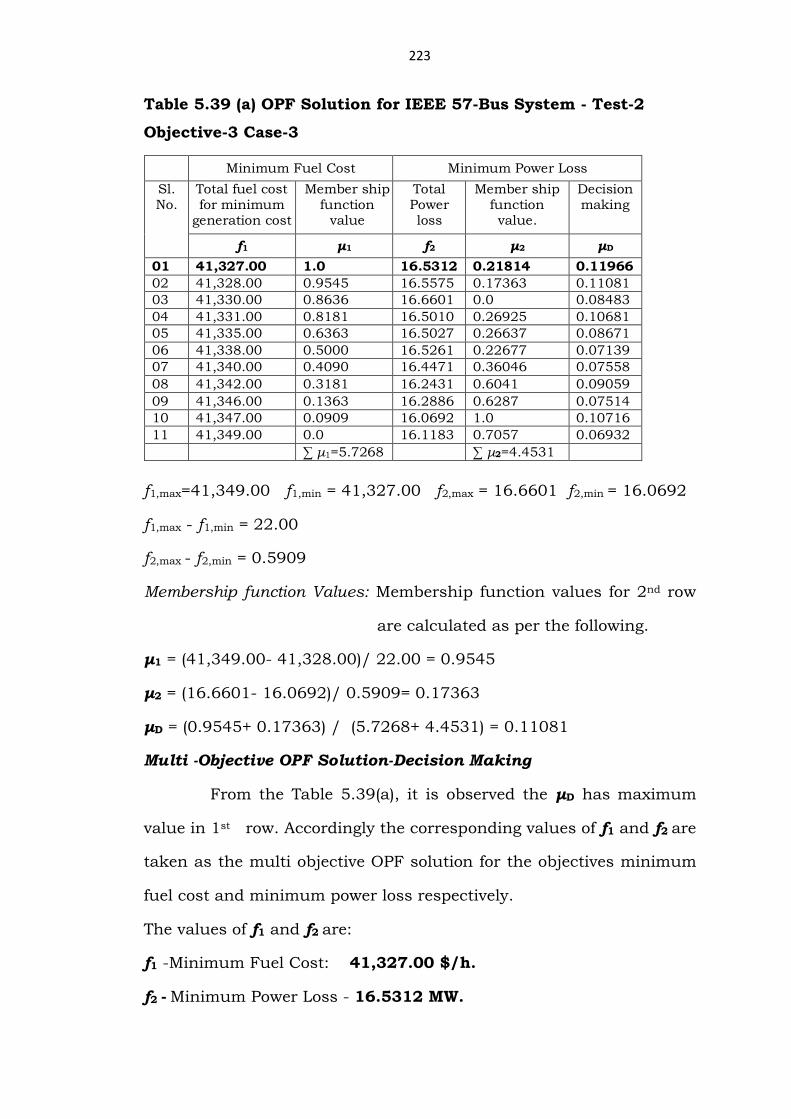
Table 5.39 (a) OPF Solution for IEEE 57-Bus System - Test-2
Objective-3 Case-3
f1,max=41,349.00 f1,min = 41,327.00 f2,max = 16.6601 f2,min = 16.0692
f1,max - f1,min = 22.00
f2,max - f2,min = 0.5909
Membership function Values: Membership function values for 2nd row
are calculated as per the following.
μ1 = (41,349.00- 41,328.00)/ 22.00 = 0.9545
μ2 = (16.6601- 16.0692)/ 0.5909= 0.17363
μD = (0.9545+ 0.17363) / (5.7268+ 4.4531) = 0.11081
Multi -Objective OPF Solution-Decision Making
From the Table 5.39(a), it is observed the μD has maximum
value in 1st row. Accordingly the corresponding values of f1 and f2 are
taken as the multi objective OPF solution for the objectives minimum
fuel cost and minimum power loss respectively.
The values of f1 and f2 are:
f1 -Minimum Fuel Cost: 41,327.00 $/h.
f2 - Minimum Power Loss - 16.5312 MW.
Minimum Fuel Cost Minimum Power Loss
Sl. No.
Total fuel cost for minimum
generation cost
Member ship function
value
Total Power loss
Member ship function value.
Decision making
f1 μ1 f2 μ2 μD
01 41,327.00 1.0 16.5312 0.21814 0.11966
02 41,328.00 0.9545 16.5575 0.17363 0.11081
03 41,330.00 0.8636 16.6601 0.0 0.08483
04 41,331.00 0.8181 16.5010 0.26925 0.10681
05 41,335.00 0.6363 16.5027 0.26637 0.08671
06 41,338.00 0.5000 16.5261 0.22677 0.07139
07 41,340.00 0.4090 16.4471 0.36046 0.07558
08 41,342.00 0.3181 16.2431 0.6041 0.09059
09 41,346.00 0.1363 16.2886 0.6287 0.07514
10 41,347.00 0.0909 16.0692 1.0 0.10716
11 41,349.00 0.0 16.1183 0.7057 0.06932
∑ μ1=5.7268 ∑ μ2=4.4531
224
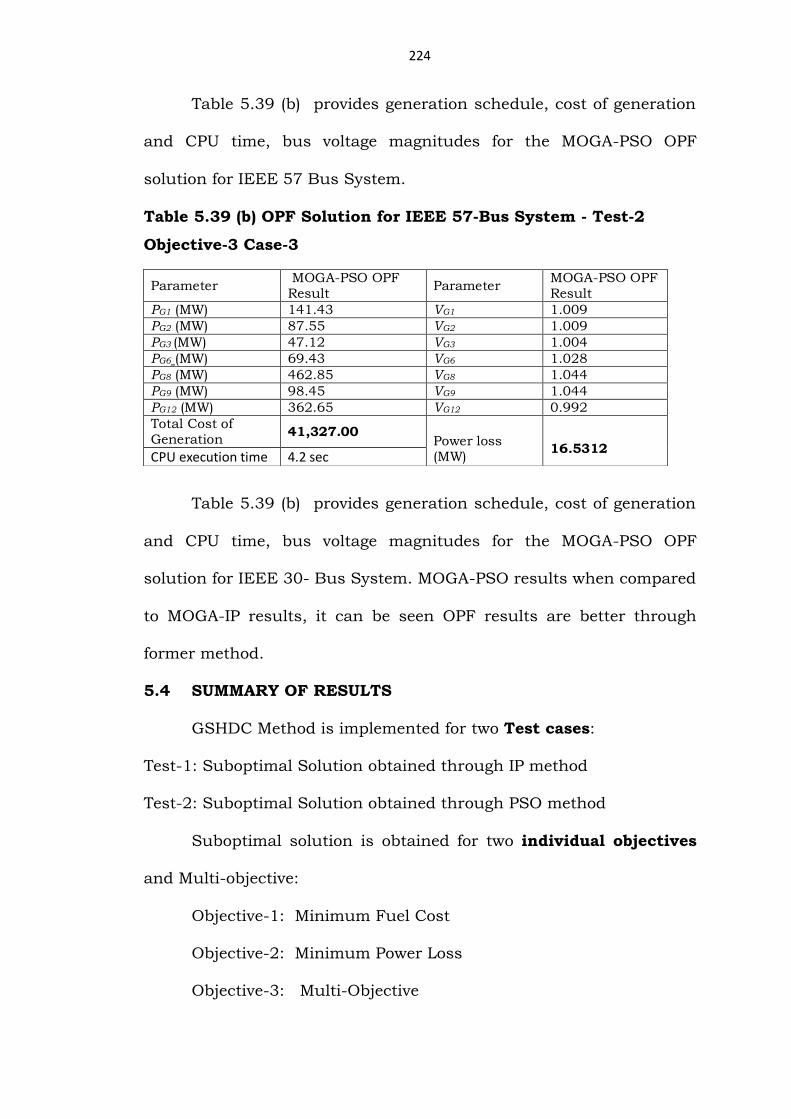
Table 5.39 (b) provides generation schedule, cost of generation
and CPU time, bus voltage magnitudes for the MOGA-PSO OPF
solution for IEEE 57 Bus System.
Table 5.39 (b) OPF Solution for IEEE 57-Bus System - Test-2
Objective-3 Case-3
Table 5.39 (b) provides generation schedule, cost of generation
and CPU time, bus voltage magnitudes for the MOGA-PSO OPF
solution for IEEE 30- Bus System. MOGA-PSO results when compared
to MOGA-IP results, it can be seen OPF results are better through
former method.
5.4 SUMMARY OF RESULTS
GSHDC Method is implemented for two Test cases:
Test-1: Suboptimal Solution obtained through IP method
Test-2: Suboptimal Solution obtained through PSO method
Suboptimal solution is obtained for two individual objectives
and Multi-objective:
Objective-1: Minimum Fuel Cost
Objective-2: Minimum Power Loss
Objective-3: Multi-Objective
Parameter MOGA-PSO OPF Result
Parameter MOGA-PSO OPF Result
PG1 (MW) 141.43 VG1 1.009
PG2 (MW) 87.55 VG2 1.009
PG3 (MW) 47.12 VG3 1.004
PG6 (MW) 69.43 VG6 1.028
PG8 (MW) 462.85 VG8 1.044
PG9 (MW) 98.45 VG9 1.044
PG12 (MW) 362.65 VG12 0.992
Total Cost of Generation
41,327.00 Power loss (MW)
16.5312
CPU execution time 4.2 sec

225
GSHDC is implemented for each Test case and each objective for
three case studies that is, three IEEE Test systems.
Case-1: IEEE 14-Bus System
Case-2: IEEE 30-Bus System
Case-3: IEEE 57-Bus System
Simulation results for all the Test cases, Objectives as well as
for different case studies is furnished in earlier sections. This section
presents summary of all results obtained.
Table 5.40 presents summary of GSHDC results for the case 14
bus system.
Table 5.40: Summary of Results –Case-1: IEEE 14 - Bus System
Table 5.41 presents summary of GSHDC results for the case 30
bus system.
Table 5.41 Summary of Results–Case-2: IEEE 30 - Bus System
.
Parameter IP Method
GSHDC-IP Method
PSO Method
GSHDC-PSO Method
MOGA- GSHDC (IP Based)
MOGA- GSHDC (PSO Based)
Fuel Cost ($/h) Objective-1
8081.53 8043.30 8079.40 8038.80 8046.35 8044.35
Power Loss (MW) Objective-2
9.2469 9.1643 9.2567 9.1587 9.190 9.180
Parameter IP Method
GSHDC-IP Method
PSO Method
GSHDC-PSO Method
MOGA- GSHDC (IP Based)
MOGA- GSHDC (PSO Based)
Fuel Cost ($/h) Objective-1
810.61 806.7008 807.961 798.9925 806.7135 799.0171
Power Loss (MW) Objective-2
10.830 10.558 10.47 8.6699 10.6296 8.6699
226
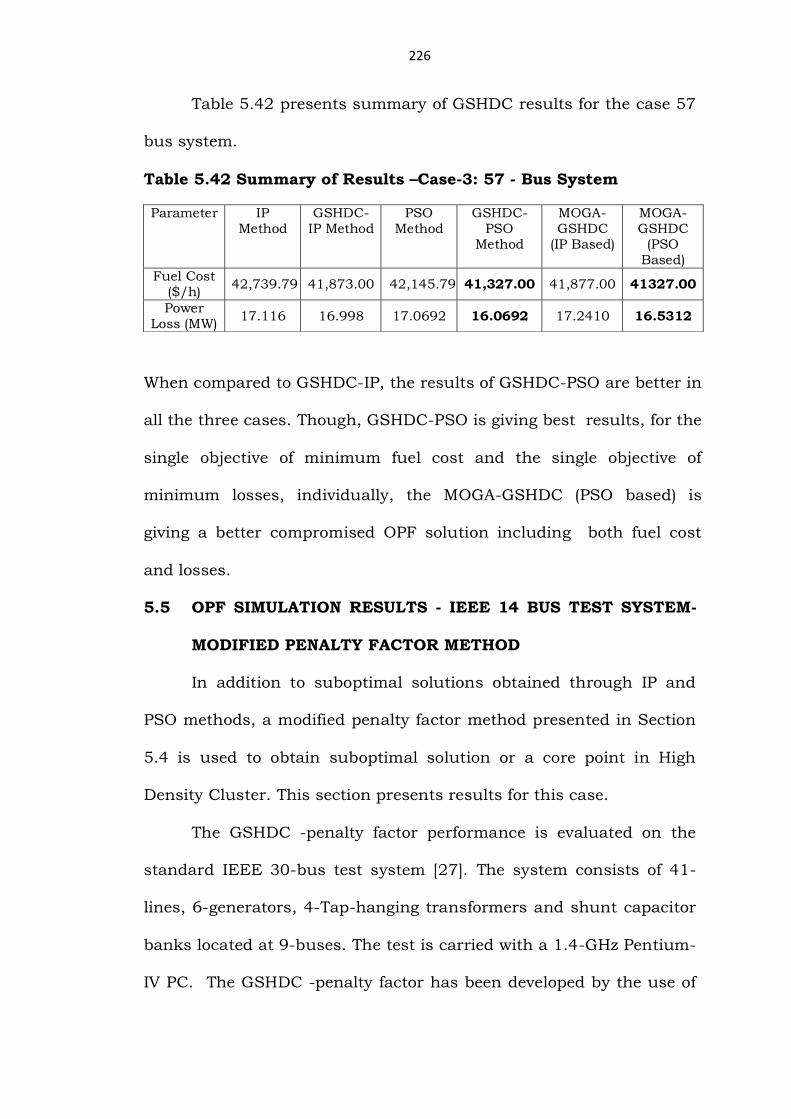
Table 5.42 presents summary of GSHDC results for the case 57
bus system.
Table 5.42 Summary of Results –Case-3: 57 - Bus System
When compared to GSHDC-IP, the results of GSHDC-PSO are better in
all the three cases. Though, GSHDC-PSO is giving best results, for the
single objective of minimum fuel cost and the single objective of
minimum losses, individually, the MOGA-GSHDC (PSO based) is
giving a better compromised OPF solution including both fuel cost
and losses.
5.5 OPF SIMULATION RESULTS - IEEE 14 BUS TEST SYSTEM-
MODIFIED PENALTY FACTOR METHOD
In addition to suboptimal solutions obtained through IP and
PSO methods, a modified penalty factor method presented in Section
5.4 is used to obtain suboptimal solution or a core point in High
Density Cluster. This section presents results for this case.
The GSHDC -penalty factor performance is evaluated on the
standard IEEE 30-bus test system [27]. The system consists of 41-
lines, 6-generators, 4-Tap-hanging transformers and shunt capacitor
banks located at 9-buses. The test is carried with a 1.4-GHz Pentium-
IV PC. The GSHDC -penalty factor has been developed by the use of
Parameter IP Method
GSHDC-IP Method
PSO Method
GSHDC-PSO
Method
MOGA- GSHDC
(IP Based)
MOGA- GSHDC
(PSO Based)
Fuel Cost ($/h)
42,739.79 41,873.00 42,145.79 41,327.00 41,877.00 41327.00
Power Loss (MW)
17.116 16.998 17.0692 16.0692 17.2410 16.5312
227
MATLAB version 7. The parameter settings to execute GSHDC-penalty
factor are probability of crossover=0.5, probability of Mutation= 0.7,
the population size is 20. The study is carried out for a total system
load of 283.4 MW. The power mismatch tolerance is 0.0001 p.u. and
other parameters are presented in Table 5.43.
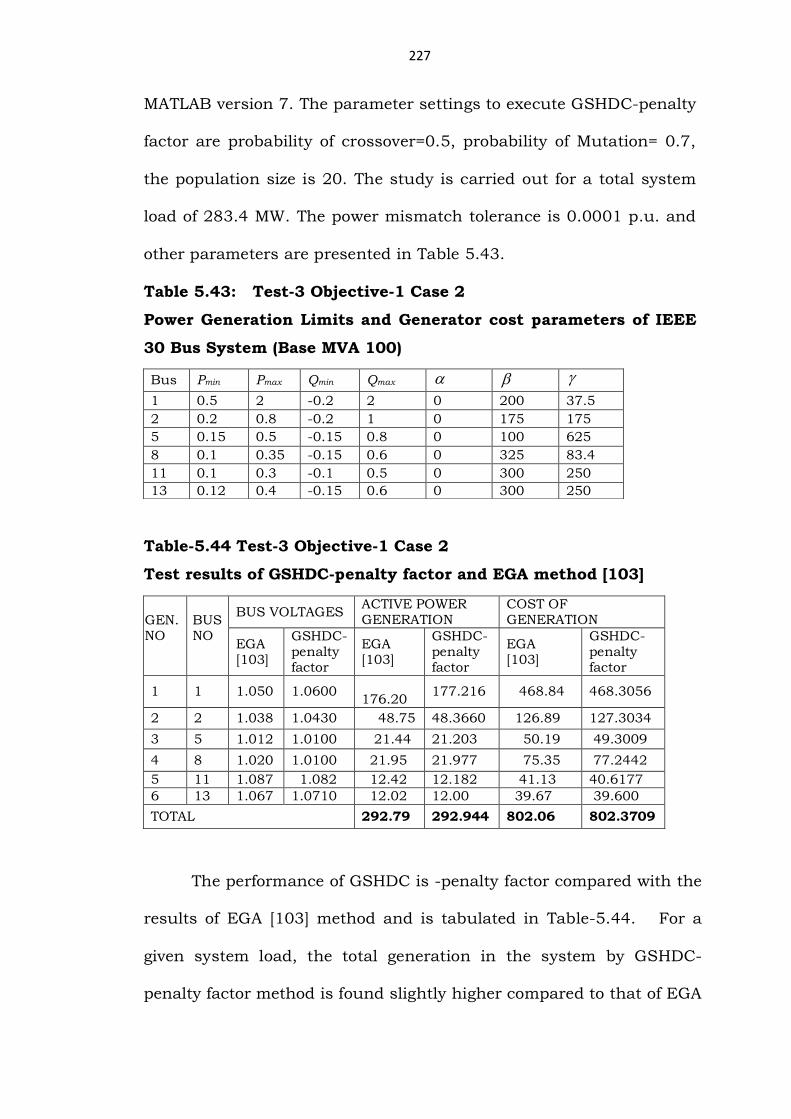
Table 5.43: Test-3 Objective-1 Case 2
Power Generation Limits and Generator cost parameters of IEEE
30 Bus System (Base MVA 100)
Table-5.44 Test-3 Objective-1 Case 2
Test results of GSHDC-penalty factor and EGA method [103]
The performance of GSHDC is -penalty factor compared with the
results of EGA [103] method and is tabulated in Table-5.44. For a
given system load, the total generation in the system by GSHDC-
penalty factor method is found slightly higher compared to that of EGA
Bus Pmin Pmax Qmin Qmax
1 0.5 2 -0.2 2 0 200 37.5
2 0.2 0.8 -0.2 1 0 175 175
5 0.15 0.5 -0.15 0.8 0 100 625
8 0.1 0.35 -0.15 0.6 0 325 83.4
11 0.1 0.3 -0.1 0.5 0 300 250
13 0.12 0.4 -0.15 0.6 0 300 250
GEN. NO
BUS NO
BUS VOLTAGES ACTIVE POWER GENERATION
COST OF GENERATION
EGA [103]
GSHDC-penalty factor
EGA [103]
GSHDC-penalty factor
EGA [103]
GSHDC-penalty factor
1 1 1.050 1.0600 176.20
177.216 468.84 468.3056
2 2 1.038 1.0430 48.75 48.3660 126.89 127.3034
3 5 1.012 1.0100 21.44 21.203 50.19 49.3009
4 8 1.020 1.0100 21.95 21.977 75.35 77.2442
5 11 1.087 1.082 12.42 12.182 41.13 40.6177
6 13 1.067 1.0710 12.02 12.00 39.67 39.600
TOTAL 292.79 292.944 802.06 802.3709

228
[103] method. The % high values are presented in Table-5.45. The
numerical difference can be ignored. The EGA [103] for an IEEE30-
Bus system is carried out with a computer having the same
configuration as mentioned above. Now, the comparison is made in
terms of generation cost and CPU time. The GSHDC -penalty factor
method gave less cost of generation. The GSHDC-penalty factor
method has completed objective-1 study in 8 seconds and objective-1
and objective -2 together in 12 seconds in contrast to 85 seconds that
is taken by EGA method. The authors of EGA method in their
conclusions have mentioned the high execution time of their method.
This proves the GSHDC-penalty factor method is quite acceptable for
large size power systems and for on-line studies.
Table-5.45: Test-3 Objective-1 & Objective-2 Case 2
Generation Schedule of GSHDC-penalty factor Compared to EGA [103]
Method
Total Active Power Generation Objective-1
Transmission Losses Objective-2
Total cost CPU Time
MW
%H
igh
com
pare
d t
o
EG
A m
eth
od
MW
%H
igh
com
pare
d t
o
EG
A m
eth
od
$/h
%H
igh
com
pare
d t
o
EG
A m
eth
od
Sec
EGA[103] 292.79 ---- 9.39 ---- 802.06 ---- 85
GSHDC-penalty factor ( Objective-1 Total fuel Cost minimum)
292.94 0.028 9.54 0.84 802.370 0.038 8
GSHDC-penalty factor Objective-2 (Total loss minimum)
292.78 ----- 9.38 ------ 802.510 12

229
Next, the performance of GSHDC-penalty factor is compared with the
other methods and is tabulated in Table-5.46. For a given system
load and total generation, the results of GSHDC -penalty factor
method is found better as compared to other existing methods.
However, Test-1 (sub optimal solution by IP method) and Test-2 (sub
optimal solution by PSO method) are much superior. Hence, Test-3
case (sub optimal solution by modified penalty factor method) is not
considered and not studied for other case studies like 14, and 57 bus
systems.
Table-5.46 Test-3 Objective-1 & Objective-2 Case 2
Generation Schedule of GSHDC-penalty factor Compared with
Evolutionary methods
5.6 COMPARISON OF GSHDC-IP & GSHDC-PSO OPF RSULTS
WITH OTHER METHODS.
The simulation results of GSHDC-IP (with suboptimal solution
obtained through IP) method and GSHDC-PSO (with suboptimal
solution obtained through PSO) method have been presented in
earlier sections for two objectives (minimum fuel cost and minimum
power loss) and multi-objective for different case studies 14,30, and
OPF Method Total Active Power Generation in MW
Transmission Losses in MW
Total cost in $/h
CPU Time in Sec
GSHDC-penalty factor
292.8722 9.47 802.3709 8
EGA[103] 292.79 9.39 802.06 85
GAOPF[26] L.Lai
293.0372 9.6372 802.4484 315
EPOPF[25] Yuryevich
292.7682 9.3683 802.62 51.4
230
57 bus systems. It can be observed, if single objective is the criteria,
GSHDC-PSO gives the best results. However, simulation results
indicate the multi-objective results are not far deviating from the best
results obtained from the single objective case studies.
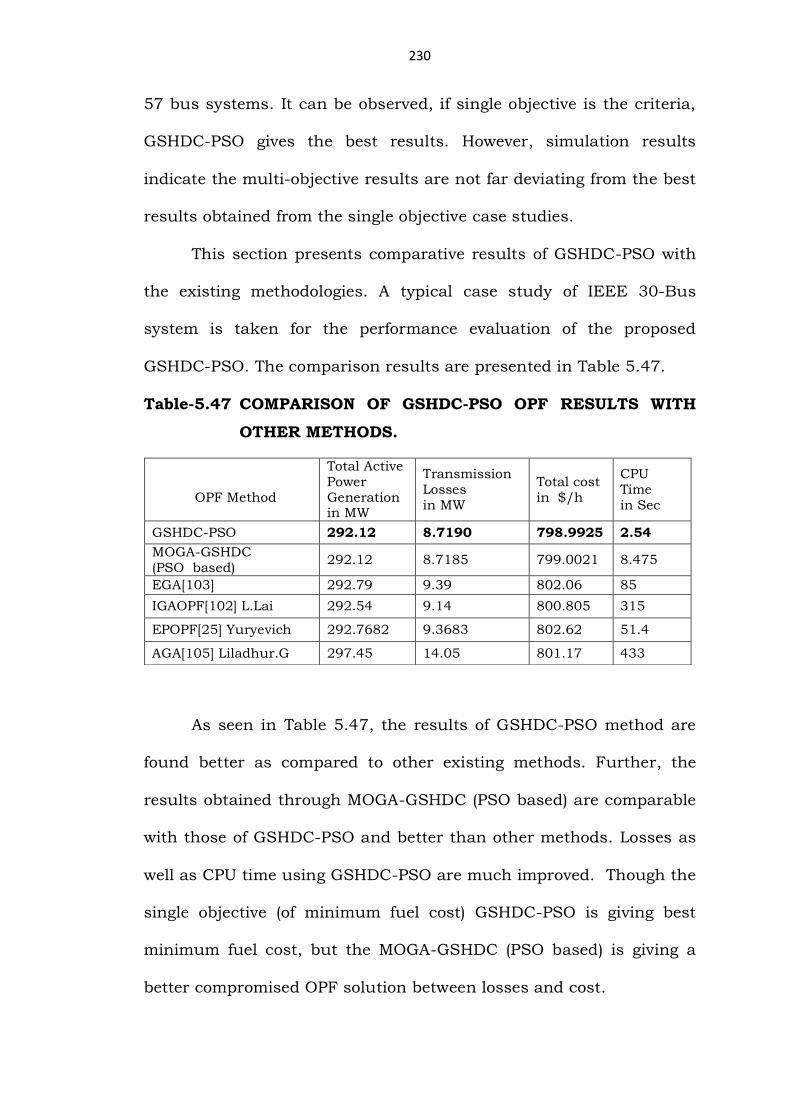
This section presents comparative results of GSHDC-PSO with
the existing methodologies. A typical case study of IEEE 30-Bus
system is taken for the performance evaluation of the proposed
GSHDC-PSO. The comparison results are presented in Table 5.47.
Table-5.47 COMPARISON OF GSHDC-PSO OPF RESULTS WITH
OTHER METHODS.
As seen in Table 5.47, the results of GSHDC-PSO method are
found better as compared to other existing methods. Further, the
results obtained through MOGA-GSHDC (PSO based) are comparable
with those of GSHDC-PSO and better than other methods. Losses as
well as CPU time using GSHDC-PSO are much improved. Though the
single objective (of minimum fuel cost) GSHDC-PSO is giving best
minimum fuel cost, but the MOGA-GSHDC (PSO based) is giving a
better compromised OPF solution between losses and cost.
OPF Method
Total Active Power Generation in MW
Transmission Losses in MW
Total cost in $/h
CPU Time in Sec
GSHDC-PSO 292.12 8.7190 798.9925 2.54
MOGA-GSHDC (PSO based)
292.12 8.7185 799.0021 8.475
EGA[103] 292.79 9.39 802.06 85
IGAOPF[102] L.Lai 292.54 9.14 800.805 315
EPOPF[25] Yuryevich 292.7682 9.3683 802.62 51.4
AGA[105] Liladhur.G 297.45 14.05 801.17 433

231
5.7 CONCLUSIONS
A novel method for the solution of Optimal Power Flow is
proposed in this chapter. The limitations of analytical and intelligent
methods have been overcome by the proposed methods namely,
GSHDC-IP Method, GSHDC-PSO Method, MOGA-GSHDC (IP based)
and MOGA-GSHDC (PSO based).
In this chapter, testing of GSHDC-IP Algorithm, for OPF problem
using suboptimal solution obtained by Interior Point Method is carried
out to obtain solution individually for minimum fuel cost and
minimum power loss. In addition testing of MOGA-GSHDC (IP based)
Algorithm has been carried out to obtain multi objective solution
simultaneously for minimum fuel cost and minimum power loss. The
testing of these Algorithms has been done for the well-known standard
IEEE test cases such as 14-bus system, 30-bus system and 57-bus
system.
Similarly, testing of GSHDC-PSO Algorithm for OPF problem
using suboptimal solution obtained by PSO Method is carried out to
obtain solution individually for minimum fuel cost and minimum
power loss. In addition testing of MOGA-GSHDC (IP based) Algorithm
has been carried out to obtain multi objective solution simultaneously
for minimum fuel cost and minimum power loss.
When compared to GSHDC-IP, the results of GSHDC-PSO are
better in all the three cases. Though, GSHDC-PSO is giving best
results, for the single objective of minimum fuel cost and the single
objective of minimum losses, individually, the MOGA-GSHDC (PSO

232
based) is giving a better compromised OPF solution including both
fuel cost and losses.
Further, results of GSHDC-PSO are compared with the existing
methodologies. A typical case study of IEEE 30-Bus system is taken
for the performance evaluation of the proposed GSHDC-PSO. The
results of GSHDC-PSO method are found better as compared to other
existing methods. Further, the results obtained through MOGA-
GSHDC (PSO based) are comparable with those of GSHDC-PSO and
better than other methods. Losses as well as CPU time using GSHDC-
PSO are much improved. Though the single objective (of minimum
fuel cost) GSHDC-PSO is giving best minimum fuel cost, but the
MOGA-GSHDC (PSO based) is giving a better compromised OPF
solution between losses and cost.