Embed Size (px)
Citation preview

5-1 DRAFT – December 2017
Chapter 5 Rim Watershed Hydrology The physical hydrology components of CalSim 3.0 are based on two assumptions for classifying watersheds. The first assumption is that the foothill and mountainous “rim” watersheds that surround the Central Valley are relatively undeveloped, and changes in land use over time have not significantly affected the natural outflow from these watersheds. Rim watersheds typically are characterized by complex topography, steep slopes, shallow soils, and limited aquifer systems. Runoff at higher elevations is largely determined by the snowfall and snowmelt cycle. Precipitation percolating to groundwater quickly returns to streams as baseflow. Groundwater in these upland watersheds is not extensively used as a source of supply.
The second assumption is that the “valley floor” watersheds1 have been extensively developed for agriculture and contain significant urban areas. For these watersheds, the timing and volume of runoff is strongly influenced by human impacts on the environment. Deep percolation from precipitation and irrigation recharges the underlying aquifer, which is hydraulically linked to the stream system. Groundwater is an important source of water both for agricultural and urban uses. Significant changes in groundwater storage occur.
CalSim 3.0 represents the hydrology of the rim watersheds as preprocessed time series of boundary inflows to the model domain derived from observed streamflow records. In contrast, the hydrology of the valley watersheds is simulated using a rainfall-runoff model, soil moisture accounting in the root zone, and a distributed finite element model of the underlying groundwater aquifer. This chapter describes the representation of rim watersheds developed for CalSim 3.0 and presents summary information for the inflow time series for the period of simulation (October 1921 through September 2015). The hydrology of the valley watersheds is described in Chapter 6.
Approach CalSim 3.0 assumes that the historical flow record can be used to characterize existing 2015 conditions, in terms of the magnitude and frequency of wet and dry years and the monthly distribution of runoff. Upper watershed inflows used in CalSim 3.0 represent the flows that would occur under a repeat of historical weather conditions. CalSim 3.0 inflows are based on streamflow records adjusted for any upstream storage regulation and associated evaporation, imports, and exports.
The National Oceanic and Atmospheric Administration (NOAA) has developed historical time series data of annual mean air temperature for each state in the U.S. beginning in 1895 (NOAA, 1 The valley watersheds cover the same domain as the Water Budget Areas (WBA), but are delineated according to drainage
lines, rather than water supply and water use.

CalSim 3.0 Hydrology Development Project
5-2 DRAFT – December 2017
2017). Data for the Sacramento Valley for the CalSim period of simulation are presented in Figure 5-1. The data show that air temperature in the valley has increased over the simulation period. This increase in air temperature may have caused significant changes in the timing, amount, and form of precipitation (rain or snow), changes in timing and volume of runoff, and changes in the amount of water needed for irrigation. However, the impact of the non-stationary historical hydro-climate records on the water resources of the Central Valley has yet to be determined. A sensitivity study to determine the significance of increasing historical air temperature on water system operations in the Central Valley is being conducted by the Bay-Delta Office (BDO) of DWR. The study will make recommendations on whether a de-trending of historical air temperature is necessary and on how to remove the impact of the non-stationarity temperature increases on unimpaired flow estimates. Until the completion of this sensitivity study, historically-based streamflows are used in CalSim 3.0 without adjustment for climate change.
Figure 5-1. Historical Temperature Trend for the Sacramento Valley
50.0
51.0
52.0
53.0
54.0
55.0
56.0
57.0
58.0
Air T
empe
ratu
re (o
C)
Air temperature12 per. Mov. Avg. (Air temperature)

Chapter 5: Rim Watershed Hydrology
5-3 DRAFT – December 2017
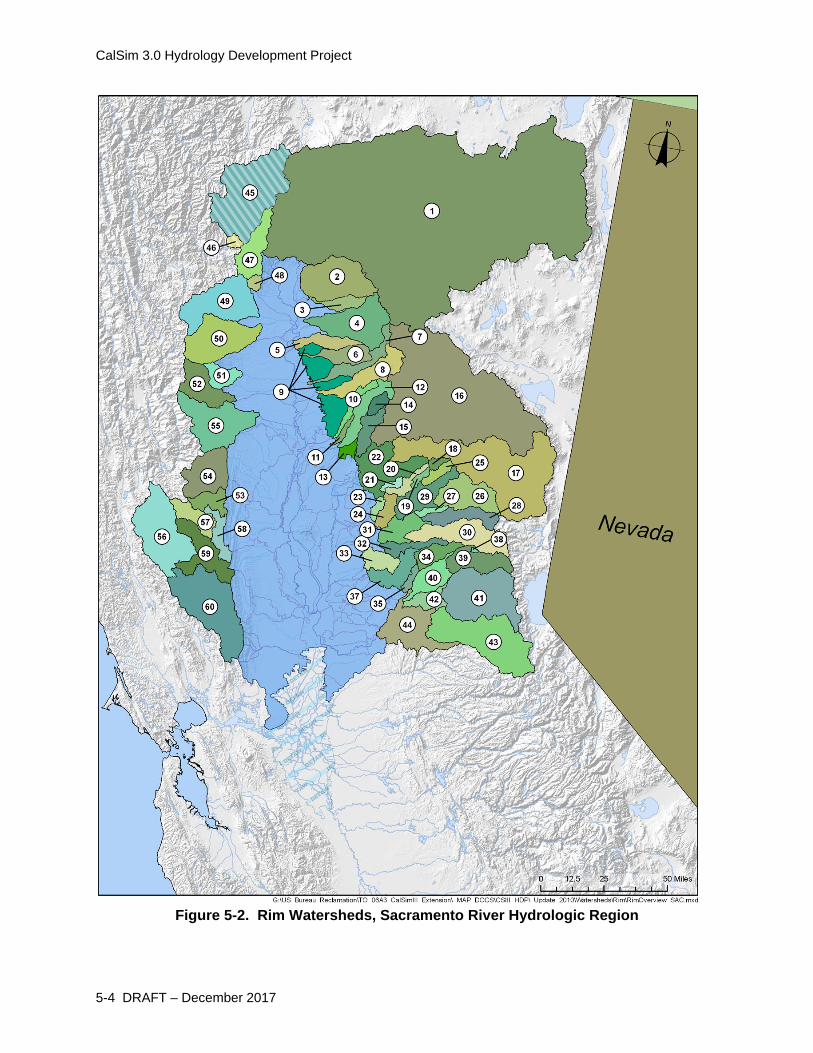
Delineation of Watersheds The delineation of rim watersheds from valley floor watersheds is based on the location of stream gauges or water control facilities in the foothills where historical flows are known or can be estimated. For example, the gauge Mill Creek near Los Molinos (USGS 11381500) divides the Mill Creek watershed into “rim” and “valley floor” portions. Similarly, Englebright Reservoir and the stream gauge Yuba River below Englebright Dam (USGS 11418000) separates the upper Yuba River watershed, a rim watershed, from the lower Yuba River which is a valley floor watershed. Some rim watersheds were subsequently subdivided based on the CalSim 3.0 node-arc network and the water control facilities to be simulated in the model. For example, no stream diversions or control facilities are simulated upstream from the Los Molinos gauge on Mill Creek. Therefore, the Mill Creek rim watershed required no subdivision. In contrast, CalSim 3.0 dynamically simulates New Bullards Bar Reservoir located on the North Fork Yuba River. Therefore, the upper Yuba River watershed was subdivided so as to represent unimpaired inflows to the reservoir.
Watershed boundaries were developed using CalWater 2.2.1 and the USGS 12-digit Hydrologic Unit Code (HUC) watersheds. Additionally, some watersheds were digitized manually using USGS 1:24,000 topographic maps. Stream centerlines were either digitized using 2006 Digital Globe imagery supplemented with imagery from the 2005 National Agricultural Imagery Program or taken directly from the National Hydrologic Dataset. Figure 5-2 displays the 60 rim watersheds within the Sacramento River Hydrologic Region and upper Trinity River watershed.
Some rim watersheds contain major storage and regulation facilities that are not currently simulated in CalSim 3.0. In these cases, rim inflows input to CalSim 3.0 are impaired flows rather than unimpaired flows. Impaired inflows are calculated in two steps. First, historical flows are unimpaired by removing the effects of historical storage regulation and historical diversions. Subsequently, these unimpaired flows are re-impaired for existing (or projected level) storage operations and diversions derived from separate operations models. Impaired rim inflows are developed for a specific level of development or time horizon. Rim inflows that are impaired rather than unimpaired include the following watersheds:
• North Fork Feather River (I_NFF027)
• Middle Fork Feather River (I_MFF019)
• Middle Fork Yuba River (I_MFY013)
• South Fork Yuba River (I_SFY007)
• Deer Creek (I_DER001)
• Middle Fork American River (I_MFA023)
• South Fork American River (I_SFA030)
CalSim 3.0 sub-models are currently under development for the upper Feather River watershed, upper Yuba River watershed, and the upper American River watershed that dynamically simulate the major water control facilities of these watersheds.
CalSim 3.0 Hydrology Development Project
5-4 DRAFT – December 2017
Figure 5-2. Rim Watersheds, Sacramento River Hydrologic Region

Chapter 5: Rim Watershed Hydrology
5-5 DRAFT – December 2017
Data Development Data Sources Hydrology development for DWR’s planning models has a long history. Considerable amounts of data have been assembled over decades, and standard approaches developed for estimating historical flows within the Sacramento Valley. Hydrology development for CalSim 3.0 is based on this large body of previous work. In addition to public data sources provided by U.S. Geological Survey (USGS), DWR, U.S. Army Corps of Engineers (USACE), and Reclamation, the CalSim 3.0 hydrology development uses data stored in text files as part of DWR’s “COMP” model. The COMP model was originally developed by DWR in the 1960s to perform arithmetic calculations on time series data.
Land Use Change Traditionally, DWR has accounted for land use change using a depletion analysis. The depletion analysis calculates the change in consumptive use of water resulting from changes in land cover within a watershed. The depletion analysis accounts for both depletion of precipitation and the depletion of irrigation water, whether from surface water or groundwater sources.2 Changes in depletion are assumed to result in a one-to-one change in the watershed outflow. This is a reasonable assumption for watersheds characterized by shallow groundwater and good connectivity between surface water and groundwater.
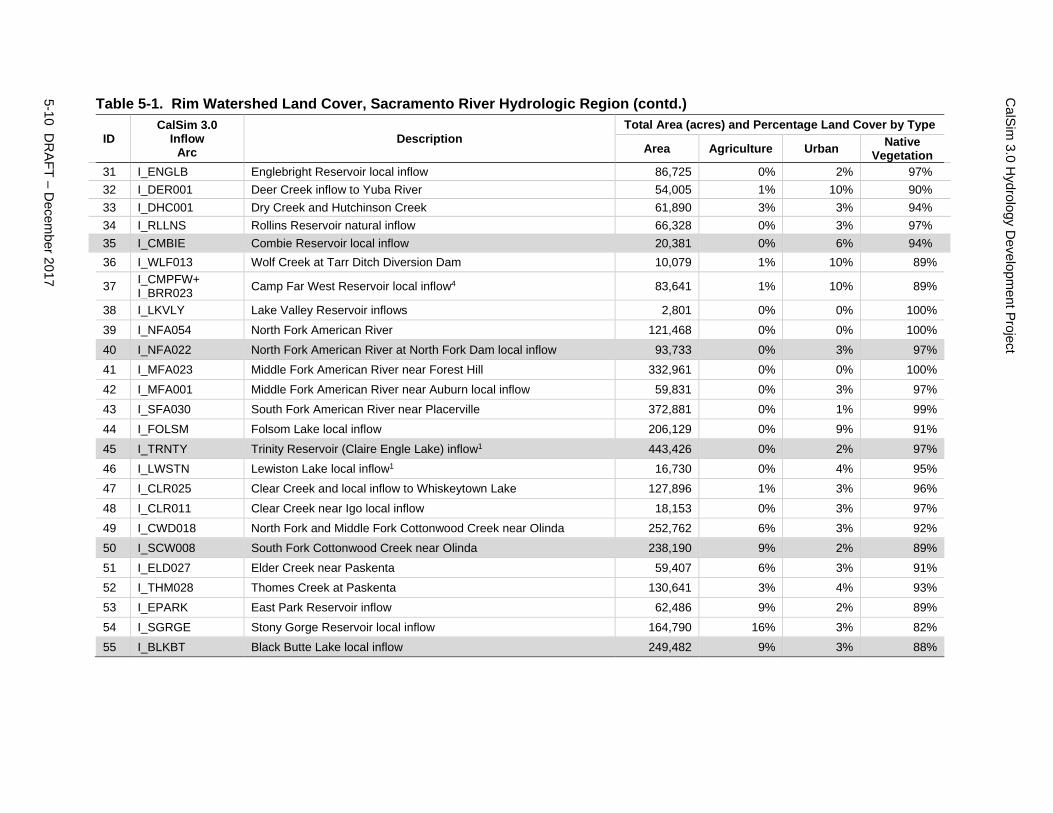
An initial assessment of land development in each of the CalSim 3.0 rim watersheds was made using land cover data from the National Resources Conservation Service (NRCS). This data consists of a 56-meter square grid of land cover for the entire State of California (State), obtained from remote sensing. The results of the land development assessment are presented in Table 5-1 and Table 5-2. Sacramento Valley watersheds with development exceeding 3 percent of the total area include watersheds for Cow, Antelope, Cottonwood, Elder, Thomes, Stony, Clear, Cache, Bear, and Putah Creeks. Most of this development is agricultural, however, there is significant urban development in the Englebright Dam watershed, and adjacent to Lake Folsom and Clear Lake.
Currently, CalSim 3.0 rim inflows have not been adjusted for the effects of land use change. However, it is anticipated that future revisions to the model will use a depletion analysis to further refine CalSim 3.0’s rim inflows.
Synthetic Data
All available historical gauge data were unimpaired for upstream water management (storage regulation, reservoir evaporation, imports, exports, stream diversions and return flows).
2 DWR’s depletion analysis consists of a two-step procedure undertaken sequentially: (1) application of the Consumptive Use
model to determine land-use-based water use at a historical and existing (or future) level of development; (2) application of the Depletion Analysis model to determine the effects of existing (or future) land use and associated water use on historical flows. The depletion is defined as the sum of: (1) consumptive use of precipitation; (2) change in soil moisture storage; (3) consumptive use of applied water; and (4) non-recoverable losses. A detailed description of the depletion analysis is contained in an untitled report by Water Resources Management, Inc. (WRMI), dated 1991.

CalSim 3.0 Hydrology Development Project
5-6 DRAFT – December 2017
Subsequently, unimpaired outflows from each rim watershed were determined as follows, as follows:
• Complete record – Stream gauge data or reservoir release records exist at the watershed outflow point for water years 1922 through 2015.
• Streamflow correlation – Streamflow data exist at the watershed outflow point for only a limited period between water years 1922 and 2015. These data were extended through linear correlation with streamflow records from adjacent watersheds, assuming statistical relationships between (unimpaired) streamflows in adjacent watersheds are constant. Double mass plots of monthly flows were used to check that a constant (and linear) relationship exists between the dependent and independent variables.
• Proportionality – No gauge data exist for the watershed. It is assumed that runoff is proportional to the product of drainage area and average annual precipitation depth over the watershed.3 Outflow was determined through association of the watershed with a similar but gauged watershed and the use of multiplicative factors representing the ratio of watershed areas and the ratio of precipitation depths. Similar to streamflow correlation, it is assumed that no significant land use change has occurred during the historical period.
In the second of the above methods, gauge data were extended through linear correlation of annual flow volumes. Generally, annual volumes are less influenced by watershed characteristics affecting the timing of snowmelt, and retention of precipitation in the upper soil layers or in shallow aquifers. Synthetic or derived annual time series data were disaggregated using one of two methods, as described below. The similarity of the flow hydrographs and coefficient of determination (r2) of the observed and derived monthly flows for the common period of record was used to select the appropriate disaggregation method for a particular watershed.
Direct Method (Linear Method) The direct method uses the monthly flow distribution of the independent variable to disaggregate the estimated annual flow volume of the dependent variable for any given year. This method assumes that the flow hydrographs of the two watersheds have similar characteristics and that the monthly flow in the dependent watershed is a direct scaling of the flow in the independent watershed.
S-Curve Method (Percent Deviation Method) The S-curve method assumes that the flow hydrographs of the two watersheds have different characteristics; the method attempts to preserve the shape of the hydrograph of the dependent watershed. Annual flows are distributed to a monthly time step using the following equation:
𝐹𝐹𝐹𝐹𝑚𝑚,𝑦𝑦𝑦𝑦 = 𝐹𝐹𝐹𝐹����𝑚𝑚 + 𝐹𝐹𝑦𝑦����𝑚𝑚−𝐹𝐹𝑦𝑦����𝑚𝑚−1𝐹𝐹𝐹𝐹����𝑚𝑚−𝐹𝐹𝐹𝐹����𝑚𝑚−1
∗ �𝐹𝐹𝐹𝐹𝑚𝑚,𝑦𝑦𝑦𝑦 − 𝐹𝐹𝐹𝐹����𝑚𝑚� Eqn. 5-1
where for the dependent watershed (y): 3 Determined using distributed PRISM data of the 30-year average annual precipitation for 1971 – 2000. This is described in
Chapter 7.

Chapter 5: Rim Watershed Hydrology
5-7 DRAFT – December 2017
𝐹𝐹𝐹𝐹𝑚𝑚,𝑦𝑦𝑦𝑦 = cumulative fraction of annual runoff that has occurred by the end of month m in year yr (unknown)
𝐹𝐹𝐹𝐹����m = average cumulative fraction of annual runoff that has occurred by the end of month m for the common period of record
where for the independent watershed (x):
𝐹𝐹𝐹𝐹����m = average cumulative fraction of annual runoff that has occurred by the end of month m for the common period of record
𝐹𝐹𝐹𝐹𝑚𝑚,𝑦𝑦𝑦𝑦 = cumulative fraction of annual runoff that has occurred by the end of month m in year yr
The steps in the linear correlation are as follows:
1. A linear regression equation is developed based on the correlation between total annual flows in watersheds x (independent) and y (dependent) over the common period of record.
2. The regression equation is subsequently used to generate annual flows in watershed y for the period when gauge data are not available.
3. Based on historical data for the common period of record, an average monthly cumulative fraction,𝐹𝐹𝐹𝐹����𝑚𝑚, and the monthly slope, 𝐹𝐹𝐹𝐹����𝑚𝑚 − 𝐹𝐹𝐹𝐹����𝑚𝑚−1, are calculated for watershed y.
4. Similarly, an average monthly cumulative fraction, 𝐹𝐹𝐹𝐹����𝑚𝑚, and the slope,𝐹𝐹𝐹𝐹����𝑚𝑚 −𝐹𝐹𝐹𝐹����𝑚𝑚−1, is calculated for watershed x for the same period of record.
5. For each year when data are not available for watershed y, the monthly cumulative fraction, Fxm,yr, and the monthly deviation, 𝐹𝐹𝐹𝐹𝑚𝑚,𝑦𝑦𝑦𝑦 − 𝐹𝐹𝐹𝐹����𝑚𝑚, is calculated for watershed x.
6. A monthly slope ratio is generated between the slopes of the average monthly cumulative curve of watershed y and watershed x at the end of month m
7. A factor is generated for each month based on the product of the above monthly deviation of watershed x and the above monthly slope ratio between watershed y and watershed x.
8. The above factor is used to adjust the cumulative fraction, 𝐹𝐹𝐹𝐹����𝑚𝑚, to obtain a modified monthly cumulative fraction, Fym,yr, for watershed Y in year y.
9. Based on the new cumulative fraction, Fym,yr, and annual average flows obtained by correlating with watershed x, monthly flows are generated for watershed y for each year when gauge data are not available.

CalSim 3.0 Hydrology Development Project
5-8 DRAFT – December 2017
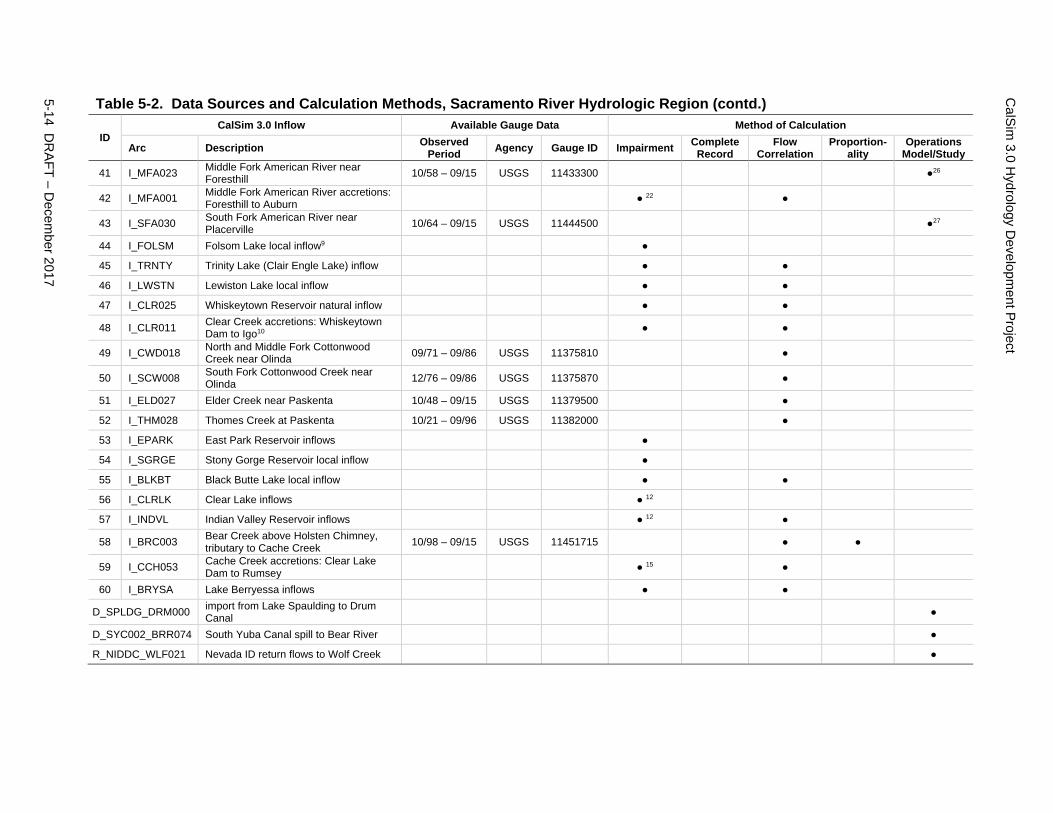
Inflow Summary Table 5-2 summarizes the methods used to calculate the flows from each of these watersheds to its downstream watershed. Gauge records are incomplete for the majority of rim watersheds; gauge data exist for the entire historical period only for Trinity River at Lewiston, Deer Creek near Vina, and Butte Creek near Chico. Table 5-3 summarizes gauge data used to extend the observed data by linear correlation.
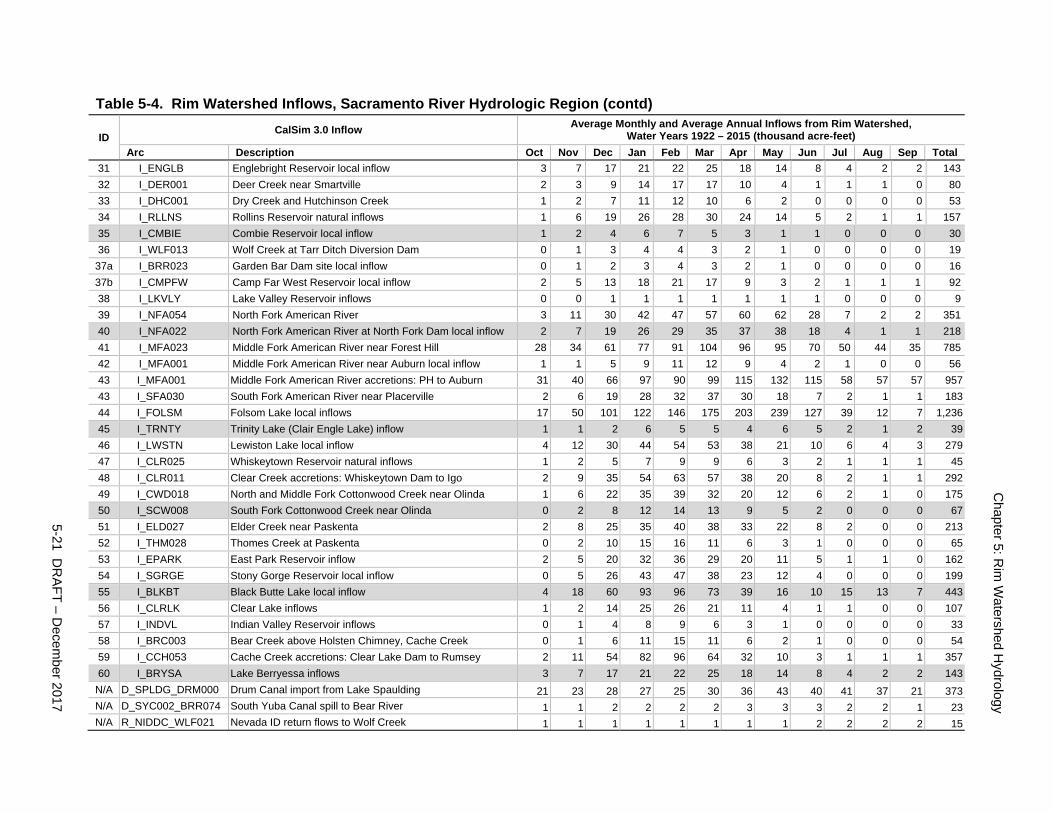
Table 5-4 presents the average monthly and average annual flows for each rim watershed. These flow characteristics are compared to watershed area, elevation band, and precipitation depth in Table 5-5. Figure 5-3 compares annual flows among the major watersheds. The box-whisker plot shows the average annual flow, the maximum and minimum annual flow for the period of simulation, and the 20 and 80 percentiles. Inflows to the Sacramento Valley are predominantly from four watersheds: the Sacramento, Pit, and McCloud river watersheds upstream from Shasta Dam; Feather River watershed upstream from Oroville Dam; Yuba River watershed upstream from Englebright Dam (but including Deer Creek); and American River watershed upstream from Folsom Dam. Together, these watersheds account for approximately 70 percent of the total inflow to the Sacramento Valley.
Appendix C briefly describes each watershed, provides details of the flow calculations and presents figures of both annual flows and average monthly flows for October 1921 through September 2015 for the existing level of development.

5-9 DR
AFT – Decem
ber 2017
Chapter 5: R
im W
atershed Hydrology
Table 5-1. Rim Watershed Land Cover, Sacramento River Hydrologic Region
ID CalSim 3.0
Inflow Arc
Description Total Area (acres) and Percentage Land Cover by Type
Area Agriculture Urban Native Vegetation
1 I_SHSTA Shasta Lake inflows 4,216,593 3% 1% 96% 2 I_COW014 Cow Creek 245,781 9% 2% 89% 3 I_BCN010 Bear Creek (North) near Millville 47,051 7% 2% 92% 4 I_BTL006 Battle Creek near Cottonwood 230,635 1% 1% 98% 5 I_PYN001 Paynes Creek and Sevenmile Creek 65,229 9% 2% 89% 6 I_ANT011 Antelope Creek near Red Bluff 79,216 7% 1% 93% 7 I_MLC006 Mill Creek near Los Molinos 84,448 1% 0% 99% 8 I_DRC012 Deer Creek near Vina 133,758 0% 1% 99% 9 I_MNS000 Minor northeast streams 187,050 9% 0% 90% 10 I_BCC014 Big Chico Creek near Chico 46,176 0% 1% 99% 11 I_LCC038 Little Chico Creek 16,333 1% 3% 96% 12 I_BTC060 Butte Creek 94,475 0% 3% 97% 13 I_LDC029 Little Dry Creek 21,486 2% 17% 81%
14 I_RVPHB+ I_WBF030 West Branch Feather River at Hendricks Diversion Dam2 29,210 0% 0% 100%
15 I_WBF006 + I_WBF015 West Branch Feather River near Yankee Hill local inflow3 63,977 0% 1% 98%
16 I_NFF027 North Fork Feather River at Pulga 1,248,456 0% 1% 99% 17 I_MFF019 Middle Fork Feather River near Merrimac 679,213 2% 1% 97% 18 I_LGRSV Little Grass Valley Reservoir inflows 16,429 0% 0% 100% 19 I_LST007 Sly Creek Reservoir natural inflow 15,392 0% 0% 100% 20 I_SFF011 South Fork Feather River at Ponderosa Dam local inflow 37,054 0% 0% 100% 21 I_SFF008 South Fork Feather at Enterprise local inflow 15,694 0% 1% 99% 22 I_OROVL Lake Oroville local inflow 199,602 1% 1% 97% 23 I_HON021 South Fork Honcut Creek 19,554 1% 2% 97% 24 I_MERLC Merle Collins Reservoir inflow 45,825 1% 3% 97% 25 I_SLT009 Slate Creek at Slate Creek Diversion Dam 31,496 0% 0% 100% 26 I_NFY029 North Fork Yuba River below Goodyears Bar 160,117 0% 1% 99% 27 I_OGN005 Oregon Creek above Log Cabin Diversion Dam 18,615 0% 1% 99% 28 I_MFY013 Middle Fork Yuba River above Our House Diversion Dam 92,717 0% 0% 100% 29 I_NBLDB New Bullards Bar Reservoir local inflow 121,069 0% 1% 99% 30 I_SFY007 South Fork Yuba River at Jones Bar 199,050 0% 1% 99%
CalSim
3.0 Hydrology D
evelopment Project
5-10 DR
AFT – Decem
ber 2017
Table 5-1. Rim Watershed Land Cover, Sacramento River Hydrologic Region (contd.)
ID CalSim 3.0
Inflow Arc
Description Total Area (acres) and Percentage Land Cover by Type
Area Agriculture Urban Native Vegetation
31 I_ENGLB Englebright Reservoir local inflow 86,725 0% 2% 97% 32 I_DER001 Deer Creek inflow to Yuba River 54,005 1% 10% 90% 33 I_DHC001 Dry Creek and Hutchinson Creek 61,890 3% 3% 94% 34 I_RLLNS Rollins Reservoir natural inflow 66,328 0% 3% 97% 35 I_CMBIE Combie Reservoir local inflow 20,381 0% 6% 94% 36 I_WLF013 Wolf Creek at Tarr Ditch Diversion Dam 10,079 1% 10% 89%
37 I_CMPFW+ I_BRR023 Camp Far West Reservoir local inflow4 83,641 1% 10% 89%
38 I_LKVLY Lake Valley Reservoir inflows 2,801 0% 0% 100% 39 I_NFA054 North Fork American River 121,468 0% 0% 100% 40 I_NFA022 North Fork American River at North Fork Dam local inflow 93,733 0% 3% 97% 41 I_MFA023 Middle Fork American River near Forest Hill 332,961 0% 0% 100% 42 I_MFA001 Middle Fork American River near Auburn local inflow 59,831 0% 3% 97% 43 I_SFA030 South Fork American River near Placerville 372,881 0% 1% 99% 44 I_FOLSM Folsom Lake local inflow 206,129 0% 9% 91% 45 I_TRNTY Trinity Reservoir (Claire Engle Lake) inflow1 443,426 0% 2% 97% 46 I_LWSTN Lewiston Lake local inflow1 16,730 0% 4% 95% 47 I_CLR025 Clear Creek and local inflow to Whiskeytown Lake 127,896 1% 3% 96% 48 I_CLR011 Clear Creek near Igo local inflow 18,153 0% 3% 97% 49 I_CWD018 North Fork and Middle Fork Cottonwood Creek near Olinda 252,762 6% 3% 92% 50 I_SCW008 South Fork Cottonwood Creek near Olinda 238,190 9% 2% 89% 51 I_ELD027 Elder Creek near Paskenta 59,407 6% 3% 91% 52 I_THM028 Thomes Creek at Paskenta 130,641 3% 4% 93% 53 I_EPARK East Park Reservoir inflow 62,486 9% 2% 89% 54 I_SGRGE Stony Gorge Reservoir local inflow 164,790 16% 3% 82% 55 I_BLKBT Black Butte Lake local inflow 249,482 9% 3% 88%

5-11 DR
AFT – Decem
ber 2017
Chapter 5: R
im W
atershed Hydrology
Table 5-1. Rim Watershed Land Cover, Sacramento River Hydrologic Region (contd.)
ID CalSim 3.0
Inflow Arc
Description Total Area (acres) and Percentage Land Cover by Type
Area Agriculture Urban Native Vegetation
56 I_CLRLK Clear Lake inflow 313,250 4% 9% 87% 57 I_INDVL Indian Valley Reservoir inflow 77,396 1% 2% 97% 58 I_BRC003 Bear Creek above Holsten Chimney tributary to Cache Creek 60,771 14% 2% 84% 59 I_CCH053 Cache Creek above Rumsey local inflow 158,736 6% 3% 91% 60 I_BRYSA Lake Berryessa inflow 363,171 8% 3% 89% Notes: 1 The Trinity and Lewiston Lake watersheds are located in the North Coast Hydrologic Region, but are included here because water is exported from the Trinity River to the
Sacramento Valley as part of the Central Valley Project. 2 The initial rim watershed for the West Branch Feather River upstream from Hendricks Diversion Dam was subsequently disaggregated into two watersheds representing: (a)
inflows to Round Valley Reservoir and Philbrook Reservoir (I_RVPHB); and (b) accretions to the West Branch Feather River between these two reservoirs and Hendricks Diversion Dam.
3 The initial rim watershed for the West Branch Feather River downstream from the Hendricks Diversion Dam was subsequently disaggregated into two watersheds representing: (a) accretions to the West Branch Feather River between Hendricks Diversion Dam and Miocene Diversion Dam; and (b) accretions to the West Branch Feather River between Miocene Diversion Dam and the location of the former USGS gauge at Enterprise.
4 The initial rim watershed for the Bear River between Combie Dam and Camp Far West Dam was subsequently disaggregated into two watersheds representing: (a).accretions to the Bear River between Combie Reservoir and the proposed Golden Bar dam site (excluding the Wolf Creek watershed); (b) accretions to the Bear River between the proposed Golden Bar dam site and Camp Far West Dam.

CalSim
3.0 Hydrology D
evelopment Project
5-12 DR
AFT – Decem
ber 2017
Table 5-2. Data Sources and Calculation Methods, Sacramento River Hydrologic Region
ID CalSim 3.0 Inflow Available Gauge Data Method of Calculation
Arc Description Observed Period Agency Gauge ID Impairment Complete
Record Flow
Correlation Proportion-
ality Operations
Model/Study 1 I_SHSTA Shasta Lake inflows ● ●
2 I_COW014 Cow Creek at WBA boundary 10/49 – 09/15 USGS 11374000 ● ●3
3 I_BCN010 Bear Creek (North) near Millville 10/59 – 09/67 USGS 11374100 ●
4 I_BTL006 Battle Creek near Cottonwood1 10/40 – 09/61 USGS 11376500
● Battle Creek below Coleman Fish Hatchery near Cottonwood 10/61 – 09/15 USGS 11376550
5 I_PYN001 Paynes Creek near Red Bluff and Sevenmile Creek 10/49 – 09/66 USGS 11377500 ● ●4
6 I_ANT011 Antelope Creek near Red Bluff 10/40 – 09/822 USGS 11379000 ●
7 I_MLC006 Mill Creek near Los Molinos 10/28 – 09/158 USGS 11381500 ●
8 I_DRC012 Deer Creek near Vina 10/21 – 09/15 USGS 11383500 ●
9 I_MNS000 Minor northeast streams5 ●
10 I_BCC014 Big Chico Creek near Chico 10/21 – 09/86 USGS 11384000 ● ●
11 I_LCC038 Little Chico Creek near Chico 02/59 – 09/1516 DWR A04910
● 7 ● 02/59 – 09/93 DWR A04280
12 I_BTC060 Butte Creek near Chico6 10/30 – 09/1511 USGS 11390000 ●
13 I_LDC029 Little Dry Creek ●
14a I_RVPHB Round Valley and Philbrook Reservoir inflows ● ● ●
14b I_WBF030 West Branch Feather River at Hendricks Diversion Dam accretions ● ● ●
15a I_WBF015 West Branch Feather River accretions: Hendricks Diversion Dam to Miocene Diversion Dam21
● ● ●
15b I_WBF006 West Branch Feather River accretions: Miocene Diversion Dam to Yankee Hill21 ● ● ●
16 I_NFF027 North Fork Feather River at Pulga 10/21 – 09/1516 USGS 11404500
● 14 ● ●22 03/58 – 09/15 USGS 11404900
17 I_MFF019 Middle Fork Feather River near Merrimac 10/51 – 09/86 USGS 11394500 ● ●23
18 I_LGRSV Little Grass Valley Reservoir inflows ● ●
19 I_LST007 Sly Creek Reservoir Natural inflows ● ●
20 I_SFF011 South Fork Feather River accretions, Little Grass Valley Dam and Sly Park Dam to Ponderosa Dam12
● ●

5-13 DR
AFT – Decem
ber 2017
Chapter 5: R
im W
atershed Hydrology
Table 5-2. Data Sources and Calculation Methods, Sacramento River Hydrologic Region (contd.)
ID CalSim 3.0 Inflow Available Gauge Data Method of Calculation
Arc Description Observed Period Agency Gauge ID Impairment Complete
Record Flow
Correlation Proportion-
ality Operations
Model/Study 21 I_SFF008 South Fork Feather River accretions,
Ponderosa Dam to Enterprise12 ● ●
22 I_OROVL Lake Oroville local inflow ● ●
23 I_HON021 South Fork Honcut Creek 10/50 – 09/86 USGS 11407500 ●
24 I_MERLC Merle Collins Reservoir inflows ● ●
25 I_SLT009 Slate Creek above Slate Creek Diversion Dam
10/60 – 09/15 USGS 11413250 ● 17 ●
10/60 – 09/15 USGS 11413300
26 I_NFY029 North Fork Yuba River below Goodyears Bar 10/30 – 09/1516 USGS 11413000 ● ●
27 I_OGN005 Oregon Creek above Log Cabin Diversion Dam
09/68 – 09/15 USGS 11409350 ● 18 ●
10/68 – 09/1516 USGS 11409400
28 I_MFY013 Middle Fork Yuba River above Our House Diversion Dam
10/68 – 09/15 USGS 11408870 ● 19 ●24
10/68 – 09/15 USGS 11408880
29 I_NBLDB New Bullards Bar Reservoir local inflow ●
30 I_SFY007 South Fork Yuba River at Jones Bar 10/40 – 09/1516 USGS 11417500 ● ●25
31 I_ENGLB Englebright Reservoir local inflow ● 13 ●
32 I_DER001 Deer Creek near Smartville 10/35 – 09/15 USGS 1418500 ●28
33 I_DHC001 Dry Creek and Hutchinson Creek ●
34 I_RLLNS Rollins Reservoir natural inflow ● 13 ● ● 13
35 I_CMBIE Combie Reservoir local inflow ● 13 ● ● 13
36 I_WLF013 Wolf Creek at Tarr Ditch Diversion Dam ● 13 ● ● 13
37a I_BRR023 Garden Bar Dam site local inflow20 ● 13 ● ● 13
37b I_CMPFW Camp Far West Reservoir local inflow20 ● 13 ● ● 13
38 I_LKVLY Lake Valley Reservoir inflow ●
39 I_NFA054 North Fork American River above North Fork confluence ●
40 I_NFA022 North Fork American River accretions: North Fork confluence to North Fork Dam
●
CalSim
3.0 Hydrology D
evelopment Project
5-14 DR
AFT – Decem
ber 2017
Table 5-2. Data Sources and Calculation Methods, Sacramento River Hydrologic Region (contd.)
ID CalSim 3.0 Inflow Available Gauge Data Method of Calculation
Arc Description Observed Period Agency Gauge ID Impairment Complete
Record Flow
Correlation Proportion-
ality Operations
Model/Study 41 I_MFA023 Middle Fork American River near
Foresthill 10/58 – 09/15 USGS 11433300 ●26
42 I_MFA001 Middle Fork American River accretions: Foresthill to Auburn ● 22 ●
43 I_SFA030 South Fork American River near Placerville 10/64 – 09/15 USGS 11444500 ●27
44 I_FOLSM Folsom Lake local inflow9 ●
45 I_TRNTY Trinity Lake (Clair Engle Lake) inflow ● ●
46 I_LWSTN Lewiston Lake local inflow ● ●
47 I_CLR025 Whiskeytown Reservoir natural inflow ● ●
48 I_CLR011 Clear Creek accretions: Whiskeytown Dam to Igo10 ● ●
49 I_CWD018 North and Middle Fork Cottonwood Creek near Olinda 09/71 – 09/86 USGS 11375810 ●
50 I_SCW008 South Fork Cottonwood Creek near Olinda 12/76 – 09/86 USGS 11375870 ●
51 I_ELD027 Elder Creek near Paskenta 10/48 – 09/15 USGS 11379500 ●
52 I_THM028 Thomes Creek at Paskenta 10/21 – 09/96 USGS 11382000 ●
53 I_EPARK East Park Reservoir inflows ●
54 I_SGRGE Stony Gorge Reservoir local inflow ●
55 I_BLKBT Black Butte Lake local inflow ● ●
56 I_CLRLK Clear Lake inflows ● 12
57 I_INDVL Indian Valley Reservoir inflows ● 12 ●
58 I_BRC003 Bear Creek above Holsten Chimney, tributary to Cache Creek 10/98 – 09/15 USGS 11451715 ● ●
59 I_CCH053 Cache Creek accretions: Clear Lake Dam to Rumsey ● 15 ●
60 I_BRYSA Lake Berryessa inflows ● ●
D_SPLDG_DRM000 import from Lake Spaulding to Drum Canal ●
D_SYC002_BRR074 South Yuba Canal spill to Bear River ●
R_NIDDC_WLF021 Nevada ID return flows to Wolf Creek ●

5-15 DR
AFT – Decem
ber 2017
Chapter 5: R
im W
atershed Hydrology
Table 5-2. Data Sources and Calculation Methods, Sacramento River Hydrologic Region (contd.) Notes: 1 Gauged flows for Battle Creek near Cottonwood do not include diversions to fish hatchery estimated to be 60 CFS year-round. 2 The record for Antelope Creek near Red Bluff extended back to October 1921 using data published in Table 21, 1957 Joint Hydrology Report (DWR and Reclamation, 1957). 3 Flow in Cow Creek at river mile 14 is based on gauge data for Cow Creek at Millville, scaled by relative drainage areas. It is assumed that gauged data are unimpaired. 4 No gauge data exist for Sevenmile Creek. Therefore, outflow from Paynes Creek increased by 9.8 percent to account for Sevenmile Creek based on drainage area and precipitation depth. 5 Minor northeast streams include Salt Creek, Little Antelope Creek, Dye Creek, Big Dry Creek, Little Dry Creek, Singer Creek, Pine Creek, Campbell Creek, Rock Creek, and Mud Creek. 6 The gauge record for Butte Creek near Chico is adjusted to remove effects of upstream imports from West Branch of Feather River (USGS 11389800, Toadtown Canal above Butte Canal). 7 Flow for Little Chico Creek near Chico is calculated as the sum of two gauges: flow in Little Chico Creek (DWR A04280) and flow in diversion channel leading to Butte Creek (DWR A04910). 8 The record for Mill Creek near Los Molinos extended back to October 1921 using data published in Table 27, 1957 Joint Hydrology Report (DWR and Reclamation, 1957). 9 Inflow to Folsom Lake excludes releases from PG&E’s South Canal and Placer County Water Agency’s Lower Boardman Canal to Mormon Ravine. 10 Clear Creek stream accretion calculated from mass balance: downstream gauge less upstream dam releases. 11 Record extended back to October 1921 using data published in Table 22, 1957 Joint Hydrology Report (DWR and Reclamation, 1957). 12 Unimpaired flow calculated from mass balance from reservoir release, storage regulation, and evaporation. 13 Accretion calculated from a mass balance between upstream and downstream gauges, accounting for any storage regulation and stream diversions. 14 Historical flow for North Fork Feather River at Pulga is calculated as the sum of flow through the Poe Powerhouse and flow downstream from Poe Dam. 15 Cache Creek accretion calculated from a mass balance between upstream and downstream gauges. 16 The record is incomplete, some missing data. 17 Flow for Slate Creek above Slate Creek Diversion Dam is calculated as the sum of flow downstream from the diversion dam and flow through Slate Creek Tunnel. 18 Flow for Oregon Creek above Log Cabin Diversion Dam is calculated as the sum of flow downstream from the diversion dam, less flow through Lohman Ridge Tunnel, plus flow through Camptonville
Tunnel. 19 Flow for Middle Fork Yuba above Our House Diversion Dam is calculated as the sum of downstream of the diversion dam and flow through Lohman Ridge Tunnel. 20 Accretions to the Bear River from Combie Dam to Cam Far West Dam were subsequently disaggregated to determine inflows at the proposed Garden Bar dam site upstream from Camp Far West
Reservoir. 21 Accretions to the West Branch Feather River from Hendricks Diversion Dam to site of discontinued USGS gauge at Yankee Hill were subsequently disaggregated to determine inflows to Miocene Diversion
Dam, located downstream from Hendricks Diversion Dam. 22 I_NFF027 accounts for storage regulation and evaporation in DWR (Antelope) and PG&E (Mountain Meadows, Almanor, Butt Valley, Bucks) upstream reservoirs. 23 I_MFF019_ accounts for storage regulation and evaporation in DWR upstream reservoirs (Davis and Frenchman) and diversions for municipal and agricultural purposes. 24 I_MFY013 accounts for storage regulation and evaporation in Nevada Irrigation District upstream reservoir (Jackson Meadows) and exports through the Milton-Bowman Tunnel. 25 I_SFY007 accounts for storage regulation and evaporation in Nevada Irrigation District (Bowman) and PG&E (Fordyce, Spaulding) upstream reservoirs, imports through the Milton-Bowman Canal, and
exports through the South Yuba Canal and Drum-Spaulding Canal. 26 I_MFA023 accounts for storage regulation and evaporation in Placer County Water Agency (French Meadows, Hell Hole), SMUD (Loon Lake), and Georgetown Divide PUD (Stumpy Meadows) upstream
reservoirs, the latter’s diversions for municipal and agricultural purposes, and SMUD exports through Robbs Peak Tunnel. 27 I_SFA030 accounts for storage regulation and evaporation in SMUD (Union Valley, Ice House) and El Dorado Irrigation District (Caples, Silver) upstream reservoirs, imports through Robbs Peak Tunnel,
imports from Echo Lake, and exports from the El Dorado Canal/Forebay. 28 I_DER001 accounts for storage regulation and evaporation in Nevada Irrigation District (Scott Flat), district diversions, and PG&E imports from the South Yuba Canal. Key: CFS = cubic feet per second, DWR = California Department of Water Resources, PG&E = Pacific Gas and Electric, USGS = U.S. Geologic Survey, WBA = Water Budget Area

CalSim
3.0 Hydrology D
evelopment Project
5-16 DR
AFT – Decem
ber 2017
Table 5-3. Flow Correlation, Sacramento River Hydrologic Region
ID CalSim 3.0 Arc Name Short-Term Station, Y Long-Term Station X Common Period
of Observation No. of Years
Linear Coefficients Y = aX + b
Correlation Coefficient
(R2)
Period of Data
Extension a b
1 I_SHSTA 2 I_COW014 Cow Creek near Millville (USGS 11374000) Mill Creek near Los Molinos (USGS 11381500)1 1950 – 2015 66 2.8548 -162.81 0.92 1922 – 1949
3 I_BCN010 Bear Creek near Millville (USGS 11374100) Mill Creek near Los Molinos (USGS 11381500)1 1960 – 1967 8 0.2997 -5.02 0.89 1922 – 1966 1968 – 2015
4 I_BTL006 Battle Creek below Coleman Fish Hatchery (USGS 11376550)18 Mill Creek near Los Molinos (USGS 11381500)1 1941 – 2015 75 1.3727 52.73 0.94 1922 – 1940
5 I_PYN001 Paynes Creek near Red Bluff (USGS 11377500)3 Mill Creek near Los Molinos (USGS 11381500)1 1950 – 1966 17 0.3228 -22.12 0.85 1922 – 1949 1967 – 2015
6 I_ANT011 Antelope Creek near Red Bluff (USGS 11379000) Mill Creek near Los Molinos (USGS 11381500)1 1929 – 1982 54 0.6017 -30.23 0.97 1983 – 2015 7 I_MLC006 Mill Creek near Los Molinos (USGS 11381500) Deer Creek near Vina (USGS 11383500) 1929 – 2015 87 0.7450 44.78 0.98 1922 – 1928 8 I_DRC012 9 I_MNS000
10 I_BCC014 Big Chico Creek near Chico (USGS 11384000) Big Chico Creek at Chico (A04250) plus Lindo Channel near Chico (A00615) plus Mud Creek diversion at Chico (A00928)
1976 – 1986 11 0.9585 9.47 0.998 1987 – 2015
11 I_LCC038 Little Chico Creek near Chico (A04280) + Little Chico Creek Diversion near Chico (A04910)
Unimpaired Butte Creek near Chico (USGS 11390000)
1960 – 1968 1973 – 1996 33 0.1152 -6.17 0.95 1922 – 1959
1997 – 2015 12 I_BTC060 Butte Creek near Chico (USGS 11390000) 13 I_LDC029 14a I_WBF030 Unimpaired West Branch Feather River near Yankee Hill
(USGS 11406500)12 Unimpaired Feather River at Oroville 1931 – 1963 33 0.0749 8.06 0.97 1922 – 1930 1964 – 2015 14b I_RVPHB
15a I_WBF006 Unimpaired West Branch Feather River near Yankee Hill (USGS 11406500)12 Unimpaired Feather River at Oroville 1931 – 1963 33 0.0749 8.06 0.97 1922 – 1930
1964 – 2015 15b I_WBF015 16 I_NFF027
17 I_MFF019 impaired Middle Fork Feather River near Merrimac (USGS 11394500) Unimpaired Feather River at Oroville 1952 – 1986 34 0.2442 -130.85 0.98 1922 – 1951
1987 – 2015
18 I_LGRSV Unimpaired South Fork Feather below Little Grass Valley Dam (USGS 11395030) Unimpaired Feather River at Oroville 1964 – 2015 46 0.0171 4.68 0.97 1922 – 1963
19 I_LST007 Unimpaired Lost Creek near Clipper Mills (USGS 11396000) Unimpaired Feather River at Oroville 1974 – 2015 42 0.0169 3.13 0.96 1922 – 1973
20 I_SFF011 Unimpaired South Fork Feather River at Enterprise (USGS 11397000) Unimpaired Feather River at Oroville 1922 – 1987 66 0.0652 -17.11 0.98 1988 – 2015
21 I_SFF008 Unimpaired South Fork Feather River at Enterprise (USGS 11397000) Unimpaired Feather River at Oroville 1922 – 1987 66 0.0652 -17.11 0.98 1988 – 2015
22 I_OROVL 23 I_HON021 South Fork Honcut Creek near Bangor (USGS 11407500) Unimpaired Butte Creek near Chico (USGS
11390000) 1951 – 1986 36 0.1243 -6.25 0.89 1922 – 1950 1987 – 2015
24 I_MERLC Inflow to Merle Collins Reservoir (report of operations) Oregon Creek at Log Cabin Diversion Dam 1968 – 1980 13 1.1011 -10.54 0.80 1922 – 1967 1981 – 2015
25 I_SLT009 Slate Creek below Diversion Dam (USGS 11413300) plus Slate Creek Tunnel (USGS 11413250)
North Fork Yuba River below Goodyears Bar (USGS 11413000) 1961 – 2015 55 0.2681 -4.17 0.97 1922 – 1960
26 I_NFY029 North Fork Yuba River below Goodyears Bar16 Middle Fork Yuba above Oregon Creek (USGS 11409000)15
1931 – 1937 1939 – 1968 37 1.6002 58.16 0.99 1938

5-17 DR
AFT – Decem
ber 2017
Chapter 5: R
im W
atershed Hydrology
Table 5-3. Flow Correlation, Sacramento River Hydrologic Region (contd.)
ID CalSim 3.0 Arc Name Short-Term Station, Y Long-Term Station X Common Period
of Observation No. of Years
Linear Coefficients Y = aX + b
Correlation Coefficient
(R2)
Period of Data
Extension a b
27 I_OGN005
Oregon Creek below Log Cabin Diversion Dam (USGS 11409400) + Camptonville Tunnel (USGS 11409350) - Lohman Ridge Tunnel (USGS 11408870)
North Fork Yuba River below Goodyears Bar (USGS 11413000)
1969 – 1995 1997 – 2015 30 0.1182 -9.99 0.95 1922 – 1967
5
Oregon Creek near North San Juan (USGS 11409500) North Fork Yuba River below Goodyears Bar (USGS 11413000)
1931 – 1937 1939 – 1968 37 0.1296 -11.45 0.97
Oregon Creek at Camptonville (USGS 11409300) North Fork Yuba River below Goodyears Bar (USGS 11413000) 1968 – 2000 33 0.0935 -4.84 0.98
28a I_JKSMD Unimpaired Middle Yuba below Jackson Meadows Dam (USGS 11407900)
North Fork Yuba River below Goodyears Bar (USGS 11413000)
1927 – 1934 1936 – 2015 88 0.1415 0.93 0.94 1922 – 1926
1935 28b I_MFY013 29 I_NBLDB North Yuba River below New Bullards Bar Dam near North
San Juan (USGS 11413520)10 North Fork Yuba River below Goodyears Bar (USGS 11413000) 1941 – 2015 75 2.1075 -62.13 0.97 1922 – 1940
30 I_SFY007 South Fork Yuba River at Jones Bar (USGS 11417500) North Fork Yuba River below Goodyears Bar (USGS 11413000) 1960 – 2015 56 1.1970 57.53 0.98 1922 – 1959
31 I_ENGLB Local inflow to Englebright Reservoir (from mass balance) North Fork Yuba River below Goodyears Bar (USGS 11413000)
1943 – 1951 1953
1957 – 1966 20 0.6426 -74.87 0.93
1922 – 1942 1952
1954 – 1956 1967 – 2015
32 I_DER001 impaired Deer Creek near Smartville (USGS 11418500) North Fork Yuba River below Goodyears Bar (USGS 11413000) 1936 – 2015 80 0.2231 -19.88 0.90 1922 – 1935
33 I_DHC001 34 I_RLLNS Unimpaired Bear River below Rollins Dam (USGS
11422500) North Fork Yuba River below Goodyears Bar (USGS 11413000)
1951 – 1953 1965 – 2015 54 0.4093 -60.02 0.97 1922 – 1950
1953 – 1964
35 I_CMBIE Unimpaired11 Bear River near Wheatland (USGS 11424000) less Bear River below Rollins Dam near Colfax (USGS 11422500)6
North Fork Yuba River below Goodyears Bar (USGS 11413000)
1951 – 1953 1965 – 2015 54 0.4093 -60.02 0.97 1922 – 1950
1953 – 1964
36 I_WLF013 Unimpaired11 Bear River near Wheatland (USGS 11424000) less Bear River below Rollins Dam near Colfax (USGS 11422500)6
North Fork Yuba River below Goodyears Bar (USGS 11413000)
1951 – 1953 1965 – 2015 54 0.4093 -60.02 0.97 1922 – 1950
1953 – 1964
37a I_CMPFW Unimpaired11 Bear River near Wheatland (USGS 11424000) less Bear River below Rollins Dam near Colfax (USGS 11422500)6
North Fork Yuba River below Goodyears Bar (USGS 11413000)
1951 – 1953 1965 – 2015 54 0.4093 -60.02 0.97
1922 – 1950 1953 – 1964 37b I_BRR023
38 I_LKVLY 39 I_NFA054 40 I_NFA022 41 I_MFA023 Middle Fork American River above Middle Fork
Powerhouse (USGS 11427760) American River at Folsom Full Natural Flow (CDEC AMF)
1966 – 2007 2009 – 2015 49 0.0667 17.69 0.98 1922 – 1965
2008
42 I_MFA001 Middle Fork American River near USGS Auburn (USGS 11433500) less Middle Fork near Foresthill (USGS 11433300)
Oregon Creek near North San Juan (USGS 11409500) 1959 – 1985 27 1.1049 0.00 7 0.61 1922 – 1958
1986 – 2015
43 I_SFA030 South Fork American River near Camino (USGS 11443500 and 11443500
American River at Folsom Full Natural Flow (CDEC AMF)
1923 – 1967 1974 – 2015 42 0.2631 40.59 0.98 1922
1968 – 1973 44 I_FOLSM 45 I_TRNTY Inflow to Trinity Lake (reservoir report of operations) Unimpaired Trinity River at Lewiston (USGS
11525500) 1962 – 2015 54 0.9678 0.00 7 0.996 1922 – 1961

CalSim
3.0 Hydrology D
evelopment Project
5-18 DR
AFT – Decem
ber 2017
Table 5-3. Flow Correlation, Sacramento River Hydrologic Region (contd.)
ID CalSim 3.0 Arc Name Short-Term Station, Y Long-Term Station X
Common Period of
Observation No. of Years
Linear Coefficients Y = aX + b
Correlation Coefficient
(R2)
Period of Data
Extension a b
46 I_LWSTN Local inflow to Lewiston Lake8 Unimpaired Trinity River at Lewiston (USGS 11525500) 1962 – 2015 54 0.9678 0.00 7 0.996 1922 – 1961
47 I_CLR025 Clear Creek inflow to Whiskeytown Lake9 Unimpaired Clear Creek near Igo (USGS 11372000) 1941 – 1996 56 1.4588 12.481 0.85 1922 – 1940
48 I_CLR011 Local inflow to Clear Creek downstream from Whiskeytown Dam9
Unimpaired Clear Creek near Igo (USGS 11372000) 1941 – 1996 56 1.4588 12.481 0.85 1922 – 1940
49 I_CWD018 Cottonwood Creek near Olinda (USGS 11375810) Cottonwood Creek near Cottonwood (USGS 11376000)4 1972 – 1986 15 0.5243 -10.43 0.997 1922 – 1972
1987 – 2015
50 I_SCW008 South Fork Cottonwood Creek near Olinda (USGS 11375870)
Cottonwood Creek near Cottonwood (USGS 11376000)4 1978 – 1986 19 0.3337 -17.67 0.99 1922 – 1977
1987 – 2015 51 I_ELD027 Elder Creek near Paskenta (USGS 11379500) Thomes Creek at Paskenta (USGS 11382000) 1949 – 1996 48 0.3647 -1.14 0.90 1922 – 1948 52 I_THM028 Cottonwood Creek near Cottonwood (USGS 11376000) Thomes Creek at Paskenta (USGS 11382000) 1949 – 1996 48 0.3133 32.59 0.93 1997 – 2015 53 I_EPARK 54 I_SGRGE
55 I_BLKBT North Fork Stony Creek near Newville (USGS 11387800) Inflow to East Park Reservoir 1964 – 1973 10 0.6734 -21.01 0.97 1922 – 1963
1974 – 2015
Unimpaired local inflow to Black Butte Reservoir Inflow to East Park Reservoir plus local inflow to Stony Gorge Reservoir 1954 – 2015 62 1.0627 -33.35 0.94 1922 – 1953
56 I_CLRLK 57 I_INDVL Unimpaired North Fork Cache Creek near Clearlake Oaks
(USGS 11451300) Eel River at Van Arsdale Dam (USGS 11471500) 1975 – 2015 41 0.2873 16.73 0.96 1922 – 1974
58 I_BRC003 Bear Creek above Holsten Chimney Canyon (USGS 11451715), or Bear Creek near Rumsey (USGS 11451720)14
Unimpaired Putah Creek near Winters (USGS 11454000)
1959 – 1980 1998 – 2015 28 0.0981 -2.97 0.86 1922 – 1958
1981 – 1997
59 I_CCH053
Cache Creek near Capay (USGS 11452000) less Cache Creek near Lower Lake (USGS 11451000) less North Fork Cache Creek near Lower Lake (USGS 11451500) less Bear Creek near Rumsey (USGS 11451720) 2
Unimpaired Putah Creek near Winters (USGS 11454000) 1959 – 1972 14 0.1745 -9.11 0.94 1922 – 1958
1977 – 2015
60 I_BRYSA Inflow to Lake Berryessa (report of operations) Unimpaired Putah Creek near Winters (USGS 11454000) 1976 – 2015 40 0.9518 4.10 0.998 1922 – 1975

5-19 DR
AFT – Decem
ber 2017
Chapter 5: R
im W
atershed Hydrology
Table 5-3. Flow Correlation, Sacramento River Hydrologic Region (contd.) Notes: 1 Values before October 1928 estimated by the State Department of Water Resources in Basic Data – Inflow to Delta from Sacramento Valley, Shasta–Folsom Mandatory Releases, Year 1956, Volume 1. 2 Time series data multiplied by a factor of 0.96 to account for differences in watershed area between I_CCH053 and the watershed between the gauges. 3 Time series data multiplied by a factor of 1.10 to account for inflow from Sevenmile Creek watershed. 4 Flow before October 1940 estimated by U.S. Corps of Engineers. 5 Annual flows at Oregon Creek USGS gauges 11409300, 11409400, and 11409500 related through correlation with North Fork Yuba below Goodyears Bar 6 Accretion to Bear River between USGS gauges 11422500 and 11424000, distributed between three watersheds (I_WLF021, I_BRR023,I_CMBIE, I_CMPFW) based on drainage area and precipitation depth. 7 Intercept of line of linear regression set to zero. 8 Local inflow to Lewiston Lake calculated as (1– 0.9689) times the unimpaired flow for Trinity River at Lewiston. 9 Unimpaired flow at USGS gauge 11372000 assigned 86 percent of Whiskeytown Lake inflow and 14 percent to accretion below Whiskeytown Dam. 10 USGS 11413520 extended from October 2003 through September 2015 using the sum of USGS gauge 1141517 and reservoir spills reported by Yuba County Water Agency. Before October 1966,
unimpaired flow based on USGS gauge 11413500. 11 Unimpaired for storage regulation in Combie Lake and Camp Far West Reservoir and diversions by Nevada ID, South Sutter WD, and Camp Far West ID. 12 Unimpaired flow at USGS gauge 11406500 assigned, based on drainage area and precipitation depth, as follows: I_RVPHB 6.12 percent; I_WBF030 28.84 percent; I_WBF015 44.30 percent; and I_WBF006
20.74 percent. 13 Prior to October 1930, data from Table 7, Surface Water Hydrology of Putah–Cache Creeks Hydrographic Unit, (DWR, 1964). 14 Bear Creek near Rumsey (11451720) scaled by the ratio of drainage areas (94.9 to 100.0 square miles). 15 Unimpaired for storage regulation in Jackson Meadows Reservoir and diversions through Milton–Bowman Tunnel. 16 Flow from October 1921 through September 1930 calculated as 1.029 times the sum of Rock Creek at Goodyears Bar (USGS 11412000), Goodyear Creek at Goodyears Bar (USGS 11412500) and North
Fork Yuba River at Goodyears Bar (USGS 11411500). 17 USGS gauges are indicated by an 8–digit number starting “11”. 18 From October 1941 through September 1961, flow estimated as USGS 11376500, Battle Creek near Cottonwood, plus 60 CFS. 19 Gauge data from 2006 to 2015 not used in correlation. 20 Water year 2007 excluded from the correlation. Key: DWR = California Department of Water Resources ID = Irrigation District Reclamation = U.S. Department of the Interior, Bureau of Reclamation USGS = U.S. Geological Survey WD = Water District

CalSim
3.0 Hydrology D
evelopment Project
5-20 DR
AFT – Decem
ber 2017
Table 5-4. Rim Watershed Inflows, Sacramento River Hydrologic Region
ID CalSim 3.0 Inflow Average Monthly and Average Annual Inflows from Rim Watershed,
Water Years 1922 – 2015 (thousand acre-feet) Arc Description Oct Nov Dec Jan Feb Mar Apr May Jun Jul Aug Sep Total
1 I_SHSTA Shasta Lake inflows 241 327 548 696 781 829 680 510 322 236 211 206 5,589 2 I_COW014 Cow Creek at WBA boundary 6 21 62 79 79 71 46 30 12 3 2 2 413 3 I_BCN010 Bear Creek (North) near Millville 1 3 7 10 12 11 8 4 2 1 0 0 59 4 I_BTL006 Battle Creek near Cottonwood 17 22 33 40 40 42 38 37 28 19 16 15 347 5 I_PYN001 Paynes Creek near Red Bluff and Sevenmile Creek 1 3 9 12 12 9 4 2 0 0 0 0 52 6 I_ANT011 Antelope Creek near Red Bluff 3 5 12 15 16 15 12 9 5 3 2 2 99 7 I_MLC006 Mill Creek near Los Molinos 7 11 22 25 26 27 26 26 19 11 7 6 215 8 I_DRC012 Deer Creek near Vina 7 11 24 31 34 36 31 23 12 7 6 6 228 9 I_MNS000 Minor northeast streams 6 12 28 36 38 36 28 21 11 6 5 5 234
10 I_BCC014 Big Chico Creek near Chico 2 4 12 18 20 19 12 6 3 2 2 1 101 11 I_LCC038 Little Chico Creek near Chico 0 1 2 4 4 4 3 2 1 0 0 0 22 12 I_BTC060 Butte Creek near Chico 6 10 25 34 39 40 35 25 12 6 5 4 241 13 I_LDC029 Little Dry Creek 0 1 3 4 5 5 3 2 1 0 0 0 26
14a I_RVPHB Round Valley and Philbrook Reservoir inflows 2 4 9 12 14 15 13 12 6 3 2 2 95 14b I_WBF030 West Branch Feather River at Hendricks Dam accretions 1 1 2 3 3 3 3 3 1 1 0 0 20 15a I_WBF015 West Branch Feather River at Miocene Dam accretions 2 3 7 9 10 11 10 9 4 2 1 1 68 15b I_WBF006 West Branch Feather River near Yankee Hill accretions 4 6 15 19 21 23 21 19 9 4 3 3 146 16 I_NFF027 North Fork Feather River at Pulga 96 116 178 223 225 258 266 248 161 119 112 98 2,100 17 I_MFF019 Middle Fork Feather River near Merrimac accretions 17 35 77 99 116 153 166 157 74 25 15 13 945 18 I_LGRSV Little Grass Valley Reservoir inflows 1 3 7 8 9 11 14 16 6 1 1 0 77 19 I_LST007 Sly Creek Reservoir natural inflows 2 3 7 9 10 11 11 8 4 3 2 2 73 20 I_SFF011 South Fork Feather River at Ponderosa Dam accretions 2 3 8 12 15 17 15 11 5 2 2 1 93 21 I_SFF008 South Fork Feather at Enterprise local inflows 0 1 2 3 3 4 3 2 1 1 0 0 21 22 I_OROVL Lake Oroville local inflows 6 16 49 74 79 75 59 39 17 7 4 4 430 23 I_HON021 South Fork Honcut Creek 0 1 3 5 5 5 3 1 0 0 0 0 24 24 I_MERLC Merle Collins Reservoir inflows 1 2 7 8 9 10 6 2 1 0 1 0 46 25 I_SLT009 Slate Creek above Slate Creek Diversion Dam 2 5 13 16 17 23 25 25 9 2 1 1 138 26 I_NFY029 North Fork Yuba River below Goodyears Bar 11 20 40 48 51 66 81 109 64 22 11 9 532 27 I_OGN005 Oregon Creek above Log Cabin Diversion Dam 1 2 6 8 9 10 8 5 2 1 0 0 52 28 I_MFY013 Middle Fork Yuba River above Our House Diversion Dam 3 8 20 26 29 35 36 35 18 5 3 2 221 29 I_NBLDB New Bullards Bar Reservoir local inflow 2 9 35 48 53 71 70 60 24 8 3 1 385 30 I_SFY007 South Fork Yuba River at Jones Bar 5 10 26 34 35 43 38 57 38 8 4 3 300
5-21 DR
AFT – Decem
ber 2017
Chapter 5: R
im W
atershed Hydrology
Table 5-4. Rim Watershed Inflows, Sacramento River Hydrologic Region (contd)
ID CalSim 3.0 Inflow Average Monthly and Average Annual Inflows from Rim Watershed,
Water Years 1922 – 2015 (thousand acre-feet) Arc Description Oct Nov Dec Jan Feb Mar Apr May Jun Jul Aug Sep Total
31 I_ENGLB Englebright Reservoir local inflow 3 7 17 21 22 25 18 14 8 4 2 2 143 32 I_DER001 Deer Creek near Smartville 2 3 9 14 17 17 10 4 1 1 1 0 80 33 I_DHC001 Dry Creek and Hutchinson Creek 1 2 7 11 12 10 6 2 0 0 0 0 53 34 I_RLLNS Rollins Reservoir natural inflows 1 6 19 26 28 30 24 14 5 2 1 1 157 35 I_CMBIE Combie Reservoir local inflow 1 2 4 6 7 5 3 1 1 0 0 0 30 36 I_WLF013 Wolf Creek at Tarr Ditch Diversion Dam 0 1 3 4 4 3 2 1 0 0 0 0 19
37a I_BRR023 Garden Bar Dam site local inflow 0 1 2 3 4 3 2 1 0 0 0 0 16 37b I_CMPFW Camp Far West Reservoir local inflow 2 5 13 18 21 17 9 3 2 1 1 1 92 38 I_LKVLY Lake Valley Reservoir inflows 0 0 1 1 1 1 1 1 1 0 0 0 9 39 I_NFA054 North Fork American River 3 11 30 42 47 57 60 62 28 7 2 2 351 40 I_NFA022 North Fork American River at North Fork Dam local inflow 2 7 19 26 29 35 37 38 18 4 1 1 218 41 I_MFA023 Middle Fork American River near Forest Hill 28 34 61 77 91 104 96 95 70 50 44 35 785 42 I_MFA001 Middle Fork American River near Auburn local inflow 1 1 5 9 11 12 9 4 2 1 0 0 56 43 I_MFA001 Middle Fork American River accretions: PH to Auburn 31 40 66 97 90 99 115 132 115 58 57 57 957 43 I_SFA030 South Fork American River near Placerville 2 6 19 28 32 37 30 18 7 2 1 1 183 44 I_FOLSM Folsom Lake local inflows 17 50 101 122 146 175 203 239 127 39 12 7 1,236 45 I_TRNTY Trinity Lake (Clair Engle Lake) inflow 1 1 2 6 5 5 4 6 5 2 1 2 39 46 I_LWSTN Lewiston Lake local inflow 4 12 30 44 54 53 38 21 10 6 4 3 279 47 I_CLR025 Whiskeytown Reservoir natural inflows 1 2 5 7 9 9 6 3 2 1 1 1 45 48 I_CLR011 Clear Creek accretions: Whiskeytown Dam to Igo 2 9 35 54 63 57 38 20 8 2 1 1 292 49 I_CWD018 North and Middle Fork Cottonwood Creek near Olinda 1 6 22 35 39 32 20 12 6 2 1 0 175 50 I_SCW008 South Fork Cottonwood Creek near Olinda 0 2 8 12 14 13 9 5 2 0 0 0 67 51 I_ELD027 Elder Creek near Paskenta 2 8 25 35 40 38 33 22 8 2 0 0 213 52 I_THM028 Thomes Creek at Paskenta 0 2 10 15 16 11 6 3 1 0 0 0 65 53 I_EPARK East Park Reservoir inflow 2 5 20 32 36 29 20 11 5 1 1 0 162 54 I_SGRGE Stony Gorge Reservoir local inflow 0 5 26 43 47 38 23 12 4 0 0 0 199 55 I_BLKBT Black Butte Lake local inflow 4 18 60 93 96 73 39 16 10 15 13 7 443 56 I_CLRLK Clear Lake inflows 1 2 14 25 26 21 11 4 1 1 0 0 107 57 I_INDVL Indian Valley Reservoir inflows 0 1 4 8 9 6 3 1 0 0 0 0 33 58 I_BRC003 Bear Creek above Holsten Chimney, Cache Creek 0 1 6 11 15 11 6 2 1 0 0 0 54 59 I_CCH053 Cache Creek accretions: Clear Lake Dam to Rumsey 2 11 54 82 96 64 32 10 3 1 1 1 357 60 I_BRYSA Lake Berryessa inflows 3 7 17 21 22 25 18 14 8 4 2 2 143
N/A D_SPLDG_DRM000 Drum Canal import from Lake Spaulding 21 23 28 27 25 30 36 43 40 41 37 21 373 N/A D_SYC002_BRR074 South Yuba Canal spill to Bear River 1 1 2 2 2 2 3 3 3 2 2 1 23 N/A R_NIDDC_WLF021 Nevada ID return flows to Wolf Creek 1 1 1 1 1 1 1 1 2 2 2 2 15

CalSim
3.0 Hydrology D
evelopment Project
5-22 DR
AFT – Decem
ber 2017
Table 5-5. Rim Watershed Characteristics, Sacramento River Hydrologic Region (contd.)
ID CalSim 3.0 Inflow Area
(acres)
Elevation Band (feet)
Average Annual Precipitation
(inches) Runoff
Fraction Average
Annual Inflow (acre-feet/acre) Arc Description Low High
1 I_SHSTA Shasta Lake inflows 4,216,593 850 13,960 36.75 0.44 1.3 2 I_COW014 Cow Creek at WBA boundary 245,781 470 7,030 48.99 0.42 1.7 3 I_BCN010 Bear Creek (North) near Millville 47,051 730 6,570 42.16 0.36 1.3 4 I_BTL006 Battle Creek near Cottonwood 230,635 420 10,360 46.35 0.39 1.5 5 I_PYN001 Paynes Creek near Red Bluff and Sevenmile Creek 65,229 260 5,850 34.87 0.28 0.8 6 I_ANT011 Antelope Creek near Red Bluff 79,216 390 6,860 43.25 0.35 1.3 7 I_MLC006 Mill Creek near Los Molinos 84,448 400 9,910 55.73 0.55 2.6 8 I_DRC012 Deer Creek near Vina 133,758 510 7,790 58.53 0.35 1.7 9 I_MNS000 Minor northeast streams 187,050 290 4,080 43.62 0.35 1.3
10 I_BCC014 Big Chico Creek near Chico 46,176 360 6,010 63.93 0.41 2.2 11 I_LCC038 Little Chico Creek near Chico 16,333 310 3,490 52.66 0.31 1.4 12 I_BTC060 Butte Creek near Chico 94,475 360 7,170 69.25 0.45 2.6 13 I_LDC029 Little Dry Creek 21,486 300 2,380 47.15 0.32 1.2
14 I_WBF030 West Branch Feather River at Hendricks Dam accretions 24,348 3,300 6,970 82.18 0.58 3.9 I_RVPHB Round Valley and Philbrook Reservoir inflows 4,862 5,550 6,980 87.39 0.58 4.1
15 I_WBF006 West Branch Feather River near Yankee Hill accretions 23,221 830 4,020 61.96 0.58 2.9 I_WBF015 West Branch Feather River at Miocene Dam accretions 40,757 1,590 6,810 75.40 0.58 3.6
16 I_NFF027 North Fork Feather River at Pulga 1,248,456 1,380 8,850 46.55 0.44 1.7 17 I_MFF019 Middle Fork Feather River near Merrimac 679,213 1,680 8,700 40.32 0.42 1.4 18 I_LGRSV Little Grass Valley Reservoir inflows 16,429 5,040 7,320 75.55 0.75 4.7 19 I_LST007 Sly Creek Reservoir natural inflows 15,392 3,500 5,870 78.79 0.74 4.7 20 I_SFF011 South Fork Feather River at Ponderosa Dam local inflow 37,054 980 5,910 72.97 0.41 2.5 21 I_SFF008 South Fork Feather at Enterprise local inflow 15,694 830 4,420 60.07 0.27 1.8 22 I_OROVL Lake Oroville local inflow 199,602 810 6,170 63.58 0.42 2.2 23 I_HON021 South Fork Honcut Creek 19,554 670 3,260 48.43 0.31 1.2 24 I_MERLC Merle Collins Reservoir inflows 45,825 1,080 3,650 55.80 0.22 1.0 25 I_SLT009 Slate Creek above Slate Creek Diversion Dam 31,496 3,660 7,630 74.80 0.72 4.4 26 I_NFY029 North Fork Yuba River below Goodyears Bar 160,117 2,550 8,390 69.93 0.58 3.3 27 I_OGN005 Oregon Creek above Log Cabin Diversion Dam 18,615 2,040 5,780 67.13 0.51 2.8 28 I_MFY013 Middle Fork Yuba River above Our House Diversion Dam 92,717 2,090 8,230 68.78 0.42 2.4 29 I_NBLDB New Bullards Bar Reservoir local inflow 121,069 1,870 7,630 70.99 0.49 3.2 30 I_SFY007 South Fork Yuba River at Jones Bar 199,050 1,130 8,940 67.95 0.27 1.5

5-23 DR
AFT – Decem
ber 2017
Chapter 5: R
im W
atershed Hydrology
Table 5-5. Rim Watershed Characteristics, Sacramento River Hydrologic Region (contd.)
ID CalSim 3.0 Inflow Area
(acres)
Elevation Band (feet)
Average Annual Precipitation
(inches) Runoff
Fraction Average
Annual Inflow (acre-feet/acre) Arc Description Low High
31 I_ENGLB Englebright Reservoir local inflow 86,725 390 4,320 50.56 0.40 1.6 32 I_DER001 Deer Creek near Smartville 54,005 670 5,010 53.24 0.34 1.5 33 I_DHC001 Dry Creek and Hutchinson Creek 61,890 130 2,620 33.89 0.31 0.9 34 I_RLLNS Rollins Reservoir natural inflows 66,328 1,970 5,820 59.93 0.48 2.4 35 I_CMBIE Combie Reservoir local inflow 20,381 1,610 2,800 44.13 0.41 1.5 36 I_WLF013 Wolf Creek at Tarr Ditch Diversion Dam 10,079 2,080 3,420 56.13 0.41 1.9
37 I_CMPFW Camp Far West Reservoir local inflow 16,062 270 1580 28.91 0.41 1.0 I_BRR023 Proposed Garden Bar Dam site local inflow 67,579 340 3070 40.46 0.41 1.4
38 I_LKVLY Lake Valley Reservoir inflows 2,801 5,790 6,950 75.97 0.49 3.1 39 I_NFA054 North Fork American River above North Fork confluence 121,468 2,040 8,860 68.92 0.51 2.9 40 I_NFA022 North Fork American River at North Fork Dam local inflow 93,733 710 5,110 51.09 0.55 2.3 41 I_MFA023 Middle Fork American River near Foresthill 332,961 1,090 9,800 62.20 0.46 2.4 42 I_MFA001 Middle Fork American River accretions: Foresthill to Auburn 59,831 600 4,540 45.31 0.25 0.9 43 I_SFA030 South Fork American River near Placerville 372,881 980 10,210 53.29 0.58 2.6 44 I_FOLSM Folsom Lake local inflow 206,129 420 4,400 35.27 0.33 0.9 45 I_TRNTY Trinity Lake (Clair Engle Lake) inflow 443,426 2,270 8,960 58.71 0.58 2.8 46 I_LWSTN Lewiston Lake local inflow 16,730 1,900 4,870 38.01 0.76 2.3 47 I_CLR025 Whiskeytown Reservoir natural inflow 127,896 1,190 6,150 59.68 0.45 2.2 48 I_CLR011 Clear Creek accretions: Whiskeytown Dam to Igo 18,153 690 5,010 60.33 0.51 2.5 49 I_CWD018 North Fork and Middle Fork Cottonwood Creek near Olinda 252,762 510 7,760 40.20 0.35 1.2 50 I_SCW008 South Fork Cottonwood Creek near Olinda 238,190 520 8,010 37.45 0.24 0.7 51 I_ELD027 Elder Creek near Paskenta 59,408 730 6,630 37.25 0.37 1.1 52 I_THM028 Thomes Creek at Paskenta 130,641 710 8,030 41.01 0.49 1.6 53 I_EPARK East Park Reservoir inflow 62,486 1,200 6,070 32.67 0.37 1.0 54 I_SGRGE Stony Gorge Reservoir local inflow 164,790 710 6,990 33.86 0.36 1.0 55 I_BLKBT Black Butte Lake local inflow 249,482 370 6,920 30.29 0.32 0.8 56 I_CLRLK Clear Lake inflows 313,250 1,250 4,750 40.56 0.42 1.4 57 I_INDVL Indian Valley Reservoir inflow 77,396 1,470 5,880 41.55 0.42 1.4 58 I_BRC003 Bear Creek above Holsten Chimney, tributary to Cache Creek 60,771 880 3,800 27.51 0.24 0.5 59 I_CCH053 Cache Creek accretions: Clear Lake Dam to Rumsey 158,736 560 4,330 31.15 0.13 0.3 60 I_BRYSA Lake Berryessa inflows 363,171 420 4,700 35.01 0.34 1.0 Note: The Trinity and Lewiston Lake watersheds are located in the North Coast Hydrologic Region, but are included here because water is exported from the Trinity River Project to
the Sacramento Valley as part of the Central Valley Project.

CalSim
3.0 Hydrology D
evelopment Project
5-24 DR
AFT – Decem
ber 2017
Figure 5-3. Annual Inflows, Sacramento River Hydrologic Region
0
2,000
4,000
6,000
8,000
10,000
12,000
Sacr
amen
to, P
it,M
cClo
ud R
iver
s
Feat
her R
iver
Amer
ican
Riv
er
Yuba
Riv
er
Oth
er E
asts
ide
Trin
ity R
iver
Oth
er W
ests
ide
Cac
he C
reek
Ston
y C
reek
Puta
h C
reek
Cle
ar C
reek
Butte
Bas
in
Bear
Riv
er
Ann
ual F
low
(TA
F)
Maximum
Minimum
20th Percentile
20th percentile
80th percentile
AverageX

Chapter 5: Rim Watershed Hydrology
5-25 DRAFT – December 2017
Chapter 5 Rim Watershed Hydrology ............................................................................... 5-1 Approach ................................................................................................................................... 5-1 Delineation of Watersheds ........................................................................................................ 5-3 Data Development .................................................................................................................... 5-5
Data Sources .................................................................................................................... 5-5 Land Use Change ............................................................................................................. 5-5
Inflow Summary ....................................................................................................................... 5-8 Table 5-1. Rim Watershed Land Cover, Sacramento River Hydrologic Region ........................ 5-9 Table 5-1. Rim Watershed Land Cover, Sacramento River Hydrologic Region (contd.) ........ 5-10 Table 5-1. Rim Watershed Land Cover, Sacramento River Hydrologic Region (contd.) ........ 5-11 Table 5-2. Data Sources and Calculation Methods, Sacramento River Hydrologic Region .... 5-12 Table 5-2. Data Sources and Calculation Methods, Sacramento River Hydrologic Region
(contd.) .................................................................................................................. 5-13 Table 5-2. Data Sources and Calculation Methods, Sacramento River Hydrologic Region
(contd.) .................................................................................................................. 5-14 Table 5-2. Data Sources and Calculation Methods, Sacramento River Hydrologic Region
(contd.) .................................................................................................................. 5-15 Table 5-3. Flow Correlation, Sacramento River Hydrologic Region ....................................... 5-16 Table 5-3. Flow Correlation, Sacramento River Hydrologic Region (contd.) .......................... 5-17 Table 5-3. Flow Correlation, Sacramento River Hydrologic Region (contd.) .......................... 5-18 Table 5-3. Flow Correlation, Sacramento River Hydrologic Region (contd.) .......................... 5-19 Table 5-4. Rim Watershed Inflows, Sacramento River Hydrologic Region ............................ 5-20 Table 5-4. Rim Watershed Inflows, Sacramento River Hydrologic Region (contd) ................ 5-21 Table 5-5. Rim Watershed Characteristics, Sacramento River Hydrologic Region (contd.) ... 5-22 Table 5-5. Rim Watershed Characteristics, Sacramento River Hydrologic Region (contd.) ... 5-23 Figure 5-1. Historical Temperature Trend for the Sacramento Valley ....................................... 5-2 Figure 5-2. Rim Watersheds, Sacramento River Hydrologic Region ......................................... 5-4 Figure 5-3. Annual Inflows, Sacramento River Hydrologic Region ........................................ 5-24