Embed Size (px)
Citation preview

Chapter 5Regression
BPS - 5th Ed.
Chapter 51
Linear RegressionObjective: To quantify the linear
relationship between an explanatory variable (x) and response variable (y).
We can then predict the average response for all subjects with a given value of the explanatory variable.
BPS - 5th Ed.
Chapter 5
2

Prediction via Regression Line Number of new birds and Percent returning
Example: predicting number (y) of new adult birds that join the colony based on the percent (x) of adult birds that return to the colony from the previous year.
BPS - 5th Ed. Chapter 5 3
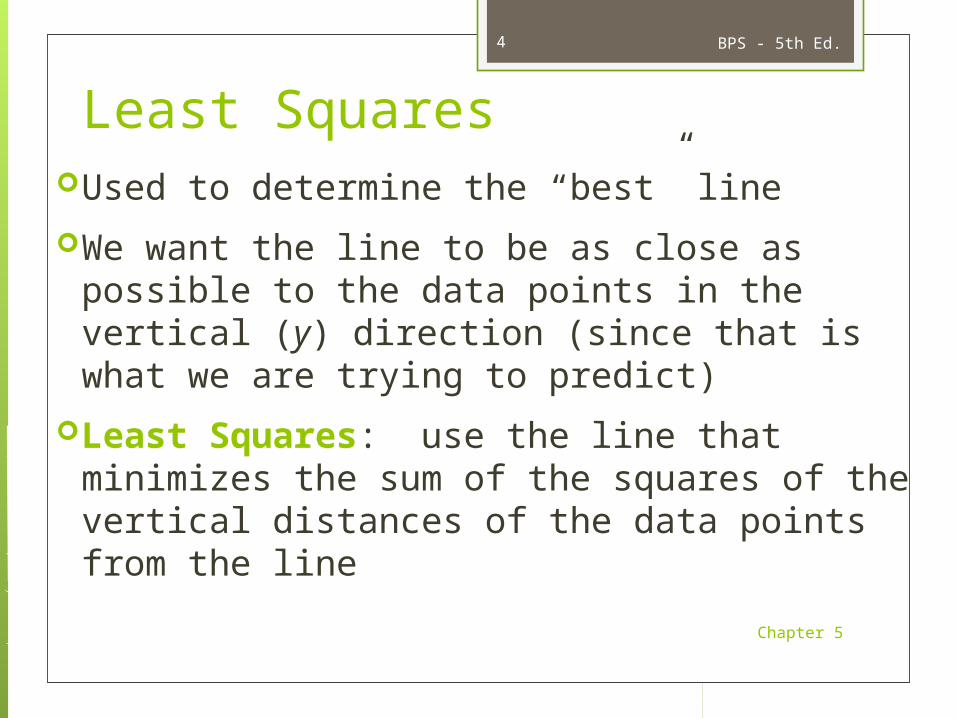
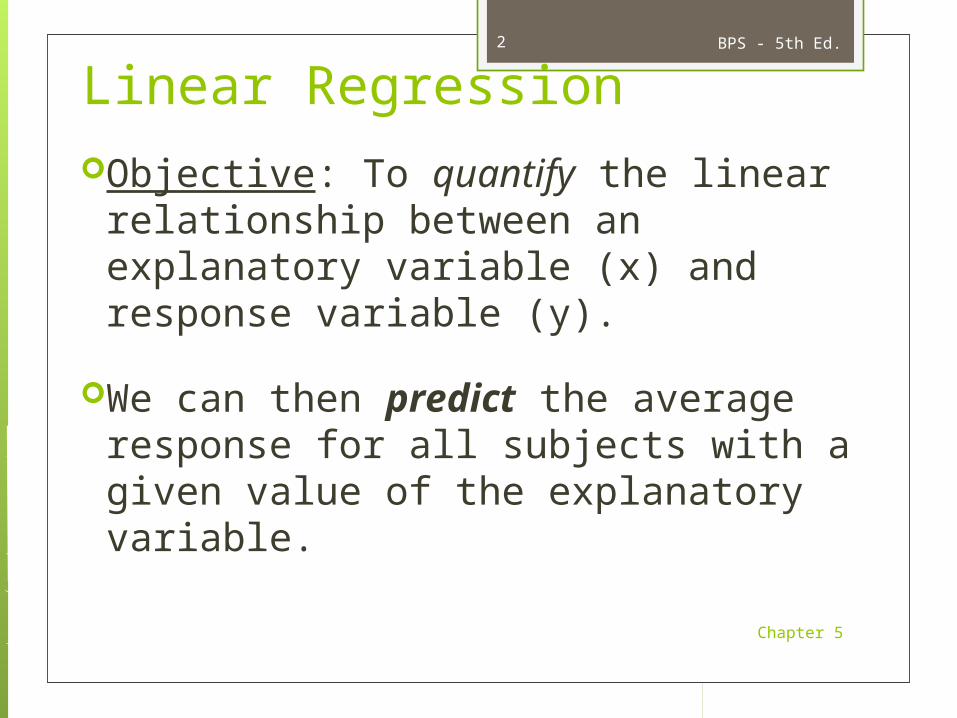
Least SquaresUsed to determine the “best” line
We want the line to be as close as possible to the data points in the vertical (y) direction (since that is what we are trying to predict)
Least Squares: use the line that minimizes the sum of the squares of the vertical distances of the data points from the line
BPS - 5th Ed.
Chapter 5
4
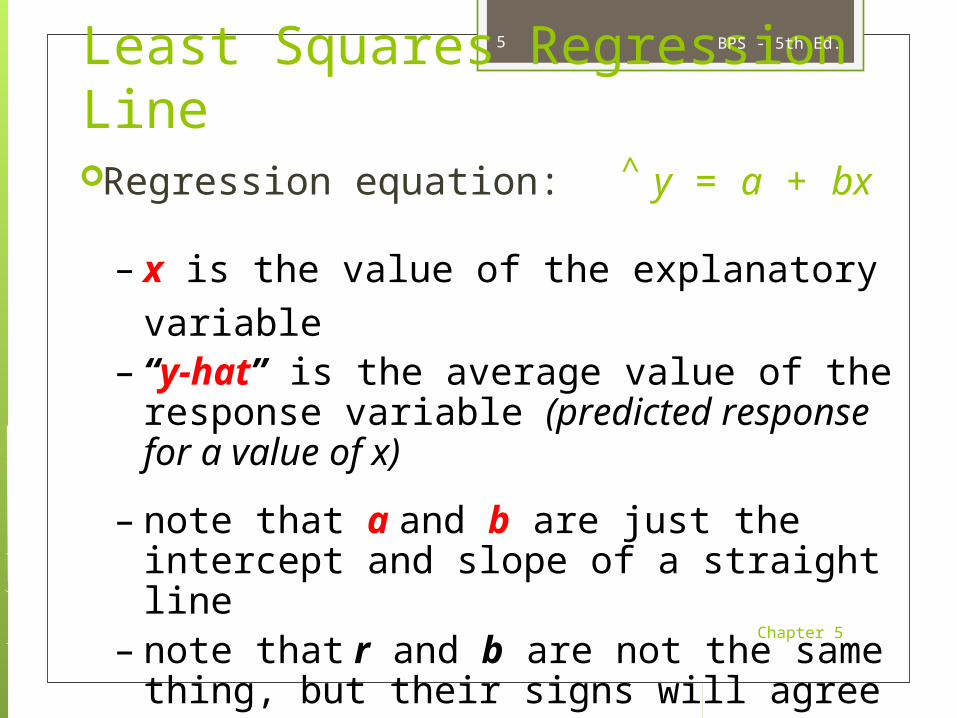
Least Squares Regression LineRegression equation: y = a + bx
BPS - 5th Ed.
Chapter 5
5
^
– x is the value of the explanatory variable– “y-hat” is the average value of the response
variable (predicted response for a value of x)
– note that a and b are just the intercept and slope of a straight line
– note that r and b are not the same thing, but their signs will agree

Prediction via Regression Line Number of new birds and Percent returning
BPS - 5th Ed.
Chapter 5
6
The regression equation is y-hat = 31.9343 0.3040x– y-hat is the average number of new birds for all
colonies with percent x returning For all colonies with 60% returning, we predict
the average number of new birds to be 13.69:31.9343 (0.3040)(60) = 13.69 birds
Suppose we know that an individual colony has 60% returning. What would we predict the number of new birds to be for just that colony?
Regression Line Calculation
xbya
s
srb
x
y
BPS - 5th Ed. Chapter 5 7
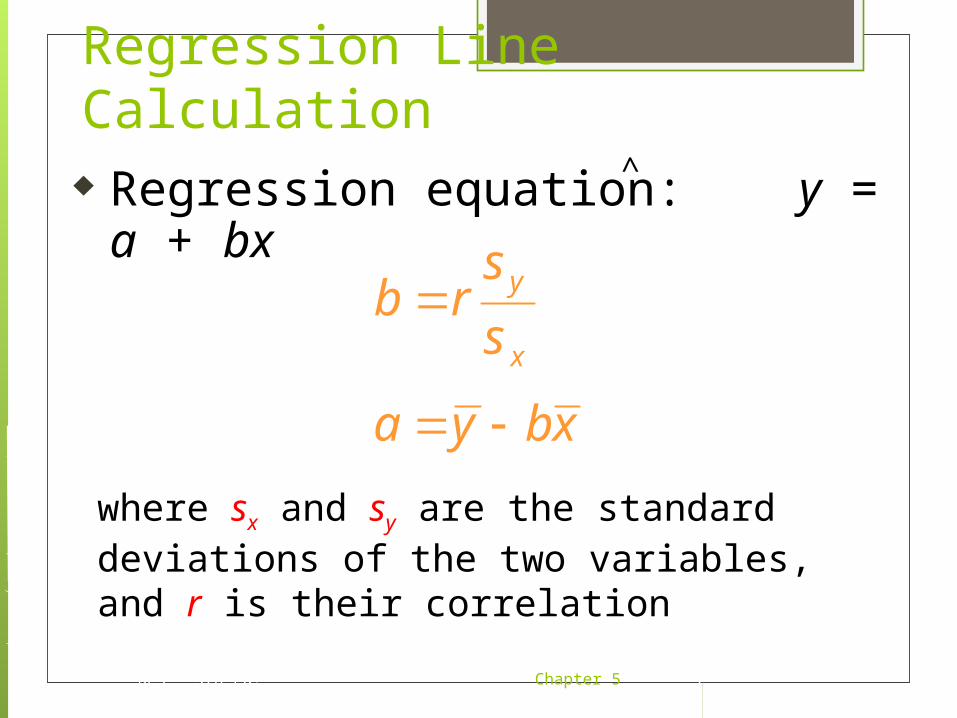
^ Regression equation: y = a + bx
where sx and sy are the standard deviations of the two variables, and r is their correlation
Regression CalculationCase Study
BPS - 5th Ed.
Chapter 5
8
Per Capita Gross Domestic Productand Average Life Expectancy for
Countries in Western Europe

Regression CalculationCase Study
Country Per Capita GDP (x) Life Expectancy (y)
Austria 21.4 77.48
Belgium 23.2 77.53
Finland 20.0 77.32
France 22.7 78.63
Germany 20.8 77.17
Ireland 18.6 76.39
Italy 21.5 78.51
Netherlands 22.0 78.15
Switzerland 23.8 78.99
United Kingdom 21.2 77.37
BPS - 5th Ed. Chapter 5 9
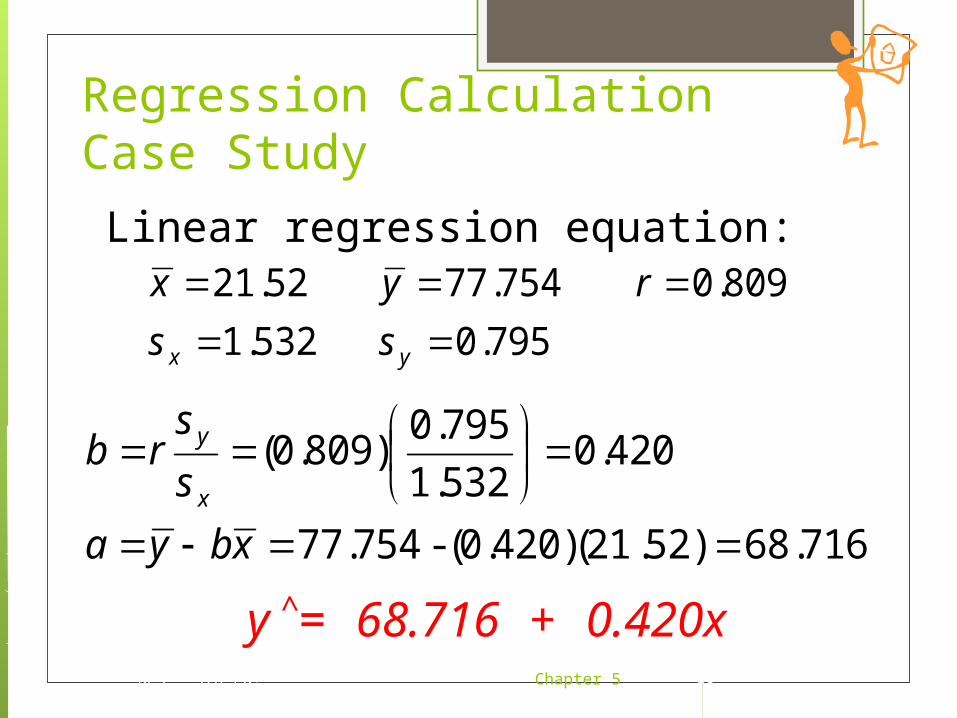
Regression CalculationCase Study
0.795 1.532
0.809 77.754 21.52
yx ss
ryx
BPS - 5th Ed. Chapter 5 10
Linear regression equation:
68.716.52)(0.420)(21-77.754
0.4201.532
0.795(0.809)
xbya
s
srb
x
y
y = 68.716 + 0.420x^
Coefficient of Determination (R2)Measures usefulness of regression predictionR2 (or r2, the square of the correlation):
measures what fraction of the variation in the values of the response variable (y) is explained by the regression line r=1: R2=1: regression line explains all (100%) of
the variation in y r=.7: R2=.49: regression line explains almost
half(50%) of the variation in y
BPS - 5th Ed.
Chapter 5
11
Residuals
A residual is the difference between an observed value of the response variable and the value predicted by the regression line:
residual = y y
BPS - 5th Ed.
Chapter 5
12
^
Residuals
A residual plot is a scatterplot of the regression residuals against the explanatory variableused to assess the fit of a regression line
look for a “random” scatter around zero
BPS - 5th Ed.
Chapter 5
13
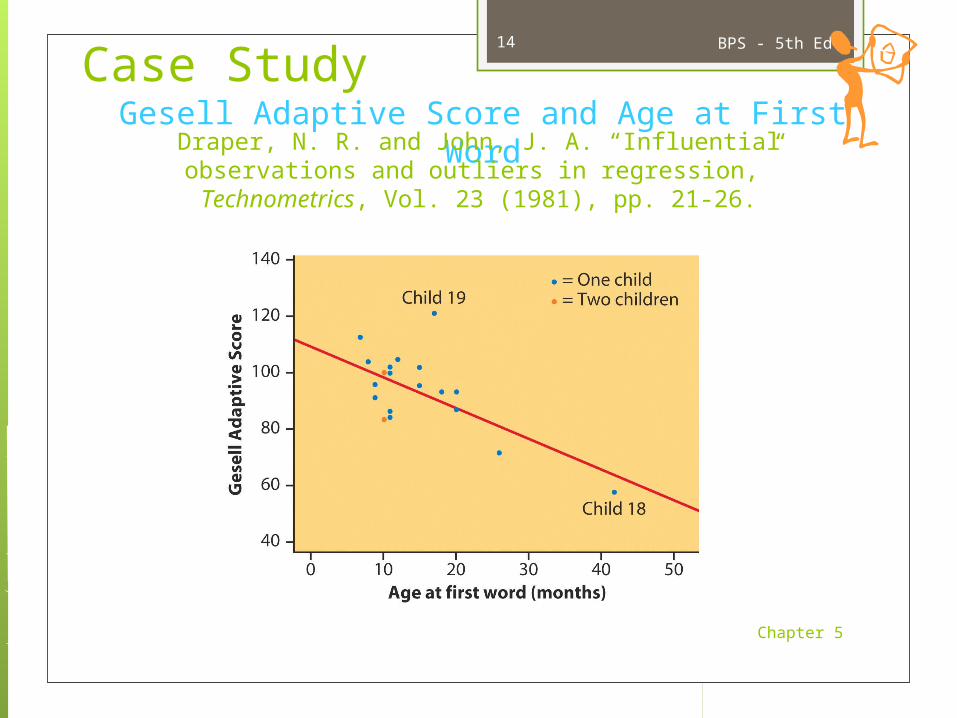
Case StudyBPS - 5th Ed.
Chapter 5
14
Gesell Adaptive Score and Age at First WordDraper, N. R. and John, J. A. “Influential observations and outliers
in regression,” Technometrics, Vol. 23 (1981), pp. 21-26.
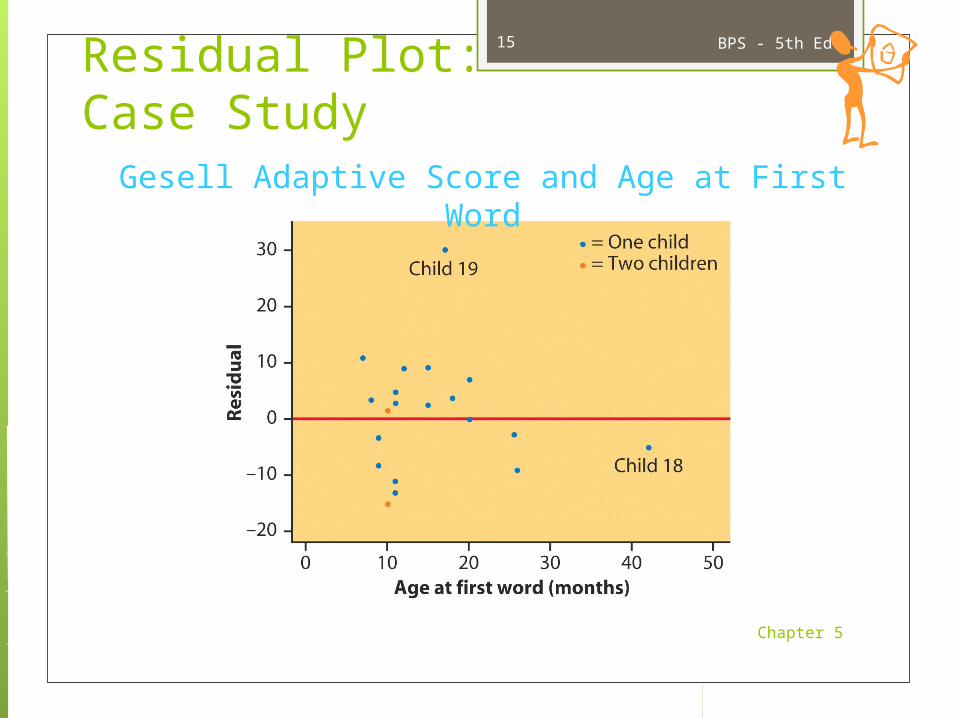
Residual Plot:Case Study
BPS - 5th Ed.
Chapter 5
15
Gesell Adaptive Score and Age at First Word
Outliers and Influential Points
An outlier is an observation that lies far away from the other observationsoutliers in the y direction have large residuals
outliers in the x direction are often influential for the least-squares regression line, meaning that the removal of such points would markedly change the equation of the line
BPS - 5th Ed.
Chapter 5
16
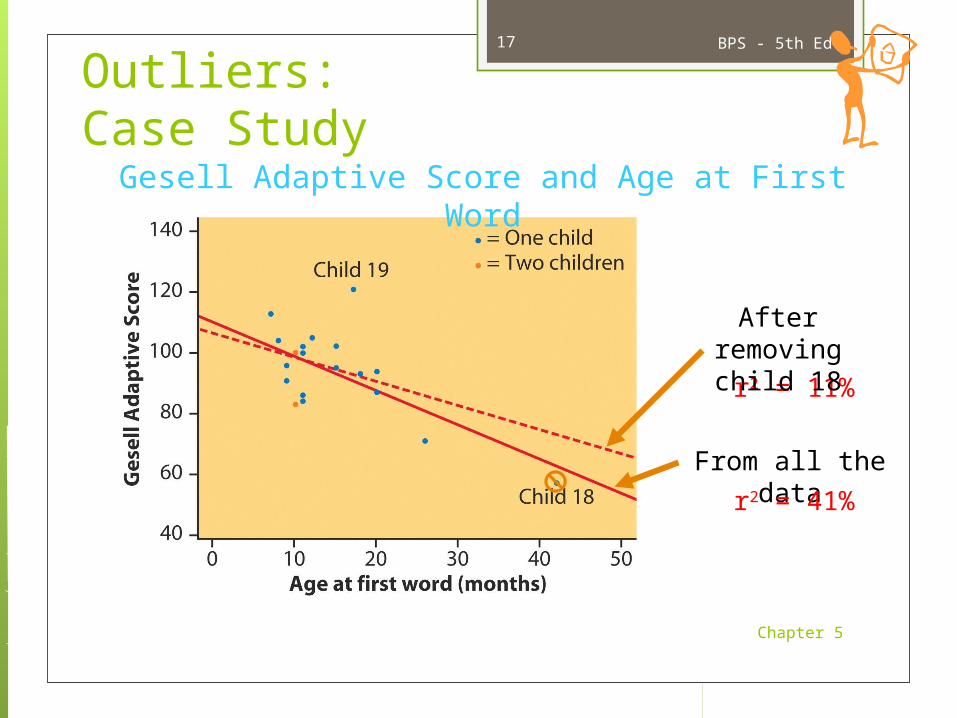
Outliers:Case Study
BPS - 5th Ed.
Chapter 5
17
Gesell Adaptive Score and Age at First Word
From all the data
r2 = 41%
r2 = 11%
After removing child 18
Cautionsabout Correlation and Regression
only describe linear relationships are both affected by outliers always plot the data before interpreting beware of extrapolation
predicting outside of the range of x beware of lurking variables
have important effect on the relationship among the variables in a study, but are not included in the study
association does not imply causation
BPS - 5th Ed.
Chapter 5
18
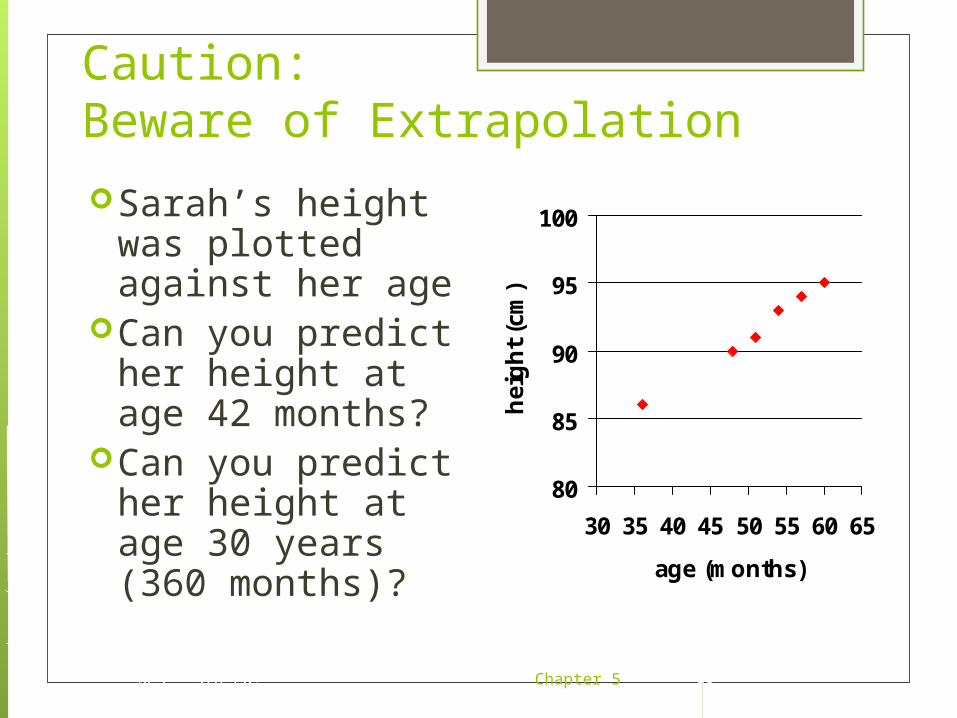
Caution:Beware of Extrapolation
Sarah’s height was plotted against her age
Can you predict her height at age 42 months?
Can you predict her height at age 30 years (360 months)?
80
85
90
95
100
30 35 40 45 50 55 60 65
age (months)
hei
gh
t (c
m)
BPS - 5th Ed. Chapter 5 19
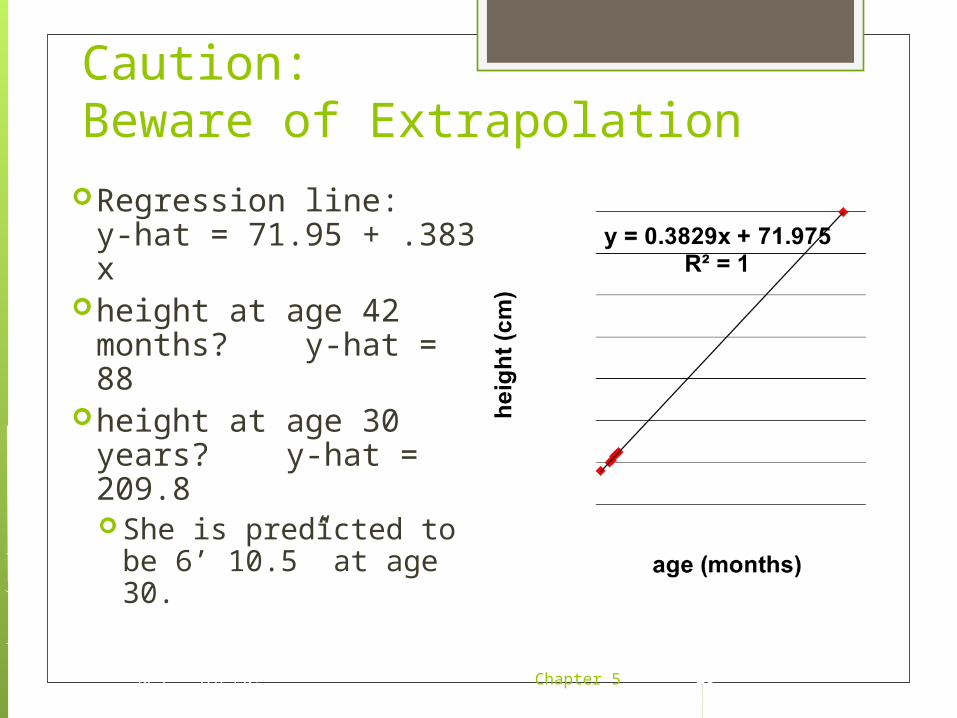
Caution:Beware of Extrapolation
Regression line:y-hat = 71.95 + .383 x
height at age 42 months? y-hat = 88
height at age 30 years? y-hat = 209.8 She is predicted to be
6’ 10.5” at age 30.
BPS - 5th Ed. Chapter 5 20
Meditation and Aging (Noetic Sciences Review, Summer 1993, p. 28)
Explanatory variable: observed meditation practice (yes/no)
Response: level of age-related enzyme
BPS - 5th Ed.
Chapter 5
21
general concern for one’s well being may also be affecting the response (and the decision to try meditation)
Caution:Beware of Lurking Variables
Even very strong correlations may not correspond to a real causal relationship (changes in x
actually causing changes in y).(correlation may be explained by a
lurking variable)
BPS - 5th Ed.
Chapter 5
22
Caution:Correlation Does Not Imply Causation
Does lack of social relationships cause people to become ill? (there was a strong correlation)
Or, are unhealthy people less likely to establish and maintain social relationships? (reversed relationship)
Or, is there some other factor that predisposes people both to have lower social activity and become ill?
BPS - 5th Ed.
Chapter 5
23
House, J., Landis, K., and Umberson, D. “Social Relationships and Health,” Science, Vol. 241 (1988), pp 540-545.
Social Relationships and Health
Caution:Correlation Does Not Imply Causation
Evidence of Causation A properly conducted experiment
establishes the connection (chapter 9)
Other considerations: The association is strong The association is consistent
The connection happens in repeated trials The connection happens under varying conditions
Higher doses are associated with stronger responses
Alleged cause precedes the effect in time Alleged cause is plausible (reasonable explanation)
BPS - 5th Ed.
Chapter 5
24
Variable Association For each of the following studies, determine if you
believe the association would be positive, negative, or none.
Then decide if the relationship would most likely be (a) causation, (b) common response, or (c) confounding.
Causation Common Response Confounding
If it is common response, identify lurking variable(s) affecting both.
If it is confounding, identify the lurking variable(s) affecting the response variable.
BPS - 5th Ed.
Chapter 5
25

What’s happening? The amount of recycle bins in the school
and the amount of trash collected (in pounds).
The quantity of Chromebooks distributed and the amount of textbooks purchased.
The amount of money in your bank account and the number of years working.
Days spent practicing by the soccer team and the number of wins.
The amount of money spent on car repairs and the age of the car.
BPS - 5th Ed.
Chapter 5
26