Embed Size (px)
Citation preview
Chapter 5: Joint Probability
Distributions
Outline – Jointly Distributed
Random Variables
Outline – Expected values,
covariance and correlation
Outline – Statistics and their
distributions
Outline – Distribution of the
Sample Mean
Outline – The Distribution of
Linear Combinations
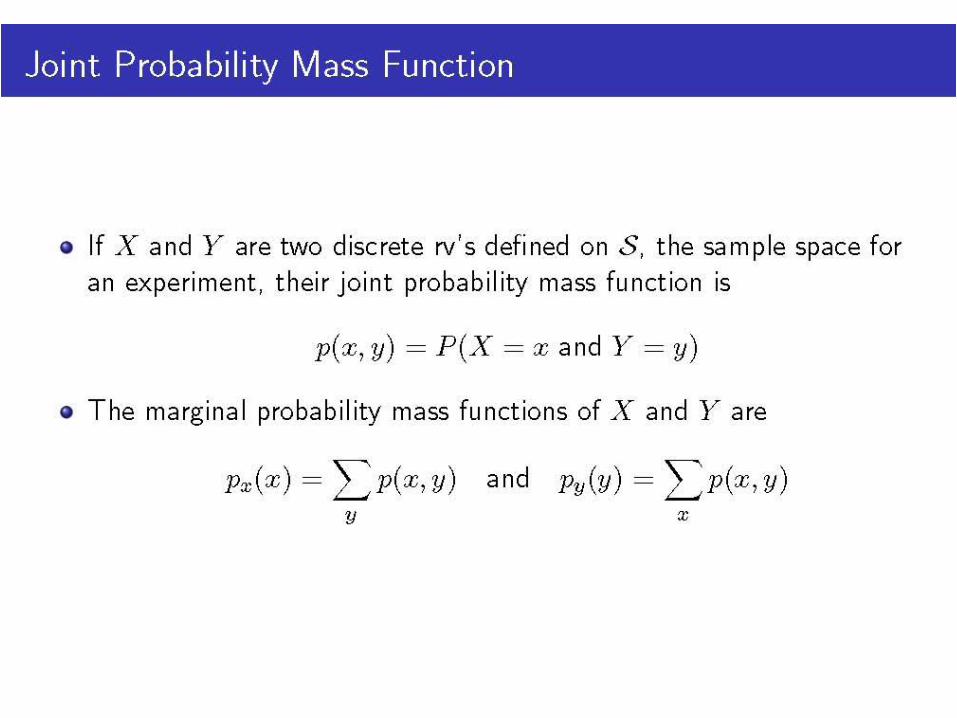
Joint Probability Mass Function
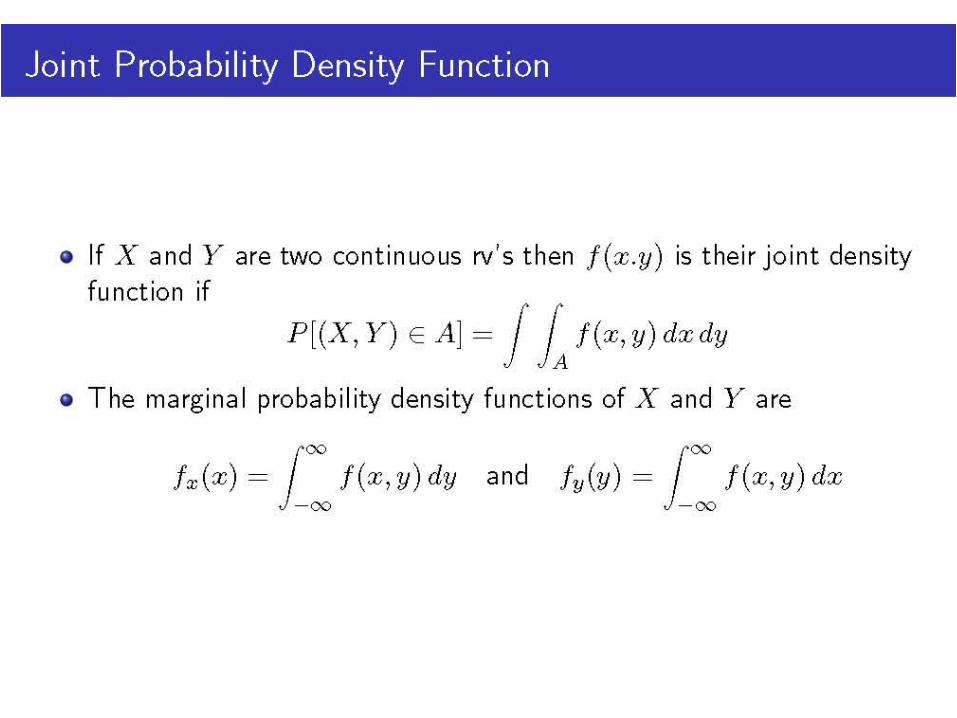
Joint Probability Density
Function
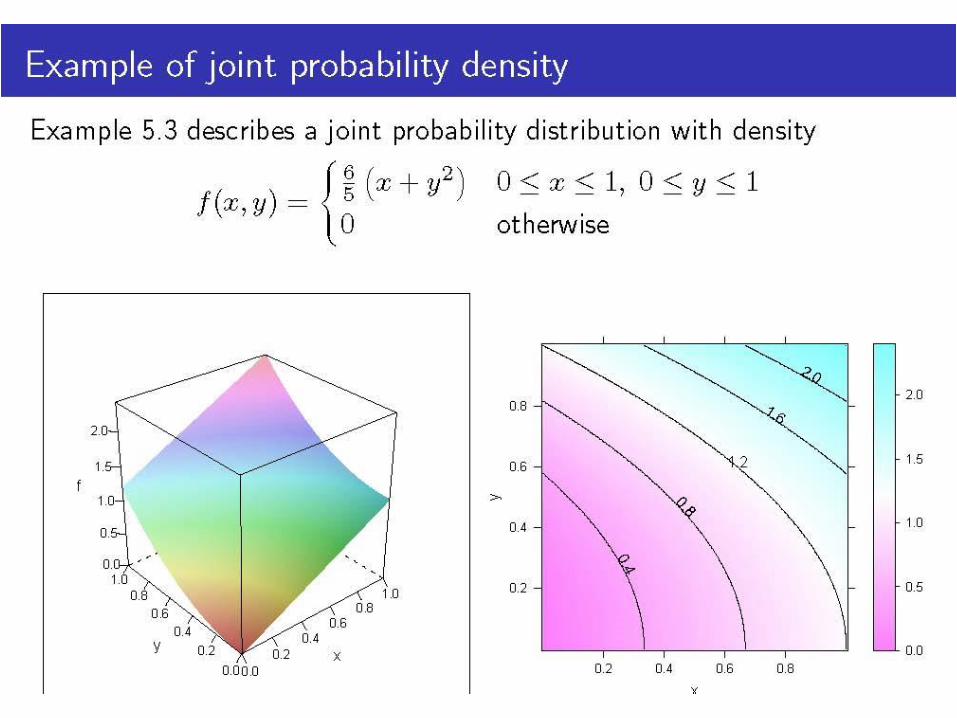
Example of joint probability
density
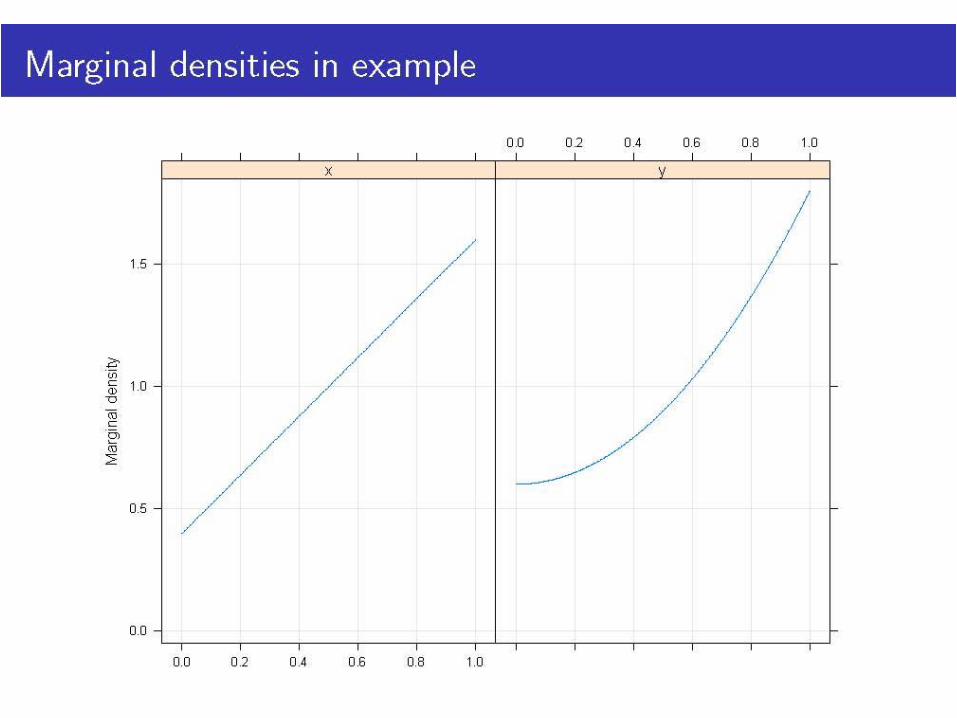
Marginal densities in example
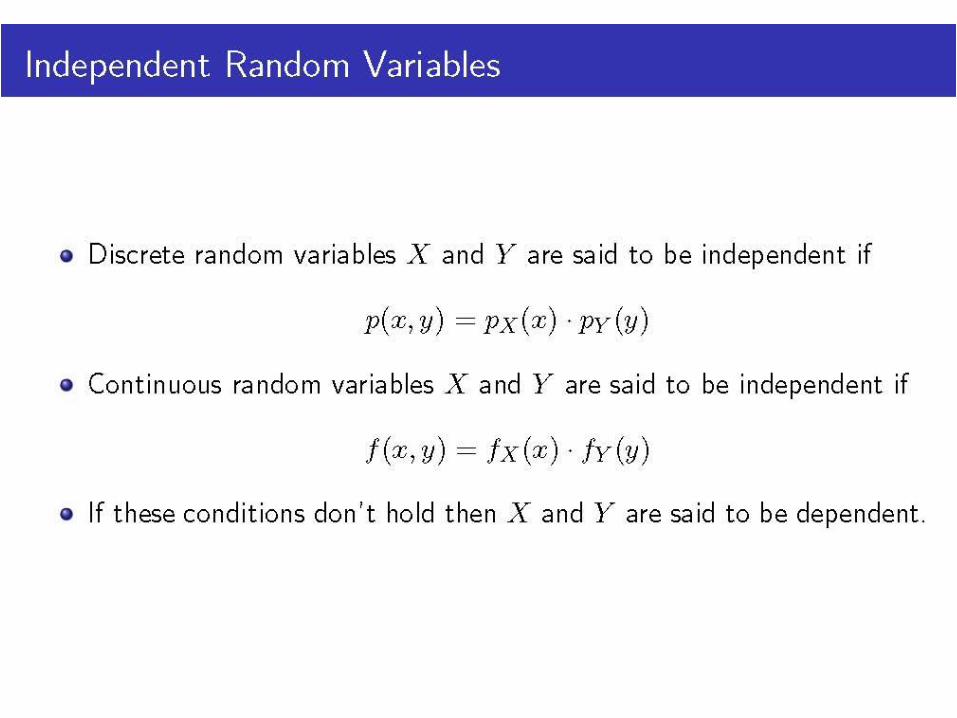
Independent Random Variables
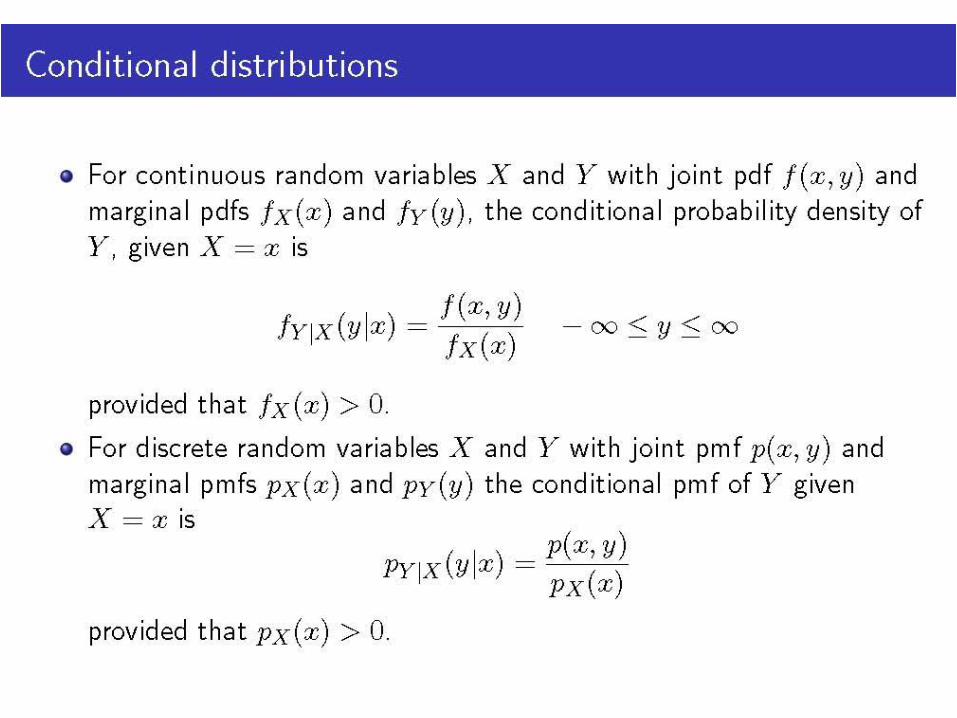
Conditional distributions
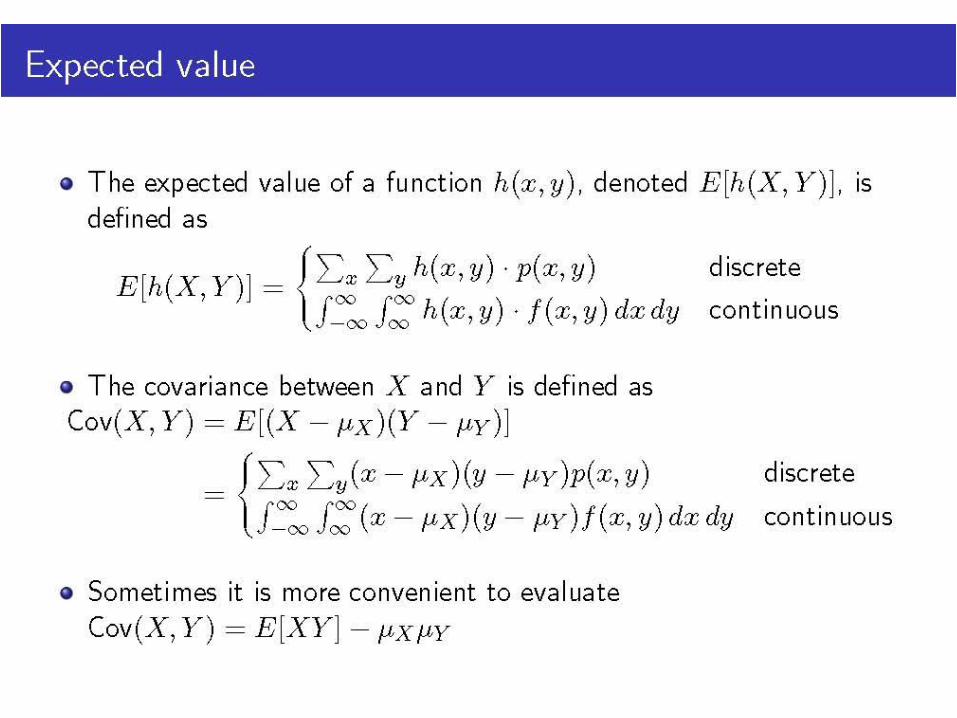
Expected value
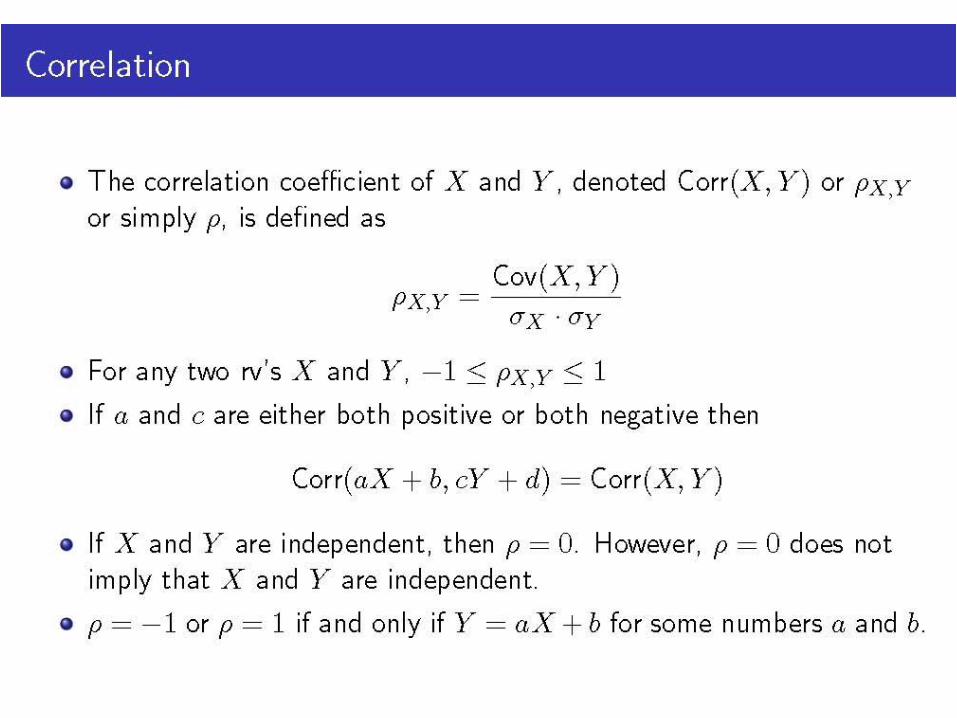
Correlation
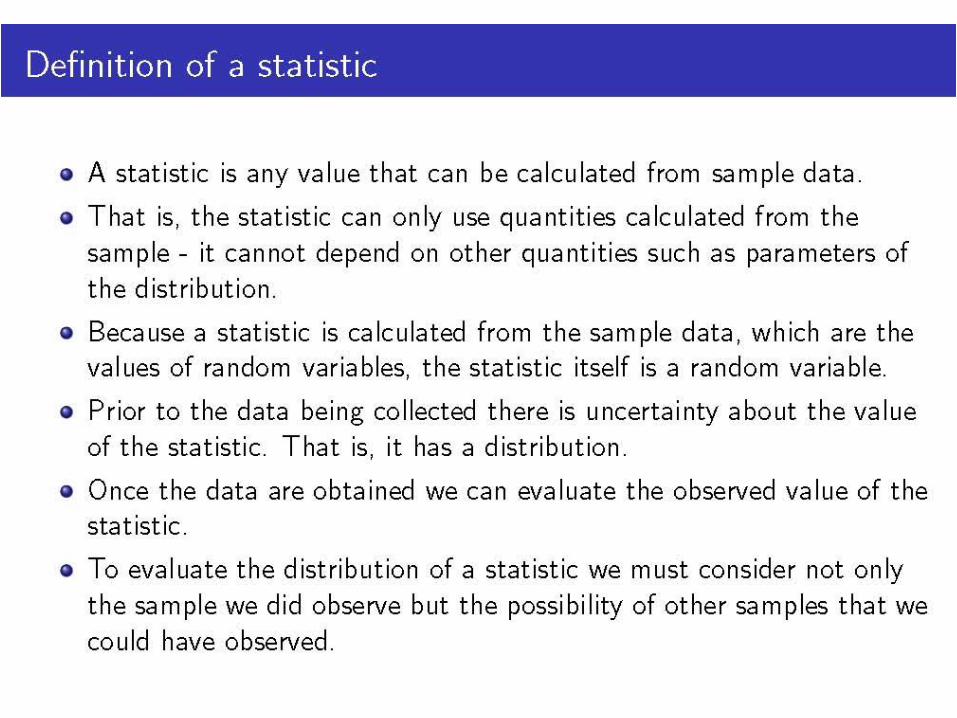
Definition of a statistic
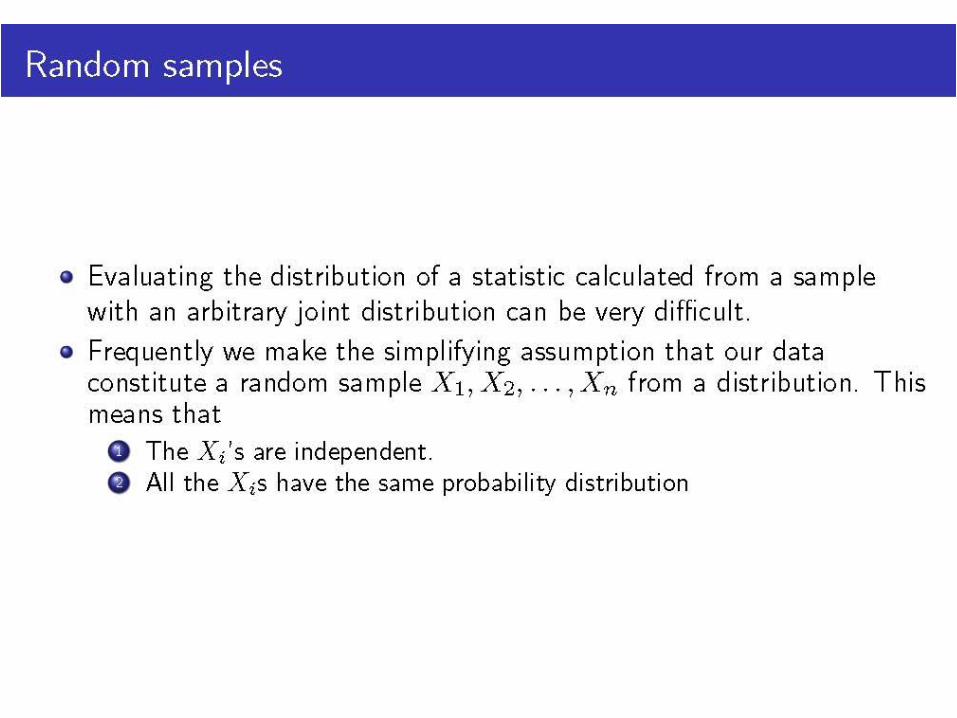
Random samples
Simulation experiments
Steps in a simulation experiment
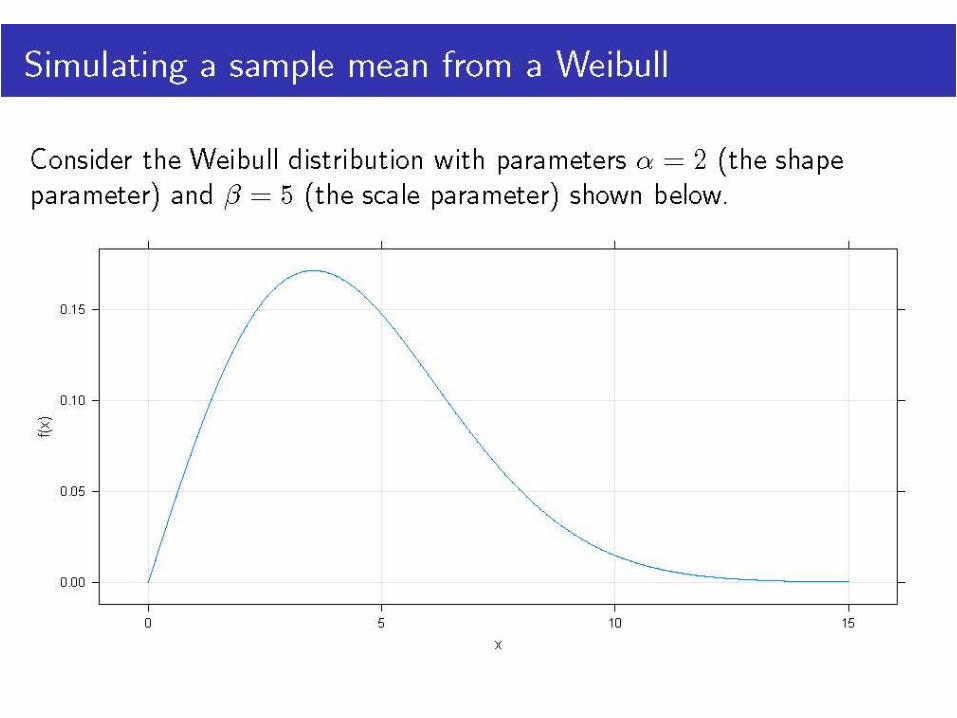
Simulating a sample mean from a
Weibull
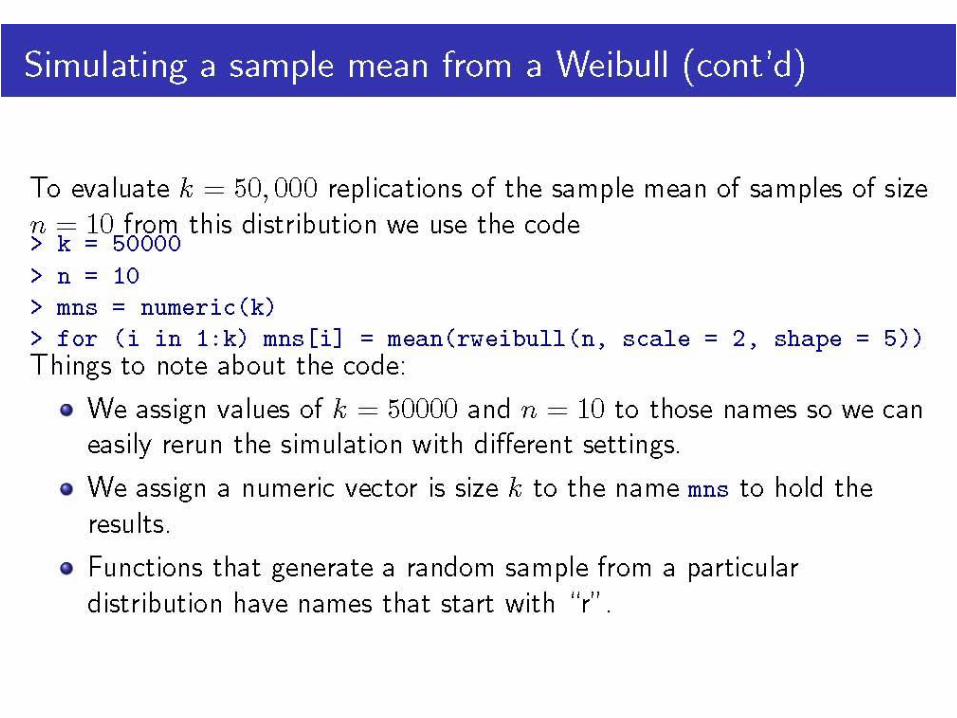
Simulating a sample mean from a
Weibull (cont’d)
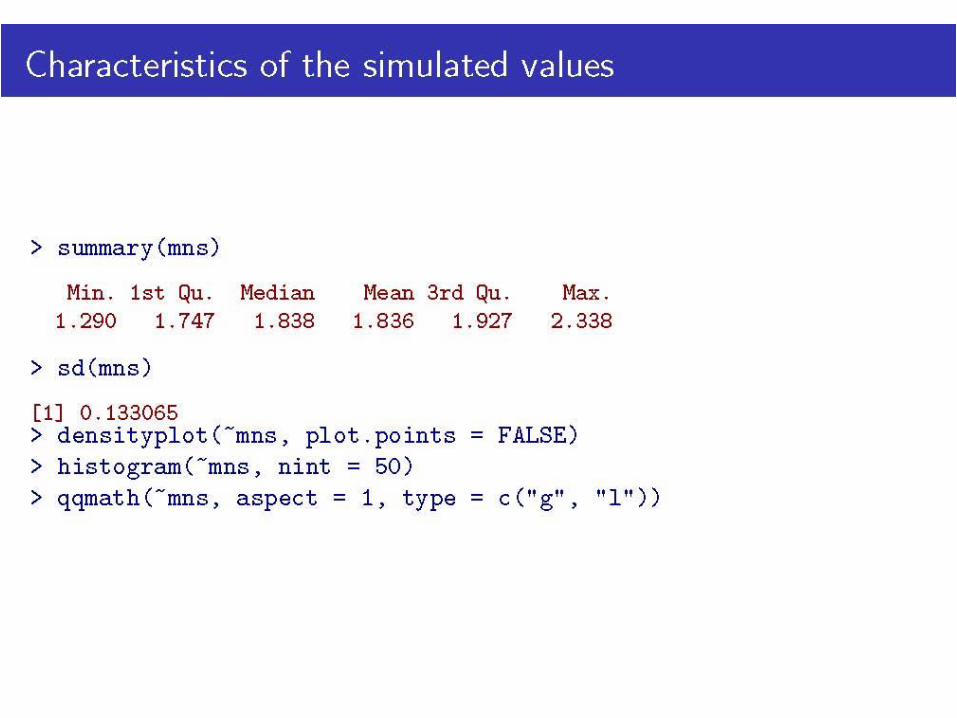
Characteristics of the simulated
values
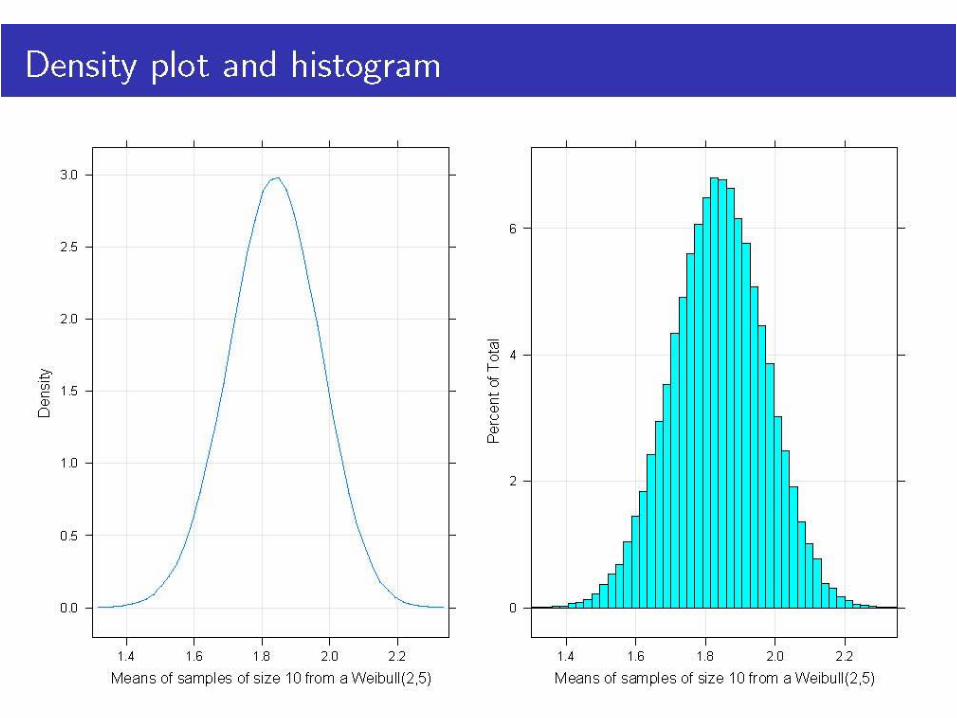
Density plot and histogram
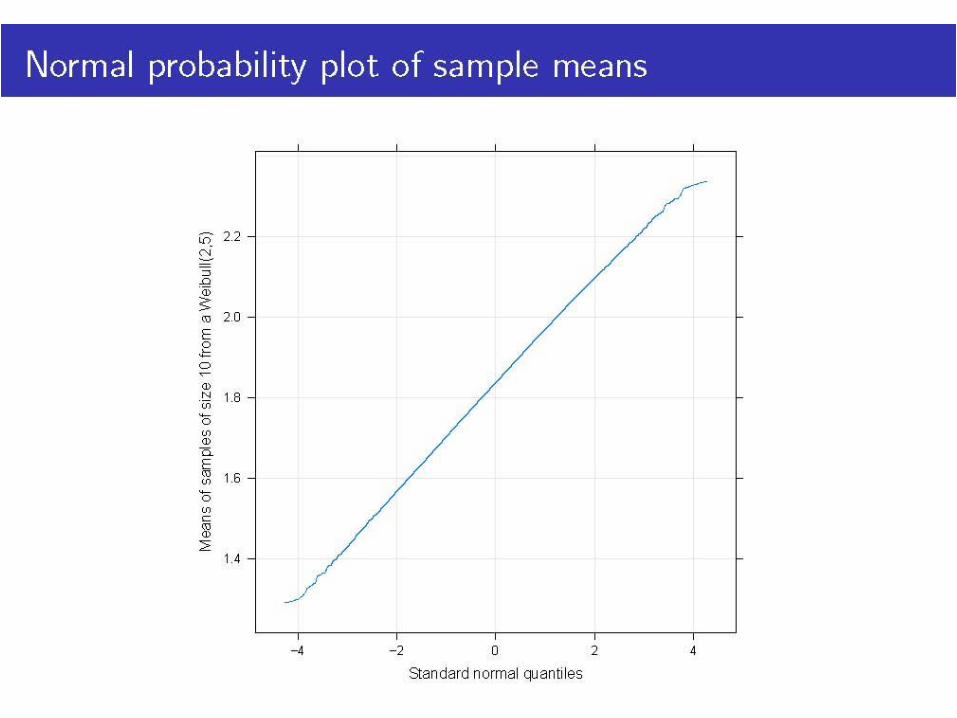
Normal probability plot of
sample means
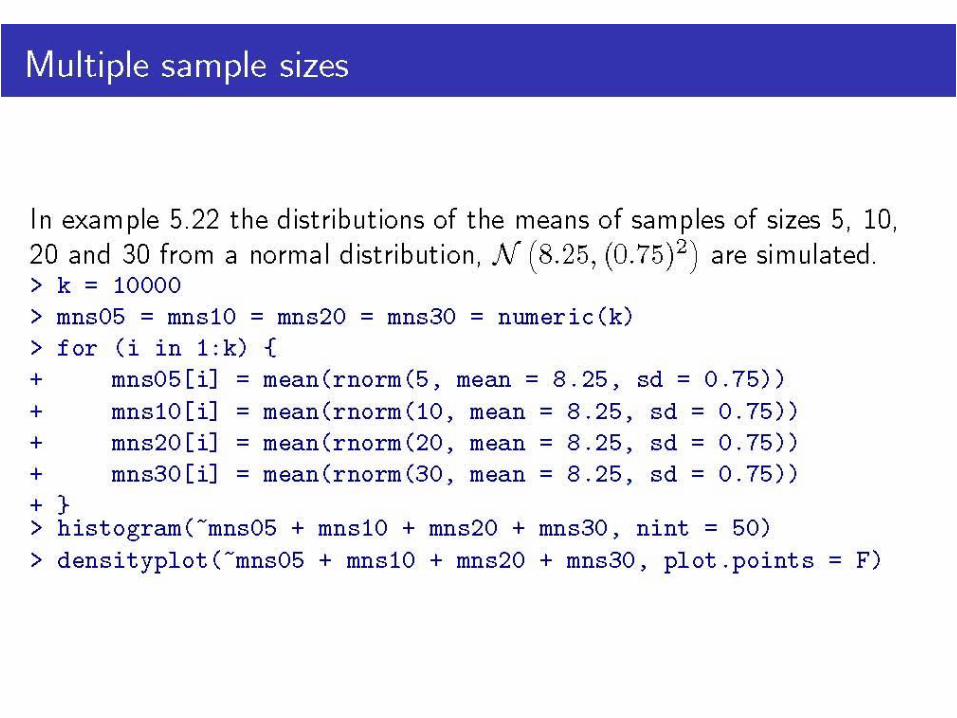
Multiple sample sizes
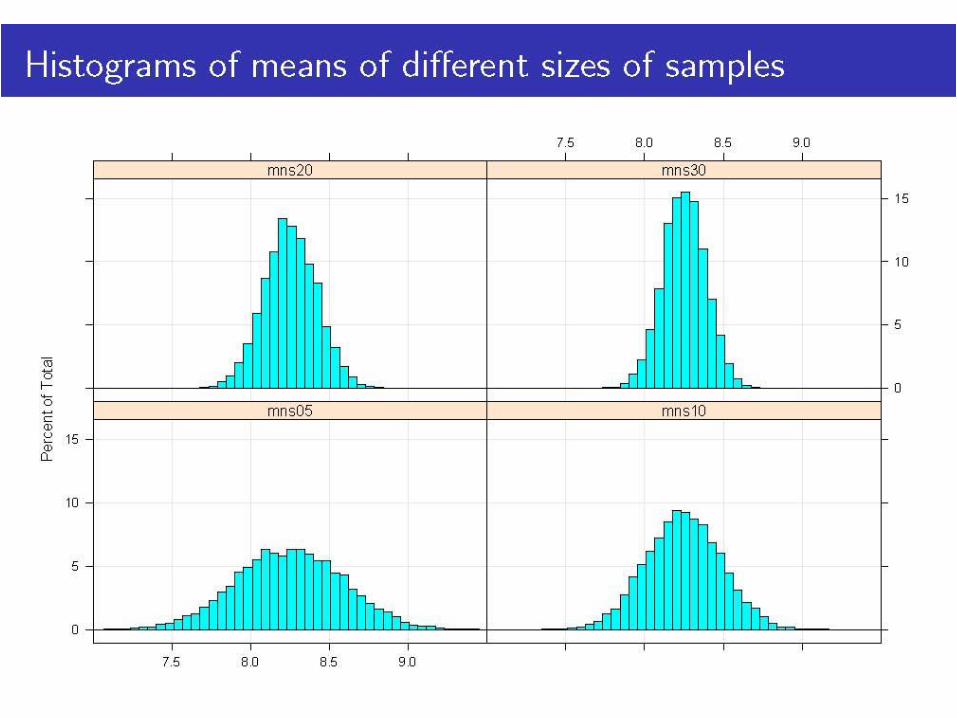
Histograms of means of different
sizes of samples
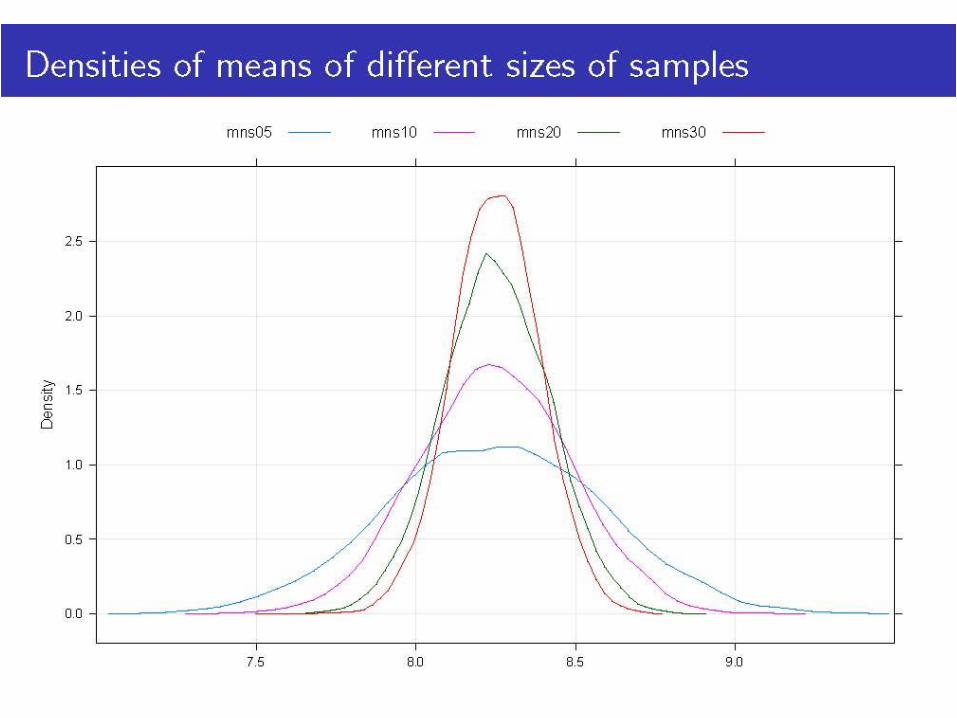
Densities of means of different
sizes of samples
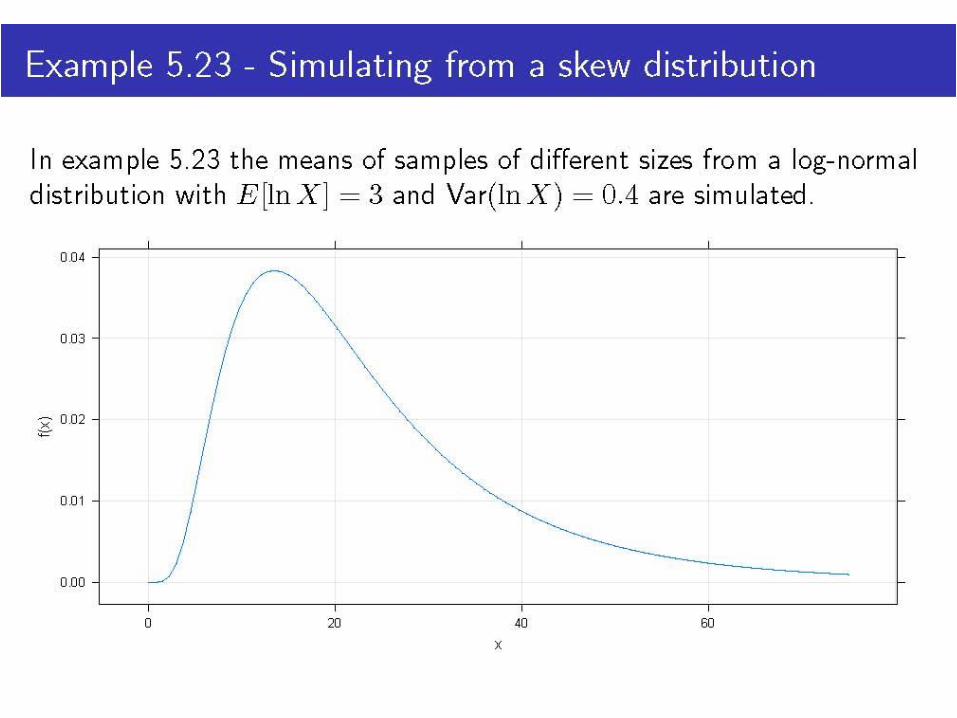
Example 5.23 – Simulating from
a skew distribution
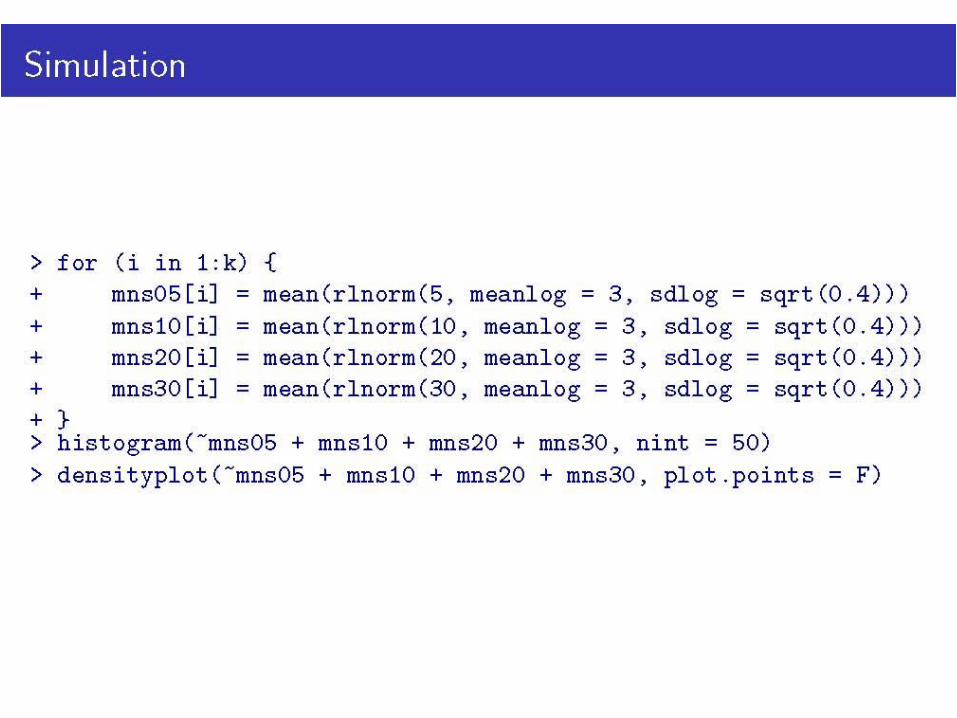
Simulation
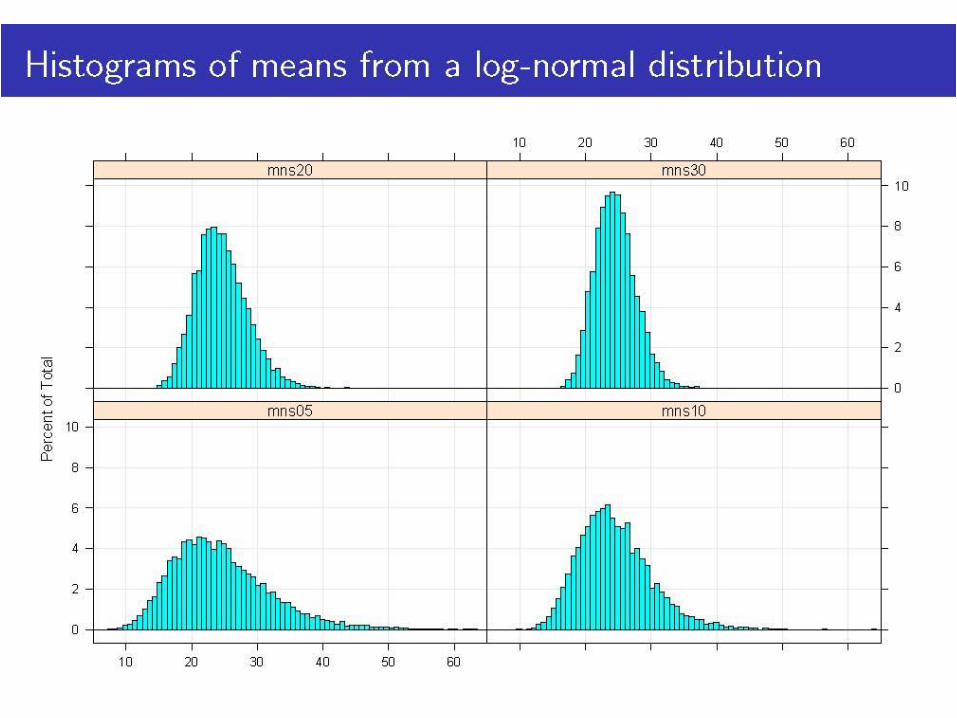
Histograms of means from a log-
normal distribution
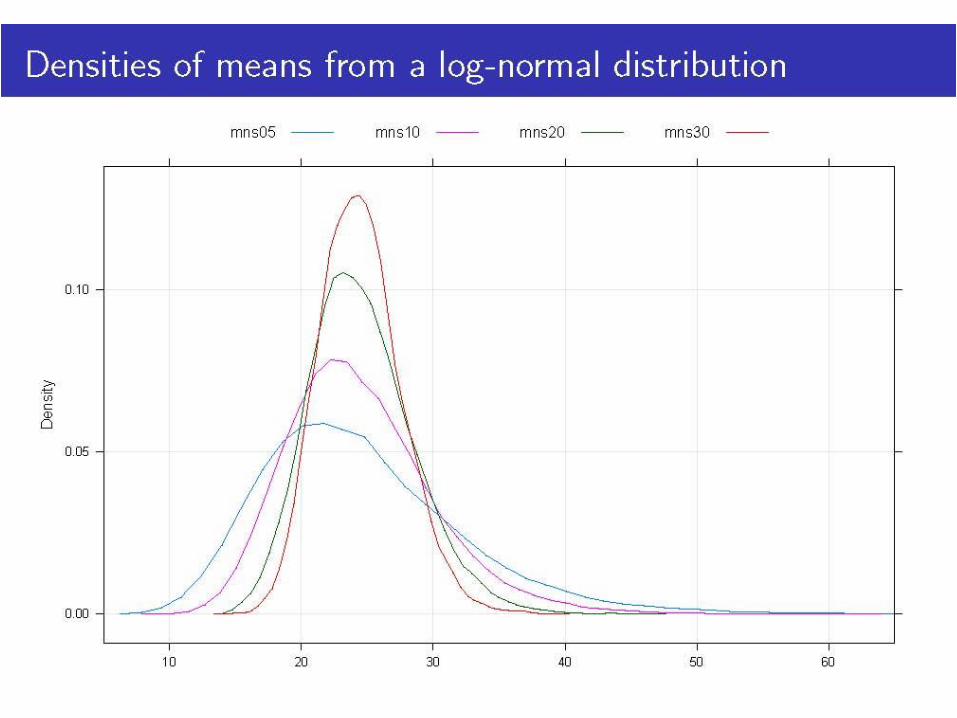
Densities of means from a log-
normal distribution
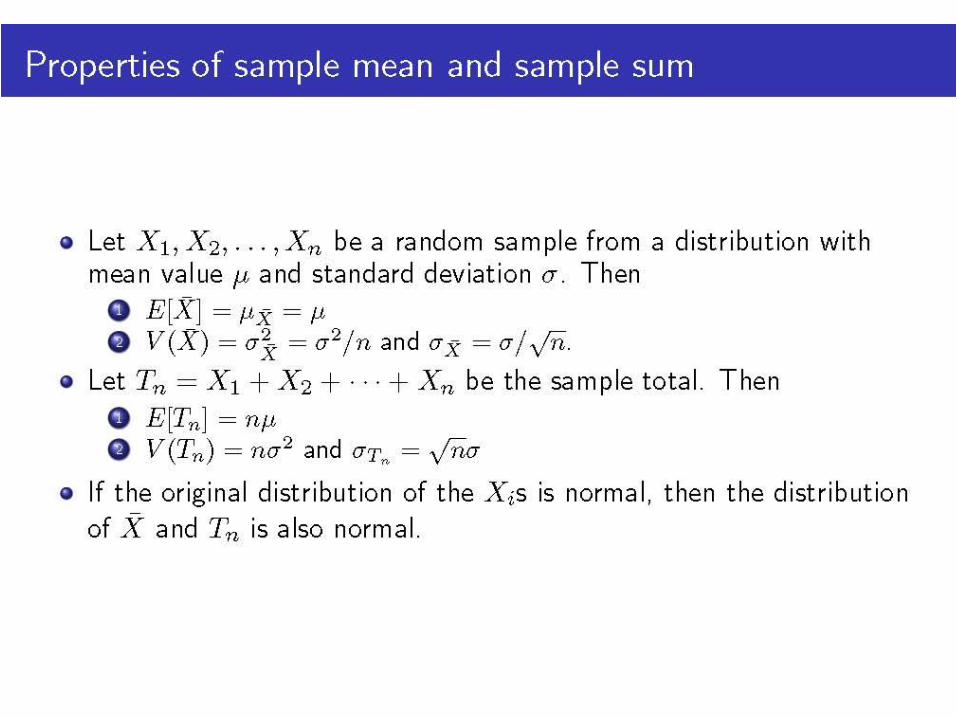
Properties of sample mean and
sample sum
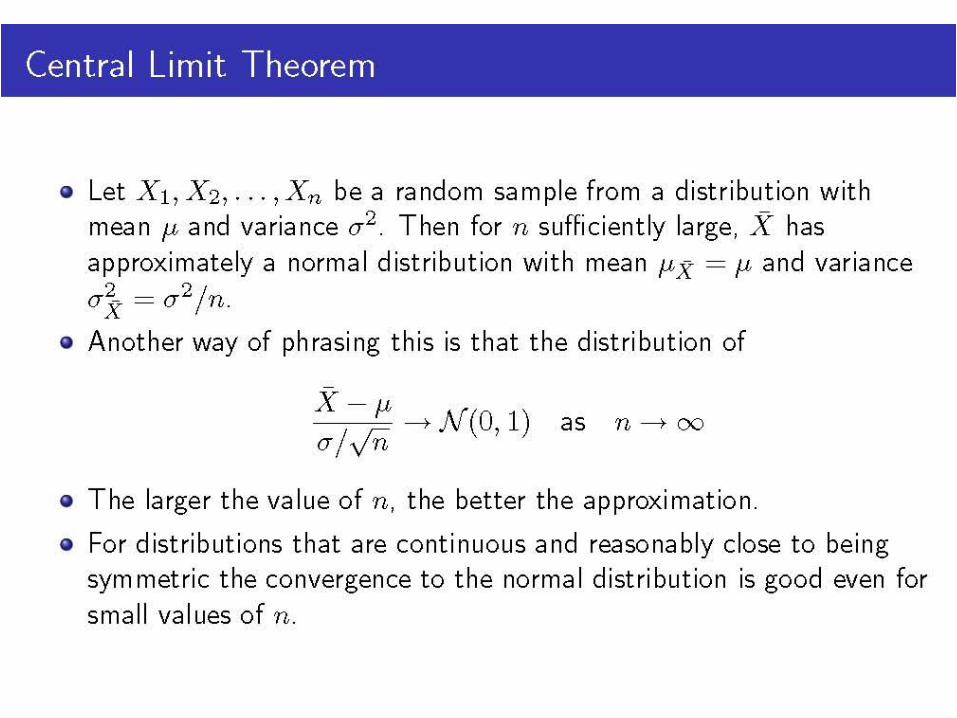
Central Limit Theorem
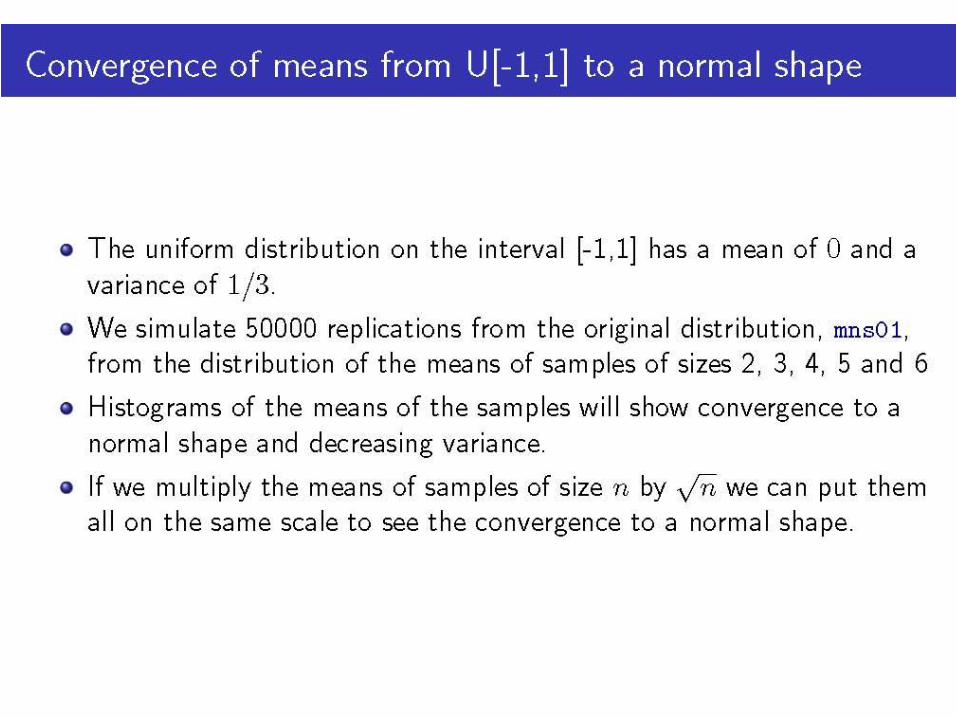
Convergence of means from U[-
1,1] to a normal shape
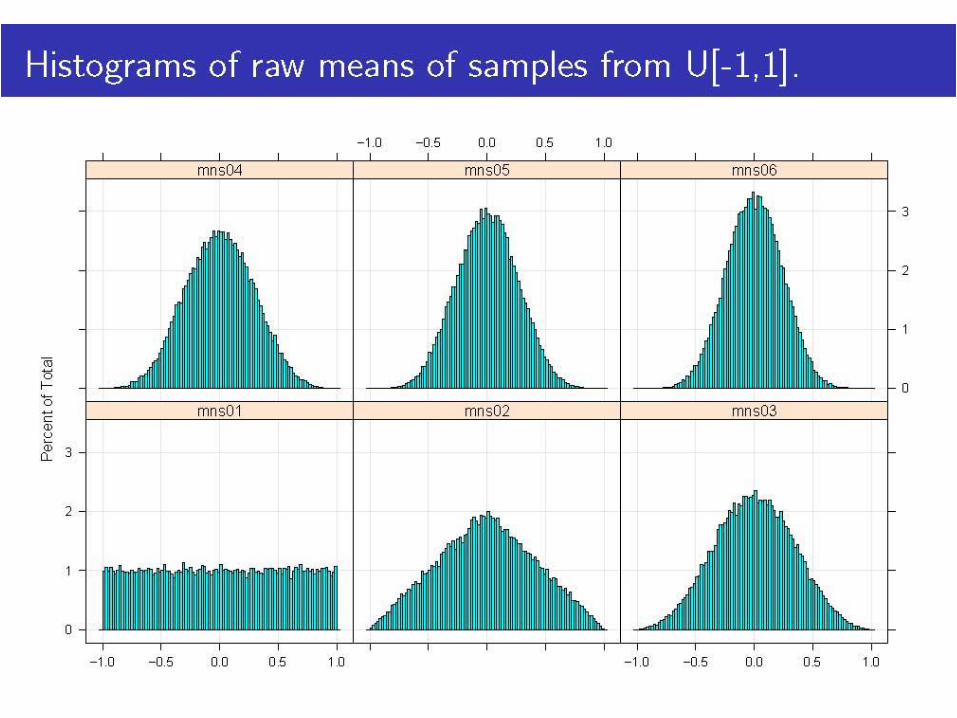
Histograms of raw means of
samples from U[-1,1].
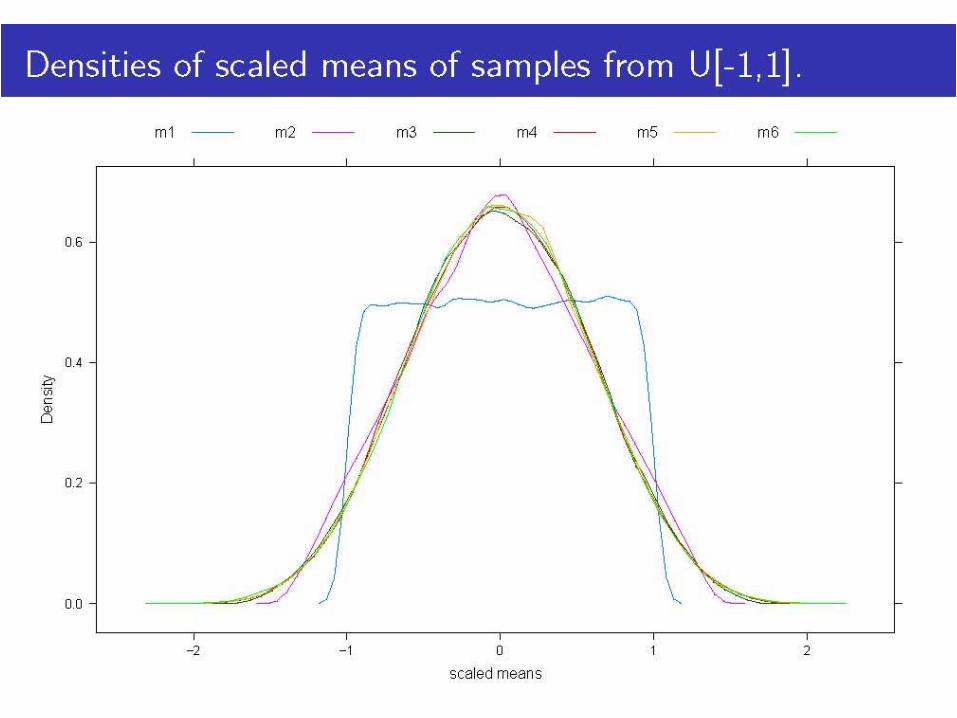
Densities of scaled means of
samples from U[-1,1].
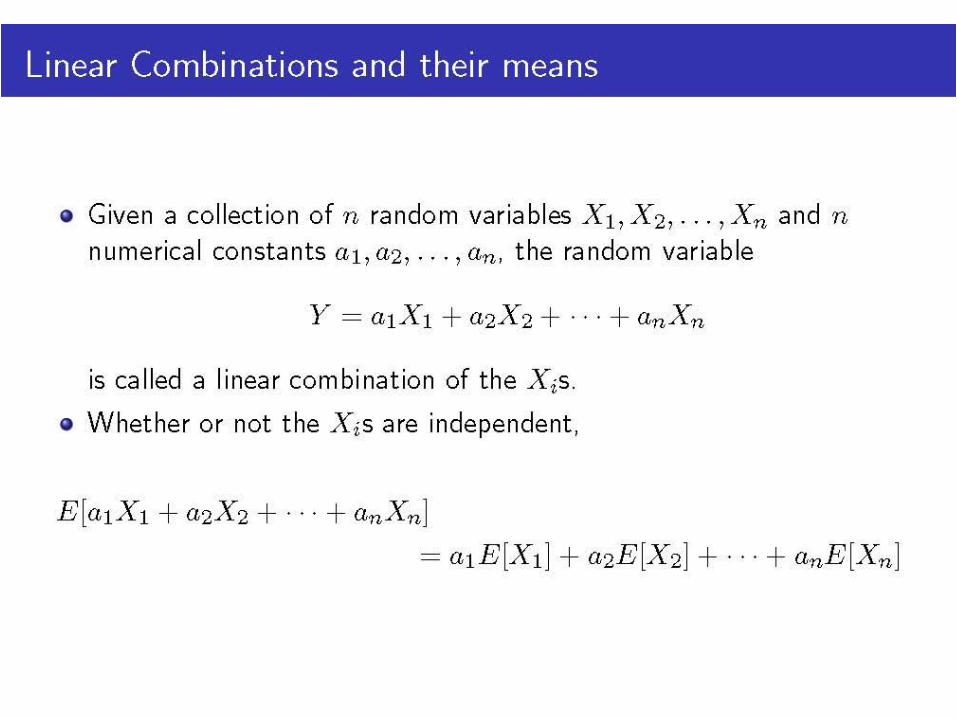
Linear Combinations and their
means
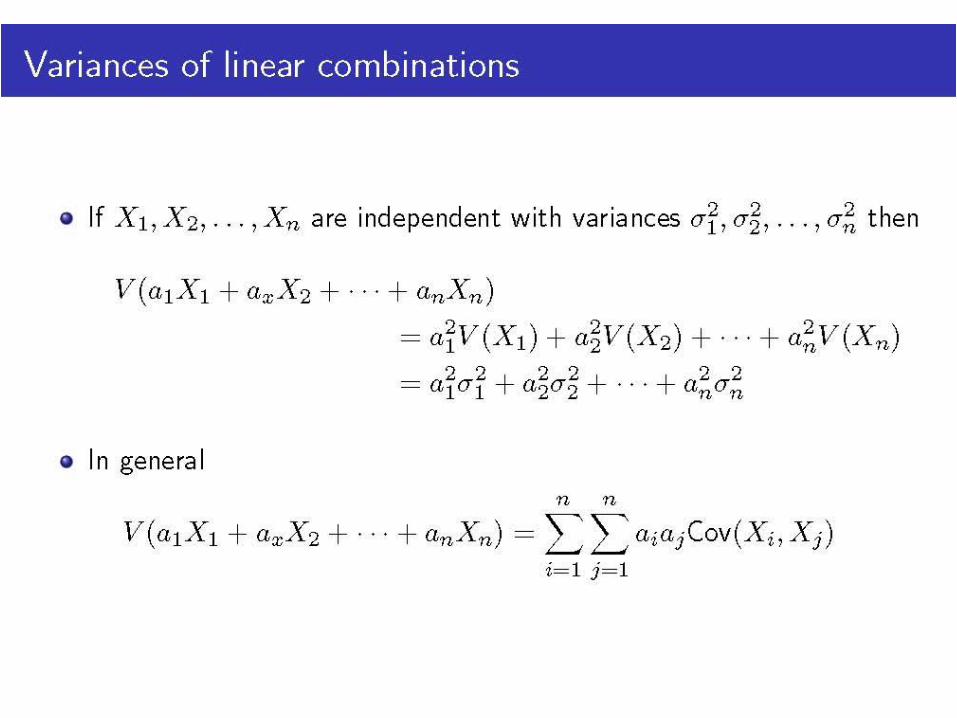
Variances of linear combinations
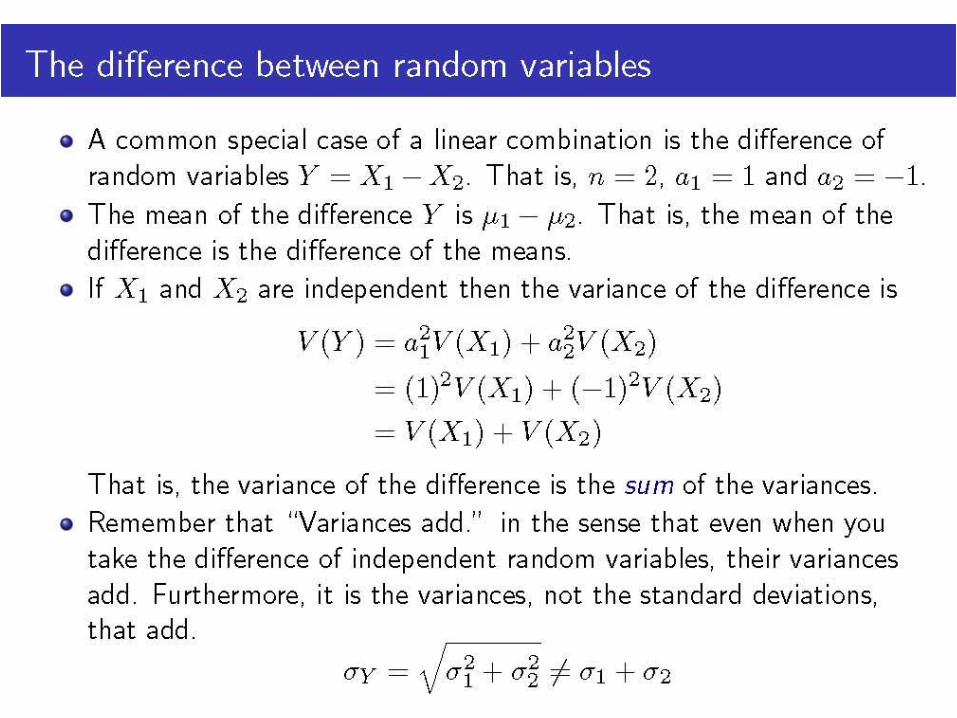
The difference between random
variables
The Case of Normal Random
Variables