Embed Size (px)
Citation preview

Chapter 5From Gene Expression to DiseasePhenotypes: Network-Based Approachesto Study Complex Human Diseases
Quanwei Zhang, Wen Zhang, Rubén Nogales-Cadenas,Jhin-Rong Lin, Ying Cai and Zhengdong D. Zhang
Abstract Gene expression is a fundamental biological process under tightregulation at all levels in normal cells. Its dysregulation can cause abnormal cellbehaviors and result in diseases, and thus gene expression profiling and analysishave been widely used to provide the first clue about the molecular mechanisms ofhuman diseases. Because genes and their products interact with and regulate oneanother, it is essential to analyze gene expression data and understand the geneticsof disease in a biological network context. In this chapter, we first introduce thestate-of-the-art gene expression analysis (GEA) with network integration and thejoint analysis of mRNA and miRNA expression to understand disease regulatorymechanisms and then discuss how disease genes are predicted by incorporatingknowledge of gene regulation and characterized in biological networks.
Keywords Gene expression � Disease phenotypes � Biological networks
5.1 Introduction
In the central dogma of biology, gene expression is the intermediate, critical step atwhich genetic information flows from DNA to functional gene products such asproteins and noncoding RNAs through RNA transcription and translation in eachcell. It is the key step where various types of gene regulation—including DNAmodification, transcriptional regulation, and posttranscriptional modification—takeplace. Gene regulation receives and spreads signals in the form of gene regulatorynetworks (GRNs), in which a group of genes interact with each other and controlcertain cell functions. Dysregulated gene expression in the network due to promoter
Q. Zhang � W. Zhang � R. Nogales-Cadenas � J.-R. Lin � Y. Cai � Z.D. Zhang (&)Department of Genetics, Albert Einstein College of Medicine, Michael F. Price Centerfor Genetic and Translational Medicine, 1301 Morris Park Avenue, Bronx, NY 10461, USAe-mail: [email protected]
© Springer Science+Business Media Dordrecht 2016J. Wu, Transcriptomics and Gene Regulation,Translational Bioinformatics 9, DOI 10.1007/978-94-017-7450-5_5
115

mis-methylation [1, 2], changed transcription factor levels [3, 4], mutated tran-scriptional regulatory elements (TREs) [5], and miRNA deregulations [6] can resultin abnormal cell behaviors and have all been observed in human diseases.Considered as intermediate phenotypes, mRNA expression profiles have beenanalyzed in biological networks to identify causal genes of human diseases in manystudies [7, 8]. In particular, among gene products, microRNAs (miRNAs) are smallnoncoding RNAs overrepresented in GRNs [9, 10]. Recent studies have revealedtheir striking gene regulatory activities at the posttranscriptional level [11] and theirprofound involvement in human diseases [12].
The prevailing assumption about human diseases is that the disease phenotypesare the outcome of interactions between genes and environment [13]. Linkingdisease phenotypes to genotypes is thus fundamental to understanding humandiseases. Linkage analysis has been effective to study disorders with Mendelianinheritance patterns. To date, over 3000 genes with mutations linked to diseasephenotypes are cataloged in the Online Mendelian Inheritance in Man (OMIM)database [14]. However, in contrast to Mendelian diseases with simple geneticarchitectures, complex diseases are characterized by the multifactorial nature andepistasis, in which the causal effects of many risk genes are obscure and cannot beeffectively detected by traditional approaches [15, 16]. Furthermore, unlikeMendelian disorders where mutations usually occur within protein coding regions,the majority of mutations of complex diseases occur in noncoding regions asso-ciated with gene expression regulation [17, 18]. Deciphering the relationshipbetween genotypes and phenotypes for complex diseases thus requires incorpo-rating the knowledge of gene expression regulation.
Over the last decade, the Encyclopedia of DNA Elements (ENCODE)Consortium has been exploring the functional elements in the human genome andhas generated comprehensive data for gene regulation such as transcription factorbinding sites and gene–locus interactions [19]. This knowledge provides importantbasis for analyzing genetic factors of complex diseases. On the other hand, newlydeveloped high-throughput technologies can generate genomic data with anincreasingly large sample size and will certainly improve the statistical power todetect subtle associations in complex diseases. This shift has made it possible totackle the challenges of deciphering complex diseases. With the abundance ofgenomic data and knowledge of gene regulation, nevertheless, new approaches areneeded to integrate genomic data and knowledge of gene regulation to connectgenotypes and phenotypes of complex diseases.
Most proteins exert their functions through interactions with other proteins. Suchinter- and intracellular interconnectivity implies that the impact of a specific geneticvariation is not restricted to the activity of the gene product that carries it, but canspread along the links of the network and alter the activity of other related geneproducts that otherwise carry no changes. Therefore, an understanding ofgene/protein network context is essential to understand the genetics of disease. Withthe advent of next-generation sequencing, the throughput and the resolution of geneexpression profiling have both been increased to an unprecedented level. In additionto traditional methods of gene expression analysis (GEA), network-based
116 Q. Zhang et al.

approaches to GEA have also been developed [20–23]. Incorporation of networkinformation into the estimation procedure of the regression model not onlyencourages smoothness in the estimate of contributions of candidate genes but alsointegrates into its calculation a priori biological information from the network,which is ignored in conventional methods. A network-based method for gene setenrichment analysis has been developed. Combining a graph-based statistic with aninteractive sub-network visualization, EnrichNet takes into account the networkstructure of physical interactions between the gene sets of interest and improves theprioritization of putative gene set associations as well as exploits information frommolecular interaction networks and gene expression data [24]. NetworkAnalyst,another software tool, can perform network analysis and visualization given a genelist. It can also consider multiple meta-data parameters to perform a meta-analysisof multiple gene expression datasets [25].
Not only can disease genes be identified with network-integrated methods, butalso they can be studied as a whole in the context of biological networks. Mostbiological networks are scale-free networks whose degree distribution follows apower law: P X ¼ xð Þ ¼ x�a, in which x is the node degree and a is a constant. In ascale-free network, a small number of nodes tend to have higher degree (such nodesare called hubs), while a large number of nodes have low degrees. Generally, wecan divide commonly used network characteristics into different levels. On the gene(protein) level, degree, closeness centrality, and betweenness centrality are oftenused. They measure, respectively, the number of its interactions, its centeredness inthe network, and its importance in communication between genes. On the neigh-borhood level, clustering coefficient is widely used to measure the probability thatthe neighbors of a node are connected with one another. On the gene pairs level,one of the most used characteristics is the shortest path between two nodes. Studiesof the network characteristics of a group of related disease genes can provide usinsights into the molecular mechanisms of the disease.
5.2 Gene Expression Analysis with Network Integration
Gene expression analysis (GEA) has been widely used in human disease studies.High-throughput technologies to profile gene expression include DNA microarrays,serial analysis of gene expression, quantitative RT-PCT, differential-displayRT-PCR, and parallel signature sequencing [26]. Network-based GEA is an effi-cient way to analyze gene expression data because it takes advantage of thefunctional relationship among genes or their products.
Networks are particularly valuable for modeling large-scale biological systemsand have been used with increasing frequency to analyze such complex systems.Graph theory provides useful mathematical tools for general network analysis [27],which can be easily adapted to study genes and pathways. Here, we introduce aclass of regression methods with network integration, focusing on the differencebetween their approaches and applications. We first introduce linear regression with
5 From Gene Expression to Disease Phenotypes … 117

network regularization. We then present a network-regularized logistic regressionmethod. We next describe a network-regularized Cox model. And finally, wesummarize the application results.
5.2.1 Linear Regression Methods with NetworkRegularization
One issue in GEA is the high dimensionality of the transcriptomic data, e.g., thenumber of covariates (genes) is much larger than that of observations (samples)[28]. Providing a straightforward mathematical framework for variation indications,linear models have been widely used in data analysis [28]. The biological networkcan be described as a graph by its adjacency or Laplacian matrix and providescrucial and complementary biological information to gene expression data. A novellinear regression method governed by Laplacian network-deduced matrix has beenproposed to identify molecular pathways from gene expression data [20]. In thismethod, a network-constrained penalty function is used to penalize the L1-norm ofregression coefficients [20]. The method is in essence a mathematical programmingproblem whose solution criterion is h ¼ argminhC h; k; að Þ, in which h is theestimated contribution coefficient of each gene, C h; k; að Þ is thenetwork-constrained regularization criterion defined in [20], k and a are the twoparameters to be defined through a leave-one-out cross-validation (CV) process.
5.2.2 Network-Regularized Logistic Regression Method
For classification problems with gene expression data, Logit-Lapnet was put for-ward to identify molecular pathways associated with breast cancer [21]. It is aregression method combining logistic models and network regularization with thegraphical Laplacian matrix. The data matrix is derived from gene expression pro-files. The L1-normed regularization and the corresponding extensions, elastic netand fused lasso, have been used to identify molecular pathways. Extending theprevious similar approaches, the Logit-Lapnet method incorporates a priori func-tional information contained in biological networks. We can consider Logit-Lapnetin a simple way, i.e., as a logistic regression method regularized by lasso andnetwork two items. Its model estimation is formulated as a convex optimizationproblem, guaranteeing the identifiability of an optimal solution (Fig. 5.1). Theoptimization criteria, L k; a; bð Þ, contains the generalized L2-norm penalty termusing the Laplacian graphical matrix, which encourages smoothness on contributioncoefficients (see [21] for a quantitative description of the grouping effect onLogit-Lapnet concerning the structure of network).
118 Q. Zhang et al.

5.2.3 Network-Regularized Cox Model and Its Application
For survival analysis of gene expression data, a Cox proportional hazard modelwith network regularization was used to select connected network modules pre-dictive of survival of breast cancer patients [29]. Its optimization criterion to esti-mate gene contribution is a modified likelihood function of the Cox model:
hðt; xjÞ ¼ h0ðtÞexTj b, in which h0ðtÞ is the baseline hazard function at time t, xj thevector of biomarkers for genes, and b the gene coefficient vector. The estimation isdefined as b ¼ argminbC k; a; bð Þ, in which C k; a; bð Þ contains the negative loglikelihood function with L1 + L2 norm and network regularizations on the coeffi-cient vector. The new Cox model showed better performance in simulation thanconventional Cox models and was much more sensitive to cancer-related genes andnetwork modules. Genes identified by the new Cox model have clear biologicalfunctions involving cancer cell apoptosis and cell cycle.
5.2.4 Application Results
Performance assessment by simulation demonstrated that Logit-Lapnet outperformselastic net and lasso, two alternative methods (Fig. 5.2) [21]. Application ofnetwork-regularized linear regression methods to glioblastoma gene expression data
Fig. 5.1 Logit-Lapnet optimization criteria
5 From Gene Expression to Disease Phenotypes … 119
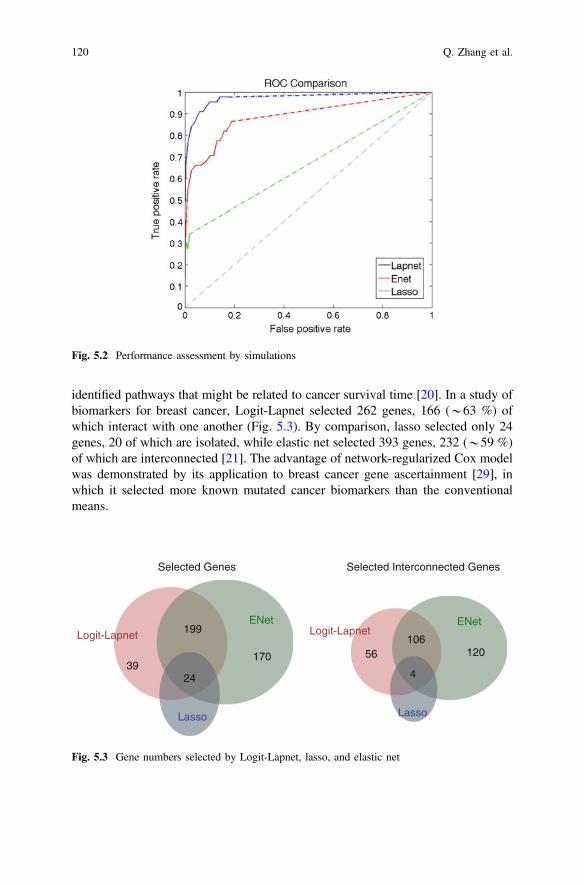
identified pathways that might be related to cancer survival time [20]. In a study ofbiomarkers for breast cancer, Logit-Lapnet selected 262 genes, 166 (*63 %) ofwhich interact with one another (Fig. 5.3). By comparison, lasso selected only 24genes, 20 of which are isolated, while elastic net selected 393 genes, 232 (*59 %)of which are interconnected [21]. The advantage of network-regularized Cox modelwas demonstrated by its application to breast cancer gene ascertainment [29], inwhich it selected more known mutated cancer biomarkers than the conventionalmeans.
Fig. 5.2 Performance assessment by simulations
Selected Genes
199 ENet
170
Lasso
24
Logit-Lapnet
39
Selected Interconnected Genes
106
ENet
120
Lasso
4
Logit-Lapnet
56
Fig. 5.3 Gene numbers selected by Logit-Lapnet, lasso, and elastic net
120 Q. Zhang et al.

5.3 Analyzing Expression of mRNAs and miRNAsto Understand Disease Regulatory Mechanisms
Microarray- and sequencing-based gene expression profiling has been widely usedto investigate complex diseases including cancer. Recent studies have discoveredgene signatures of numerous diseases and biomarkers for prognosis prediction anddisease sub-type classification. For example, Wang et al. [30] and van’t Veer et al.[31], respectively, identified *70 genes that predict breast cancer metastasis risk.Parker et al. [32] proposed a 50-gene PAM50 model, commonly used for breastcancer classification. These markers include genes that control cell cycle, prolif-eration, DNA replication, and repair, many of which are differentially expresseddue to genomic mutations affecting transcriptional regulation.
Testing for differentially expressed genes can yield up to thousands of candidategenes, and one common way to study their functions is to analyze their enrichmentin biological pathways. Because the experimentally validated canonical pathways(such as KEGG pathways) are largely incomplete [33], functional interpretation ofthe candidate genes based on them can be misleading. A less biased approach isbased on biological networks, especially those derived from high-throughput data.It can reveal interactions among genes or gene products beyond pathways and hasbeen shown to outperform methods for breast cancer metastasis prediction based ondifferential expression analysis only [34]. Co-expression networks and GRNs aretwo representative biological networks widely used to interpret mRNA expressiondata in disease phenotypes (Fig. 5.4). They are often constructed or inferred foreach individual experiment and hence reveal cell type or conditional specificknowledge. In addition, many tools for network-based analysis and visualizationhave been developed, including GeneMANIA [35] and Cytoscape [36].
Among gene regulatory mechanisms, miRNAs have recently been revealed asone of the most important factors. miRNAs are small noncoding RNA moleculeswhose main function is to silence gene expression, mainly through transcriptionrepression or mRNA degradation. They are known to be key regulators in importantcellular processes such as development [37] and cycle progression [38]. In recentyears, they have gained importance in different aspects of human disease research:as targets of miR mimics [39] or antagomirs [40] to reverse disease progression, asbiomarkers to detect diseases [41, 42], and as drugs to improve the effect of alreadydeveloped treatments [43]. Hence, mRNAs and miRNAs regulatory networksanalyses are complementary, and both have become indispensable in the study ofcomplex human diseases.
5.3.1 Co-expression Network
Co-expression networks aim at finding genes sharing similar expression patternsacross diverse conditions by measuring the correlation of expression between each
5 From Gene Expression to Disease Phenotypes … 121

pair of genes, under the assumption that they function together in tightly connectedbiology processes. The weighted gene co-expression network analysis (WGCNA)[44] is now a popular way to find modules—i.e., groups of genes—as higher-orderexpression patterns and disease signatures. Gene–gene correlations are first quan-tified by Pearson’s correlation coefficient, and modules are then identified using atopological overlap measure algorithm. A composite Z summary statistic indicatesmodule preservation: whether the modules are robust in different conditions andindependent datasets. One can then find contribution made by highly preservedmodules to certain trait by measuring correlation coefficient between moduleeigengene value (the first principal component) and quantitative phenotypes. Hubgenes (i.e., genes with many connections) in such modules are important.The WGCNA has been mostly used in developmental studies, where there are nocontrols and samples are usually arranged in a time course, such as hematopoieticstem cell ontogeny [45] and brain neuron formation [46]. Databases such asGeneMANIA [35] and COXPRESdb [47], which compile assorted datasets, aregood co-expression data sources for query genes of interest.
Fig. 5.4 Gene expression data analysis with gene networks
122 Q. Zhang et al.

5.3.2 Genetic Regulatory Network
Reconstruction of GRNs is an age-old challenge. Various algorithms can achievethis, but no single method shows the optimal performance across all datasets [48].One of the well-established methods is context likelihood of relatedness (CLR), anextension of the relevance network technique based on mutual information(MI) [49]. The approach first scores the MI between each pair of a transcriptionalregulator (TR) and its potential target gene, and then scores the likelihood of theregulation within its network context; those with high values are likely to form aregulatory relationship. Because a TR may regulates its targets in a nonlinear way,mutual information is a better choice than correlation for not requiring linearity orcontinuity of the dependence. In addition, the CLR method can be combined withWGCNA to find TRs in modules [45]. Recently, the DREAM4 in Silico networkchallenge [48] compared over 30 GRN-inference methods for high-throughput data.GENIE3 [50], a random forest-based method, is one of the top-performing meth-ods. It treats GRN inference as a feature selection problem and predicts theexpression of a target gene from the expression of all other genes (input genes)using random forests or extra-trees machine learning approaches. The contributionof an input gene on target gene expression is used to build the putative regulatorylinks. After aggregating links from all genes, the whole GRN is reconstructed fromranked interactions. Databases such as RegulonDB [51] provide experimentallyconfirmed regulatory interactions that can also validate the accuracy of the GRNinference methods.
5.3.3 miRNAs Regulation in Human Disease
Studies have implicated miRNAs in many diverse illnesses such as hepatitis B andC [52, 53], cardiac and heart diseases [54, 55], and even behavior and neuronalsystem diseases such as Tourette’s syndrome [56]. In particular, important is thestudy of miRNAs in cancer research, as they are known to regulate importantprocesses in cancer biology such as angiogenesis [57], apoptosis [58], and celldifferentiation [59]. Here, we describe the common principle of these analyses—theintegration of miRNAs and mRNAs expression, sequence pairwise information,and functional information.
miRNA regulation analysis. miRNAs regulate gene transcriptional activity bytotal or partial matching of nucleotide sequences with targeted mRNAs. Manycomputational algorithms are available to predict miRNA targets based on differentcriteria such as base pairing and target accessibility [60–62]. In general, theirpredictions are considered to be complementary and are usually combined toincrease the overall sensitivity of the prediction [63, 64]. Each method, however,suffers from high false-positive and false-negative rates [65]. This happens even
5 From Gene Expression to Disease Phenotypes … 123

with the inclusion of experimental validated interactions from databases such asmiRWalk [66] or miRecords [67]. Thus, the predicted mRNA–miRNA interactionsshould be considered as working hypotheses, since they do not necessarily fit withthe disease phenotypes. In the study of disease gene regulation, it is advisable tointegrate these predictions not only with differential expression values of mRNAsfrom case and control individuals, but also with miRNAs expression values.
Identification of miRNA regulatory mechanisms. Regulatory mechanisms ofbiological processes generally involve more than one miRNA and mRNA func-tioning together. Many computational approaches have been proposed to identifysuch regulatory mechanisms. They differ from one another in their methodologicalapproaches and their usage of mRNA/miRNA expression values and externalinformation such as potentially involved pathways. Methods used in differentcontexts include Bayesian networks [68], probabilistic methods [69], LASSOregression [70], or rule-based methods [71]. Despite their differences, the overallanalytical flow of these methods is similar (Fig. 5.5).
Functional analysis of miRNA regulation. It is common to infer the functionof a miRNA from its gene targets (for possible bias in such an approach, see [72]).
mRNA miRNA
Differential expression Differential expression
Predicted targets
Experimentally validated targets
Integration method:Bayesian network,machine learning,
mathematical regression,… Functional information
miRNA/mRNA regulatory modules
Pathways analysis
Biological processes regulated by miRNAs activity
Cases Controls Cases Controls
Optional input data
Fig. 5.5 miRNA analysis pipeline
124 Q. Zhang et al.

The incorporation of external information, such as functional terms related tomRNA targets, makes it possible to deduce the involvement of miRNAs regulationin biological pathways [73]. This strategy can be used to interpret functionalenrichment results and to find regulatory modules of miRNAs–mRNAs partici-pating in the same processes [74]. Several resources provide direct functionalannotation of miRNAs (Table 5.1).
Table 5.1 Useful resources of miRNA regulation for human disease studies
Resource Description Ref.
MiRNA database
miRBase Database of miRNA sequences and annotations for 206different organisms
[99]
miRNA-target interaction
microRNA.org
Database of predicted microRNA targets & targetdown-regulation scores. It includes experimentally observedexpression patterns
[100]
miRWalk Database that provides information on miRNA from human,mouse and rat on their predicted as well as validated bindingsites on their target genes. It includes information onexperimentally validated miRNA interaction informationassociated with genes, pathways, diseases, organs, OMIMdisorders, cell lines, and literature on miRNAs
[66]
multiMiR R package and database for miRNA-target interaction whichincludes information based on disease annotation and drugmicroRNA response, in addition to many experimental andcomputational databases
[101]
CancerMiner Database including recurring microRNA-mRNA associationsacross cancer type
[102]
Functional information
mir2Disease A manually curated database providing a comprehensiveresource of miRNA deregulation in various human diseases
[103]
mirFocus Database providing leads for in-depth analysis ofmiRNA-target gene pathways and the related miRNAannotations
www.mirfocus.org
HmDD Database with curated experiment-supported evidence forhuman microRNA (miRNA) and disease associations
[104]
miRCancer Database providing a collection of miRNA expression profilesin various human cancers, automatically extracted from thepublished literatures in PubMed
[105]
Variant information
PolymiRTS Database of naturally occurring DNA variations in microRNA(miRNA) seed regions and miRNA-target sites underlying ingene expression and disease phenotypes
[106]
miRdSNP Data source of dSNPs and robust tools to capture their spacialrelationship with miRNA-target sites on the 3’UTRs of humangenes
[107]
5 From Gene Expression to Disease Phenotypes … 125

5.4 Predicting Disease Genes by Incorporating Knowledgeof Gene Regulation
The identification of disease genes is a fundamental objective in medical research.With the advent of high-throughput genotyping technologies, a large number ofdisease-associated variants have been identified by genome-wide associationstudies (GWASs) [75]. Such disease variants provide valuable signals for uncov-ering underlying disease genes and unraveling disease mechanisms, which can beimproved by leveraging the knowledge of gene regulation.
5.4.1 Importance of Knowledge of Gene Regulationin Complex Disease Prediction
Both genetic predisposition and environmental factors may contribute to thepathogenesis of complex diseases. The origins of genetic predisposition are geneticvariants that affect gene functions and thus contribute to disease susceptibility.Some of these variants are located in coding regions and affect gene functions byaltering the corresponding protein sequences. The others, located in noncodingregions, may affect (TREs), such as transcription factor binding sites, resulting indysregulation of gene expression.
Uncovering disease causal genes that underlie the association signals discoveredin GWAS is challenging. The simplest method is to select genes closest todisease-associated variants as the causal genes. However, because single nucleotidepolymorphisms (SNPs) used in GWAS are tagging SNPs, representing linkagedisequilibrium (LD) blocks, disease-associated SNPs discovered in GWAS aremost likely not causal SNPs but mere their proxies. Another more sophisticatedmethod is to first define the LD regions tagged by GWAS SNPs and then identifygenes overlapping LD regions as candidate causal genes [76]. Causal genes nearGWAS SNPs are likely to be included in this way. However, causal genes whoseexpression is affected by causal SNPs through modifying their TREs will almostcertainly be missed, as they fall outside LD regions. To include these “distal” causalgenes, it requires knowledge of gene regulation and, more specifically, knowledgeof regulatory relationship between loci and genes.
5.4.2 Gene Regulation Data Resources and ComplexDisease Risk Loci
Studies have shown that disease-associated SNPs are overrepresented in lociimplicated in gene regulations [77–79] (Fig. 5.6). There are several importantresources for the knowledge of aforementioned gene-locus regulation linkage.
126 Q. Zhang et al.

Expression quantitative trait loci (eQTL) are genomic loci whose genotypes areassociated with transcript levels. eQTL data provide valuable information ofgene-locus regulatory relationship and are useful in prioritizing GWAS signals [80].In addition, the ENCODE Project inferred regulatory relationship from correlationbetween DNase I hypersensitivity of loci and promoters in different cell and tissuetypes [81]. Furthermore, FANTOM5 generated regulation information betweenenhancers and target genes by comparing their transcriptional activities acrossdifferent cell types [78]. These regulatory data repositories serve as importantinformation resources for not only prioritizing but also exploring new diseasecausal factors, on both SNP and gene levels.
5.4.3 Linking Distal Candidate Causal Genesby Incorporating the Knowledge of Gene Regulation
As mentioned earlier, causal genes may not always fall in the same haplotype blockcarrying GWAS SNPs, and thus, it requires other information in addition to LD toidentify them. Figure 5.7 shows an example of successfully uncovering a promisingcausal gene underlying a GWAS SNP by using the gene regulatory information.SNP rs2159767 is a GWAS SNP associated with schizophrenia [82]. The LDregion indexed by rs2159767 is in a gene desert and thus devoid of any genes. In it,however, we found two TREs that are likely to regulate two distal genes, fragile Xmental retardation 1 (FMR1), and fragile X mental retardation 1 neighbor(FMR1NB), respectively. Notably, FMR1 is a literature-supported SZ gene [83],
The number of eQTLs overlapping SZ-linked SNPs
Observed:399
(P-value = 0)
Freq
uenc
y
Fig. 5.6 Enrichment of schizophrenia-associated SNPs at eQTLs. We compiled 125,568 eQTLsfrom GTEx studies and identified 15,027 SNPs in high linkage disequilibrium with 261schizophrenia-associated SNPs that we collected from the GWAS catalog [111] and ameta-analysis of schizophrenia [76]. 399 eQTLs are SZ-linked SNPs (P = 0, permutation testwith 100 repetitions)
5 From Gene Expression to Disease Phenotypes … 127

and we found that a SNP (rs59460742) within the TRE associated with FMR1 is instrong LD (r2 = 0.587) with rs2159767. Those evidences imply that the causalfactor of the GWAS signal could be the SNP within the TRE that results in thedysregulation of FMR1.
5.4.4 Distal and Proximal Candidate Causal Genes
In general, incorporating LD information can improve the detection of causal genesin the proximity of GWAS signals, but finding distal causal genes relies on theknowledge of gene regulation. Using LD and gene regulation information, weidentified three overlapping sets of candidate causal genes for schizophrenia(Fig. 5.8). There are 485 proximal and 158 distal candidate causal genes. Together,these two numbers indicate that incorporating gene regulatory information cansubstantially expand the set of candidate causal genes (about one-third in theaforementioned schizophrenia case). Although irrelevant distal genes could be
147 M147,100 K 147,200 K 147,300 K 147,400 K 147,500 K 147,600 K
SNPrs2159767
TRE TRE
rs59460742 rs5936341
Chr X
Fig. 5.7 Distal disease causal gene candidates. Gene regulatory information can link genes faraway from the disease-associated GWAS SNP (schizophrenia-associated rs2159767 in this case)to the disease risk region (the red block)
Candidate causal geneslinked through eQTLs
Candidate causal genes linkedthrough the information of TREsfrom ENCODE and FANTOM5
Candidate causal genes linked through linkagedisequilibrium
4 2
103
146
8 10
370
Fig. 5.8 Schizophreniacausal gene candidates.Candidates genes are linked to261 schizophrenia-associatedSNPs through different generegulatory information
128 Q. Zhang et al.

introduced due to false regulatory linkage, incorporating the knowledge of generegulation can cover potential risk genes in a more comprehensive manner, whichwill also facilitate the downstream analysis.
5.5 Characterizing the Network and AssociationProperties of Disease Genes
Since last decade, a large number of causal or closely related genes have beenreported for many diseases by experimental or computational methods [84, 85].However, a complex disease usually reflects the perturbation to the complexintracellular network, rather than a consequence of an abnormality within a singlegene [86]. By studying disease genes in the context of biological networks, weconsider the disease genes as a whole instead of studying them individually. Suchstudies may not only provide clues to uncover the molecular mechanisms of dis-eases, but also reveal distinguishing properties of disease genes, which can be usedto predict unknown disease genes.
5.5.1 Network Characteristics Analysis of Disease Genes
Interactions among disease genes in biological networks. Disease genes can bemapped into the network (Fig. 5.9a), and a sub-network around them can beextracted to obtain a view of the local interactions among them [27]. It iswell-known that the protein products of different genes harboring causal mutationsfor the same Mendelian disease often physically interact. A recent study suggestedthat in many complex diseases, proteins encoded by genes from disease-associatedregions also tend to physically interact [87]. This characteristic is the foundation of“guilty-by association” policy to predict unknown disease genes.
Distinct network properties of disease genes. Studies have found that somenetwork properties can distinguish a group of disease genes from background genesor another set of genes, and thus are particularly informative for the relevant disease(Fig. 5.9b, c). In yeast, it was found that disease genes in general tend to havehigher degrees, cluster together, and locate at the central network locations [88], butanother study on human did not find higher degrees for disease genes [89]. Inhumans, it was reported that cancer proteins tend to have higher degrees and locateat central part of the network [90]. Moreover, it was found that cancer proteins tendto have higher betweenness (which measures the importance of a gene in com-munication between other gene pairs) and shorter shortest-paths than both theessential and the background proteins [91]. The specificity of network character-istics of disease genes can provide us clues to specific mechanisms behind thediseases.
5 From Gene Expression to Disease Phenotypes … 129

Network characteristics of disease genes in different biological networks andspecies. A recent cancer study found that prognostic genes are less likely to be hubgenes in co-expression networks, and this pattern is unique to the correspondingcancer-type-specific network. Enriched in modules, prognostic genes are especiallylikely to be module genes conserved across different cancer co-expression networks[92]. In addition to co-expression network, researchers also integratedtissue-specific gene expression with protein interaction to derive tissue-specific PPInetworks [93]. This provides an opportunity to study network characteristics ofdisease genes in tissue-specific PPI networks.
5.5.2 Software Tools for Network Characteristics Analysis
Many software tools have been developed for network characteristics analysis(Table 5.2). Some allow users to upload their own gene list for targeted analysis.
(a) (b)
(c)
Fig. 5.9 Network characteristics of cancer genes. Among 547 cancer genes from COSMIC(Version 70; Aug 2014) [112], 386 of them were analyzed in the background network HINT [113].a 394 directly physical interactions between cancer genes products. b Cancer genes tend to havehigher degrees than background genes in HINT (P = 5.136 × 10⁻²², Wilcoxon rank-sum test).c Cancer genes tend to have higher betweenness than background genes in HINT(P = 3.509 × 10⁻¹⁸, Wilcoxon rank-sum test)
130 Q. Zhang et al.

For example, TopoGSA can generate 2D or 3D plots for submitted genes, whichshow difference network characteristics simultaneously [94]. When microarray dataare uploaded, differentially expressed genes can be automatically identified andused as targeted genes for the analysis. TopoGSA can also compare the networkcharacteristics of targeted genes with those of known gene sets (e.g., pathways).SNOW [95], a similar tool, can calculate the network characteristics and estimatetheir statistical significance. NetworkAnalyzer can also carry out a similar analysiswhen genes from the network are selected [96]. In addition to these methods,several tools for general network analysis can also be helpful (Table 5.2).
Table 5.2 Tools for network characteristics analysis
Tools Description and access Ref.
Targeted analysis
TopoGSA Generate 2D or 3D plots of network characteristics to visualizethe network characteristic for each uploaded gene. Comparisonwith known gene sets based on 2D or 3D plots to visuallyidentify similar pathways to the uploaded datasetThe Web server can be accessed at http://www.topogsa.org
[94]
SNOW Compute several network characteristics and estimate thestatistical significance by comparing the network characteristicsof the uploaded genes to those of the background genes or thosein random networksThe Web server can be accessed at http://snow.bioinfo.cipf.es
[95]
NetworkAnalyzer Compute and display a comprehensive set of topologicalparameters. It can analyze the whole network or subset of nodesfrom the networkIt is a plug-in of Cytoscape
[96]
General analysis
CentiScaPe Compute 9 kinds of centralities of genes (proteins) in biologicalnetworks. It can highlight the genes whose centralities arehigher or (lower) than the user-defined thresholds. It cangenerate “plot by node,” which shows the centralities of onegene with background information about the centralities (e.g.,min, mean). It can also generate “plot by centrality” to identifygroup of genes clustered together according to combinations ofcentralities. Attributes from experiments can be also uploadedto analyze relationship between experimental data and genecentralitiesIt is a plug-in of Cytoscape
[108]
CenTiBiN Compute and explore 17 kinds of centralities of genes (proteins)in biological networksThe Web server can be accessed at http://centibin.ipk-gatersleben.de, and there is also instable Windows application.
[109]
CentiLib CentiLib is a Java-based library and user-friendly plug-in for theanalysis and visual exploration of centralities in networks.CentiLib can achieve similar functions as CenTiBiN, but it iseasier to use and it can deal with weighted networksThe software and manual can be downloaded athttp://centilib.ipk-gatersleben.de/
[110]
5 From Gene Expression to Disease Phenotypes … 131

5.5.3 Association Between Disease Genesand Other Gene Sets
Another important utility of networks is to find the association between diseasegenes and other functional groups of genes. For example, recent studies suggestedthat the it is important to consider the relationship between genetic diseases and theaging process for understanding the molecular mechanisms of complex diseases. Tobetter understand such association, one study investigated the relationship amongaging genes and disease genes in a human disease-aging network [97]. The studyfound that (1) human disease genes are much closer to aging genes than expectedby chance; (2) aging genes contribute significantly to association among diseasescompared with nonaging genes with similar degrees.
It is important to assess functional association between a group of genes (e.g.,candidate disease genes) and predefined gene sets. Overrepresentation-basedenrichment analysis is commonly used for this task. This method, however, hasseveral shortcomings. First, only shared genes between the input gene list and theknown gene sets are considered, but current data of gene sets are not complete.Second, genes in the gene sets are treated equally, disregarding the networkstructure of physical or functional interactions between genes. To address theselimitations, it is applicable to combine information of protein–protein interactionnetwork with known get sets. To tackle these problems, several such tools havebeen developed. Glaab et al. [98] combined information from pathways databasesand interaction networks and obtained more robust pathways and process repre-sentations. Their method first maps the genes in pathways into a protein–proteininteraction network and then extends the pathways by including densely interactingpartners. Later, Glaab et al. [24] proposed another tool for network-based gene setenrichment analysis. This approach first maps the target genes and reference genesets into the network. It then scores the distance between the mapped target genesand reference dataset using a random walk with restart algorithm and compares thescore against a background model. This method can use the network distance todifferentiate gene sets with similar enrichment levels assessed by overrepresentationanalysis. More importantly, it can identify novel functional associations (with no orfew shared genes) and can evaluate tissue-specific association.
5.6 Conclusions
Gene expression is under tight regulation at all levels in normal cells. The char-acteristic forms and behaviors of different cell types are the result of their varyingpatterns of expression of the same set of genes. The dysregulation of geneexpression can cause abnormal cell behaviors and result in diseases, and thus, geneexpression profiling could provide the first clue about the molecular mechanisms ofa disease. Two recent developments are spearheading the advancement of disease
132 Q. Zhang et al.

research in this field: First, next-generation sequencing technologies have increasedthe throughput and the resolution of gene expression studies to an unprecedentedlevel; second, new computational methods with sophisticated data integration,especially network integration, have been developed for gene expression dataanalysis. Biological networks can provide important a priori functional informationin data analysis, and since last decade, many different types of them have beenconstructed: Not only the number has increased but also the coverage of them hasincreased dramatically. With such recent resource and technology development,biology has entered a new data-driven phase in the twenty-first century. Now is aparticularly challenging and exciting time for disease research with gene expressionassay, as more and more gene expression data are being generated at anever-accelerating speed.
References
1. Manel E, Paul C, Stephen B, James H. A gene hypermethylation profile of human cancer.Cancer Res. 2001;61:3225–9.
2. Jones PA, Baylin SB. The fundamental role of epigenetic events in cancer. Nat Rev Genet.2002;3:415–28.
3. Darnell JE Jr. Transcription factors as targets for cancer therapy. Nat Rev Cancer.2002;2:740–9.
4. Hanahan D, Weinberg RA. Hallmarks of cancer: the next generation. Cell. 2011;144:646–74.5. Herz HM, Hu D, Shilatifard A. Enhancer malfunction in cancer. Mol Cell. 2014;53:859–66.6. Croce CM. Causes and consequences of microRNA dysregulation in cancer. Nat Rev Genet.
2009;10:704–14.7. Akavia UD, Litvin O, Kim J, Sanchez-Garcia F, Kotliar D, et al. An integrated approach to
uncover drivers of cancer. Cell. 2010;143:1005–17.8. Kim YA, Wuchty S, Przytycka TM. Identifying causal genes and dysregulated pathways in
complex diseases. PLoS Comput Biol. 2011;7:e1001095.9. Herranz H, Cohen SM. MicroRNAs and gene regulatory networks: managing the impact of
noise in biological systems. Genes Dev. 2010;24:1339–44.10. Tsang J, Zhu J, van Oudenaarden A. MicroRNA-mediated feedback and feedforward loops
are recurrent network motifs in mammals. Mol Cell. 2007;26:753–67.11. Stark A, Brennecke J, Bushati N, Russell RB, Cohen SM. Animal MicroRNAs confer
robustness to gene expression and have a significant impact on 3’UTR evolution. Cell.2005;123:1133–46.
12. Lu M, Zhang Q, Deng M, Miao J, Guo Y, et al. An analysis of human microRNA and diseaseassociations. PLoS ONE. 2008;3:e3420.
13. Ramos RG, Olden K. Gene-environment interactions in the development of complex diseasephenotypes. Int J Environ Res Public Health. 2008;5:4–11.
14. Hamosh A, Scott AF, Amberger JS, Bocchini CA, McKusick VA. Online MendelianInheritance in Man (OMIM), a knowledgebase of human genes and genetic disorders.Nucleic Acids Res. 2005;33:D514–7.
15. Risch N, Merikangas K. The future of genetic studies of complex human diseases. Science.1996;273:1516–7.
16. Mayeux R. Mapping the new frontier: complex genetic disorders. J Clin Invest.2005;115:1404–7.
5 From Gene Expression to Disease Phenotypes … 133

17. Botstein D, Risch N. Discovering genotypes underlying human phenotypes: past successesfor mendelian disease, future approaches for complex disease. Nat Genet. 2003;33(Suppl):228–37.
18. Ritchie GR, Dunham I, Zeggini E, Flicek P. Functional annotation of noncoding sequencevariants. Nat Methods. 2014;11:294–6.
19. Raney BJ, Cline MS, Rosenbloom KR, Dreszer TR, Learned K, et al. ENCODEwhole-genome data in the UCSC genome browser (2011 update). Nucleic Acids Res.2011;39:D871–5.
20. Li C, Li H. Network-constrained regularization and variable selection for analysis of genomicdata. Bioinformatics. 2008;24:1175–82.
21. Zhang W, Wan YW, Allen GI, Pang K, Anderson ML, et al. Molecular pathwayidentification using biological network-regularized logistic models. BMC Genom. 2013;14(Suppl 8):S7.
22. Wu C, Zhu J, Zhang X. Network-based differential gene expression analysis suggests cellcycle related genes regulated by E2F1 underlie the molecular difference between smoker andnon-smoker lung adenocarcinoma. BMC Bioinform. 2013;14:365.
23. Ruan J, Dean AK, Zhang W. A general co-expression network-based approach to geneexpression analysis: comparison and applications. BMC Syst Biol. 2010;4:8.
24. Glaab E, Baudot A, Krasnogor N, Schneider R, Valencia A. EnrichNet: network-based geneset enrichment analysis. Bioinformatics. 2012;28:i451–7.
25. Xia J, Gill EE, Hancock RE. NetworkAnalyst for statistical, visual and network-basedmeta-analysis of gene expression data. Nat Protoc. 2015;10:823–44.
26. Fryer RM, Randall J, Yoshida T, Hsiao LL, Blumenstock J, et al. Global analysis of geneexpression: methods, interpretation, and pitfalls. Exp Nephrol. 2002;10:64–74.
27. Lemetre C, Zhang Q, Zhang ZD. SubNet: a Java application for subnetwork extraction.Bioinformatics. 2013;29:2509–11.
28. Marko NF, Weil RJ. Mathematical modeling of molecular data in translational medicine:theoretical considerations. Sci Transl Med. 2010;2:56rv54.
29. Wan YW, Nagorski J, Allen GI, Li ZH, Liu ZD. Identifying cancer biomarkers through anetwork regularized Cox model. In: Genomic Signal Processing and Statistics (GENSIPS),2013 IEEE international workshop on IEEE. Houston, TX, 2013; pp. 36–39.
30. Wang Y, Klijn JG, Zhang Y, Sieuwerts AM, Look MP, et al. Gene-expression profiles topredict distant metastasis of lymph-node-negative primary breast cancer. Lancet.2005;365:671–9.
31. van’t Veer LJ, Dai HY, van de Vijver MJ, He YDD, Hart AAM, et al. Gene expressionprofiling predicts clinical outcome of breast cancer. Nature. 2002;415:530–6.
32. Parker JS, Mullins M, Cheang MC, Leung S, Voduc D, et al. Supervised risk predictor ofbreast cancer based on intrinsic subtypes. J Clin Oncol. 2009;27:1160–7.
33. Atias N, Istrail S, Sharan R. Pathway-based analysis of genomic variation data. Curr OpinGenet Dev. 2013;23:622–6.
34. Chuang HY, Lee E, Liu YT, Lee D, Ideker T. Network-based classification of breast cancermetastasis. Mol Syst Biol. 2007;3:140.
35. Warde-Farley D, Donaldson SL, Comes O, Zuberi K, Badrawi R, et al. The GeneMANIAprediction server: biological network integration for gene prioritization and predicting genefunction. Nucleic Acids Res. 2010;38:W214–20.
36. Saito R, Smoot ME, Ono K, Ruscheinski J, Wang PL, et al. A travel guide to Cytoscapeplugins. Nat Methods. 2012;9:1069–76.
37. Lee RC, Feinbaum RL, Ambros V. The C. elegans heterochronic gene lin-4 encodes smallRNAs with antisense complementarity to lin-14. Cell. 1993;75:843–54.
38. Zhao Y, Ransom JF, Li A, Vedantham V, von Drehle M, et al. Dysregulation ofcardiogenesis, cardiac conduction, and cell cycle in mice lacking miRNA-1-2. Cell.2007;129:303–17.
134 Q. Zhang et al.

39. Trang P, Wiggins JF, Daige CL, Cho C, Omotola M, et al. Systemic delivery of tumorsuppressor microRNA mimics using a neutral lipid emulsion inhibits lung tumors in mice.Mol Ther. 2011;19:1116–22.
40. Wahlquist C, Jeong D, Rojas-Munoz A, Kho C, Lee A, et al. Inhibition of miR-25 improvescardiac contractility in the failing heart. Nature. 2014;508:531–5.
41. Ludwig N, Nourkami-Tutdibi N, Backes C, Lenhof HP, Graf N, et al. Circulating serummiRNAs as potential biomarkers for nephroblastoma. Pediatr Blood Cancer. 2015;62:1360–1367.
42. van Schooneveld E, Wildiers H, Vergote I, Vermeulen PB, Dirix LY, et al. Dysregulation ofmicroRNAs in breast cancer and their potential role as prognostic and predictive biomarkersin patient management. Breast Cancer Res. 2015;17:526.
43. Knezevic J, Pfefferle AD, Petrovic I, Greene SB, Perou CM, et al. Expression of miR-200c inclaudin-low breast cancer alters stem cell functionality, enhances chemosensitivity andreduces metastatic potential. Oncogene. 2015; doi:10.1038/onc.2015.48.
44. Langfelder P, Horvath S. WGCNA: an R package for weighted correlation network analysis.Bmc Bioinform. 2008;9:559.
45. McKinney-Freeman S, Cahan P, Li H, Lacadie SA, Huang HT, et al. The transcriptionallandscape of hematopoietic stem cell ontogeny. Cell Stem Cell. 2012;11:701–14.
46. Miller JA, Ding SL, Sunkin SM, Smith KA, Ng L, et al. Transcriptional landscape of theprenatal human brain. Nature. 2014;508:199.
47. Okamura Y, Aoki Y, Obayashi T, Tadaka S, Ito S, et al. COXPRESdb in 2015: coexpressiondatabase for animal species by DNA-microarray and RNAseq-based expression data withmultiple quality assessment systems. Nucleic Acids Res. 2015;43:D82–6.
48. Marbach D, Costello JC, Kuffner R, Vega NM, Prill RJ, et al. Wisdom of crowds for robustgene network inference. Nat Methods. 2012;9:796.
49. Faith JJ, Hayete B, Thaden JT, Mogno I, Wierzbowski J, et al. Large-scale mapping andvalidation of Escherichia coli transcriptional regulation from a compendium of expressionprofiles. PLoS Biol. 2007;5:54–66.
50. Huynh-Thu VA, Irrthum A, Wehenkel L, Geurts P. Inferring regulatory networks fromexpression data using tree-based methods. PLoS One. 2010;5:e12776.
51. Salgado H, Peralta-Gil M, Gama-Castro S, Santos-Zavaleta A, Muniz-Rascado L, et al.RegulonDB v8.0: omics data sets, evolutionary conservation, regulatory phrases,cross-validated gold standards and more. Nucleic Acids Res. 2013;41:D203–13.
52. Jiang J, Gusev Y, Aderca I, Mettler TA, Nagorney DM, et al. Association of MicroRNAexpression in hepatocellular carcinomas with hepatitis infection, cirrhosis, and patientsurvival. Clin Cancer Res. 2008;14:419–27.
53. Jopling CL, Yi M, Lancaster AM, Lemon SM, Sarnow P. Modulation of hepatitis C virusRNA abundance by a liver-specific MicroRNA. Science. 2005;309:1577–81.
54. Wang X, Zhang X, Ren XP, Chen J, Liu H, et al. MicroRNA-494 targeting both proapoptoticand antiapoptotic proteins protects against ischemia/reperfusion-induced cardiac injury.Circulation. 2010;122:1308–18.
55. Xu J, Hu Z, Xu Z, Gu H, Yi L, et al. Functional variant in microRNA-196a2 contributes tothe susceptibility of congenital heart disease in a Chinese population. Hum Mutat.2009;30:1231–6.
56. Abelson JF, Kwan KY, O’Roak BJ, Baek DY, Stillman AA, et al. Sequence variants inSLITRK1 are associated with Tourette’s syndrome. Science. 2005;310:317–20.
57. Yang F, Wang W, Zhou C, Xi W, Yuan L, et al. MiR-221/222 promote human glioma cellinvasion and angiogenesis by targeting TIMP2. Tumour Biol. 2015;36:3763.
58. Zhao S, Yao D, Chen J, Ding N, Ren F. MiR-20a promotes cervical cancer proliferation andmetastasis in vitro and in vivo. PLoS ONE. 2015;10:e0120905.
59. Houbaviy HB, Murray MF, Sharp PA. Embryonic stem cell-specific MicroRNAs. Dev Cell.2003;5:351–8.
60. Enright AJ, John B, Gaul U, Tuschl T, Sander C, et al. MicroRNA targets in Drosophila.Genome Biol. 2003;5:R1.
5 From Gene Expression to Disease Phenotypes … 135

61. Kertesz M, Iovino N, Unnerstall U, Gaul U, Segal E. The role of site accessibility inmicroRNA target recognition. Nat Genet. 2007;39:1278–84.
62. Thadani R, Tammi MT. MicroTar: predicting microRNA targets from RNA duplexes. BMCBioinform. 2006;7(Suppl 5):S20.
63. Stingo FC, Chen YA, Vannucci M, Barrier M, Mirkes PE. A Bayesian graphical modelingapproach to microRNA regulatory network inference. Ann Appl Stat. 2010;4:2024–48.
64. Tabas-Madrid D, Muniategui A, Sanchez-Caballero I, Martinez-Herrera DJ, Sorzano CO,et al. Improving miRNA-mRNA interaction predictions. BMC Genom. 2014;15(Suppl 10):S2.
65. Ritchie W, Flamant S, Rasko JE. Predicting microRNA targets and functions: traps for theunwary. Nat Methods. 2009;6:397–8.
66. Dweep H, Sticht C, Pandey P, Gretz N. miRWalk–database: prediction of possible miRNAbinding sites by “walking” the genes of three genomes. J Biomed Inform. 2011;44:839–47.
67. Xiao F, Zuo Z, Cai G, Kang S, Gao X, et al. miRecords: an integrated resource formicroRNA-target interactions. Nucleic Acids Res. 2009;37:D105–10.
68. Huang JC, Babak T, Corson TW, Chua G, Khan S, et al. Using expression profiling data toidentify human microRNA targets. Nat Methods. 2007;4:1045–9.
69. Joung JG, Hwang KB, Nam JW, Kim SJ, Zhang BT. Discovery of microRNA-mRNAmodules via population-based probabilistic learning. Bioinformatics. 2007;23:1141–7.
70. Muniategui A, Nogales-Cadenas R, Vazquez M, Aranguren XL, Agirre X, et al.Quantification of miRNA-mRNA interactions. PLoS ONE. 2012;7:e30766.
71. Tran DH, Satou K, Ho TB. Finding microRNA regulatory modules in human genome usingrule induction. BMC Bioinform. 2008;9(Suppl 12):S5.
72. Bleazard T, Lamb JA, Griffiths-Jones S Bias in microRNA functional enrichment analysis.Bioinformatics. 2015;31:1592–1598.
73. Gusev Y, Schmittgen TD, Lerner M, Postier R, Brackett D. Computational analysis ofbiological functions and pathways collectively targeted by co-expressed microRNAs incancer. BMC Bioinform. 2007;8(Suppl 7):S16.
74. Liu B, Li J, Cairns MJ. Identifying miRNAs, targets and functions. Brief Bioinform.2014;15:1–19.
75. Welter D, MacArthur J, Morales J, Burdett T, Hall P, et al. The NHGRI GWAS Catalog, acurated resource of SNP-trait associations. Nucleic Acids Res. 2014;42:D1001–6.
76. Schizophrenia Working Group of the Psychiatric Genomics C. Biological insights from 108schizophrenia-associated genetic loci. Nature. 2014;511:421–7.
77. Nicolae DL, Gamazon E, Zhang W, Duan S, Dolan ME, et al. Trait-associated SNPs aremore likely to be eQTLs: annotation to enhance discovery from GWAS. PLoS Genet.2010;6:e1000888.
78. Andersson R, Gebhard C, Miguel-Escalada I, Hoof I, Bornholdt J, et al. An atlas of activeenhancers across human cell types and tissues. Nature. 2014;507:455–61.
79. Maurano MT, Humbert R, Rynes E, Thurman RE, Haugen E, et al. Systematic localization ofcommon disease-associated variation in regulatory DNA. Science. 2012;337:1190–5.
80. Hou L, Zhao H. A review of post-GWAS prioritization approaches. Front Genet. 2013;4:280.81. Thurman RE, Rynes E, Humbert R, Vierstra J, Maurano MT, et al. The accessible chromatin
landscape of the human genome. Nature. 2012;489:75–82.82. Sullivan PF, Lin D, Tzeng JY, van den Oord E, Perkins D, et al. Genomewide association for
schizophrenia in the CATIE study: results of stage 1. Mol Psychiatry. 2008;13:570–84.83. Kelemen O, Kovacs T, Keri S. Contrast, motion, perceptual integration, and neurocognition
in schizophrenia: the role of fragile-X related mechanisms. Prog Neuropsychopharmacol BiolPsychiatry. 2013;46:92–7.
84. Bauer-Mehren A, Bundschus M, Rautschka M, Mayer MA, Sanz F, et al. Gene-diseasenetwork analysis reveals functional modules in mendelian, complex and environmentaldiseases. Plos One. 2011;6:e20284.
85. Rappaport N, Nativ N, Stelzer G, Twik M, Guan-Golan Y, et al. MalaCards: an integratedcompendium for diseases and their annotation. Database J Biol Databases Curation. 2013;bat018.
136 Q. Zhang et al.

86. Barabasi AL, Gulbahce N, Loscalzo J. Network medicine: a network-based approach tohuman disease. Nat Rev Genet. 2011;12:56–68.
87. Rossin EJ, Lage K, Raychaudhuri S, Xavier RJ, Tatar D, et al. Proteins encoded in genomicregions associated with immune-mediated disease physically interact and suggest underlyingbiology. Plos Genet. 2011;7:e1001273.
88. Ideker T, Sharan R. Protein networks in disease. Genome Res. 2008;18:644–52.89. Goh KI, Cusick ME, Valle D, Childs B, Vidal M, et al. The human disease network. Proc
Natl Acad Sci USA. 2007;104:8685–90.90. Jonsson PF, Bates PA. Global topological features of cancer proteins in the human
interactome. Bioinformatics. 2006;22:2291–7.91. Sun JC, Zhao ZM. A comparative study of cancer proteins in the human protein-protein
interaction network. Bmc Genomics 2010;11.92. Yang Y, Han L, Yuan Y, Li J, Hei NN, et al. Gene co-expression network analysis reveals
common system-level properties of prognostic genes across cancer types. Nat Commun2014;5:3231.
93. Magger O, Waldman YY, Ruppin E, Sharan R. Enhancing the prioritization ofdisease-causing genes through tissue specific protein interaction networks. Plos ComputBiol 2012;8:e1002690.
94. Glaab E, Baudot A, Krasnogor N, Valencia A. TopoGSA: network topological gene setanalysis. Bioinformatics. 2010;26:1271–2.
95. Minguez P, Gotz S, Montaner D, Al-Shahrour F, Dopazo J. SNOW, a web-based tool for thestatistical analysis of protein-protein interaction networks. Nucleic Acids Res. 2009;37:W109–14.
96. Assenov Y, Ramirez F, Schelhorn SE, Lengauer T, Albrecht M. Computing topologicalparameters of biological networks. Bioinformatics. 2008;24:282–4.
97. Wang JG, Zhang SH, Wang Y, Chen LN, Zhang XS. Disease-aging network revealssignificant roles of aging genes in connecting genetic diseases. Plos Comput Biology 2009;5:e1000521.
98. Glaab E, Baudot A, Krasnogor N, Valencia A. Extending pathways and processes usingmolecular interaction networks to analyse cancer genome data. Bmc Bioinform.2010;11:597.
99. Kozomara A, Griffiths-Jones S. miRBase: annotating high confidence microRNAs usingdeep sequencing data. Nucleic Acids Res. 2014;42:D68–73.
100. Betel D, Wilson M, Gabow A, Marks DS, Sander C. The microRNA.org resource: targetsand expression. Nucleic Acids Res. 2008;36:D149–53.
101. Ru Y, Kechris KJ, Tabakoff B, Hoffman P, Radcliffe RA, et al. The multiMiR R package anddatabase: integration of microRNA-target interactions along with their disease and drugassociations. Nucleic Acids Res. 2014;42:e133.
102. Jacobsen A, Silber J, Harinath G, Huse JT, Schultz N, et al. Analysis of microRNA-targetinteractions across diverse cancer types. Nat Struct Mol Biol. 2013;20:1325–32.
103. Jiang Q, Wang Y, Hao Y, Juan L, Teng M, et al. miR2Disease: a manually curated databasefor microRNA deregulation in human disease. Nucleic Acids Res. 2009;37:D98–104.
104. Purcell SM, Moran JL, Fromer M, Ruderfer D, Solovieff N, et al. A polygenic burden of raredisruptive mutations in schizophrenia. Nature. 2014;506:185–90.
105. Xie B, Ding Q, Han H, Wu D. miRCancer: a microRNA-cancer association databaseconstructed by text mining on literature. Bioinformatics. 2013;29:638–44.
106. Bhattacharya A, Ziebarth JD, Cui Y. PolymiRTS Database 3.0: linking polymorphisms inmicroRNAs and their target sites with human diseases and biological pathways. NucleicAcids Res. 2014;42:D86–91.
107. Bruno AE, Li L, Kalabus JL, Pan Y, Yu A, et al. miRdSNP: a database of disease-associatedSNPs and microRNA target sites on 3’UTRs of human genes. BMC Genom. 2012;13:44.
108. Scardoni G, Petterlini M, Laudanna C. Analyzing biological network parameters withCentiScaPe. Bioinformatics. 2009;25:2857–9.
5 From Gene Expression to Disease Phenotypes … 137

109. Junker BH, Koschutzki D, Schreiber F. Exploration of biological network centralities withCentiBiN. Bmc Bioinform. 2006;7:219.
110. Grassler J, Koschutzki D, Schreiber F. CentiLib: comprehensive analysis and exploration ofnetwork centralities. Bioinformatics. 2012;28:1178–9.
111. Hindorff LA MJEBI, Morales J (European Bioinformatics Institute), Junkins HA, Hall PN,Klemm AK, Manolio TA. (Available at: http://www.genome.gov/gwastudies). A catalog ofpublished genome-wide association studies. Accessed 31 Mar 2015.
112. Forbes SA, Beare D, Gunasekaran P, Leung K, Bindal N, et al. COSMIC: exploring theworld’s knowledge of somatic mutations in human cancer. Nucleic Acids Res. 2014;43:D805–11.
113. Das J, Yu HY. HINT: High-quality protein interactomes and their applications inunderstanding human disease. BMC Syst Biol. 2012;6:92.
Author Biographies
Dr. Quanwei Zhang received his PhD degree at Xi’an JiaotongUniversity in China in 2010, after training in machine learningand bioinformatics. He joined the bioinformatics core inNorthwestern University as a postdoc from 2011 to 2013, wherehis research focused on statistical and computational analysis ofnext-generation sequencing data, including nucleosome-positioning, histone methylation, and protein-binding sites anal-ysis. He joined the Division of Computational Genetics at AlbertEinstein College of Medicine in 2013 as a research fellow. Sincethen, he has been working on human aging. By integratingbiological networks and the human genetic variation together, heis looking for clues to the basic mechanisms of aging and theevolution of sub-network of aging genes.
Dr. Wen Zhang obtained his PhD in computational science fromShanghai University in 2009. Afterward, he studied at MichiganTechnological University where he got his second MS degree, inbioinformatics, in 2012. After working at Baylor College ofMedicine for one year, he joined Prof. Zhengdong Zhang’slaboratory at Albert Einstein College of Medicine in 2013, as apostdoctoral fellow working on bioinformatics and computa-tional genetics. He is currently analyzing high-throughput datafrom human genome sequencing and genome-wide associationstudies.
138 Q. Zhang et al.

Dr. Rubén Nogales-Cadenas is a scientific researcher at theAlbert Einstein College of Medicine in New York. He has morethan eight years of research experience in Bioinformatics andComputational Biology. His scientific activity is mainly focusedon the integration of biological data and computational resourcesfor genomics research of the immune system, cancer, and drugdiscovery. He is interested in a wide range of research topics,including the development and implementation of new dataanalysis methodologies and their application to real biologicalproblems, always taking advantage of many different types ofbiological information from experimental, functional, structural,regulatory, and pharmacological data. Dr. Nogales-Cadenas haspublished 18 articles in international well-recognized journals.
Dr. Jhih-Rong Lin received his PhD degree in computer scienceat University of South Carolina in 2013 with the thesis oncomputational analysis of protein sorting signals and localization.In 2014, he joined the Genetics Department of Albert EinsteinCollege of Medicine as a research fellow. Currently, he isworking on prediction of causal genes and causal variants ofcomplex diseases. His main research interest focuses on thedevelopment of computational methods for human geneticanalysis. As the first author of three journal articles in the field ofbioinformatics, he has developed free software tools imple-menting his computational methods for public access.
Ying Cai obtained her MS degree in Medical Genome Sciencesfrom the University of Tokyo, where she studied miRNAexpression in adult T-cell leukemia. As a PhD candidate in theDepartment of Genetics at Albert Einstein College of Medicine,she is currently working in the field of bioinformatics, focusingon the analysis of mRNA expression profile of breast cancer.
5 From Gene Expression to Disease Phenotypes … 139

Prof. Zhengdong D. Zhang is an assistant professor in theDepartment of Genetics at Albert Einstein College of Medicine.His research interests are computational genomics and systemsbiology of complex human diseases, focusing on algorithmdevelopment, data integration, and software implementation(visit www.zdzlab.org for more information). He participated andplayed an active role in some of the most notable internationalgenome projects. He has investigated human functional genomicson different levels—from single genes, to gene families, and tothe whole genomes—with an integrative approach drawing formmolecular biology, statistics, and computational biology. At theBaylor College of Medicine Human Genome Sequencing Center,as part of the Rat Genome Project, he performed a comparativeanalysis of the nuclear receptor family in the human, mouse, andrat. At Yale University, as part of the ENCODE and the 1000
Genomes Projects, he developed software pipelines to process microarray and high-throughputsequencing data and carried out a detailed statistical analysis of the genomic distribution andcorrelation of transcriptional regulatory elements in the ENCODE regions. At Albert EinsteinCollege of Medicine, his research team recently developed two computational frameworks of dataintegration to identify risk genes of complex diseases. Using a novel framework of integratedpost-GWAS analysis, they identified distal causal genes of complex human diseases linked toGWAS signals through nearby regulatory elements such as enhancers. In another study, theydeveloped a network-regularized logistic regression method. Using it to analyze case–controlsequencing data, they identified and prioritized risk genes of complex human diseases. He receivedthe NIH Career Development Award from the National Library of Medicine and the New ScholarAward from the Ellison Medical Foundation for his scientific and medical research.
140 Q. Zhang et al.


![Identification of Expression QTLs Targeting Candidate ...€¦ · liable results that identify candidate genes related to phenotypes of interest [1]. Although gene expressions associated](https://img.dokumen.tips/doc/110x75/5f02515c7e708231d403acae/identification-of-expression-qtls-targeting-candidate-liable-results-that-identify.jpg)