Embed Size (px)
Citation preview

113
Chapter 5
CRACK PATH SELECTION IN ADHESIVELY BONDED JOINTS: THE ROLE
OF MATERIAL PROPERTIES
(Paper prepared for submission to the Journal of Adhesion)
ABSTRACT
This paper investigates the role of material properties on crack path selection in adhesively
bonded joints. First, a parametric study of directionally unstable crack propagation in adhesively
bonded double cantilever beam specimens (DCB) is presented. The alternating crack trajectories in
specimens of various material systems are simulated using the finite element method and the results
indicate that the characteristic length of the crack varies with the Dundurs’ parameters characterizing
the material mismatch. Second, the effect of interface properties on crack path selection is
investigated. DCB specimens with substrates treated using various surface preparation methods are
tested under mixed mode fracture loading to determine the effect of interface properties on the locus of
failure. As indicated by the post-failure analyses of the failure surfaces, debonding tends to be more
interfacial as the mode II fracture component in the loading increases. On the other hand, failures in
specimens prepared with more advanced surface preparation techniques appear more cohesive for
given loading conditions. Using a high-speed camera to monitor the fracture sequence in quasi-static
DCB tests, the effect of interface properties on the rate dependence of the locus of failure in adhesive
bonds is studied. XPS analyses of the failure surfaces indicate that the effect of crack propagation rate
on the locus of failure is less significant when more advanced surface preparation techniques were
used. The effect of asymmetric interface property on the behavior of directionally unstable crack
propagation in adhesive bonds is also investigated. Geometrically symmetric DCB specimens with
asymmetric surface pretreatments are prepared and tested under low-speed impact. As indicated by
Auger depth profile results, the centerline of the crack trajectory shifts slightly toward the interface
with poor adhesion due to the asymmetric interface property. Third, through varying the rubber
content in the adhesive, DCB specimens with various fracture toughnesses are prepared and the effect
of adhesive toughness on the directional stability of cracks is then investigated. An examination of the
failure surfaces reveals that directionally unstable crack propagation is more unlikely to occur as the
toughness of the adhesive increased, which is consistent with the analytical predictions that were
discussed using an energy balance model.

114
KEYWORDS
Directional stability of cracks; locus of failure; surface pretreatment; crack path selection;
adhesively bonded joints; T-stress; interfacial failure; cohesive failure; mixed mode fracture.
INTRODUCTION
Cracks and flaws are inevitable in manufacture and service life of adhesively bonded joints and
propagation of the cracks will greatly reduce the life of the joints and may cause unexpected failure.
Therefore, understanding the crack propagation behavior is an important aspect in evaluating the
performance of adhesively bonded joints. For a crack located within the adhesive layer, the crack
propagation behavior is closely related to the stress state at the crack tip [1-4]. If a Cartesian coordinate is
set at the crack tip with x-axis pointing along the crack plane, the stress distribution at the crack tip can be
expressed by William’s asymptotic stress expansion [5],
( )rO00
0T
2
3cos
2cos
2sin
2
3sin
2sin1
2cos
2
3sin
2sin1
2cos
2
3cos
2cos2
2sin
r2
K
2
3sin
2sin1
2
3sin
2sin
2
3sin
2sin
2
3sin
2sin1
2cos
r2
K
II
I
yyxy
xyxx
+
+
θ
θ
θ
θ
θ−
θ
θ
θ−
θ
θ
θ+
θ−
π+
θ
θ+
θ
θ
θ
θ
θ
θ−
θ
π=
σσσσ
Equation 1
where r and θ are the polar coordinates and KI and KII are the mode I and mode II stress intensity factors,
respectively. The third term in Equation 1 is non-singular and acts parallel to the crack plane. By
convention, this term is referred to as the “T-stress”. In order to obtain an overall understanding of the
crack propagation behavior, knowledge of KI, KII, and T is essential since they characterize the stress state
at the crack tip [1, 2, 6-10].
For cracks in brittle homogeneous materials, the stress intensity factors KI and KII characterize the
singular stresses at the crack tip, and therefore are closely associated with the onset of fracture and the
direction of cracking [1, 11]. More specifically, according to the conventional theory of fracture, the onset
of fracture for brittle materials is characterized by the critical mode I fracture toughness KIc. The direction
of cracking, as indicated by Goldstein and Salganik [11], Cotterell and Rice [1], and Hutchinson and Suo
[2], is related to the fracture mode mixity characterized by the phase angle Ψ, which is defined as
=Ψ −
I
II1
K
Ktan Equation 2

115
The phase angle Ψ can be determined using the mode I fracture criterion [11], which states that a crack will
propagate in a direction such that pure mode I fracture is maintained at the crack tip, i.e. KII = 0 or Ψ = 0 at
the advancing crack tip.
Although the criteria for the onset of fracture and the direction of cracking were developed for
homogeneous materials, they can be readily extended to bi-materials systems such as adhesively bonded
joints [2]. However, when the crack is at the bi-material interface, care should be used when applying the
mode I fracture criterion for direction of cracking due to differences in fracture toughness in the vicinity of
an interface as indicated in references 12 and 13. Chen and Dillard [12] provided an example showing how
to use these criteria to determine the direction of cracking when the crack is located at the interface.
According to the mode I fracture criterion for the direction of cracking, in testing adhesive bonds,
the locus of failure is predicted to be closely associated with the mode mixity of the loading. As the mode
II fracture components in the loading increase, failure tends to be more interfacial. Through loading DCB
specimens in mixed mode fashion and conducting X-ray photoelectron spectroscopy (XPS) and Auger
depth profile analyses on the failure surfaces to identify the locus of failure, Chen et al. [10] demonstrated
the mode mixity dependence of the locus of failure in adhesive bonds. The discussions in reference 10
mainly focused on the effect of external loads and specimen geometry. However, according to references
14-16, the surface morphology and chemistry of adherends can be altered using different surface
preparation methods. As a result, the quality of adhesion for a particular materials system can be greatly
enhanced if appropriate surface pretreatment is used. Therefore, the locus of failure or other crack
propagation behavior under certain loading conditions might also be altered significantly due to the
changes in the interface properties, which suggests that an investigation of the effect of interface properties
on crack path selection in adhesive bonds is necessary.
The T-stress in Equation 1 is a non-singular stress acting parallel to the crack plane and is
relatively small in the vicinity of the crack tip as compared to the singular terms in the equation. In
investigating slightly curved or kinked cracks under mode I loading, Cotterell and Rice [1] indicated that
the T-stress plays an important role in the directional stability of crack propagation. The crack trajectory is
directionally stable if the T-stress is negative whereas the crack trajectory is directionally unstable if the T-
stress is positive.
In adhesively bonded joints, the issue of directional stability of cracks was first discussed by Chai
[17], who observed a unique alternating crack trajectory in testing graphite reinforced epoxy composite
laminates and aluminum/epoxy bonds under mode I fracture loading. Fleck, Hutchinson, and Suo [4] and
Akisanya and Fleck [6, 7] investigated this directional stability issue analytically and indicated that as with
homogeneous materials, the directional stability of cracks in adhesively bonded joints also depends on the

116
T-stress level. Through testing symmetric double cantilever beam (DCB) specimens with various levels of
the T-stresses, Chen and Dillard [13] demonstrated that the crack trajectory was relatively straight when the
T-stress is negative (compressive) and is alternating when the T-stress positive (tensile). These results
verify the T-stress dependence of the directional stability of cracks in adhesive bonds.
Based on an energy balance idea, Chen and Dillard [12] constructed an analytical model using an
idealized crack trajectory resembling the “square wave” to predict the crack propagation manner in
adhesively bonded DCB specimens. Shown in Fig. 1 is the result of the analysis. The y-axis of the figure
is the normalized average strain energy release rate according to the critical strain energy release rate Gc (=
310 J/m3) of the DCB specimens tested in reference 13, and the x-axis represents the thickness of the
adherends. The dashed line represents the critical strain energy release rate for the alternating crack
propagation and therefore, also represents the threshold of the transition of the directional stability of the
crack propagation. If the available strain energy release rate is higher than the critical strain energy release
rate for the alternating crack trajectory, cracks in the specimen are more likely to be directionally unstable
since there is enough energy available for cracks to propagate along the alternating path. On the other
hand, if the available strain energy release rate for the alternating crack propagation is lower than the
critical strain energy release rate, cracks are more likely to be directionally stable. Fig. 1 shows the results
of the analysis for the DCB specimens tested in reference 13. The specimens had a thermal residual stress
of σ0 = 13 MPa induced from curing and before testing, the specimens were stretched mechanically until
the adherends were plastically deformed to alter the residual stress, and consequently, the T-stress in the
specimens [13]. Fig. 1 shows that when the plastic deformation in the adherends εp is less than 1.1%, the
curves are all below the dashed line indicating a likelihood for directionally stable crack propagation. As
the plastic deformation εp in the adherends increases (consequently, the T-stress also increases), more and
more strain energy becomes available and the curves shift upwards, suggesting an increase in the
probability of directionally unstable cracks. This result is consistent with the predictions made by Fleck,
Hutchinson, and Suo [4] using the T-stress argument. Experimental results discussed in reference 13 also
indicated good consistency with the predictions made by the energy balance model.
The energy balance model also predicted an effect of the toughness of adhesive bonds on the
probability of the directional stability of cracks. As shown in Fig. 1, if the toughness of the bonds Gc
increases, all the curves will shift downward vertically and the transition between directionally stable and
unstable crack propagation is less likely to occur. Since the toughness of adhesive bonds varies
significantly with the material system, an investigation of the effect of the fracture toughness of the
adhesive bonds on the directional stability of cracks can provide important insight into the general
understanding of the crack path selection behavior in adhesively bonded systems.

117
With knowledge of the criteria for the direction of crack propagation and interface mechanics, the
crack trajectories for directionally unstable crack propagation can be predicted [12]. Compared to the
experimentally observed alternating crack trajectory as shown in reference 12, the predicted trajectory
accurately simulated the alternating features of the crack such as the characteristic length and the overall
shape.
As suggested by the “shear-lag” concept for adhesively bonded single-lap joint specimens, one can
predict from the results in reference 12 that the alternating nature of the crack is closely related to the
material mismatch of the system and can be explained using a model analogous to the “shear-lag”. For a
bi-material system, the material mismatch is characterized by the Dundurs’ parameters α and β, which are
defined as
( ) ( )( ) ( )( ) ( )( ) ( )11
11
11
11
1221
1221
1221
1221
+κµ++κµ−κµ−−κµ=β
+κµ++κµ+κµ−+κµ=α
Equation 3
where the subscripts 1 and 2 refer to the materials for the adherends and adhesive, respectively; µi (i = 1, 2)
are shear moduli; ii 43 ν−=κ for plane strain and ( ) ( )iii 13 ν+ν−=κ for plane stress; and νi (i = 1, 2) are
the Poisson’s ratios. The value of α is between – 1 and 1, and according to Suga et al. [18] and Hutchinson
and Suo [2], the value of β is between 0 and α/4 for most material combinations.
This paper focuses on the effect of material properties on the crack path selection in adhesively
bonded joints. First, directionally unstable crack trajectories in DCB specimens of different material
systems were simulated using the finite element method and the characteristic length of the cracks was
demonstrated to be dependent on the material mismatch. Second, the effect of the interface properties on
the locus of failure was investigated. DCB specimens with adherends treated by different surface
preparation methods were tested under mixed mode fracture fashion. Post-failure analyses including XPS
and Auger depth profiling were conducted to identify the locus of failure. The results indicate that the
locus of failure, while strongly dependent on the fracture mode mixity, is also closely related to the
interface properties. Third, the effect of surface preparation on the rate dependence of the locus of failure
in adhesively bonded specimens was studied. DCB specimens with various T-stress levels and surface
pretreatments were tested quasi-statically and the fracture sequence was recorded using a high-speed
camera. XPS analysis on the failure surfaces indicated that the effect of debond rate on the locus of failure
was less significant as the surface preparation was improved. Fourth, DCB specimens with asymmetric
surface pretreatments were tested to investigate the effect of interface asymmetry on crack propagation
behavior. As indicated by the Auger depth profile data, an asymmetric crack trajectory resulted due to the

118
interface asymmetry. Last, through varying the rubber content in the adhesive, DCB specimens with
different fracture toughnesses were obtained and the effect of adhesive toughness on the directional
stability of cracks was studied. The examination of the failure surfaces revealed that directionally unstable
crack propagation was more unlikely to occur as the toughness of the adhesive increased, which was
consistent with the predictions made in reference 12 using the energy balance model.
FRACTURE ANALYSIS
A Parametric Study of Directionally Unstable Crack Propagation
In this section, a parametric study of the characteristic length of directionally unstable cracks in
DCB specimens of different materials systems was conducted using finite element analysis. The finite
element packages used were ABAQUS [19] and FRANC2DL [20]. The 2-D model analyzed in
ABAQUS was a typical DCB geometry with dimensions shown in Fig. 2. A straight interfacial crack
with an idealized kink was included in the geometry simulating the alternating behavior for a directionally
unstable crack. The objective of the analysis was to predict the crack propagation behavior after kinking.
At the right end of the model, the displacements were totally constrained and at the left end, two constant
loads were applied. One load was applied horizontally to maintain a positive T-stress level in the model
and the other load was applied vertically to simulate the external loading. The deformed finite element
mesh around the crack tip is shown as the insert in Fig. 2; eight-node, plane-strain elements were used with
reduced integration and quarter-point singular elements were constructed around the crack tip. Both
adherends and adhesive were modeled as linear elastic materials with various Young’s modulus
combinations characterized by Dundurs’ parameter α to simulate the materials mismatch for different
materials systems. The Poisson’s ratio for both materials was estimated as ν1 = ν2 = 0.33. Therefore,
according to Equation 3, β = 0.247α under plane-strain conditions.
From the finite element analysis, the stress distributions ahead of the crack tip (θ = 0) were
obtained, which, according to Williams [21], have the general form of
( )r2
riKKi
i21
xyyy π+=σ+σ
ε Equation 4
Where )rlnsin(r
1i)rlncos(
r
1
r
ri
ε+ε=ε
is the oscillatory singularity characteristic to cracks at the
interface between two dissimilar solids, K1 and K2 are the complex stress intensity factor, analogous to the
conventional stress intensity factors KI and KII, and ε is defined as
β+β−
π=ε
1
1ln
2
1 Equation 5
119
Due to the oscillatory nature in the stress ahead of the crack tip, the local fracture mode mixity and
direction of cracking are relatively difficult to determine for interfacial cracks. According to Hutchinson,
Mear, and Rice [22], Suo and Hutchinson [23], and Hills et al. [24], the solution for an interfacial crack can
be approached by the solution for a sub-interface crack, which lies a small distance δt below the interface,
as the distance between the crack and the interface decreases to zero. Dattaguru et al. [25] verified this
argument numerically using finite element analysis. Through investigating the global energy balance,
Hutchinson, Mear, and Rice [22] and Suo and Hutchinson [23] also obtained the relationship between the
complex stress intensity factor K1 and K2 for the interfacial crack and the conventional stress intensity
factors KI and KII for the corresponding sub-interface crack as
( ) εφ δ+=+ i21
iIII tiKKqeiKK Equation 6
where ( ) ( )α+β−= 11q 2 is a real quantity, and φ(α,β) is a dimensionless function listed in Hutchinson
and Suo [2] for different materials combinations. With Equation 6, the mode mixity at the interface crack
tip can be expressed in terms of the conventional definition of the phase angle Ψ as
( )[ ]( )[ ] φ+
δ+δ+=
=Ψ ε
ε−−
i21
i211
I
II1
tiKKRe
tiKKImtan
K
Ktan Equation 7
Numerically, by knowing the stress distributions ahead of the interfacial crack tip, the right parts of
Equation 7 can be determined by fixing the value of δt [6]. According to references 22 and 25, the
analytical result for a sub-interface crack converges quickly as the sub-interface crack approaches the
interface. Slight variation of δt will only induce negligible error. For the convenience of comparison, in
this study, δt is chosen to be 1 µm. From Ψ obtained using Equation 7, the direction of crack propagation
can be inferred using the mode I fracture criterion for the direction of cracking.
Analysis Results
Fig. 3 shows the analysis results for the phase angle, Ψ , versus the normalized kink crack length
with respect to the adhesive thickness. Each curve in the figure corresponds to a particular material
combination characterized by the Dundurs’ parameter α (β = α/4). Take the curve with α = 0.92 as an
example to explain the crack propagation behavior since the curve corresponds to the aluminum/epoxy
system studied in references 10, 12, and 13 and in this paper. The phase angle is negative when the crack
length is small, which, according to the mode I fracture criterion, indicates that the direction of cracking is
towards the adherend. However, since the adherends normally are much tougher than the adhesive for
joints such as the aluminum/epoxy system studied, the direction of cracking is then restricted to the
interface. As the crack length increases, the figure shows that the phase angle also increases and finally

120
becomes positive when s/t > 2.2. Since the direction of cracking corresponding to a positive phase angle is
towards the adhesive, the crack is forced to deviate from the interface after the sign of the phase angle
changes. This transition of the direction of cracking with the crack length finally results in an alternating
crack trajectory with a characteristic length ranging from 3 – 4 times the thickness of the adhesive layer.
This range of the characteristic length was determined in the analysis using meshes with different density.
This prediction is consistent with the experimental observations and the numerical simulation results of the
crack trajectory in reference 12. Similar behavior was also found for the T-stress, after the crack kinked
into the interface, the T-stress at the crack tip was relatively small (≅ 0). Similar to the “shear-lag”
situation in an adhesively bonded single lap joint specimen, the T-stress also increased as the crack
continued to propagate along the interface until the kinked crack length approached the characteristic
length, at which, the crack became directionally unstable and deviated away from the interface. Therefore,
the characteristic length of the crack is closely related to the characteristic length of the “shear-lag” model
for the T-stress.
If the material system changes, for instance, steel is used for the adherend instead of aluminum in
the DCB specimens, the material mismatch factor α becomes 0.97 and Fig. 3 shows that the curve shifts
left. As a result, the sign change of the phase angle (or the direction of cracking) occurs at a smaller crack
length (s/t ≅ 1.7) and consequently, the characteristic length for directionally unstable cracks is predicted to
be smaller. On the other hand, if a low modulus material is used for the adherends, α decreases and Fig. 3
shows that the curve shifts right, indicating a larger characteristic length in the crack propagation.
To further demonstrate the effect of material properties on the characteristic length of the
directionally unstable crack propagation, numerical simulations of the crack propagation using
FRANC2DL were also conducted. The mesh constructions, boundary conditions, and the detailed
calculation scheme in the simulation were all the same as that in reference 12, therefore, only the final
results are reported here. Shown in Fig. 4 are the crack trajectories obtained from the numerical simulation
for different material combinations. The FEA meshes are hidden to observe the crack trajectories more
clearly. The figure shows that the crack trajectories for different material combinations are all self-similar
in shape; however, the characteristic length decreased as the Dundurs’ parameter α increased.
MATERIALS AND EXPERIMEMTS
To investigate the effect of material properties on the crack path selection in adhesively bonded
joints, both symmetric (h = H) and asymmetric (h ≠ H) double cantilever beam (DCB) specimens with
various adhesive and adherend thickness were prepared and tested in this study. The width of the
specimens was 25.4 mm, the length was 200 mm, and the thickness of the adhesive layer was controlled to
be 0.5 mm. The adhesive used was Dow Chemical epoxy resin D.E.R. 331 mixed with a M-5 silica filler, a

121
dicyandiamide (“dicy”) curing agent, a tertiary amine accelerators (PDMU), and a rubber toughener
(Kelpoxy G272-100). The details of the adhesive formulation procedure can be found in Vrana et al. [26].
The final products, according to the rubber concentration level, were designated as adhesive A (0% rubber),
B (4.1%), C (8.1%), and E (15%). Adherends were aluminum 6061-T6 alloy. Before bonding, the surfaces
of the adherends were treated with three different kinds of surface preparation methods: acetone wipe,
which was used simply to provide surface uniformity among specimens; base-acid etch, which was used as
a deep cleaning procedure [14, 15]; and P2 etch, which, according to Wegman [14], can greatly improve
the surface morphology and chemistry of the aluminum substrates and therefore can significantly improve
adhesion. The specimens were cured at 170oC for 90 minutes, cooled to room temperature, then stored in a
desiccator prior to testing.
The material properties of the cured adhesive were characterized using differential scanning
calorimetry (DSC) (for the glass transition temperature Tg), thermal mechanical analysis (TMA) (for
coefficient of thermal expansion (CTE) α2), and room temperature dogbone tensile tests (for the Young’s
modulus E2). The results shown in Table 1 indicate that as the rubber concentration increases, the CTE of
the material increases but the modulus and the glass transition temperature decrease slightly. To simplify
the analysis, the Poisson’s ratio for all the adhesives are estimated as ν2 = 0.33 at room temperature. The
material properties for the aluminum 6061-T6 substrate are Young’s modulus E1 = 70 GPa, Poison’s ratio
ν1 = 0.33, and CTE C1026 o61
−×=α .
Due to the mismatch of the coefficients of thermal expansion, an equal bi-axial residual stress σ0
was induced throughout the adhesive layer after curing of the specimens. If the adherends are assumed to
be relatively thick and rigid as compared to the adhesive, the residual stress is then given by
( )( )tsft122
20 TT
1
E −α−αν−
=σ Equation 8
Tsft in Equation 8 is the stress free temperature of the adhesive, which was measured using a curvature
measurement technique for each adhesive [27] and was very close to the glass transition temperature (the
results are also listed in Table 1); Tt is the testing temperature (room temperature in this study). Since the
coefficients of thermal expansion of the adhesives increased with rubber concentration and meanwhile the
modulus and the glass transition temperature decreased slightly, as shown in Table 1, the calculated
residual stresses induced in the specimens during the curing were very similar for all the adhesives. On the
other hand, as will be discussed later, the rubber toughener enhanced the fracture toughness of the adhesive
bonds significantly.
To alter the T-stress levels in the specimens, the DCB specimens were mechanically stretched in a
universal testing machine uniaxially as discussed in reference 13 until the substrates were plastically
122
deformed. An extensometer was attached to the specimens to monitor the strain. Due to the plastic
deformation εp in the adherends, the residual stress in the specimen was increased and is given by [28]
( )
( ) p1222
20yy
p2122
20xx
1
E
11
E
εν−νν−
+σ=σ
ενν−ν−
+σ=σ Equation 9
where σ0 is the thermal residual stress induced in the curing procedure of the adhesive bonds. Due to
increase in the residual stress, the T-stress was also increased and the final state of the T-stress was
calculated using the finite element method for different testing geometries. Details of the calculations can
be found in reference 13.
The fracture testing and post-failure analysis methods used in this paper are quasi-static DCB
tests, low-speed impact tests on DCB geometry, and end notch flex (ENF) tests. After failure, post-failure
analyses including X-ray photo-electron spectroscopy (XPS), scanning electron microscopy, and Auger
depth profile were conducted on the failures surfaces to determine the locus of failure. All the testing
methods and post-failure analyses procedures were introduced in reference 10 and further details can be
found in the literature referenced in referenced [10].
TEST RESULTS AND DISCUSSION
Surface Preparation and Mixed Mode Fracture Tests
To investigate the effect of surface preparation on the locus of failure in adhesive bonds under
mixed mode fracture tests, both quasi-static DCB and ENF tests were conducted on specimens with
adherend surfaces prepared with acetone wipe, base-acid etch, and P2 etch. The adhesive used was
adhesive C and all the specimens tested were as-produced with negative T-stress levels [13]. For the ENF
tests, specimens were symmetric and for the DCB tests, specimens were both symmetric and asymmetric
with three different adherends thickness ratios, i.e. h/H = 0.5, 0.75, and 1, which gives rise a fracture mode
mixity of ψ = 30o, 20o, and 0o, respectively [10]. The failure surfaces were first examined visually, and one
typical specimen was selected from each test for subsequent XPS and Auger depth to identify the locus of
failure. The XPS analysis was carried out on two representative areas on both the aluminum and the
adhesive sides of each failed specimen. On the other hand, the Auger depth profiling was only conducted
on two small areas on the aluminum side of the failure surfaces. For both tests, only the average values are
reported in this paper.
Table 2 shows the XPS results for each test. Five elements, carbon, aluminum, nitrogen, silicon,
and oxygen were detected on the failure surfaces and their concentrations varied with the testing
conditions. Since the major sources for each element are already clear [10], carbon is mainly from the

123
epoxy adhesive and aluminum is exclusively from the aluminum adherend. Variations in the
concentrations of these elements imply changes in the locus of failure in the specimens. In Table 2, the
carbon concentration on the failure surfaces decreases with fracture mode mixity while the aluminum and
oxygen concentrations increase, indicating that failure tended to be more interfacial as the mode mixity
increased as discussed in reference 10. On the other hand, as the surface preparation method varies, the
element concentrations, especially for carbon and aluminum, also vary significantly in the tests with mode
mixity GII/G higher than 14%, and the trend of the variation suggests an effect of interface properties on the
locus of failure. For instance, when a more advanced surface preparation method was used, the carbon and
silicon concentrations increased and the aluminum and oxygen concentrations decreased. These results
suggest that advanced surface preparation methods enhance adhesion and displace failure from the
interface.
To further quantify the locus of failure, the epoxy film thicknesses on the failure surfaces of each
specimen were measured. On the failure surfaces of the specimens tested under mode I loading or under
mixed mode loading with a phase angle of 10o, a visible layer of adhesive was observed. For these
specimens, a Nikon Measurescope 2305 was used to measure the epoxy film thickness. On the other hand,
for the specimens tested under mode II loading or under mixed mode loading with a phase angle of 22o, the
failure surfaces appeared to be clear, which indicates that the failure occurred at or near the interface. The
Auger depth profiling method was then used for those specimens, which appeared to fail interfacially.
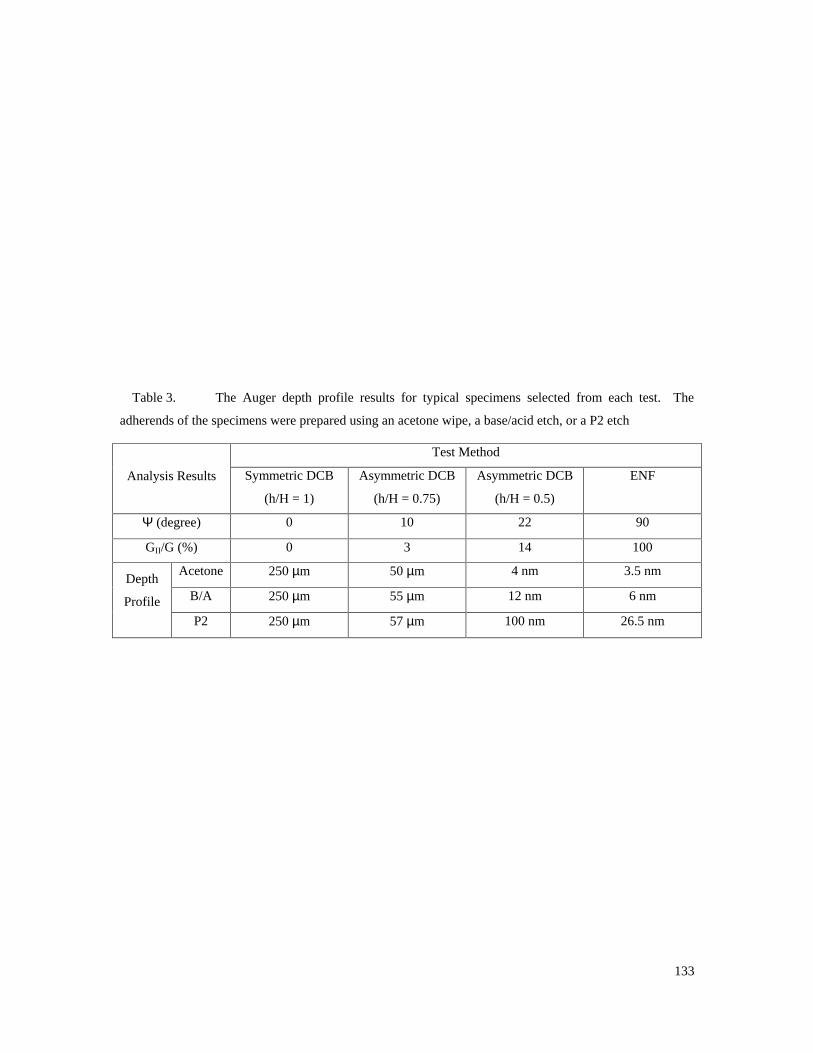
As shown in Table 3, in the mode I test, the thicknesses of the residual adhesive layer on the
failure surfaces were about 250 µm for all the specimens with different surface preparations, which
indicated that the failures all occurred in the middle of the adhesive layer in the test regardless of the
surface preparation method since the total thickness of the adhesive of the specimens was 500 µm. When
the phase angle increased as in the asymmetric DCB test with h/H = 0.75, which contains 3% of mode II
fracture component, a layer of epoxy film with a thickness of around 50 µm was detected on the failure
surfaces of all the specimens. Although the failure was still cohesive, the decrease in the film thickness on
the metal side of the failure surfaces indicated that the locus of failure shifted toward the interface due to
the increase in the mode mixity. On the other hand, because the failure was still cohesive, no significant
effect of interface properties on the locus of failure was observed. When the mode mixity increased to 14%
as in the asymmetric DCB test with h/H = 0.5, where the mode mixity strongly forced the crack toward the
interface, the effect of interface properties on the locus of failure became pronounced. In the specimen
with adherends prepared with acetone wipe, a 4 nm thick epoxy film was detected on the failure surfaces;
in the specimen with adherends treated with base/acid etch, the film thickness was 12 nm; and in the P2
etched specimen, a visible layer of film, which was estimated to be about 100 nm, was observed on the
failure surfaces. This increasing trend in the measured film thickness from the failure surfaces suggested

124
that the advanced surface preparation methods enhance adhesion and displace failure from the interface,
which also confirmed the indications obtained from the XPS analyses. In the ENF test, a similar trend in
the variation of film thickness was observed.
The XPS and the Auger depth profile analyses clearly identify the locus of failure and verify the
analytical prediction made through applying the criteria of direction of cracking to adhesive bonds.
Through testing specimens prepared with different surface preparation techniques, these results also
demonstrated the effect of interface properties on the locus of failure and verify that crack path selection in
adhesive bonds is a result of interactions between external loads and material properties [9]. The results
also indicated that since the locus of failure is very sensitive to the interface properties in the asymmetric
DCB tests with fracture mode mixity of 14% or higher, the asymmetric DCB test can be employed rather
than the ENF test to evaluate the interface fracture properties in adhesively bonded joints. Since the
asymmetric DCB test is conducted under predominantly opening mode, the onset of fracture and the crack
propagation sequence are much easier to observe; this substitution can greatly simply the testing procedure.
Other details of asymmetric DCB analysis and testing can be found in references 29 and 30, where the
fracture behavior of asymmetric DCB specimens prepared using adherends of dissimilar materials were
particularly discussed.
Surface Preparation and the Rate Dependence of the Locus of Failure
In reference 10, the rate dependence of the locus of failure in adhesive bonds was studied. The
adhesive was adhesive C and the adherends were prepared by acetone wipe before bonding. The post-
failure analysis results showed that when the T-stress was negative, the failures were all cohesive and the
cracks were directionally stable regardless of the debond rate; as the T-stress increased, the cracks became
directionally unstable and a very pronounced effect of debond rate on the locus of failure was observed.
The failure was more interfacial when the debond rate was low. To investigate the influence of the
interface properties on the rate dependence of the locus of failure in specimens with high T-stresses, two
groups of symmetric DCB specimens with adherend surfaces prepared using either an acetone wipe or P2
etch were prepared and tested under quasi-static loading condition. A Kodak EktaPro high-speed camera
system was used in the same manner as in reference [10] to monitor the fracture sequence and to obtain the
rate of crack propagation. After failure, a representative specimen from each group of specimens was
selected based on visual examination for the XPS analyses to identify the locus of failure.
In Fig. 5, the failure surfaces of the two representative specimens are shown. The adherend
surfaces of specimen a) were prepared using an acetone wipe, and a P2 etch was used in preparing the
substrates for specimen b). The T-stresses in both specimens were 35 MPa and the magnitude of the crack
propagation rate for different regions of the specimens, which were obtained using the high-speed camera,
were marked along both specimens to quantify the effect of debond rate. Through visual examination of

125
the failure surfaces of specimen a) and b), the influence of surface preparation on the rate dependence of
the locus of failure can be observed. In specimen a), in the region of slow crack propagation, the failure
surface was clear, indicating interfacial failure. On the other hand, in the region of fast crack propagation,
the failure appeared to be cohesive since a visible layer of adhesive film was observed on the failure
surface. However, in specimen b), the difference in the locus of failure between the slow and fast crack
propagation regions was not as pronounced. As a matter of fact, a visible layer of adhesive film was
observed in both regions. Another noticeable difference in the failure surfaces between specimen a) and b)
is that the regions of slow crack propagation in specimen b) were considerably smaller than in specimen a),
indicating that the rate dependence of the locus of failure was significantly reduced due to the variation in
interface properties.
The XPS analyses were conducted on the areas in both the slow and fast crack propagation regions
of each specimen as schematically shown in Fig. 5. The XPS data further identified the locus of failure and
supported the results of visual examinations. As shown in Table 4, for specimen a), the major element
concentrations on the failure surfaces, especially carbon and aluminum, varied significantly between the
slow and the fast crack propagation regions and indicated that the failure was more interfacial in the region
of slow crack propagation. On the other hand, for specimen b), although the variations of the major
element concentrations between the slow and the fast regions also indicated a similar trend in the rate
dependence of the locus of failure, the magnitude of the variation suggested that this debond rate effect in
specimen b) was not as pronounced as in specimen a).
Overall, the comparison of the rate dependence of the locus of failure between the two
representative specimens with different surface preparations revealed that the interface properties
significantly affect the crack propagation behavior. Advanced surface preparation techniques enhance the
adhesion between the adhesive and the substrates and consequently, the rate dependence of the locus of
failure is reduced.
Fig. 5 also shows that the characteristic length of the crack propagation in specimen a) is smaller
than that in specimen b), indicating an influence of interface properties. As discussed in the analytical
section of this paper, the characteristic length of the crack varies with the material mismatch factors α and
β. Fig. 5 suggests that because more advanced surface preparation technique was used in preparing
specimen b), the adhesion was improved and the consequently, the material mismatch in the vicinity of the
interface was also altered as compared to specimen a). Since in the alternating crack propagation, the
failure occurred at or near the interface, consequently, different characteristic lengths of the crack were
resulted between specimen a) and b).

126
Asymmetric Surface Preparation and the Directionally Unstable Cracks
In reference 10, the effect of mixed mode fracture on the directional stability of cracks was
studied. Asymmetric DCB specimens with different adherends thickness ratios were tested. The results
showed that the direction of crack propagation is stabilized very rapidly as the mode mixity increases;
when the mode mixity GII/G is more than 3%, cracks in the specimens were all directionally stable
regardless of the T-stress levels. In this study, the effect of asymmetric surface preparation on the
directionally unstable cracks is of interest. Geometrically symmetric DCB specimens with one adherend
prepared using an acetone wipe and the other using a P2 etch were prepared using adhesive C and they
were tested under mode I low-speed impact conditions. The low-speed impact was chosen due to the
reason that the rate of crack propagation was relatively constant in this test according to the results in
reference 10 and therefore, the effect of debond rate on the locus of failure was minimized. Before the
tests, each specimen was mechanically stretched to achieve a high residual stress state [13] (and
consequently to achieve a high T-stress state) such that alternating crack propagation was observed in the
specimen. After failure, post-failure analyses via XPS and Auger depth profile were conducted on the
failure surfaces of a typical specimen to identify the locus of failure and the crack propagation trajectory.
Shown in Fig. 6 are the failure surfaces of the typical specimen selected. The T-stress in the
specimen was 36 MPa and the crack trajectory alternated between the two interfaces, which can be
observed in the side-view photograph. To further identify the locus of failure, both the XPS and Auger
depth profile analyses were conducted on representative areas of both sides of the specimen as
schematically shown in Fig. 6 and the results are listed in Table 5. The XPS results show that the carbon
and silicon concentrations on the acetone wiped adherend surface are lower than on the P2 etched adherend
surface whereas the aluminum and oxygen concentrations are much higher. This trend of the variation of
the major element concentrations on the failure surfaces indicates that the locus of failure on the acetone
wiped adherend side was more interfacial than on the P2 etched adherend side. The exact locations of the
failure on both adherends surfaces were revealed by the Auger depth profile data as shown in the Table 5.
On the surfaces of the adherend prepared using the acetone wipe, a layer of adhesive film of 0.6 µm thick
was detected. However, on the surfaces of the adherend prepared using the P2 etch, the adhesive film
detected was much thicker (1.4 µm), which indicated that the failure was more cohesive.
Toughness of the Adhesive and the Directional Stability of Cracks
As pointed out by Pocius [31], the directional stability of cracks is significantly affected by the
fracture toughness of adhesive bonds. Using an energy model, Chen and Dillard [12] later analyzed energy
flows during the crack propagation in adhesively bonded DCB specimens and predicted that directionally
unstable cracks are more unlikely to occur as the fracture toughness of the adhesive bonds increase. To
verify the prediction, DCB specimens using adhesive A, B, C and E were prepared. Due to the various

127
levels of rubber concentration in the adhesives, the fracture toughness of the DCB specimens varied with
the adhesive. Shown in Fig. 7 are the critical fracture toughnesses measured in the quasi-static tests for the
DCB specimens using different adhesives, which indicates that the fracture toughness of the bonds
increased significantly with rubber concentration level. After the specimens were prepared, they were
subjected to mechanical stretching until plastic deformation occurred in the adherends to achieve various
levels of the T-stress in the specimens [13]. The specimens were then tested under low-speed impact
loading to achieve a relatively constant debond rate in the tests. After failure, the failure surfaces in each
specimen were carefully examined to determine crack trajectory and the crack propagation manner.
Shown in Fig. 8 are typical failure surfaces observed in as-produced specimens. Specimen a) was
bonded using adhesive A, which contains no rubber toughener and is the most brittle adhesive in the series.
The failure surfaces of this specimen revealed an alternating crack trajectory, which indicated that the crack
propagation was directionally unstable. As the rubber concentration increased in the adhesive as in
specimen b), c) and d), the failures all appeared to be cohesive with directionally stable crack trajectory. A
similar trend had been observed in stretched specimens. All three specimens in Fig. 9 contained 1.1%
plastic deformation in the adherends and from specimen a) to c), the rubber concentration in the adhesive
increased from 4.1% to 15.0%. Examinations of the failure surfaces of theses specimens indicate that the
crack was directionally unstable in specimen a) and became more and more stable in specimen b) and c).
Fig. 8 and 9 reveal that the directional stability of the crack is significantly affected by the rubber
concentrations in the adhesives. This observation is consistent with the prediction made by Pocius [31] and
Chen and Dillard [12]. As the rubber concentration in the adhesive increases, the fracture toughness of the
bonds also increases. Consequently, as indicated by Fig. 1, all the curves shift down and the transition
from directionally stable cracks to directionally unstable cracks is more unlikely to occur.
CONCLUSIONS AND COMMENTS
This paper investigated the role of materials properties in the crack path selection of adhesively
bonded joints. Through the study, the following conclusions are made:
1. Through a parametric study of directionally unstable cracks in adhesively bonded joints, the
characteristic length of the directionally unstable crack was found to be closely related to the
material mismatch of the system: the characteristic length increases as the Dundurs’
parameter α decreases.
2. The experimental results showed that failure tends to be more interfacial as the fracture mode
mixity increases, which verifies the analytical prediction made through applying the criteria of
direction of cracking to adhesive bonds. On the other hand, this study also showed that
advanced surface preparation methods could improve the interface properties and

128
consequently prevent failures at the interfaces. This result demonstrates the effect of interface
properties on the locus of failure and verifies that crack path selection in adhesive bonds is a
result of interactions between external loads and material properties [9].
3. More advanced surface preparation techniques enhance the adhesion and improve the
interface properties. As a result, the rate dependence of the locus of failure can be greatly
reduced.
4. Through testing the DCB specimens with one adherend treated with P2 etch and the other
treated with acetone wipe under low-speed impact, the effect of asymmetric surface
preparation on the directionally unstable cracks was studied. The results indicated that due to
the asymmetric interface properties, the locus of failure was different on each side of the
specimens and the centerline of the directionally unstable crack trajectory was shifted toward
the interface of poor adhesion.
5. Through testing DCB specimens made using adhesives with various rubber concentrations,
the effect of the fracture toughness of the adhesive bonds on the crack propagation manner
was demonstrated. As predicted by Pocius [31] and Chen and Dillard [12], the experimental
results showed that as the fracture toughness of the adhesive bonds increases, the transition
from the directionally stable cracks to directionally stable cracks is more unlikely to occur.
ACKNOWLEDGMENTS
The authors wish to thank the National Science Foundation - Science and Technology Center for
High Performance Polymeric Adhesives and Composites #DMR-912004 for supporting this research. The
authors would also like to acknowledge the interdisciplinary forum provided by the Center for Adhesive
and Sealant Science as well as facilities provided by the Engineering Science and Mechanics Department
and the Chemistry Department. We also wish to thank Dr. Charlie Berglund and the Dow Chemical
Company for providing the epoxy resin, and Dr. Alphonsus from 3M company for helpful comments and
suggestions.

129
REFERENCES
1. Cotterell, B. and Rice, J. R., Slightly curved or kinked cracks. International Journal of
Fracture, Vol. 16, No. 2, 1980.
2. Hutchinson, J. W. and Suo, Z., Mixed mode cracking in layered materials, Advances in
Applied Mechanics, Vol. 29, pp.63-191, 1992.
3. Lasson, S. G. and Carlsson, A. J., Influence of non-singular stress terms and specimen
geometry on small-scale yielding at crack tips in elastic-plastic materials. J. Mech. Phys.
Solids, 21, pp. 263-277, 1973.
4. Fleck, N. A., Hutchinson, J. W., and Suo, Z., Crack path selection in a brittle adhesive layer,
Int. J. Solids and Structures, Vol. 27, No. 13, pp 1683-1703, 1991.
5. Willams, M. L. On the stress distribution at the base of a stationary crack, J. Applied
Mechanics, 24, pp. 109-114, 1957.
6. Akisanya, A. R. and Fleck, N. A. Analysis of a wavy crack in sandwich specimens,
International Journal of Fracture, 55, p29-45, 1992.
7. Akisanya, A. R. and Fleck, N. A. Brittle fracture of adhesive joints, International Journal of
Fracture, 58, p93-114, 1992.
8. Daghyani, H. R., Ye, L., and Mai, Y. M., Effect of thermal residual stress on the crack path in
adhesively bonded joints. Journal of Materials Science. 31, 2523-2529, 1996.
9. Dillard, D. A., Chen, B., Parvatareddy, H., Lefebvre, D., and Dillard, J. G., Where does it fail,
and what does that mean? J. Adhesion. (in preparation).
10. Chen, B., Dillard, D. A., Dillard, J. G., and Clark, R. L. Jr., Crack path selection in adhesively
bonded joints: the roles of external loads and specimen geometry, J. Adhesion. (in
preparation).
11. Goldstein, R. V. and Salganik, R. L., Brittle fracture of solids with arbitrary cracks.
International Journal of Fracture, Vol. 10, No. 4, 1974.
12. Chen, B. and Dillard, D. A., Numerical analysis of the directionally unstable crack
propagation in adhesively bonded joints. Int. J. Solids and Structures. (in preparation)
13. Chen, B. and Dillard, D. A., The effect of the T-stress on the crack path selection in
adhesively bonded joints, J. Adhesion (in preparation).
14. Wegman, R. F., Surface preparation techniques for adhesive bonding, Noyes publications,
Park Ridge, New Jersey, 1989.
15. Minford, J. D., Handbook of aluminum bonding technology and data, Marcel Dekker, Inc,
1993.

130
16. Hal F. Brinson, Engineered material handbook, Vol. 3, Adhesives and sealants, ASM
International, The Material Information Society, 1990.
17. Chai, H., A note on crack trajectory in an elastic strip bounded by rigid substrates, Int. J.
Fracture, 32, pp. 211-213, 1987.
18. Suga, T., Elssner, E., and Schmander, S., Composite parameters and mechanical compability
of material joints, J. Composite Materials, 22, pp. 917-934, 1988.
19. ABAQUS, Version 5.8, Hibbitt, Karlsson & Sorenson, Inc, 1998.
20. Franc2D/L: A crack propagation simulator for plane layered structures, Version 1.4, Swenson,
D. and James, M., Kansas State University.
21. Williams, M. L., The stress around a fault or crack in dissimilar media, Bulletin of
Seismological Society of America, Vol. 49, No. 2, pp199-204, 1959.
22. Hutchinson, J. W., Mear, M. E., and Rice, J. R., Crack paralleling an interface between
dissimilar materials, Journal of Applied Mechanics, Vol. 54, pp. 828-832, 1987.
23. Suo, Z., and Hutchinson, J. W., Sandwich test specimens for measuring interface crack
toughness, Materials Science and Engineering, A107, pp. 135-143, 1989.
24. Hill, D. A., Kelly, P. A., Dai, D. N., and Korsunsky, A. M., Solution of crack problem, the
distributed dislocation technique, Kluwer Academic Publishers, 1996.
25. Dattaguru, B., Venkatesha, K. S., Ramamurthy, T. S, and Buchholz, F. G., Finite element
estimates of strain energy release rate components at the tip of an interface crack under mode
I loading, Engineering Fracture Mechanics, Vol. 49, No. 3, pp. 451-463, 1994.
26. Vrana, M. A., Dillard, J. G., Ward, T. C., Rakestraw, M. D., and Dillard, D. A., The influence
of curing agent content on the mechanical and adhesive properties of Dicyandiamide cured
epoxy systems. J. Adhesion, Vol. 55, pp. 31-42, 1995.
27. Dillard, D. A., Park, T. G., Zhang, H., and Chen, B., Measurement of residual stresses and
thermal expansion in adhesive bonds. (in preparation).
28. Dillard, D. A., Chen, B., Chang, T., and Lai, Y. H., Analysis of the notched coating adhesion
test. J. Adhesion. Vol. 69, pp. 99-120, 1999.
29. Xiao, F., Hui, C. Y., Kramer, E. J., Analysis of a mixed mode fracture specimen: the
asymmetric double cantilever beam, Journal of Materials Science, 28, pp. 5620-5629, 1993
30. Sundararaman, V. and Davidson, B. D., An unsymmetric double cantilever beam test for
interfacial fracture toughness determination, Int. J. Solids and Structures, Vol. 34, No. 7, pp.
799-817, 1997.
31. Pocius, A., Verbal communication, 1998.

131
Table 1. Material characterization results of the epoxy adhesive formulations used in the study.
Adhesive
Designation
Rubber
Concentration
CTE
(10-6/oC)
Tg
(oC)
Modulus
(GPa)
Calculated
Residual Stress
(MPa)
A 0% 58 125 3.10 14.8
B 4.1% 59.5 119 3.06 14.38
C 8.1% 62 112 2.97 13.8
E 15.0% 65 106 2.85 13.4

132
Table 2. The XPS elemental analysis results for typical specimens selected from each test. The
adherends of the specimens were prepared using an acetone wipe, a base/acid etch, or a P2 etch.
Test Method
Analysis Results Symmetric DCB
(h/H = 1)
Asymmetric DCB
(h/H = 0.75)
Asymmetric DCB
(h/H = 0.5)
ENF
Ψ (degree) 0 10 22 90
GII/G% 0 3 14 100
Acetone 76.4 76.3 53.0 44.5
B/A 76.5 76.5 73.1 45.5 C%
P2 76.4 76.4 74.0 52.8
Acetone 0.2 0.3 9.3 14.8
B/A 0.3 0.5 1.9 13.7 Al%
P2 0.1 0.2 0.4 9.1
Acetone 18.7 18.8 31.8 36.7
B/A 18.6 17.9 19.0 34.4 O%
P2 18.8 18.5 18.1 31.9
Acetone 2.6 2.5 2.6 2.0
B/A 2.4 2.7 2.0 2.4 N%
P2 2.7 2.6 3.0 2.6
Acetone 2.1 2.3 3.6 2.0
B/A 2.2 2.4 4.0 4.0 Si%
P2 2.0 2.0 4.5 36
133
Table 3. The Auger depth profile results for typical specimens selected from each test. The
adherends of the specimens were prepared using an acetone wipe, a base/acid etch, or a P2 etch
Test Method
Analysis Results Symmetric DCB
(h/H = 1)
Asymmetric DCB
(h/H = 0.75)
Asymmetric DCB
(h/H = 0.5)
ENF
Ψ (degree) 0 10 22 90
GII/G (%) 0 3 14 100
Acetone 250 µm 50 µm 4 nm 3.5 nm
B/A 250 µm 55 µm 12 nm 6 nm Depth
Profile
P2 250 µm 57 µm 100 nm 26.5 nm

134
Table 4. The XPS elemental analysis results of the symmetric DCB specimens with either an acetone wipe or a P2 etch surface preparation.
XPS Atomic Percentage Specimen
Surface
Treatment
Region
Analyzed C% Al% O% N% Si%
Fast 76.1 0.4 16.8 2.5 4.3 A Acetone
Slow 72.3 2.1 20.9 2.6 2.1
Fast 76.5 0.2 16.9 4.3 2.1 B P2
Slow 75.9 0.9 15.7 4.1 3.4

135
Table 5. The XPS elemental analysis results on the failure surfaces of the DCB specimen with asymmetric surface preparation.
XPS Atomic Percentage Surface
Treatment %C %Al %O %Si %N
Film Thickness
Acetone 75.8 0.9 17.2 3.8 2.3 0.6 µm P2 76.7 0.1 16.5 4.5 2.2 1.4 µm