Embed Size (px)
Citation preview

119
CHAPTER 5: CONCEPTUAL FRAMEWORK, RESEARCH DESIGN AND METHODS
“Every man who knows how to read has it in his power to magnify himself, to
multiply the ways in which he exists, to make his life full, significant and
interesting.”
Aldous Huxley
This study mainly proposes to identify, illuminate and explain relationships
between some major factors associated with successful reading at Grade 5
level in South African primary schools.
As a secondary analysis of PIRLS 2006 South African data, this study’s use of
Creemers’ Comprehensive Model of Educational Effectiveness as conceptual
framework with methods of multi-level analyses will attempt to investigate South
African learners’ reading performance when given reading tasks in the language
of learning and teaching (LOLT). The conceptual framework and design for this
study acknowledge an underlying supposition taken by the researcher, which is
that the causal elements and reasons for struggling to read are not the same for
all learners. On that basis, a uniform curriculum is necessary, but discretion is
needed in how it is implemented, since it should serve as a guide. A singular or
a one-dimensional explanation for learners’ poor reading performance is equally
inappropriate and inadequate in addressing a vastly varying and diverse learner
population in South Africa.
In understanding the reasons for poor reading performance, and identifying
those factors that can be associated with successful readers and with readers
at risk of failure, three systems seem to be of major influence in reading
performance, namely the home, the school and the learners themselves.
Factors pertaining to Grade 5 learners, through their home environment, the
classroom and the school, which could impact on reading performance, will be
identified in this study and used to map learner profiles within each of the
language groups in South Africa.

120
The remainder of this chapter will provide a detailed outline of the conceptual
framework and the adaptation of Creemers’ Comprehensive Model of
Educational Effectiveness to that of a model of reading effectiveness for the
purposes of guiding the data analysis process for this study (section 5.1 and
5.2). Discussions of the conceptual framework are followed by the research
questions to be addressed, a discussion of the research design and methods
that will be employed in addressing the research questions (section 5.3 and
5.4). The chapter concludes with insight into some design issues pertaining to
this study and the nature of the data source (section 5.5).
5.1. CONCEPTUAL FRAMEWORK
In understanding not only the reasons for poor reading achievement, but also
identifying those factors that can be associated with successful readers and
those with readers at risk of failure, three contextual systems seem to be of
major influence in reading achievement, namely the school, the home and the
learners themselves.
The conceptual framework for this study aims to guide the analysis process and
the interpretation of results. Closely linked to the conceptual framework that was
chosen for the purposes of this study is the tripartite curriculum model that
characterizes the nature of PIRLS 2006, a model that is shared with other
international comparative studies similar to PIRLS 2006.
According to Shorrocks-Taylor and Jenkins (2001), the IEA’s tripartite model of
the curriculum manifests itself in three ways: what society would like to see
taught in the education system (the intended curriculum), what is actually taught
(the implemented curriculum), and what is learnt (the attained curriculum). In his
sequential explanatory study of factors connected with science achievement in
six countries using TIMSS (Trends in International Mathematics and Science
Study) 1999 data, Reinikainen (2007) refers to the focus on the curriculum as a
broad explanatory factor underlying learner achievement. The manifestations of
the curriculum that bore relevance to the TIMSS 1999 study are also significant

121
for the PIRLS 2006 study. Building on this conceptualisation of the education
process, studies like TIMSS and PIRLS seek to assess by means of contextual
questionnaires those factors at the level of system, school, teacher and learner
that are likely to influence learner achievement. Figure 5.1 (below) illustrates
these manifestations of the curriculum:
Figure 5.1: Conceptual Framework for International Comparative Studies
The rationale for a country like South Africa to participate in an international
comparative study such as PIRLS 2006 should not be regarded as an exercise
to determine its standing on a long list of countries. Rather, the conceptual
framework provided by the IEA in terms of curricular focus and the differences
between what was intended, what was implemented and what was attained
should be regarded as the guiding force behind participation, subsequent
results and their interpretation.
Before the commencement of this study, the state of reading achievement was
explored. This process of exploration entailed general reflections and
rudimentary ideas around the reasons for poor reading achievement among
children. In imagining what was needed for reading success, initial ideas
followed a linear, enabling path beginning with one system, the learner. The
initial model included the home as second system and ended with the third
system, the school, where enabling factors were imagined to be present to lead
to reading success. Some of these enabling factors are aspects the child is
likely to encounter first within him- or herself, e.g. the motivation to read and a
General Social and Educational Contexts Intended Implemented Attained Curriculum Curriculum Curriculum
Local, Community and School Contexts
Implemented Curriculum
Personal Background Attained Curriculum

122
steady developmental progress, and that should be present to provide the child
with an advantage and preference for reading early in his or her life. In addition
to a learner’s inner resources, the home factors represent those enabling
factors that should be present so as to support success in reading, e.g. reading
as a part of the child’s daily routine at home, and the home environment which
ensures that the child has early pleasurable reading experiences. The third
identified system that should build on the enabling factors found in the home
and within the child was specifically factors which should be in the school, e.g.
effective teaching practices, and provision of frequent opportunities to learn to
read.
Given these three systems, with the enabling circumstances present in all three
elements, the end result should be an enabled reader who has the ability to
read to learn. However, the flipside of an enabling path would also be possible,
where the same three systems (the learner, the home and the school) can be
characterized by disenabling circumstances, ultimately leading to a disenabled
reader who does not have the ability to read to learn.
For the majority of South African fourth grade learners, the picture may be more
complex. It is hypothesized that an extensive interaction between the three
systems of factors in these two conceptual pathways (to enablement or its
converse) is more likely to occur than either of the two stark extreme
combinations. In reality there is a plethora of combinations of factors, and each
combination may give rise to its own profile of literacy outcomes. For example,
a child may come from an enabling home environment, but could have some
disenabling factors pertaining to his or her own development that could result in
him or her attending an ineffective school environment. These circumstances
would likely result in the child not being an enabled reader. On the other hand, a
child may come from an ineffective household, but may be developmentally at
an advantage and may attend an effective school. This scenario may result in
the child being an enabled reader who uses reading to learn. Another scenario
might be that of a child from an ineffective household, who despite being
developmentally advantaged, may then find him or herself at an ineffective

123
school, possibly resulting in the child becoming an ineffective, disenabled
reader.
It can simply be noted that by allowing for each of the three contexts to be at
one of two levels, advantaging or disadvantaging, eight explanatory scenarios
can be depicted, in the following way:
Scenario 1: A A A
Scenario 2: A D A
Scenario 3: D A A
Scenario 4: D D A
Scenario 5: A A D
Scenario 6: A D D
Scenario 7: D A D
Scenario 8: D D D
Figure 5.2: Explanatory Scenarios of Advantaging and Disadvantaging Factors Associated with Reading Achievement.
With these initial reflections in mind, Creemers’ Comprehensive Model of
Educational Effectiveness for schools was used as a point of departure for this
study, as this model most closely supports preliminary ideas described in the
previous paragraphs and has relevance to already existing reading
achievement literature. Creemers’ work provides an extensive, multi-level
analytical model in this study’s attempt to evaluate achievement across
language groups.
Advantaging (A) Disadvantaging (D)
HOME
Advantaging (A) Disadvantaging (D)
LEARNER
Advantaging (A) Disadvantaging (D)
SCHOOL

124
5.1.1. Creemers’ Comprehensive Model of Educational Effectiveness
Creemers’ model focuses on the explanation of learner outcomes by alterable
educational factors through discerning, contrasting but connected levels of
structure for effectiveness in education (Creemers & Reezigt, 1999). Higher
levels provide conditions for learner achievement, and educational outcomes
are induced by the combined effects of levels. The original model has four
levels, namely the learner, classroom, the school and the context (or country).
Kyriakides, Campbell and Gagatsis (2000) regard Creemers’ model as an
extension of Carroll’s model of school learning (1963), which asserts that the
degree of mastery is a function of the ratio of the amount of time learners
actually spend on learning tasks to the total amount of time they need.
According to the Carroll model, time spent on learning is defined as equal to the
minimum value of three variables, namely opportunity or time allowed for
learning, perseverance or the time learners are willing to spend actively
engaging in reading activities and aptitude, understood as the amount of time
needed to learn under optimal instructional conditions.
According to Kyriakides et al. (2000), Creemers added to Carroll’s model of
learning, specifically in respect to the general concept of opportunity to learn.
Thus, in Creemers’ model, time and opportunity are discerned at the classroom
and school-level, making a distinction between actually used time and available
opportunity. Bos (2002) explains that Creemers therefore emphasized the
availability of time and opportunity at the classroom-level, while at the learner-
level referring to actual time used and opportunity to learn. With regards to
quality of instruction, Creemers identified three components at the classroom-
level, namely curricular materials, grouping procedures and teacher behaviour.
According to Bos (2002), by using each of these three components, several
combinations of characteristics could constitute the effective scenario. Isolated
characteristics are not effective in themselves, because influences on learner
achievement are multi-level in nature (Kyriakides & Creemers, 2003).

125
Creemers based his model on four assumptions, namely that the time-on-task
and the opportunity used at the learner-level are directly related to learner
achievement. Secondly, the context, school and classroom-levels permeate
time-on-task and opportunities used at the learner-level. Thirdly, Creemers
stated that the higher level factors dominate conditions and have a partial
causal effect upon the lower levels, thus factors at the context (or country) level
partly determine factors at the school-level, which in turn partly determine what
occurs in the classroom, and lastly classroom factors in turn partly affect learner
factors. Fourthly, all of the factors influence learner achievement (Kyriakides &
Creemers, 2006).

126
Levels: Characteristics of Quality, Time and Opportunity: Formal
Criteria:
Figure 5.3: Creemers’ Comprehensive Model of Educational Effectiveness (Bos, 2002).
Context Quality: Policy focusing on effectiveness Indicator system/policy on evaluation National testing system Training and support system Funding based on outcomes Time: National guidelines for time schedule Supervision of time schedules Opportunity: National guidelines for curriculum
Consistency Constancy Control
School
Quality: Rules and agreement about instruction (educational) Evaluation policy/system Quality: Policy on intervention and supervision (organizational) School culture including effectiveness Time: Time schedule Rules and agreements about time use Orderly and quiet atmosphere Opportunity: School curriculum Consensus about mission Rules on curriculum implementation
Consistency Cohesion Constancy Control
Quality of instruction: Explicitness and ordering of goals (curriculum) Structure and clarity of content Advance organizers Evaluation Feedback Corrective instruction Grouping procedure: Mastery learning Ability grouping Cooperative learning dependent on:
- differential material - evaluation - feedback - corrective instruction
Teacher behavour: Management/orderly atmosphere Homework High expectations Clear goal setting
- restricted set of goals - emphasis on basic skills - emphasis on cognitive learning and transfer Structuring the content - ordering of goals and content - advance organizers - prior knowledge Clarity of presentation Questioning Immediate exercises Evaluation Feedback Corrective instruction
Consistency
Classroom
Time for learning, opportunity to learn
Time-on-task, opportunities used
Motivation
Aptitude, social background
Basic skills Higher order skills Metacognitive skills
Learner

127
Creemers also introduces formal criteria of consistency, cohesion, constancy
and control to the model (Creemers & Reezigt, 1999). Consistency occurs when
the factors associated with the effectiveness of classrooms, schools and
contexts are in support of one another. Consistency is taken care of, requires a
prior cohesion present when members of the school team are aware of the
need for consistency and act in accordance with what has been agreed upon in
the interest of the school. Cohesion requires a suitable constancy of school-
level factors from year-to-year, for example, schools should not change their
rules and policies on a regular basis. Lastly, control includes not only the
evaluation of learners, but also the practice of teachers holding themselves and
others responsible for effectiveness. These formal criteria emphasize the
importance of factors over time and of mechanisms to ensure effectiveness
(Creemers & Reezigt, 1999).
Kyriakides and Creemers (2003) re-worked the original model of Educational
Effectiveness and tested what they refer to as the Dynamic Model of
Educational Effectiveness. Creemers’ original model is based on the
assumptions that the influence of learner achievement is multi-level, thereby
referring to factors at different levels, including the context (or country), the
school, classroom and the learner (Creemers & Kyriakides, 2005). The original
model makes provision for direct and indirect relations between the levels that
may not be linear in nature, but envisaged somewhat static or simultaneous set
of relationships. In the dynamic model, however, the same assumptions are still
held true, but Creemers added a provision that the classroom, school and
context (or country) factors could also be contrasted or measured across time,
by taking into account additional five dimensions namely, frequency, focus,
stage, quality and differentiation
According to Creemers and Kyriakides (2005), frequency refers to the regularity
of occurrence of an activity associated with an effectiveness factor in a
country’s educational system, school or classroom. Two aspects of focus are
identified, the first referring to the extent of specificity of the activities (specific to
general), the second referring to the purpose for which an activity is taking
place. In this proposed dynamic model, stage refers to the continuity with which

128
a factor occurs in order for its direct or indirect effect on learner achievement to
be observed. Next, quality is also viewed in two ways in the dynamic model, first
referring to the properties of a particular factor but secondly also in terms of its
impact on the corresponding taught subjects. Finally, differentiation refers to the
extent to which activities associated with a factor are implemented in the same
way for all taught subjects (Creemers & Kyriakides, 2005).
5.1.2. Conceptual Framework for this Study
Bos (2002), in his TIMSS investigation into the benefits and limitations of large-
scale international comparative achievement studies, adopted Creemers’ model
for the purposes of the study. He employed the same four structural levels
suggested by Creemers, but revised the components of quality, time and
opportunity to suit the needs of his investigation.
A similar approach will be followed for the purposes of this study, where
Creemers’ Model of Educational Effectiveness (originally developed as a model
of school effectiveness) will be revised to constitute a model of reading
effectiveness based on data provided by the Progress in International Reading
Literacy Study (PIRLS) 2006. The exact nature of the revision will be discussed
in the next chapter (Chapter 6), following a detailed discussion and description
of PIRLS 2006.
For the purposes of the current study, a decision was also made to make
adaptations to the original Comprehensive Model of Educational Effectiveness
as proposed by Creemers, rather than the newly revised Dynamic Model. The
Dynamic Model makes provision for investigation across time with multiple
times for data collection, but for the purposes of this study, the available cross-
sectional data was collected at one particular time with no follow-up or repeat
measures. The Comprehensive Model of Educational Effectiveness is well
established and has been critically reviewed for its validity in studies of
educational effectiveness. Creemers (in print) states that although a dynamic
model of educational effectiveness is proposed, the original model could

129
provide a starting point for developing a dynamic model of educational
effectiveness research.
5.2. A SOUTH AFRICAN MODEL OF READING EFFECTIVENESS
Table 5.1 shows the adaptations of Creemers’ Model to serve as a model of
reading effectiveness, using variables from the PIRLS 2006 contextual
questionnaires as source.
Table 5.1: Factors of Reading Effectiveness as Adapted from Creemers’ Model of Educational Effectiveness Levels Components of
Quality, Time and Opportunity
PIRLS 2006 Variables
School Quality (Educational): Quality: (Organizational) Time: Opportunities Used:
Instructional activities and strategies Governance and organization of educational system Curriculum characteristics and policies Home-school connection
Classroom
Quality: Time: Opportunities Used:
Instructional activities and strategies Demographics and resources Instructional activities and strategies Classroom environment and structure Instructional activities and strategies
Learner
Quality: Time: Opportunities Used: Motivation: Social background: Basic skills/Higher order skills:
Activities fostering reading literacy Learners’ out-of-school activities Home-school connection Learners’ and parents’ reading attitudes and self-concept Demographics and resources Home resources Language in the home
The analysis of the PIRLS 2006 achievement and questionnaire data will follow
a confirmatory approach, the implication being that, instead of using all
variables available to the researcher from the different questionnaires, only a
selection of variables that are expected to be related to reading literacy
achievement will be used for analysis purposes. In this way, the study is not

130
guided by the available data alone, but rather existing research into what is
known about the factors that are likely to influence learner achievement are
utilized in order to have a theory to guide the analysis of data. The reader is
therefore asked to be aware that, for the purposes of this study, a confirmatory
rather than an exploratory method was chosen.
The following section provides a detailed description of the precise questions
taken from the PIRLS 2006 questionnaires that will be used for purposes of
analysis as they relate to each identified factor in the adapted model of reading
effectiveness (i.e. how the PIRLS 2006 data relate to the framework).
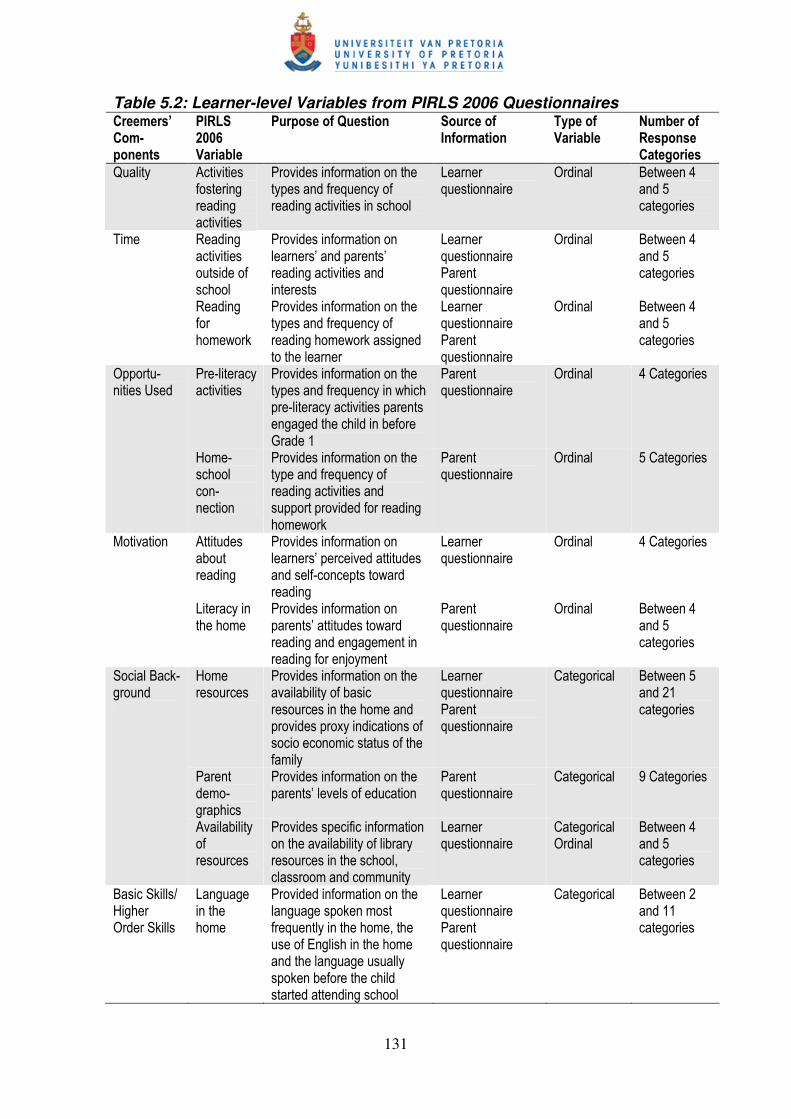
5.2.1. Learner-level Variables
Learner-level variables, as taken from the PIRLS 2006 learners’ and parents’
questionnaires, include factors such as learner demographics, reading activities
outside school, activities fostering reading literacy, reading for homework, the
home-school connection, pre-literacy activities, learner attitudes towards
reading, the availability of resources and language in the home (Table 5.2).
In establishing relationships between these factors at learner-level and learners’
achievement in the PIRLS 2006 reading assessment, the most important factors
can be illuminated, with the expectation that the patterns of these variables and
the strength of their relationship to reading achievement scores will vary for
each language group.
Data is separated according to language grouping, since it is suspected that
diverse patterns may be submerged within the data taken in its entirety.
131
Table 5.2: Learner-level Variables from PIRLS 2006 Questionnaires Creemers’ Com-ponents
PIRLS 2006 Variable
Purpose of Question Source of Information
Type of Variable
Number of Response Categories
Quality Activities fostering reading activities
Provides information on the types and frequency of reading activities in school
Learner questionnaire
Ordinal Between 4 and 5 categories
Reading activities outside of school
Provides information on learners’ and parents’ reading activities and interests
Learner questionnaire Parent questionnaire
Ordinal Between 4 and 5 categories
Time
Reading for homework
Provides information on the types and frequency of reading homework assigned to the learner
Learner questionnaire Parent questionnaire
Ordinal Between 4 and 5 categories
Pre-literacy activities
Provides information on the types and frequency in which pre-literacy activities parents engaged the child in before Grade 1
Parent questionnaire
Ordinal 4 Categories Opportu-nities Used
Home-school con-nection
Provides information on the type and frequency of reading activities and support provided for reading homework
Parent questionnaire
Ordinal 5 Categories
Attitudes about reading
Provides information on learners’ perceived attitudes and self-concepts toward reading
Learner questionnaire
Ordinal 4 Categories Motivation
Literacy in the home
Provides information on parents’ attitudes toward reading and engagement in reading for enjoyment
Parent questionnaire
Ordinal Between 4 and 5 categories
Home resources
Provides information on the availability of basic resources in the home and provides proxy indications of socio economic status of the family
Learner questionnaire Parent questionnaire
Categorical Between 5 and 21 categories
Parent demo-graphics
Provides information on the parents’ levels of education
Parent questionnaire
Categorical 9 Categories
Social Back-ground
Availability of resources
Provides specific information on the availability of library resources in the school, classroom and community
Learner questionnaire
Categorical Ordinal
Between 4 and 5 categories
Basic Skills/ Higher Order Skills
Language in the home
Provided information on the language spoken most frequently in the home, the use of English in the home and the language usually spoken before the child started attending school
Learner questionnaire Parent questionnaire
Categorical Between 2 and 11 categories

132
5.2.2. School and Classroom-level Variables
As part of the PIRLS 2006 assessment, School Questionnaires were
administered to school principals at each of the sampled schools. Grade 5
teachers of the sample of learners also completed the Teacher Questionnaire.
School-level factors include demographics and resources, governance and
organization of the educational system within the school, and curriculum
characteristics and policies. On a classroom-level, factors that are relevant to
building the multi-level model include the classroom environment and structure,
reading assessment practices, reading homework, teacher training and
preparation, the home-school connection and instructional activities and
strategies.
Table 5.3 presents information on those school and classroom variables which
have a likely relationship with reading literacy achievement, that have been
included for analysis purposes in this study.
Table 5.3: School and Classroom-level Variables As Taken from PIRLS 2006 School and Teacher Questionnaires Creemers’ Components
PIRLS 2006 Variables
Purpose of Question
Source of Information
Type of Variables
Number of Response Categories
Classroom environment and structure
Provides information on the types of reading activities, reading instruction and strategies followed to provide opportunities for learners to read
School questionnaire Teacher questionnaire
Categorical Ordinal
Between 3 and 5 categories
Quality (Educational)
Reading assessment
Provides information on how teachers assess learners’ reading proficiency and how information from assessment are utilized to identify problems, address learner progress and ensure acceptable levels of achievement
Teacher achievement
Categorical Ordinal
Between 2 and 4 categories

133
Creemers’ Components
PIRLS 2006 Variables
Purpose of Question
Source of Information
Type of Variables
Number of Response Categories
Demographics and resources
Provides information on class sizes, the availability of resources in the school and more specifically the use and availability of libraries in the school, classroom and community.
School questionnaire Teacher questionnaire
Categorical Ordinal
4 Categories
Quality (Organizational)
Governance and organization of educational system
Provides information on teacher collaboration and time spent on school governing activities
School questionnaire
Categorical Between 2 and 7 categories
Curriculum characteristics and policies
Provides information on the frequency of time-on-task reading instruction
School questionnaire Teacher questionnaire
Categorical Ordinal
Between 3 and 4 categories
Time
Reading homework
Provides information on the types of and frequency of assigning reading homework to learners
Teacher questionnaire
Ordinal Between 4 and 5 categories
Teacher training and preparation
Provides information on how much teachers prefer to read themselves for enjoyment
Teacher questionnaire
Ordinal 4 Categories
Opportunities Used
Home-school connection
Provides information on the schools’ efforts to communicate learner performance and progress with parents, and involving parents in parent-teacher initiatives
School questionnaire Teacher questionnaire
Categorical Ordinal
Between 2 and 5 categories
Instructional activities and strategies
Provides information of opportunities used by teachers to develop learners’
Teacher questionnaire
Ordinal 4 Categories

134
Creemers’ Components
PIRLS 2006 Variables
Purpose of Question
Source of Information
Type of Variables
Number of Response Categories
reading comprehension skills and strategies
5.3. RESEARCH QUESTIONS
According to Rule (2006) South Africa has 15 million people who have had less
than nine years schooling, with estimations of 4.5 million people who have
never been to school. It may well be that a large part of this disadvantaged
population could be functionally illiterate and not able to contribute effectively to
the economy or benefit from it optimally.
The language policy in the South African national educational system seeks to
achieve a number of important imperatives, currently encouraging the use of
mother tongue as a clear departure from past practice. The policy aims to
introduce a diversity of learning opportunities that have largely been unavailable
to learners in the past and promotes effective learning and teaching of
previously neglected indigenous languages. For this reason, the policy is not
intended to deny learners the opportunity to acquire English or another second
language. Rather, its intention is to empower learners by making language-
learning opportunities available in all 11 official languages of South Africa as a
foundational educational experience and base.
The language policy, adopted in 1997, has not been implemented convincingly
at the time of the administration of PIRLS 2006. Resources have not been
made available to give effect to the policy and a poor response exists to
parents’ perceived fears of mother-tongue instruction arising from past practices
of apartheid education. In addition to this lack of implementation, the language
policy has not received a position of prominence similar to other policy shifts
that the educational system has experienced in recent years. The main obstacle
faced in promoting mother-tongue learning seems to be the preference by many

135
parents for their children to be taught in English. To compound this obstacle,
many educators have not been adequately trained to teach in English.
This political and policy background paints the context for the study, which
aimed to investigate the factors associated with reading performance in the
learners’ language of learning, as measured in all South Africa’s 11 official
languages. It should however be stated that the inclusion of language in the
investigation did not direct the research to become a linguistic study. It rather
aimed to use a reading effectiveness model as point of departure. The degree
of fit between theory and gathered data in the form of language-specific results
from PIRLS 2006 can be established in a confirmatory fashion. In this way,
reading literacy theory is used to identify, illuminate and explain the
relationships between factors associated with reading performance of Grade 5
learners in South Africa.
The main research question that guided this research is:
What are the factors that could be associated with Grade 5 learner performance
in reading literacy?
Observations and measurements obtained in at least proxy data3 from the
PIRLS 2006 project were used in an attempt to answer this question. Factors
emanating from contextual questionnaires of Grade 5 learners, their home
environment, their schools and classrooms were identified in conjunction with
learners’ test scores on the PIRLS 2006 achievement tests. For the purposes of
the PIRLS 2006 study, quantitative research methodology was used in the form
of survey research. According to Gay and Airasian (2003), underlying
quantitative research is the belief that the object of study is relatively stable,
uniform and coherent. Thus, it is assumed that a phenomenon (in this case
3 Proxy data refers to explanatory data that aims to establish relationships between a response
and an unobserved, explanatory variable indirectly, by the use of the proxy data in the place of the unobserved explanatory variable. For example, data from contextual questionnaires serve as an approximation of actual conditions and behaviour that are not observed directly, but which may affect reading literacy outcomes.

136
related to the topic of reading literacy) can be measured, understood and
generalizations made.
The main research question can be divided into five sub-questions, the first two
of which are:
1. What is the Grade 5 learner performance on the PIRLS 2006
assessment?
2. What is the extent of variation by language groupings in Grade 5
learners’ reading literacy performance?
Plausible achievement values will be used for sub-question 1 to describe Grade
5 learner performance per language group for all the learners who completed
the PIRLS 2006 achievement booklets. Plausible values are imputed values
and are merely estimates that resemble individual test scores. By construction,
plausible values are computational approximations with a distribution similar to
that of the trait that is being measured and should provide similar and coherent
estimates of population characteristics. The use of plausible values is
appropriate in situations where individuals are administered too few items to
allow precise estimates of their ability. In this case, plausible values will be used
as approximations of learner achievement, since large scale studies in
developing countries prove to have high levels of missing data (Howie, 2002),
thereby making very difficult the task to establish precise estimates of
achievement.
For the purposes of answering question 2, descriptive statistics will be used to
establish and report any variation in reading literacy achievement between
language groupings. For data analysis purposes the IEA’s International
Database Analyser (IDB Analyser) was used, the results of which are presented
in chapter 6. The IDB Analyser is a plug-in for the Statistical Package for the
Social Sciences (SPSS) and was developed by the IEA’s Data Processing and
Research Centre. It was developed specifically to combine and analyse data
from large scale data sets such as those designed for PIRLS, the Trends in

137
Mathematics and Science Study (TIMSS) and the Second Information
Technology in Education Study (SITES).
Based on Grade 5 learners’ performance on the PIRLS 2006 achievement tests
(in reference to sub-question 1), the assumption is that variation will exist
between different groupings of learners, in this case particularly based on
language grouping. In light of sub-question 2, it is hypothesized that groupings
of learners’ achievement on reading literacy tasks will differ in level and spread
and the sources of variation might be different between different language
groupings. In cases where learners struggle to read, the reasons for struggling
might be varied. The next two sub-questions therefore aim to investigate the
available data for evidence of these sources of variation within the different
language groupings of learners participating in PIRLS 2006.
3. What factors related to the learners’ background (for example motivation
to read, language skills and home environment) affect performance in
reading literacy?
4. To what extent do the school and classroom environments affect reading
literacy performance?
Factors emanating from the PIRLS 2006 learner and parent questionnaires will
be used to inform answers to question 3, while information gathered through the
school and teacher questionnaires will be used to answer question 4. For
purposes of answering these questions, the HLM 6 software package will be
used.
It is expected that some factors might have a direct impact on reading
performance, but it is suggested that the relationship between factors and
reading performance might not necessarily be linear or direct. An example of a
direct, associated relationship between factors and reading performance might
be that an enabling home environment will likely lead to the development of an
enabled child. An enabling environment is also likely to direct the child to enter
an enabling school, thus resulting in a successful reader who has the ability to
use reading effectively in everyday life. On the other hand, a disenabling

138
pathway may arise for a child coming from an ineffective home, who is likely to
be at a developmental disadvantage, and is likely to attend a disenabling school
environment, characterized by ineffective teaching practices and lack of
opportunity for the child to read and learn. The result of such a pathway would
be a disenabled reader, who is unable to read to learn.
These examples illustrate two conceptual paths in a simplistic fashion, where
one enabling factor leads to the next, resulting in a specified outcome, and, in
contrast, one disenabling factor leads to the next, resulting undesirably in a lack
of reading ability. Nonetheless, the search for plausible causal conditions is
important.
For the majority of South African Grade 5 learners, a picture of more complexity
is suspected, where an interaction between factors is more likely to occur.
Currently, the South African learner population is characterized by great
diversity and variation. At one end of the spectrum a learner from a rural,
disadvantaged community with lack of resources might not be able to read. At
the other end of the spectrum, a learner from an advantaged, affluent
community where resources are readily available might also not be able to read.
Just as these learners come from two different socio-economic backgrounds,
the factors behind their inability to read also vary greatly. The developmental
paths they followed, their cultural, social and individual circumstances, and the
influential factors that impacted on their reading abilities may be vastly different,
but these paths culminated for both learners in the same result: an inability to
read.
An interaction between factors therefore implies a multiplicity of effects of
enabling and disenabling factors, resulting in the possibility of a number of
configurations that could be used to predict likely learner reading performance.
5. How do these relationships between factors differ or remain constant
across the 11 official languages in South Africa, at least in light of the
language groupings?

139
With 11 official languages, current educational policy in the country advocates
that learners in Grades 1 to 3 are taught in their mother tongue. When learners
progress to Grade 4, for many learners the LOLT changes to a second
language, which in most cases is English. At this developmental stage, learners
are also expected to advance from learning to read to a stage where they can
use reading in order to learn. Using learners’ achievement scores as obtained in
the PIRLS 2006 assessment when tested in their language of learning, question
5 leads us to investigate whether instruction in one’s own native language
contributes significantly to the relationship of factors associated with reading
performance.
5.4. RESEARCH DESIGN
For the purposes of answering research questions 3-5, Hierarchical Linear
Modelling (HLM) (Raudenbush and Bryk, 2002), also known as Multi Level
Modelling, will be used. The aim of these analyses would be to establish the
relationships between one or more explanatory4 variables, in this case obtained
from items in the contextual questionnaires at learner and school-level, and the
outcome variables, i.e. reading achievement scores for the different language
groups.
According to Shamosh and Farach (2007), data is hierarchical when observed
or measured units are inherently grouped at greater units of analysis and hence
may be nested within higher levels of analysis. Nesting can occur between
subjects at more than one level, e.g. children nested within classrooms, and
classrooms nested within schools, keeping in mind that adding levels of nesting
increases the complexity of the model exponentially.
The rationale for using HLM for the purposes of this study is its ability to deal
adequately with hierarchical data. In this study, the data can be described as
hierarchical in the following sense: The data consists of variables that describe
4 The term ‘explanatory’ explicitly suggests the role with respect to a ‘response’ or ‘outcome’
variable. These terms replace the potentially misleading terms: independent and dependent

140
individuals, but the individuals are also grouped into larger units (classes)
consisting of a number of individuals, which in turn are described by higher
order units. Data is therefore available for explanatory variables that describe
Grade 5 learners, which in turn describe classes in a representative sample of
schools across South Africa.
According to Raudenbush and Bryk (2002), data of this nature has a nested
structure of learners within classrooms and classrooms within schools. With
hierarchical linear models each of the levels is formally represented by its own
sub-model. The sub-models express relationships among variables within that
given level and specify how variables at one level can influence relationships
found at another level.
O’Connell and McCoach (2008) point to the importance of multi level analysis
with data of a hierarchical structure. With learners nested within classes, and
classes nested within schools, these grouping effects imply that learners are no
longer independent and that their responses are correlated, and hence in the
loss of independence among observations. This loss of independence
constitutes a serious violation of key assumptions underlying a large body of
parametric statistical procedures, but is properly accounted for through the use
of multi level analyses.
Willms (1999) describes HLM as a particular regression technique that takes
into account the hierarchical structure of educational data, and understandable
in terms of two steps:
1. Analysis is conducted on every school (or some other unit) in the system
using student level data. For example, students’ test scores in reading
literacy (outcome measure of interest) could be regressed on a set of
student level predictor variables.
2. The regression parameters from the first step of the analyses (levels of
performance and extent of inequalities) become the outcome variable of
interest. These variables are regressed on school-level data describing
schooling processes.

141
The work of Ma and Klinger (2000) is similar to the aims and objectives of this
study. Because education systems have a hierarchical structure (students are
nested within schools), researchers must examine both student and school
characteristics. These authors used student-dependent scores as dependent
(or response or outcome) measures and student characteristics and school
context as taken from questionnaires as independent (or explanatory) measures
in a two-level Hierarchical Linear Model to examine the effects of student and
school variables on academic achievement at the student and school-levels
(students nested within schools).
Each HLM analysis was carried out in three stages. During the first stage, the
analysis produced a null model with no explanatory variables at student or
school-level. During the second stage, explanatory student variables were
added to the null model, first singly and separately, to determine whether each
variable had a statistically significant absolute or marginal effect on academic
achievement measures regardless of other variables and whether its
relationship varied significantly across schools, then in combination, to
determine whether each explanatory variable had statistically significant relative
effect on the academic achievement measures in the presence of other
variables. In other words, the relative or combined effect of the explanatory
variable was adjusted for the presence of simultaneous effects of other
explanatory variables. During the third stage, explanatory school variables were
included in the student model, first singly and separately to determine their
absolute (or marginal unique) effects, then in combination, to examine their
relative (or conditional simultaneous) effects.
The work of Ma and Klinger (2000) illustrates similar aims and procedures to
this study, namely to model average reading literacy achievement measures
and school variables, and relationships between them. Figure 5.4 represents
possibilities of relationships among variables in this study. For the purposes of
this study, a two level model is suggested, with learner-level variables nested
within school-level variables. School and classroom-level variables are grouped
together in one level, since variables at these levels cannot be separated from
one another. The PIRLS 2006 sample was drawn so that one intact classroom

142
was chosen from each selected school, thereby making classrooms inextricably
part of the school.
Figure 5.4: A Two Level Model of Variables Associated with Reading Literacy Achievement
HLM models are a type of mixed model with hierarchical data that exists at
more than one level (Snijders & Bosker, 2002). HLM focuses on differences
between groups in explaining a dependent (or response or outcome) variable.
The focus is on any group effects on a response in relation to explanatory or
predictor covariates. Mixed models explore both fixed and random effects on a
response variable, but also permit use of covariates as plausible predictors.
Explicitly stated, and in light of Figure 5.2 on page 123, the focus of this study is
reading literacy achievement by learner, by school, controlling for language
grouping. With this conceptualisation, reading literacy achievement would be
regarded as the response variable, the learner the unique factor (as selected
from intact classrooms), the school the random factor, with the language
grouping as the covariate (or predictor). Stated in another way, this model
translates to:
Identified explanatory factors from school and classroom contextual
questionnaires
Overall PIRLS 2006 Reading Literacy
Achievement Scores per Language
Group
Identified explanatory factors from learner and
parent contextual questionnaires

143
Reading literacy score = ((average + adjustment applicable for school i) +
(adjustment applicable for language j) + (adjustment for learner k knowing the
school and the language)).
Raudenbush and Bryk (2002) caution that:
a natural temptation is to estimate a ‘saturated’ level 1 model - that is
where all the predictors are included with random slopes – and then to
work backward deleting non-significant effects from the model.
Unfortunately, such a strategy is generally not useful unless the level 1
sample sizes are very large. Even then, such a saturated model might
require hundreds of iterations to converge and often will produce a large
array of non-significant findings that offer little direction as next steps. If
one overfits the model by specifying too many level 1 random
coefficients, the variation is partitioned into many little pieces, none of
which is of much significance. (Raudenbush & Bryk, 2002).
Instead, Raudenbush and Bryk (2002) advise that it is more productive to use a
‘step-up’ strategy, where some external theoretical guidance has defined a
relatively small set of level 1 predictors, and is used to build up from univariate
to multivariate models based on promising sub-models. The following section
describes how such a theoretical guide and conceptual framework is used for
the purposes of data analysis in identifying a small set of predictors from both
learner and school-levels.
5.5. DESIGN ISSUES
In this section, some design issues are discussed and related to aspects
already discussed in Chapter 4, such as the realized sample for PIRLS 2006
(section 5.5.1), the development and translation of instruments (section 5.5.2),
the distinction between first language, language of the test and language of
learning (section 5.5.3) and drawing causal conclusions in this study (section
5.5.4).

144
5.5.1. Sample
The South African sample for PIRLS 2006 consisted of 441 schools, all of which
offer schooling at least at Grade 4 level. From an initial 15 182 schools, the
South African sample was selected on the basis of probabilities proportional to
size, first by province and then by language of teaching within province, to
arrive at this intended sample of 441 schools. Information on seven of the
selected schools was absent to such an extent that these schools could not be
traced. Thus, the PIRLS 2006 study resulted in the collection of achievement
data from a realized sample of 434 schools comprising 16 288 Grade 4 learners
aggregated from all nine provinces in all 11 official languages. For Grade 5
learners, data collection culminated in the assessment of 14 657 learners from
intact classrooms from the same schools that were selected for the assessment
of Grade 4 learners.
5.5.2. Instrument Design and Translation
The PIRLS 2006 data collection instruments consist of reading achievement
booklets comprising reading comprehension passages with accompanying
questions in various formats. As part of assessing reading comprehension and
understanding the contexts in which Grade 5 learners read, the assessment
also included the administration of questionnaires to school principals, teachers,
parents and learners. The data collection instruments were all developed in a
collaborative effort across the participating countries, but ultimately all data
collection instruments were developed in English and were the result of
extensive work of reading development groups and pilot processes undertaken
in participating countries.
There are two important aspects of the South African PIRLS 2006 study that
should be borne in mind. Firstly, the magnitude of this study: instruments were
replicated 11 times for administration on learners representing all 11 official
languages of South Africa. In some cases, learners experienced great difficulty
in responding to the PIRLS 2006 reading passages. Some of these difficulties
145
might be expected to be associated with translation issues. Of the PIRLS 2006
participating countries, South Africa proved to have the most complex situation
by far, in terms of the number of indigenous languages. Contextual
questionnaires and assessment instruments were translated from English into
all 10 other official languages. The International Study Centre conducted one
round of translation being followed by a round of back translations, and then
international translation verification. Despite translation difficulties, South Africa
passed the international translation verification process with requests for minor
changes in some cases.
Despite stringent translation procedures, language and cultural complexities
highlighted the importance of acknowledging diverse cultures in cross-national
studies of this nature. The best attempts were made to ensure the equivalence
of instruments between the different languages. However, learners still
experienced difficulties, resulting in many test booklets being returned
unanswered and incomplete. Possible reasons other than severe inability to
engage material at Grade 4 level, emerge from the anecdotal evidence of
personal observations made during data collection, namely that learners in
many schools across the country seem to be enrolled in schools where the
LOLT differs from their own recorded mother tongue.
5.5.3. The Distinction between First Language, Language of Learning and Language of the Test
A third design issue pertains to the distinction made in this study between ‘first
language’, ‘language of learning’ and ‘language of the test’. South African
children are by policy intended to start their learning at school from Grade 1 to 3
in their first language (mother tongue). However, many schools are faced with
teaching learners in these initial grades in a language of learning that is
nonetheless different from what is spoken at home. For Grade 1 to 3 learners,
‘first language’ does not necessarily coincide with ‘language of learning’ or
‘language of the test’. When learners approach Grade 4, the language of
learning changes again, resulting in more than 80% of learners being taught in

146
a dominant second language (mostly English, a language spoken as another
tongue by less than 10% of the population).
For the purposes of data analysis in this study, language groups are therefore
defined by means of ‘language of learning’ (in Grades 1 to 3), since the term
’first language’ is not accurately indicative of whether a learner does in fact
receive instruction in his or her home language. The terms ‘language of
learning’ and ‘language of the test’ will be used interchangeably, even it is
functionally possible that at some schools the equivalence is moot.
5.5.4. Drawing Causal Inferences from PIRLS 2006 Data
The concept of causality is used with great care in this study, since causal
conclusions cannot be drawn from non-experimental data. Instead, this study
seeks to generate associations and directions of relationships between
explanatory and outcome variables. Blunch (2008) states that, while it is not
possible to observe causation from observation, it is possible to observe to
other relationships, namely:
1. Co-variation, which permits an inference that, if two factors co-vary, there
is a possibility but not the necessity of a causal relationship in one
direction or another.
2. Time sequence, where the occurrence of A being followed by B is a
necessary condition for A being a cause of B, but may not be a sufficient
condition.
A requirement for these relationships to become evidence of causation
specified in a hypothesis is that they are to be observed with high frequency
under conditions that rule out all other explanations of the observed
relationships than that of the hypothesized causation.
It should be noted here that for the purposes of this study, particularly in the
discussion of results in chapters to follow, the aim is not for findings to point to
causality or in providing evidence for a causal relationship among any of the
147
variables used in the model. At the most, some causal relationships could be
rendered plausible or probable on the basis of the data. Since it is not possible
to rule out all other explanations or factors that influence reading achievement,
and since one is restricted by what the data set and its structure can provide,
the aim of the analysis is to attempt to identify those factors which might be
deemed most ‘probable’ in plausible claims of the form that ‘factor A contributes
substantially reading literacy achievement for a particular language group’.

148
CHAPTER 6: EXPLANATORY VARIABLES AT LEARNER, CLASS AND SCHOOL-LEVELS AND PIRLS 2006 ACHIEVEMENT
“Reading makes immigrants of all of us. It takes us away from home, but more
important, it finds homes for us everywhere.”
Jean Rhys
The PIRLS 2006 assessment is the second of a series of international
comparative studies that is to be undertaken in five year cycles. After absence
from the PIRLS study undertaken in 2001, South Africa’s first participation took
place in the 2006 cycle. As an international comparative study, PIRLS 2006 not
only provides the 45 participating education systems with the opportunity to
assess reading literacy achievement, but also an opportunity for those 28
countries that are participating for a second time to establish 5-year trends in
reading literacy achievement worldwide. As a trend study, PIRLS retains a
selection of reading passages to allow for the repeat administration of that
selection in future assessment cycles, thus allowing for comparisons within and
across countries to be made from one cycle of assessment to the next.
This chapter will focus on South African Grade 5 learner performance in the
PIRLS 2006 assessment as measured internationally, and separately in relation
to variables such as gender, achievement between provinces, benchmarks per
language and achievement per test language. In addition, descriptive
information will be elaborated about the explanatory variables selected for the
purposes of this study, at learner, home, teacher and school-level.
6.1. SOUTH AFRICAN READING ACHIEVEMENT AND INTERNATIONAL
COMPARISON
A total of 40 countries and 45 education systems participated in PIRLS 2006.
The slight disparity in numbers is accounted for by two countries having more
than one education system, namely Belgium, with a French and Flemish

149
system, and Canada with no fewer than five distinct systems. Table 6.1 lists all
the participating countries and education systems, and distinguishes between
those 28 systems that have participated in both PIRLS 2001 and PIRLS 2006,
and the 17 systems that participated only in PIRLS 2006.
Table 6.1: PIRLS 2006 Participating Countries and Education Systems
PIRLS 2006 & 2001 PIRLS 2006
Bulgaria Macedonia Austria
Canada, Ontario Moldova Belgium (Flemish)
Canada, Quebec Morocco Belgium (French)
England Netherlands Canada, Alberta
France New Zealand Canada, British Columbia
Germany Norway Canada, Nova Scotia
Hong Kong SAR Romania Chinese Taipei
Hungary Russian Federation Denmark
Iceland Scotland Georgia
Iran Singapore Indonesia
Israel Slovak Republic Kuwait
Italy Slovenia Luxembourg
Latvia Sweden Poland
Lithuania United States Qatar
South Africa
Spain
Trinidad and Tobago
The PIRLS 2006 Summary report (Howie, Venter, van Staden, Zimmerman,
Long, Scherman & Archer, 2009) states that, of the participating PIRLS 2006
education systems, South Africa had the highest infant mortality rate (53 per
1000 live births), the lowest life expectancy (46 years) and the highest learner:
teacher ratio. In terms of budgetary expenditure as a percentage of the Gross
Domestic Product (GDP) on education, South Africa is ranked average amongst
participating countries, with 14.3% expenditure per learner as measured in 2006
(World Bank, World Development Indicators, 2008).
The IEA released the PIRLS 2006 international reading literacy achievement
results on 28 November 2007 at Boston College in the United States of

150
America. The results provided overall reading averages achieved by each
participating country. Through the use of Item Response Theory (IRT) scaling
(further details in PIRLS 2006 Technical Report, Martin, Mullis & Kennedy,
2007), the PIRLS 2006 international average is set at a fixed 500 points with a
standard deviation of 100 points. Participants’ achievement is therefore ranked
and placed relative to the international reference mean of 500. Figure 6.1
provides the distribution of reading achievement as taken from the PIRLS 2006
International Report (Mullis, Martin, Kennedy & Foy, 2007), together with years
of formal schooling, average age and the Human Development Index.

151
Figure 6.1: Distribution of International Reading Achievement

152
PIRLS 2006 required the assessment of learners who have had four years of
schooling, which for most countries translated to Grade 4 learners. The South
African PIRLS 2006 study assessed this first population of Grade 4 learners, but
also included a second population of Grade 5 learners as a national option
within the study. Figure 6.1 indicates that South Africa achieved the lowest
score of the 45 participating education systems. Figure 6.1 only provides results
for South Africa’s Grade 5 population. With an average age of 11.9 years, the
South African learner population was the oldest across all participating
countries. Grade 4 learners achieved on average 253 points (SE=4.6), while
Grade 5 learners achieved on average 302 (SE=5.6). Average achievement for
both these grades is substantially below the fixed international reference
average of 500 points. Closest to South Africa in reading achievement was
Morocco, the only other African country that participated in PIRLS 2006, with a
Grade 4 average of 323 points (SE=5.9).
The remainder of this chapter will only provide and discuss results that pertain
to Grade 5 learner achievement (sections 6.2 and 6.3) and an analysis of
results of selected variables as described in Chapter 5 relevant to this study
from the Learner, Parent, Teacher and School questionnaires (section 6.4).
6.2. SOUTH AFRICAN GRADE 5 ACHIEVEMENT BY LANGUAGE, GENDER
AND PROVINCE
The PIRLS 2006 reading assessment was administered to a sample of 14 657
Grade 5 learners aggregated across all 11 official languages. It has to be borne
in mind that the results for each language refer to the language of the test, not
the home language. The language of the test is the language that should
coincide with the language in which the learner has been taught for the first
three years of schooling, and therefore may be different from the learner’s home
language.
Figure 6.2 illustrates achievement per language for Grade 5 learners. Learners
who wrote the test in Afrikaans (n=1678) achieved the highest scores (416,

153
SE=12.0), followed by those who wrote it in English (n=2793, achievement of
398, SE=17.1). A substantial drop in achievement is illustrated for learners who
wrote the test in isiNdebele (n=798, achievement of 239, SE=12.2) and
isiXhosa (n=1470, achievement of 215, SE=7.6), who were the lowest
achievers. Learners who wrote the test in Sesotho (n=959, achievement of 288,
SE=7.6) achieved better scores than their counterparts of the other African
languages.
0
50
100
150
200
250
300
350
400
450
Ove
rall Ach
ieve
men
t
Afrika
ans
Englis
h
IsiN
debele
IsiX
hosa
IsiZ
ulu
Seped
i
Sesoth
o
Setsw
ana
Siswati
Tshive
nda
Xitson
ga
Figure 6.2: Grade 5 Achievement by Language South African Grade 5 learner achievement by gender is consistent with
international patterns. Internationally, girls outperform boys, and for South
African Grade 5 learners this pattern holds true where Grade 5 girls achieved
on average 319 points (SE 6.3) and Grade 5 boys achieved 283 points
(SE=5.5), a difference in average achievement of 36 points, yet statistically not
significant (p=0.38). According to Howie et al. (2007), this difference in
achievement by gender for South African Grade 5 learners is among the highest
in the world.
South Africa has nine provinces and achievement varies greatly between them.
Table 6.2 indicates participant counts and average reading achievement per
province:

154
Table 6.2: Average Achievement Scores per Province Province N Average Reading
Achievement SE
Eastern Cape 1 629 241.71 15.5
Free State 1 229 308.87 7.1
Gauteng 1 436 353.49 17.8
KwaZulu-Natal 1 681 313.97 11.3
Limpopo 2 959 255.75 4.8
Mpumalanga 2 950 270.14 7.3
Northern Cape 749 357.42 14.3
North West 1 050 310.08 14.0
Western Cape 974 404.21 13.5
A one-way ANOVA with post hoc tests shows significant differences in average
reading achievement between provinces, with the Western Cape achieving
significantly higher scores than the other provinces. Achievement scores formed
distinct groups, firstly with the Northern Cape and Gauteng, with significantly
lower achievement scores than the Western Cape, but higher than the cluster of
KwaZulu-Natal, North West and the Free State. The cluster Mpumalanga,
Limpopo and Eastern Cape performed significantly lower than the other six
provinces. These provincial differences are of course partially confounded with
associated language effects.
The following section describes Grade 5 learner benchmark achievement by
language.
6.3. SOUTH AFRICAN GRADE 5 LEARNER BENCHMARK ACHIEVEMENT
BY LANGUAGE
The PIRLS 2006 assessment measures learners’ reading achievement on a
variety of reading passages and questions about the reading passages, each
target selected processes of comprehension (Howie et al., 2007). These
processes of comprehension range from the more basic types, by which the
learner should be able to focus on and retrieve explicitly stated information and
make straightforward inferences, to the more complex processes assessed by

155
PIRLS 2006, which include the ability to interpret and integrate ideas and
information, and ultimately evaluate and examine content, language and textual
elements. The processes of comprehension follow a hierarchy from easy to
difficult, requiring the learner to apply increasingly complex reading skills and
abilities. However, Howie et al. (2009) point out that interpretive questions are
not necessarily more difficult by default, since comprehension processes may
vary for each learner in accordance with their experiences.
Figure 6.3 presents the percentages of learners in the benchmark categories
with highest at left and lowest at the right. It illustrates the difference between
the international patterns of achievement on each of the benchmarks and South
African Grade 5 learner benchmark achievement patterns. Nationally, as little as
6% of learners are able to reach or exceed the High International Benchmark
for Grade 5 competence, in comparison to 41% internationally. Moreover, as
many as 78% of South African Grade 5 learners were unable to reach the Low
International Benchmark at all, in contrast to only 6% internationally.
International patterns show a substantial spread of achievement across each of
the benchmarks, yet the South African pattern paints a very bleak picture of
devastating underachievement.
6
78
0 20 40 60 80 100 120
Int median
Grade 5
Percentiles
Advanced High Intermediate Low Did not reach
Figure 6.3: International Benchmark Achievement Patterns Compared to South African Grade 5 Benchmark Achievement Patterns

156
Each of the PIRLS 2006 questions is benchmarked to provide detailed
qualitative descriptions of the learners’ performance on a scale represented by
four levels. With the international average set at 500, the range of performance
exhibited by learners can be classified as follows:
• Advanced International Benchmark (set at 625 points),
• High International Benchmark (set at 550 points),
• Intermediate International Benchmark (set at 475 points)
• Low International Benchmark (set at 400 points).
The descriptions of each of these benchmarks are cumulative, that is learners
who were able to reach the higher benchmarks would automatically be able to
demonstrate the skills and abilities which are expected at the lower
benchmarks.
At the Advanced International Benchmark, learners are able to respond to the
PIRLS 2006 assessment fully. Learners are able to integrate information across
challenging texts and can provide full text-based support for their answers
(Howie et al., 2007). At the High International Benchmark, learners are
considered to be competent readers. Learners who are able to reach the High
International Benchmark can retrieve significant details embedded across texts,
and at this level they are able to begin to identify main ideas and some textual
features and elements, as well as being able to begin to integrate ideas and
information across texts.
Learners at the Intermediate International Benchmark show some reading
proficiency. They are able to understand the literal plot of a text and to make
some inferences and connections across texts. At the Low International
Benchmark, learners are capable of basic reading skills and strategies and are
able to recognize, locate, and reproduce information that was explicitly stated,
especially if it was placed at the beginning of the text. At the Low International
Benchmark, learners are able to make straightforward inferences.

157
Howie et al. (2007) cautioned that the PIRLS 2006 reading passages varied in
length, syntactic complexity, vocabulary use, abstractness of ideas, layout and
organisational structure. The benchmarks were developed on the basis of these
particular texts and for the purposes of the PIRLS 2006 assessment only. The
descriptions provided by each benchmark do not encompass all reading skills
and abilities of Grade 5 learners, but are specific to the PIRLS 2006
assessment.
The PIRLS 2006 international report places learner achievement on the
benchmark into context, whereby countries with the highest average
achievement in general had greater percentages of learners reaching each of
the higher benchmarks than countries with on average lower achievement
scores. Lower average achievement countries have greater percentages of
learners categorised into the lower benchmarks. Howie et al. (2007) explain that
97% and 98% of learners from the highest achieving countries (the Russian
Federation and Singapore respectively) were able to reach the Low
International Benchmark. A further 86% to 90% were able to reach the
Intermediate International Benchmark, while between 58% and 61% of learners
from these countries reached the High International Benchmark. As many as
19% of learners from these countries were able to reach the Advanced
International Benchmark.
Lower achieving countries are in stark contrast to the percentages reached by
high achieving countries. In South Africa, only 2% of Grade 5 learners were
able to reach the Advanced International Benchmark. The following section will
describe South African Grade 5 learners’ achievement on each of the
benchmarks, with particular reference to achievement within the groups defined
by language of testing.
Figure 6.4 illustrates benchmark achievement for South African Grade 5
learners specifically for each of the 11 official languages, again with
percentages accumulating from the highest to lowest groups. More than 90% of
learners who wrote the PIRLS 2006 assessment in isiNdebele, isiXhosa,
isiZulu, Sepedi, Siswati, Tshivenda, and Xitsonga were unable to reach the Low

158
International Benchmark for Grade 4. Similar outcomes occur amongst for
Setswana and Sesotho learners, of whom more than 80% were also unable to
reach the Low International Benchmark. Achievements of Afrikaans and English
Grade 5 learners were relatively better, with 45% of Afrikaans learners and 48%
of English learners unable to reach this benchmark. Nonetheless, while these
percentages are more favourable than those of the African languages, they are
far below international patterns, where only 6% of Grade 4 learners are unable
to reach the Low International Benchmark.
6
78
45
96
96
92
96
89
86
95
92
91
48
0 20 40 60 80 100 120
Int. median
Grade 5
Afrikaans
English
isiNdebele
isiXhosa
isiZulu
Sepedi
Sesotho
Setswana
SiSwati
Tshivenda
Xitsonga
Percentiles
Advanced High Intermediate Low Did not reach
Figure 6.4: South African Grade 5 Benchmark Achievement per Language
Figure 6.4 also shows that 55% (SE 0.3%) of Afrikaans Grade 5 learners and
52% (SE 0.7%) of English learners reached or exceed the Low International
Benchmark. The corresponding percentages for the African languages were
Figure 6.4 also shows that 55% (SE=0.3%) of Afrikaans Grade 5 learners and
52% (SE=0.7%) of English learners reached or exceeded the Low International
Benchmark. The corresponding percentages for the African languages were
substantially lower, with only 4% (SE=0.2%) of isiNdebele learners and 5%

159
(SE=0.9%) of Siswati learners reaching or exceeding the Low International
Benchmark.
From Figure 6.4 it may also be inferred that none of the Grade 5 isiNdebele and
isiXhosa learners were able to exceed the Low International Benchmark for
Grade 4. Fewer than 10% of isiZulu, Sepedi, Setswana, Sesotho, Siswati,
Tshivenda and Xitsonga learners were able to reach the Intermediate
International Benchmark, meaning that more than 90% of these learners had
not attained reading proficiency in the language of testing.
A total of 17% (SE=0.2%) of Afrikaans Grade 5 learners and 18% (SE=0.1%)
English learners were able to reach the High International Benchmark. These
small percentages imply that few Grade 5 learners in these two languages in
South Africa can be considered competent Grade 4 readers. None of the Grade
5 learners from the African languages were able to reach the High International
Benchmark.
A similar picture emerges for the Advanced International Benchmark. For both
Afrikaans and English Grade 5 learners 5% (SE=0.9% and 1.3% respectively)
of learners reached the Advanced International Benchmark, while no African
language learners were able to reach it.
In summary, the overall performance of South African Grade 5 learners in the
PIRLS 2006 assessment of Grade 4 competencies was the lowest for all
participating countries, and stark differences exist for reading achievement
between gender, provinces and language groups.
South African Grade 5 learner performances against the international Grade 4
benchmarks are cause for great concern and provide a clear indication that the
vast majority of learners (specifically from the African languages groups) cannot
be regarded as competent readers who are in possession of basic skills to read
with any measure of success.

160
6.4. LEARNER-LEVEL EXPLANATORY VARIABLES
This study examines the predictors of reading literacy achievement per
language group on two levels, namely the learner-level and the school-level.
These predictors and levels have been selected based on the criteria in Chapter
5 and the conceptual framework. The following section will describe the
characteristics of Grade 5 learners who participated in PIRLS 2006, focussing
on the averages scores associated with those explanatory variables that have
been selected from the Learner Questionnaire and that are related to the
conceptual framework as outlined in Chapter 5. Variables related to the time
learners spend on reading, the opportunities they use to read, their motivation
to read, their social background and their language skills will be discussed.
6.4.1. Time on Task
Time on task is defined as the average reported time learners spend on reading
outside of school. Grade 5 learners who reported that they read aloud to
someone at home once or twice a month achieved substantially higher scores
(354.8, SE=10.1)5 than those learners who reported having read aloud every
day or almost every day (278.1, SE=4.7), or once or twice a week (327.6,
SE=7.6). To spend time listening to reading seems to have least evidence of
positive impact on reading achievement, since learners who reported never
doing so achieved substantially higher (349.9, SE=13.3) than those who
reported doing so every day or almost every day (287.0, SE=3.9). Similar
patterns occurred for those learners who reported never or almost never talking
to friends about what was read (359.4, SE=11.2) and those who reported doing
so daily (288.7, SE=4.3).
In terms of reading for fun activities outside of school, those learners who
reported spending time once or twice a week achieved the highest score of all
categories within that question (314.4, SE=6.3). Learners who reported reading
5The convention for reporting reading achievement in this chapter provides the average reading
achievement score, followed by the standard error (SE), both rounded to one decimal.

161
for information once or twice a week also achieved the highest scores of all
categories for that corresponding question (317.8, SE=9.1).
Reported reading for fun outside of school is linked to learners’ attitudes toward
reading and the frequency with which they engage in it. Reading for fun was
reported most frequently in the international report by countries such as the
Russian Federation, Germany, Lithuania, Moldova and Canadian provinces of
Alberta and British Columbia (Mullis et al., 2007). South African learner
percentages are consistent with international averages of 40%, where learners
indicated reading for fun every day or almost every day. Some 49% (SE=1.1%)
of South African Grade 5 learners reported reading for fun every day or almost
every day.
With such a relatively high percentage of learners who reportedly read for fun
every day, one would expect that learners who do so would achieve on average
higher. Yet, for the South African Grade 5 data this inference is not necessarily
true. Learners who read stories or novels (309.7, SE=6.7) or magazines (315.3,
SE=6.2) once or twice a week achieved only marginally higher scores than
those learners who reportedly do so every day (307.7, SE= 6.4), once or twice a
month (296.9, SE=7.9) or almost never (291.3, SE=8.3).
Learners who reportedly read newspapers (328.3, SE=7.3) or comic books
(350.0, SE=10.4) less frequently than once or twice a month achieved the
highest scores. Learners who reportedly read subtitles on television achieved
the highest scores when this activity was done every day or almost every day
(328.8, SE=5.9).
An alarming 37.9% (SE=1.0%) Grade 5 learners reported watching television
for 5 hours or more every day, with a significant difference in achievement
within this TV watching group between boys and girls (boys’ achievement
270.1, girls' achievement 301.2, p=0.035). While 26.8% (SE=0.8%) of learners
reported spending more than 5 hours reading books, their reading achievement
scores are not reflective of the amount of time they spend reading. For these
learners, reading achievement scores are only (285.9 SE=5.2) as opposed to

162
higher achievement scores for learners who reportedly only spend up to one
hour reading (371.7, SE=0.1).
Table 6.3 illustrates the amount of time learners reportedly spend on reading
homework, and its associated effect with reading achievement:
Table 6.3: Time Spent on Reading Homework and Associated Reading Achievement
Time Spent on Reading Homework
N % of Learners
SE % Reading Achievement Scores
Never 2 318 18.9 0.88 267.9
Half hour or less 3 676 32.9 0.89 340.5
More than half hour to one hour
3 016 26.1 0.61 312.6
More than one hour 2 823 22.1 0.59 316.1
A majority of 30.2% (SE=0.6%) of parents reported that the amount of time their
children spend doing homework only amounts to between 16 and 30 minutes
every day. Parents’ own reading behaviours reveal that the majority 35.0%
(SE=0.6) only spend between 1 and 5 hours reading per week. An alarming
29.41% (SE=0.2) of parents reported spending less than an hour reading at
home. The amount of time children spend doing homework as assigned by their
teachers therefore seems very little, and is comparable to parental reports of
similarly little time set aside and spent on reading activities in the home.
6.4.2. Opportunities Used
Opportunities used at the learner-level refers to those used by teachers (as
reported by learners) to engage them in reading activities. In terms of the
opportunities used in the classroom to spend time on reading, 74.7%
(SE=0.8%) of Grade 5 learners reported that their teachers most often used the
time to read aloud to the whole class. Smaller percentages of learners reported
on opportunities that were used on a daily basis for them to read aloud in
groups 34.6%, (SE=0.9%). In terms of independent reading, 57.7% (SE=1.2%)

163
of learners reported reading silently on their own every day or almost every day,
while an equally high percentage reported reading books of their own choosing
52.2%, (SE=1.0%).
Opportunities for learners to do exercises after something had been read are
mainly in the form of answering questions in a workbook or on a worksheet
were reported by 59.5% (SE=1.0%) as every day or almost every day. Writing
something in response to what was read (41.3%, SE=1.0%), answering
questions orally about what was read (47.7%, SE=1.1%) and talking with fellow
learners about what was read (47.2%, SE=1.0%) occur slightly less frequently
on a daily basis in comparison to answering questions in a workbook.
Table 6.4 indicates the frequency of opportunities reported by Grade 5 learners
to do reading homework assigned by their teachers for any subject:
Table 6.4: Opportunities to do Reading Homework for Any Subject
Frequency of Reading Homework
N % of Learners SE %
I never have reading to do for homework
2 526 22.1 1.0
Less than once a week 1 280 11.9 0.5
1 or 2 times a week 2 416 21.3 0.8
3 or 4 times a week 1 876 15.9 0.6
Everyday 3 370 28.7 0.9
Alarmingly, as many as 22.1% (SE=1.0%) of Grade 5 learners never receive
reading for homework and are therefore not afforded many opportunities to
practice their skills in reading, specifically reading for understanding. The lack of
reading homework being assigned to Grade 5 learners could be assuaged by
as many as 65.3% (SE=1.6%) of learners who report taking out books from the
library. Whether these opportunities indeed exist remains doubtful, since
responses may reflect learners’ wishes to take out books from the library rather
than actual behaviour. However, when investigating the effect of taking out
library books on reading achievement scores, it becomes apparent that for

164
learners who reportedly take out books, achievement is substantially higher
(326.1, SE=7.7) than for those who reportedly do not do so (285.3, SE=6.5).
Mullis, Kennedy, Martin and Sainsbury (2004) state that the home is the most
influential system in providing initial and important foundational exposure to,
and opportunities for, language and literacy related activities. Parents of 48.7%
(SE= 0.9%) of Grade 5 learners reported high engagement (measured in terms
of every day or almost every day) with their children in the following early home
literacy activities:
• Reading books
• Telling stories
• Singing songs
• Playing with alphabet toys
• Playing word games
• Reading aloud signs and labels
The reported high frequency of home literacy activities is related to a higher
overall achievement in the PIRLS 2006 assessment for these learners at Grade
5 (325.5, SE=8.0), in comparison to the average achievement of their peers
whose parents reported infrequent engagement in early literacy activities during
the child’s preschool years (276.9, SE=5.3).
Linked to the opportunities parents use to engage their children in early home
literacy activities are those they create to engage their children in reading
activities in general. These activities include situations when either parent:
• listens to the child read
• talks to the child about things that were done
• engages the child in what he or she is busy reading
• finds the opportunity to discuss the child’s classroom reading with him or
her
• accompanies the child to the library or a bookshop
• helps the child with reading for school

165
• encourages the child to read and write
• sings songs with the child
• talks to the child about what they are busy reading
Table 6.5 presents percentages of general reading activities in which the
majority of parents engage their children on a daily basis:
Table 6.5: Percentage of Parents Reporting Daily Reading Activities with Children
Parents’ Daily Activities with Children N % of Parents SE %
Listen to the child read aloud 6 138 49.4 0.7
Talk about what was done 6 045 51.6 0.6
Talk with the child about what he or she is reading
5 706 46.6 0.8
Help the child with reading for school 6 857 55.4 0.7
Encourage the child to read 8 699 72.2 0.7
Discuss child’s classroom reading with him or her
6 267 52.5 0.8
Despite parents’ reports of daily engagement in activities listed in Table 6.5, the
majority of Grade 5 learners’ parents report never taking their children to
libraries or bookshops (40.0%, SE=0.8%). Opportunities used to sing songs to
the child and to talk to him or her about what they as parents are reading are
split in frequency as every day and once weekly occurrences.
The opportunities parents use to read for their own enjoyment reveal that about
48.0% (SE=0.7%) of parents of Grade 5 learners read most frequently every
day or almost every day. By role modelling frequent reading behaviour and
creating opportunities to read for enjoyment, parents appear to increase the
reading achievement scores their children obtained in the PIRLS 2006
assessment substantially – children of parents who reported reading every day
achieved an average (321.8, SE=7.5) which is higher than that of children

166
whose parents reportedly only read for enjoyment once or twice a month (272.4,
SE=6.5) and never or almost never (282.9, SE=9.4).
6.4.3. Motivation
Motivation to read at learner-level is closely linked to reading attitudes learners
have towards reading. The types of literacy activities in which learners engage
at home and at school may encourage and reinforce positive reading attitudes.
The establishment of positive feelings and attitudes that learners should
develop for reading is included as an educational outcome in most reading
curricula. Reading broadens learners’ knowledge, comprehension skills and
experiences of different types of literature, and learners who enjoy reading are
much more likely to engage more frequently in reading-related activities (Howie
et al., 2009).
Learners responded to a number of questions in the Learner Questionnaire
designed to ascertain their attitudes towards reading and their motivation to
read. Based on these responses, an index with three categories was devised
(high, medium and low)6 to provide indications of learners’ thoughts and
feelings regarding themselves as readers. Internationally, learners generally
regarded themselves as good to moderately good readers. South African
learners also exhibit this pattern. The majority of Grade 5 learners indicated
high (meaning positive) to medium reading self-concepts. Only a very small
percentage of learners reported having a low reading self-concept. Learners
reporting generally high reading self-concepts on average achieved
substantially higher scores in the PIRLS 2006 reading assessment. Conversely,
learners who responded negatively to statements of reading self-concept on
average achieved much lower scores than their high and medium ranking
counterparts.
6 Average is computed on a 4-point scale: Disagree a lot=1, Disagree a little=2, Agree a little=3,
Agree a lot=4. Responses for negative statements were reverse coded. High level indicates an average of greater than 3 to 4. Medium level indicates an average of 2 to 3. Low average indicates an average of 1 to less than 2 (Mullis et al., 2007).

167
Howie et al. (2007) caution that while it is potentially reassuring that a majority
of South African Grade 5 learners have positive reading self-concepts, and
many learners report reading for fun, one also has to view these positive
outcomes with an element of skepticism. The data seem to suggest that a level
of social desirability beyond plain fact is present in the responses, an argument
supported by the fact that so many learners do not have access to books and
many experience reading problems that would likely impede self-concept.
These self-reported data should therefore be treated with caution.
Table 6.6 indicates frequencies of high, medium and low attitudes towards
reading and illustrates that learners with high attitudes achieved substantially
more than those learners with low reading attitudes. Similar patterns are found
for learners with a high reading self-concept compared to those who do not
regard themselves as good readers.
Table 6.6: Learners’ Reading Attitudes and Reading Self-Concepts on Reading Achievement Scores
Learners’ Reading Attitudes
N Reading Achievement
SE
High 4 611 355.5 7.6
Medium 8 149 277.2 4.7
Low 547 323.6 13.0
Learners’ Reading Self-Concept
N Reading Achievement
SE %
High 4 101 369.5 6.6
Medium 8 589 282.1 5.2
Low 606 231.8 6.6
Parents impart their own beliefs about reading to their children, and these
beliefs in turn shape how children are exposed to and experience a text (Mullis
et al., 2006). Parents responded to beliefs about their own reading in the PIRLS
2006 Parent Questionnaire, and 36.5% (1.1%) of learners whose parents held
reading in high regard, achieved on average 82 points higher than their

168
counterparts whose parents reported having medium-to-low attitudes towards
reading.
Parents’ beliefs about reading were related to the amount of time they reported
spending on reading activities at home, for categories less than one hour per
week, between one and five hours per week, and up to and including more than
five hours per week. According to Howie et al. (2009), internationally 37%
(SE=0.2%) of learners had parents who reported reading for more than five
hours per week. This international percentage is slightly higher than national
reports reflecting that 19.2% (SE=0.6%) of South African Grade 5 learners’
parents reportedly read in excess of five hours every week.
6.4.4. Social Background
A well-known factor that influences reading achievement is the number of books
available in the home. Although it seems that learners with more than 500
books in the home perform better than those without any books at home, the
marginal effect of this indicator seems to fade out at more than 250 books.
Indicators of home resources point to Grade 5 learners who have their own
study desks at home achieving higher (333.6, SE=7.2) than learners without
one (274.0, SE=4.6). Learners in possession of a personal computer at home
also achieved more (343.7, 9.2) than those who do not have one (279.0,
SE=4.2). Grade 5 learners who reported to have between 26 and 100 books in
the home achieved on average the highest (379.5, SE=10.6) when compared to
learners who have fewer than 10 books in the home (282.7, SE=4.6), or those
with more than 100 books in the home (345.0, SE=17.2). Learners with
between 100 and 200 and more than 200 books in the home still achieved more
(359.2, SE=12.9) than learners with few or no books in the home.
Parental responses to the PIRLS 2006 Parent Questionnaire indicate that fewer
than 50% of Grade 5 learners have access to more than 10 books at home.
Table 6.7 (below) supports reading literacy research on the topic of books in the

169
home and illustrates the effect that the number of books available in the home
has on reading achievement scores for Grade 5 learners:
Table 6.7: Books at Home and Associated Reading Achievement Scores
Number of Books at Home
N Average Achievement Score
SE
0-10 books 5 855 276.8 4.0
11-25 books 3 384 294.4 4.6
26-100 books 1 671 362.4 11.4
101-200 books 553 375.3 15.7
More than 200 books
643 389.2 17.2
Table 6.8 illustrates the effect of the availability (or lack of availability) of home
resources on reading achievement for Grade 5 children, through an index of
some basic goods in the home derived from proxy indicators of socio-economic
advantage (e.g. the availability of electricity, flush toilets, television, radio, motor
car, own bicycle and credit cards). Reading achievement is substantially higher
for those children in the high category of the index, indicating better
achievement when basic amenities and resources are available at home.
Table 6.8: The Effect of the Availability of Home Resources on Reading Achievement Scores
Home Resource Index
N Reading Achievement
SE
High 237 527.8 15.0
Medium 7 717 324.0 6.2
Low 2 654 264.1 4.6
Parents of Grade 5 learners are largely unqualified, with the majority either
having undergone no schooling or having left school at or before Grade 9 (or
Standard 7). Table 6.9 provides a breakdown of Grade 5 learners’ parents’
qualifications:

170
Table 6.9: Grade 5 Learner Achievement by Parental Qualifications
Father’s Highest Qualification
Reading Achieve-
ment
Mother’s Highest
Qualification
Reading Achievement
N % N %
Did not go to school
2 275 32.1 265.0 2 225 28.5 269.2
Some primary school, lower than Grade 7
998 13.5 289.6 1 211 16.1 287.7
Grade 9/Std 7 2 284 30.6 333.1 2 573 32.5 337.9
Post secondary training (e.g. vocational training)
502 7.0 390.4 420 5.6 399.6
First degree/Diploma
566 8.6 470.1 683 10.8 459.0
Beyond first degree/Diploma
277 4.9 496.4 207 3.4 463.8
Not applicable 255 3.3 299.7 231 3.0 301.0
As indicated by Table 6.9, a higher percentage of fathers than mothers obtained
education beyond their first degree or diploma. The level of qualification of
Grade 5 learners’ parents can be linked to the learners’ reading achievement.
Learners whose fathers had postgraduate qualifications achieved on average a
score 470.1 points (SE=15.2), while learners with mothers who had
postgraduate qualifications achieved on average 459.0 (SE=15.5). These
achievement scores were the highest amongst the possible categories for
parents’ levels of qualification.
6.4.5. Language Skills
The PIRLS 2006 assessment was completed by 7 474 girls and 7 089 boys,
with the largest percentage of Grade 5 learners using English (23.3%), followed
by isiZulu (20.1%). Much smaller percentages used languages such as
isiNdebele (0.6%), SiSwati (2.53%), Tshivenda (2.2%) and Xitsonga (3.2%).
Languages were represented proportionally to the size of the subsets of the

171
general population speaking that language, by virtue of the random selection
method. Table 6.10 (below) indicates the percentages of learners for the
languages in which the PIRLS 2006 test was administered.
Table 6.10: Percentage per Language of the Test
Language % of Learners
Afrikaans 9.9
English 23.2
IsiNdebele 0.56
IsiXhosa 18.0
IsiZulu 20.1
Sepedi 9.5
Sesotho 4.2
Setswana 6.4
SiSwati 2.5
Tshivenda 2.2
Xitsonga 3.1
The language of the PIRLS 2006 assessment coincided with the LOLT in
Foundation Phase. Table 6.11 reports the average achievement for the sub-
groupings of Grade 5 learners who reportedly always, sometimes or never
speak the language of the test at home:

172
Table 6.11: Average Reading Achievement and Frequency of Test Language at Home
N % of Grade 5 Learners
Reading Mean Score
Achievement
SE
Learners always speak the language of the test at home
6 575 62.1 305.6 6.6
Learners sometimes speak the language of the test at home
3 424 30.0 359.1 8.0
Learners never speak the language of the test at home
1 053 7.8 270.4 8.1
Although the percentage of learners who never speak the language of the test
at home was relatively small (7.8%), this group had on average a much lower
achievement (270.4, SE=8.1) when compared to learners who were more
frequently exposed to the language of the test at home.
The smallness of the percentage of Grade 5 learners who report never to speak
the language of the test at home is supported by parental reports on language
use at home when engaging their children in reading literacy activities. The
majority of Grade 5 learners’ parents reported that they use the language of
their child’s PIRLS 2006 test when doing reading-related activities with their
children at home (80.2%, SE=1.0%). While this high percentage may indicate a
strong correspondence between home language and the language of the PIRLS
2006 test, it may also confirm that Grade 5 children, although being taught in
English, still have exposure to their native languages at home. Only 19.8%
(1.0%) of parents reported using another language at home when engaging
their children in reading activities, of whom only a minor subset may be children
of immigrant families who do not speak any of the eleven official languages at
home.

173
6.5. SCHOOL-LEVEL EXPLANATORY VARIABLES
The second level of analysis of this study pertains to variables at the school and
classroom-level. The PIRLS 2006 sample was drawn so that single intact
classrooms within schools were selected, thereby making classrooms
inextricably part of the school and rendering it impossible to separate
classroom-level from school-level variables in this study. School principals and
teachers of Grade 5 learners were requested to complete School and Teacher
Questionnaires as part of their participation in the PIRLS 2006 study. This
section will focus on those variables that have been selected from the School
and Teacher Questionnaire and that are related to the conceptual framework as
outlined in Chapter 4. Variables related to principal and teacher reports on
school organizational quality, educational quality, time on task and opportunities
used in the teaching of reading will be discussed.
6.5.1. Organizational Quality
At the school-level, organizational quality refers to the extent to which a school
can be characterized by organizational features to enhance the effective
functioning of the school. Organizational quality includes the number of days
per week schools are open for teaching, and reported time spent by principals
on school-related tasks, routines and activities.
A total of 397 school principals completed the PIRLS 2006 School
Questionnaire, designed to gather information on school demographics, the
school environment and resources, governance and organization of the
educational system, curriculum characteristics and policies, the home-school
connection, teacher training and preparation, and instructional activities and
strategies employed mostly by Grade 5 teachers in the school.
Principals were asked to estimate the amount of time they spent on school-
organizational activities, such as developing curriculum and pedagogy,
managing staff, administrative duties, parent and community relations, teaching
and interacting with individual learners. Table 6.12 reports the average
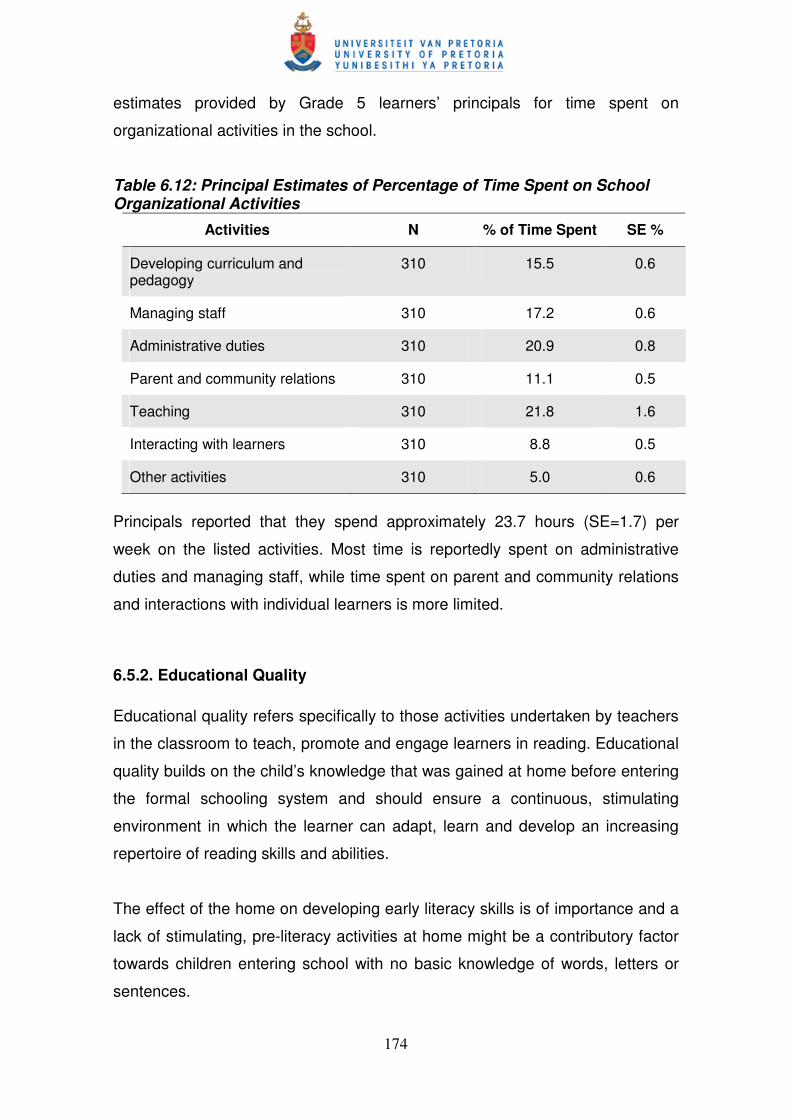
174
estimates provided by Grade 5 learners’ principals for time spent on
organizational activities in the school.
Table 6.12: Principal Estimates of Percentage of Time Spent on School Organizational Activities
Activities N % of Time Spent SE %
Developing curriculum and pedagogy
310 15.5 0.6
Managing staff 310 17.2 0.6
Administrative duties 310 20.9 0.8
Parent and community relations 310 11.1 0.5
Teaching 310 21.8 1.6
Interacting with learners 310 8.8 0.5
Other activities 310 5.0 0.6
Principals reported that they spend approximately 23.7 hours (SE=1.7) per
week on the listed activities. Most time is reportedly spent on administrative
duties and managing staff, while time spent on parent and community relations
and interactions with individual learners is more limited.
6.5.2. Educational Quality
Educational quality refers specifically to those activities undertaken by teachers
in the classroom to teach, promote and engage learners in reading. Educational
quality builds on the child’s knowledge that was gained at home before entering
the formal schooling system and should ensure a continuous, stimulating
environment in which the learner can adapt, learn and develop an increasing
repertoire of reading skills and abilities.
The effect of the home on developing early literacy skills is of importance and a
lack of stimulating, pre-literacy activities at home might be a contributory factor
towards children entering school with no basic knowledge of words, letters or
sentences.

175
Overwhelmingly, Grade 5 school principal reports indicate that in the teaching of
language and literacy skills, reading (63.9%, SE=2.4%), writing (54.7%,
SE=3.0%) and speaking or listening (61.8%, SE=2.7%) receive more emphasis
compared to other areas of the curriculum (e.g. mathematics, life skills).
Table 6.13 provides information on principal responses when asked about the
percentage of children who are able to perform early literacy skills upon entry in
Grade 1. In terms of all the listed early literacy skills, some 50% and more
principals reported that fewer than 25% of the children in their schools are able
to perform basic literacy activities when entering the school for the
commencement of Grade 1. Only small percentages of principals, ranging
between 4.1% and 8.3%, reported that more than 70% of children are able to
perform early literacy skills.
Table 6.13: Principal Reports of Children Able to Perform Early Literacy Skills at Grade 1
Early Literacy Skills N
Less t
han
25%
o
f ch
ild
ren
N
Betw
een
25%
an
d 5
0%
of
ch
ild
ren
N
Betw
een
51%
an
d 7
0%
of
ch
ild
ren
N
Mo
re t
han
70%
o
f ch
ild
ren
Recognize some words of the alphabet
180 43.7% 111 32.6% 77 15.4% 42 8.3%
Read some words
231 57.1% 96 26.7% 43 8.7% 24 7.5%
Read sentences 298 73.6% 56 15.7% 22 6.6% 13 4.1%
Write letters 216 53.1% 87 25.1% 60 15.1% 27 6.6%
Write some words
272 64.9% 66 20.7% 34 9.4% 20 5.0%
School principals were asked to report the approximate grades at which a
particular set of reading skills and strategies first receive major emphasis.
Figure 6.5 (below) illustrates the relative frequency of the introduction of skills to
each grade:
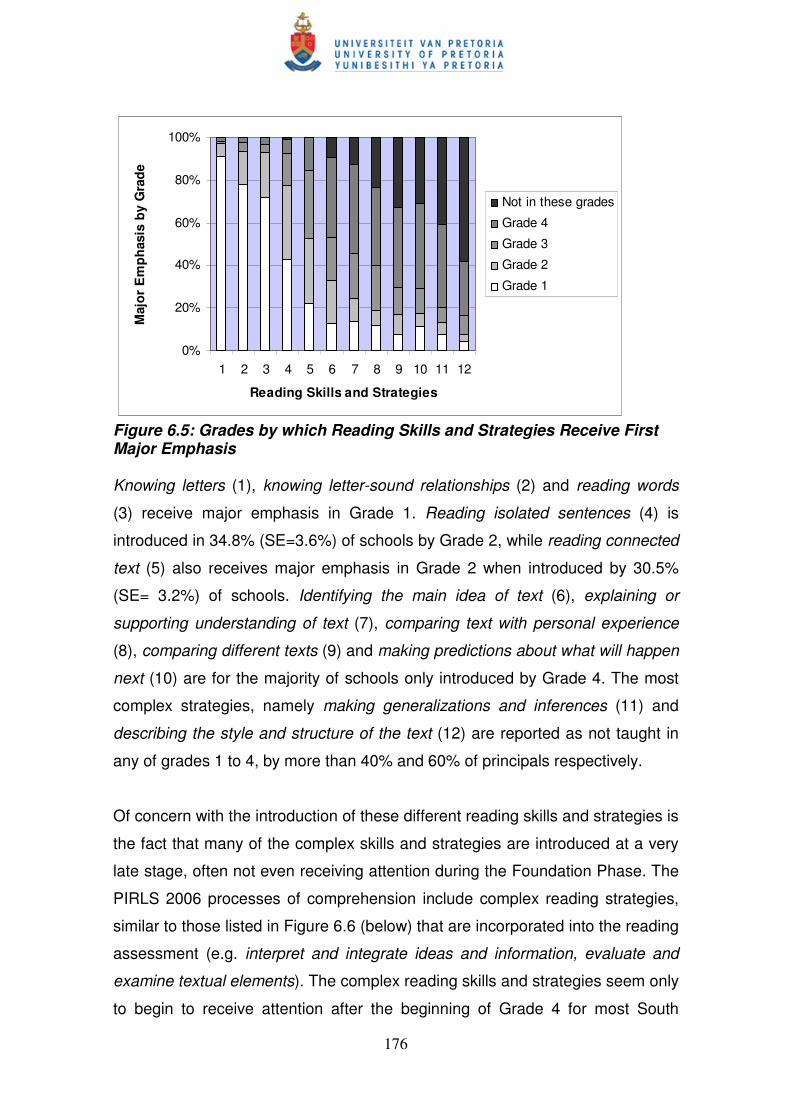
176
0%
20%
40%
60%
80%
100%
1 2 3 4 5 6 7 8 9 10 11 12
Reading Skills and Strategies
Majo
r E
mp
hasis
by G
rad
e
Not in these grades
Grade 4
Grade 3
Grade 2
Grade 1
Figure 6.5: Grades by which Reading Skills and Strategies Receive First Major Emphasis
Knowing letters (1), knowing letter-sound relationships (2) and reading words
(3) receive major emphasis in Grade 1. Reading isolated sentences (4) is
introduced in 34.8% (SE=3.6%) of schools by Grade 2, while reading connected
text (5) also receives major emphasis in Grade 2 when introduced by 30.5%
(SE= 3.2%) of schools. Identifying the main idea of text (6), explaining or
supporting understanding of text (7), comparing text with personal experience
(8), comparing different texts (9) and making predictions about what will happen
next (10) are for the majority of schools only introduced by Grade 4. The most
complex strategies, namely making generalizations and inferences (11) and
describing the style and structure of the text (12) are reported as not taught in
any of grades 1 to 4, by more than 40% and 60% of principals respectively.
Of concern with the introduction of these different reading skills and strategies is
the fact that many of the complex skills and strategies are introduced at a very
late stage, often not even receiving attention during the Foundation Phase. The
PIRLS 2006 processes of comprehension include complex reading strategies,
similar to those listed in Figure 6.6 (below) that are incorporated into the reading
assessment (e.g. interpret and integrate ideas and information, evaluate and
examine textual elements). The complex reading skills and strategies seem only
to begin to receive attention after the beginning of Grade 4 for most South

177
African learners. With the late introduction of these reading skills and strategies,
the learners already are at a disadvantage in terms of performing appropriately
with their international counterparts.
Figure 6.6 illustrates the effect of early emphasis of more complex reading skills
and strategies on learners’ average reading achievement. The pattern within the
analysis suggests that learner achievement was higher in 6 of the 7 skills for
those learners for whom a skill was introduced in Grade 1 compared to its
introduction in subsequent grades. While it could be justified that the
introduction of such a complex skill is not appropriate at Grade 1 level, learners
for whom the seventh skill, describing text style and structure, was introduced in
Grade 2, performed markedly better than learners for whom the skill was
introduced in later grades.
0
50
100
150
200
250
300
350
400
Identify
ing m
ain
idea
Support
and
expla
in
unders
tandin
g
Pers
onal
experience
Com
paring
diffe
rent
texts
Makin
g
pre
dic
tions
Makin
g
genera
lizations
Describin
g t
ext
sty
le a
nd
str
uctu
re
Reading Skills and Strategies
Avera
ge A
ch
ievem
en
t
Grade 1
Grade 2
Grade 3
Grade 4
Figure 6.6: Average Achievement by Grades of Introduction of Complex Reading Skills and Strategies
Principals reported on the extent to which their capacity to facilitate teaching
and learning was hampered by a shortage of resources such as qualified staff,
instructional materials, physical resources as well as computers and computer
software. On average, 23% (SE=2.5%) of South African learners were in
schools where teaching and learning was hampered by a shortage of
resources. Achievement by these learners was also lower (257, SE=9.1) than
that in schools that were more adequately resourced (350, SE=16.0). This

178
difference is some 90 points higher in contrast to the average 29 point
difference internationally.
According to approximately half of the school principals’ responses, specific
resource deficits that negatively affect the capacity of the school are:
• Insufficient provision of second language teachers
• Lack of instructional material
• Shortage of buildings and school grounds
• Shortage of instructional space
• Lack of computers for instructional purposes
• Lack of computer software
• Shortage of library books
The shortage of library books is affirmed by further principal reports which
indicate that the majority of schools (64.4%, SE=3.4%) in the PIRLS 2006
sample do not have libraries. Only 141 of 265 school principals reported having
libraries at their schools. For those schools with libraries, 24.9% (SE=4.2%)
have 250 or fewer books of different titles, excluding magazines and
periodicals, followed by 23.7% (SE=4.9%) which have between 250 and 500
books. Very few schools in the sample have more than 10 000 books in their
libraries (4.3%, SE=1.5%).
Responses from Grade 5 learners’ teachers in the Teacher Questionnaire
indicate that the average Grade 5 class size included in the South African
PIRLS 2006 study was 42.0 (SE=0.8) learners, which was the largest average
class size of the participating countries, and far higher than the international
average class size of 24 learners. Teachers’ responses indicate that the
majority of Grade 5 teachers do not provide enrichment reading instruction to
their learners (76.3%, SE=2.8%). Table 6.14 reports average reading
achievement scores for Grade 5 learners who receive enrichment reading
instruction compared to those learners who do not:

179
Table 6.14: Reading Achievement Scores with Availability of Enrichment Reading Instruction
N Reading Achievement
SE
Grade 5 learners receiving enrichment reading instruction
3 227 316.1 15.3
Grade 5 learners without enrichment reading instruction
10 282 299.0 7.1
When comparing the average reading scores for these two groups, the
difference in reading achievement for those learners who receive enrichment
reading instruction is higher compared to those who do not, yet not statistically
significant (p=0.018).
In terms of the availability of a reading corner in the classroom, teachers’
responses indicate that 59.9% (SE=2.4%) of Grade 5 learners’ teachers do not
have a reading corner in the classroom. An overwhelming majority of teachers
(46.8%, SE=2.9%) assign reading homework as part of any subject at least
once or twice week. A total of 5.0% (SE=1.0%) of Grade 5 learners’ teachers
reportedly do not assign reading homework at all.
In assuring quality instruction, the majority of Grade 5 learners’ teachers
indicated the following methods of intervention when learners fall behind in
reading (Table 6.15):

180
Table 6.15: Teacher Methods of Intervention for Learners Behind in Reading
Method of Intervention N % of Teachers SE %
Spend more time working with the learner individually
12 2367 89.8 1.6
Arrange for other learners to help the struggling learner
12 060 86.4 2.0
Assign homework for the learner to catch up
12 669 91.3 1.4
Ask the parents to help the learner
13 513 97.1 0.8
In terms of monitoring learners’ progress, teacher reports indicate that teachers
of Grade 5 learners place major emphasis on classroom assessments (57.1%,
SE=3.1%) and their own professional judgment (60.8%, SE=3.4%). Teachers
place very little emphasis on national achievement tests (12.4%, SE=2.1%) to
monitor learner performance. When asked what teachers are likely to do with
assessment results, the majority of Grade 5 learners’ teachers report that they
use these results to assign marks or grades (94.4%, SE=1.5%), adapt their
instruction (84.7%, SE=2.0%), inform parents of the learner’s progress (96.5%,
SE=1.1%), identify learners who are in need of remedial instruction (95.6%,
SE=1.1%) and group learners for instruction (84.9%, SE=1.7%). Some 49.6%
(SE=3.4%) of teachers report that they do not use assessment results to
provide data for national or local monitoring.
Teachers of Grade 5 learners indicated that they use assessment results for
purposes of identifying learners in need of remedial instruction (95.6%,
SE=1.1%). Teachers also estimated that on average 10.4 (SE=0.7) learners per
class are actually in need of remedial reading instruction. However, teacher
reports estimate on average that only 6.5 (SE=0.6) learners actually receive
remedial reading instruction. The data from the PIRLS 2006 study would
therefore suggest that the demand for remedial reading instruction far exceeds
7 In Table 6.15, N refers to the number of learners whose teachers report different methods of
intervention.

181
teachers’ abilities to supply the demand, and that many South African Grade 5
learners are in dire need of additional reading assistance.
6.5.3. Time on Task
School principals were asked to estimate the number of instructional days that
their school was open for teaching and learning. The majority of Grade 5
learners’ principals (30.0%, SE=2.6%) indicated that their schools were open for
195 days of the year. When broken down into instructional time that is available
to learners in a typical school day, the majority of Grade 5 learners’ school
principals (58.6%, SE=2.9%) reported schools to be open for instruction at least
five hours per day, with 22.1% (SE=2.5%) of principals reporting schools as
open for instruction at least 6 hours per day.
The physical time in terms of days per year and hours per week that schools
are open for instruction should not be equated with the type and quality of
education learners receive. However, the times should at least provide an
objective gauge of the availability and the number of opportunities learners are
afforded to interact with teachers and peers in an educational setting away from
the home.
Grade 5 teacher reports reveal that they spend most of their time teaching the
class as a whole (47.9%, SE=1.1%), followed by time spent working with
individual learners (22.5%, SE 0.9%). Time spent on administrative duties
(10.3%, SE=0.4%), on managing discipline (10.9%, SE=0.5%) and on other
duties (8.5%, SE=0.4%) takes up less of teachers’ time at school.
In Grade 4, South African learners switch to English as the LOLT. Grade 5
teachers reportedly spend on average 5.11 hours (SE=0.2) in a typical week on
English language teaching exclusively. This time includes time spent on
activities such as reading, writing, speaking, literature and teaching other
language skills.

182
The PIRLS 2006 international report indicates that on average teachers allocate
30% of instructional time to teaching language and 20% to teaching reading
(Mullis et al., 2007). On average, international Grade 4 learners are taught
explicit reading instruction for more than 6 hours a week. Grade 5 teachers’
reports in the South African study reveal that teachers only spend on average
3.0 hours (SE=0.2) on teaching reading per week, regardless of whether or not
this time is formally scheduled time or made available in the curriculum. On
average, explicit reading time only amounts to 1.3 hours (SE=0.03) per week.
Compared to international patterns of time spent on reading instruction and
reading related activities, South Africa lags far behind on dedicated time and
teachers spend far too little time on explicit reading instruction in the classroom.
Teacher expectations of the time learners should spend on homework that
involves reading for any subject reveal that the majority of Grade 5 learners’
teachers (54.3%, SE=3.1%) expect learners to spend between 16 and 30
minutes per day on such reading homework. Only 10.5% (SE=1.7%) of Grade 5
learners’ teachers expect them to spend at least an hour per day engaging in
some form of reading for homework. Teachers of Grade 5 learners’ own
preferences for reading for enjoyment show that 65.9% (SE=2.8%) of teachers
read every day or almost every day, or at least once or twice a week (28.0%,
SE=2.3%). A very small percentage reportedly never read for their own
enjoyment (0.2%, SE=0.01%).
6.5.4. Opportunities Used
Opportunities afforded to Grade 5 learners to engage in reading at school,
variables related to the existence of informal initiatives, the use of materials in
school and the involvement of parents in school activities were taken from the
PIRLS 2006 School Questionnaire to exhibit the opportunities used by learners
to read.
According to Howie et al. (2007), roughly one-third of learners in the PIRLS
2006 sample attended schools that have a written statement of the reading
curriculum to be taught. Two-thirds of learners attend schools that report having

183
informal initiatives to encourage reading at their schools. Anecdotal evidence of
such initiatives includes reading competitions where learners stand to win prizes
for most books individually read or read as a class. About 50% of learners
attend schools which have school-based programmes and guidelines for
teachers on the teaching of reading. Table 6.16 indicates Grade 5 reading
achievement averages associated with availability of a written reading
curriculum document and informal reading initiatives.
Table 6.16: Average Reading Achievement Associated with Reading Curricula Documents and Informal Reading Initiatives
N Average Reading Achievement
SE
The school has a written reading curriculum document
5 0718 311.6 10.4
The school does not have a written reading curriculum document
9 037 295.6 8.4
Informal reading initiatives exist 9 573 332.0 7.1
Informal reading initiatives do not exist
4 622 256.6 9.3
The opportunities for learners to read are influenced by the availability and use
of different reading materials by the school. Table 6.17 indicates that up to half
of Grade 5 learners’ teachers reported the use of reading series (49.7%,
SE=3.1%) and textbooks (52.8%, SE=3.2%) as the basis of material used for
teaching purposes. A variety of children’s books (43.1%, SE=2.6%), materials
from different curricular areas (39.2%, SE=2.9%) and children’s newspapers
and magazines (46.7%, SE=2.8%) are material only used as supplementary
aides. Computer software is never used to assist children in reading to learn
(75.9%, SE=2.2%).
8 In Table 6.16, N refers to the number of learners whose principals report the availability of
reading curricula documents and informal reading initiatives..

184
Table 6.17: Frequency of Use of Different Types of Reading Material
Type of Reading Material
N % of Teachers SE % Reported Frequency of
Use
Reading series 7 0039 49.7 3.1 Basis of instruction
Textbooks 8 220 52.8 3.2 Basis of instruction
Children’s newspapers and magazines
6 334 43.1 2.6 As supplement
Materials from different curricular areas
5 647 39.2 2.9 As supplement
Computer software 10 886 75.9 2.2 Never used
Reports of opportunities that are created by school principals to interact with
Grade 5 learners’ parents accentuate the importance of the continued
connection between the home and the school and communication and
involvement of parents in school events, meetings and activities.
Table 6.18 indicates the effect of Grade 5 learners’ principals who involve
parents at school on these learners’ reading achievement scores compared to
principals who never involve parents in school-related activities:
9 In Table 6.17, N refers to the number of learners whose teachers report the frequency of use
of different types of reading material.

185
Table 6.18: Parental Involvement Associations with Reading Achievement Scores
Activities N Reading Achievement
SE
Parent-teacher conferences 4-7 times annually
4 83910 319.6 12.6
Parent-teacher conferences once annually
1 778 259.1 10.0
Invitations to general events at school (7 times or more annually)
1 943 380.3 26.4
No invitations to general events at school
284 237.0 20.0
Report cards sent home seven or more times annually
422 383.5 60.3
Report cards never sent home
53 266.5 8.5
As indicated by Table 6.18, learners whose principals reported sending report
cards home seven or more times a year achieved (383.5, SE=60.3) on average
nearly 120 points more than Grade 5 learners from those schools where report
cards were never sent home (266.5, SE=8.5).
The importance of the home-school connection and opportunities that are
created by schools for parental participation is illustrated by the PIRLS 2006
data for the South African Grade 5 learners. Future cycles of PIRLS,
educational achievement of learners of all ages, and strategic intervention are
influenced by the growing incidence of HIV/AIDS amongst people in South
Africa, not only affecting families, but also schools’ capacity to provide healthy,
productive teaching staff. The prevalence of child-headed households is on the
increase in South Africa, as is the incidence of children living with grandparents
or other caretakers. It is therefore expected that the home-school connection,
specifically with regards to the involvement of parents and primary caregivers of
10
In Table 6.18, N refers to the number of learners whose principals report parental involvement associated with achievement scores.

186
children, is likely to deteriorate if the current effects of HIV/AIDS were to
escalate further.
Another factor that impedes the home-school connection is the role of poverty in
preventing parents from attending school functions, even when invited.
Anecdotally, it has been noted that school principals in rural areas specifically
often have trouble in attracting parents to school for parents’ fears of being
asked to pay school fees which they cannot afford. Often the school’s best
intentions and efforts to involve parents in their children’s education are met
with suspicion and refusal to participate in school functions.
Opportunities for reading instruction and reading related activities created by
Grade 5 learners’ teachers reveal that a moderate percentage of teachers
(39.1%, SE=3.3%) engage their learners in reading activities three or four days
a week. Of concern is the 30.8% (SE=2.8%) of Grade 5 learners’ teachers who
reportedly afford their learners fewer than three occasions weekly to engage in
reading activities.
Apart from the opportunities to read, teachers also reported on the resources
they use when creating these opportunities for their learners. As many as 53%
(SE=3.7%) of Grade 5 learners’ teachers reported using textbooks every day or
almost every day. Curiously, the average achievement of learners whose
teachers reported to never using textbooks was higher (371.0, SE=56.7) than
that of their counterparts who reported daily use of textbooks (294.5, SE=7.9).
Only 13.0% (SE=2.2%) of Grade 5 learners had teachers who reported using a
variety of children’s books for reading instruction every day or almost every day,
while the majority of Grade 5 learners’ teachers (87.6%, SE=2.1%) reportedly
never use computer software for the teaching of reading. This high percentage
is indicative of the number of classrooms in South African schools which have
as yet no access to computers, software or the Internet.
The reliance on textbooks by a large percentage of teachers of Grade 5
learners must be seen within the context of teaching in many schools in South
Africa. Not only are textbooks often the only source available to the teacher as

187
an aide to teaching reading, but the quality of these books is debatable.
Anecdotal evidence gathered specifically during school visits in rural areas
points to many outdated Afrikaans and English textbooks having been handed
down to rural schools. In some cases, these books can be found unused on
shelves, but alarmingly, there are schools where these outdated books are
being put to use. In addition, teachers often rely on textbooks to the extent that
learners are not afforded the opportunity to take these books home for fear of
damage or loss. Thus, learners’ only exposure to books is often in the form of
textbooks, and then only for the limited time the learner is present in class.
Table 6.19 indicates the percentages of Grade 5 learners whose teachers
create opportunities for them to read different types of texts every day or almost
every day, and illustrates that most children are exposed to short stories, factual
descriptions and charts, diagrams and graphs.
Table 6.19: Grade 5 Learners Exposure to Different Types of Text
Type of Text N % of Learners SE %
Short stories 2 173 16.7 2.9
Longer books with chapters 438 4.6 1.5
Poems 326 3.6 1.3
Plays 545 3.5 1.2
Descriptions and explanations about things, people and events
2 255 18.6 2.6
Instructions or manuals about how things work
2 253 9.9 2.6
Charts, diagrams and graphs 2 588 20.2 2.5
South African children are mostly exposed to reading skills such as decoding
strategies and understanding vocabulary during the Foundation Phase (Grades
1 to 3). According to Pretorius (2002), the Intermediate Phase (Grades 4 to 6)
affords them the opportunity to use reading as a language and information
processing skill, as they are largely expected to be able to decode text. At
Grade 4, learners should also begin the switch from learning the lower level
188
skills in learning to read, to adapting those skills in order to use reading as a
tool to learn.
Teachers of Grade 5 learners in PIRLS 2006 report in 21.6% (SE=2.5%) of
cases to engaging learners daily in decoding strategies, compared to 69.0%
(SE=0.5%) of teachers of Grade 4 learners internationally.
In terms of time allocated to reading activities in the classroom, more than half
the Grade 5 learners (53.6%, SE=3.4%) had teachers who reported reading
aloud to the whole class every day or almost every day. For these learners, this
reading is the most frequent activity listed by teachers. Reading aloud to the
class is a teacher-centred rather than learner-centred approach, where learners
are only involved passively and where the teacher mainly assumes that learners
are able to follow and understand what is being read. Also of concern are the
low frequencies at which learners are afforded the opportunity to read
independently.
Only 32.5% (SE=2.8%) of Grade 5 learners’ teachers report that learners have
the opportunity to read independently as little as once or twice a month. Given
the lack of opportunity afforded to Grade 5 learners to read independently, it
would be understandable if the format of the PIRLS 2006 reading assessment
(consisting of reading booklets composed of reading passages for each child
individually) had been an intimidating and foreign experience for many South
African Grade 4 and Grade 5 learners. For the 20.7% (SE=2.5%) of Grade 5
learners who are afforded daily opportunities to read silently on their own,
achievement scores were almost 100 points higher (371.1, SE=19.1) than for
those who never read independently (298.4, SE=30.4).
Figure 6.7 indicates the percentage of Grade 5 learners’ exposure to every day
reading activities that are aimed to develop their reading comprehension skills
and strategies:

189
0%
5%
10%
15%
20%
25%
30%
35%
40%
45%
Identify
main
ideas
Expla
in o
r
support
unders
tandin
g
Com
pare
with
experiences
Com
pare
with
what
was r
ead
Make
pre
dic
tions
Make
genera
lisations
Describe t
ext
sty
le
Perc
en
tag
e o
f le
arn
ers
Figure 6.7: Percentages of Grade 5 Learners Exposed to Types of Reading Comprehension Activities
In the foregoing sections it has been mentioned that the time teachers spend
with learners in the classroom on explicit reading instruction is far too
constrained in comparison to international patterns of time spent on formal
reading instruction. Figure 6.7 adds to the gloomy picture painted by teacher
reports on reading activities in the class, since it illustrates that Grade 5 learners
are mostly exposed to identifying main ideas and explaining their understanding
of text. Higher order comprehension skills that should also receive attention
(such as the ability to compare what was read with own experiences, making
predictions, making generalizations and describing the text style) are activities
with noticeably lower frequencies. The PIRLS 2006 assessment included in its
assessment framework items of a higher order nature. With the limited
opportunities for South African Grade 5 learners of exposure to such skills in the
classroom on a daily basis, it is hardly surprising that Grade 5 reading
achievement scores failed to meet international patterns of Grade 4 reading
abilities.