Embed Size (px)
Citation preview

FDIC CommunIty BankIng StuDy ■ DeCemBer 2012 5–1
Chapter 5 - Comparative Performance of Community Bank Lending Specialty Groups
IntroductionCommunity banks are defined in large part by their focus on traditional lending and deposit gathering activities. However, over the study period, the composition of their loan portfolios has changed. This chapter begins with discussion of overall lending trends in the banking indus-try and documents how community banks have shifted their focus away from retail and toward commercial lend-ing, with a particular emphasis on loans secured by commercial real estate. Next, community banks are char-acterized by their lending specialty to observe how their business strategy has changed over time and to measure the relative performance of different business models. The chapter concludes with a discussion of commercial real estate lending trends and the implications of this lending strategy on the financial performance of community banks.
The Changing Composition of Community Bank Asset PortfoliosChapter 4 described the gradual increase in the riskiness of community bank asset portfolios over the study period, driven by increases in loans as a percent of total assets and holdings of longer-maturity loans and securities. Another important trend that altered community bank loan portfo-lios over this period was the shift away from a retail focus and toward a commercial focus. This occurred as noncom-munity banks were shifting their portfolios in the opposite direction, from a commercial to a retail lending focus, and generally reducing the share of loans on their balance sheets. Chart 5.1 shows that retail loans (1-4 family resi-dential real estate loans and loans to individuals) repre-sented over 61 percent of all loans at community banks in 1984, compared with 35 percent of all loans at noncom-munity banks. By the end of 2011, these ratios had virtu-ally reversed, as retail loans made up 36 percent of community bank loans and 54 percent of noncommunity bank loans.
While this shift was taking place, community banks remained focused on loans secured by real estate. At the end of 1984, 70 percent of all community bank loans were secured by real estate, a share that rose to 78 percent by 2011. Over time, community banks shifted the primary
emphasis of their real estate lending from residential real estate loans to commercial real estate loans, including construction loans. Between 1984 and 2011, residential real estate loans fell from 47 percent of community bank total loans to 32 percent, while commercial real estate loans rose from 21 percent of loans to 42 percent. By comparison, total real estate loans held by noncommunity banks increased from 36 percent of all loans in 1984 to 51 percent at the end of 2011. All of the increase in real estate lending by noncommunity banks during this period can be accounted for by a rise in their holdings of residen-tial mortgages.
Table 5.1 depicts the overall changes in the portfolio composition of community and noncommunity banks over the period of the study. It shows the shift in community bank assets from securities to loans, led by increases in construction loans and other commercial real estate loans, as well as agricultural loans. Meanwhile, community bank holdings of consumer loans and residential mortgages declined as a percent of assets, while commercial and industrial (C&I) loans remained steady at just over 8 percent of total assets. Community banks continued to represent a significant source of credit to local farms and businesses. As of 2011, community banks held 14 percent of banking industry assets, but 46 percent of the industry’s small loans to farms and businesses.1 Noncommunity
1 Small loans to business are nonfarm, nonresidential and C&I loans in amounts under $1 million and farmland and agricultural production loans in amounts under $500,000. Prior to the March 31, 2010, Call Report, they were reported annually on the June 30 Call Report.
Chart 5.1
0%
10%
20%
30%
40%
50%
60%
70%
1984 1986 1988 1990 1992 1994 1996 1998 2000 2002 2004 2006 2008 2010
Community Banks
Noncommunity Banks
Retail Loans as a Percent of Total Loans and Leases, 1984-2011
Source: FDIC. Note: Retail loans include loans secured by 1-4 family residential real estate properties plus loans to individuals.
Percent of Total Loans and Leases

FDIC CommunIty BankIng StuDy ■ DeCemBer 2012 5–2
banks had sizable increases in their percentage holdings of securities, residential mortgages and consumer loans, which were offset by declines in percentage holdings of C&I loans, construction loans and other commercial real estate loans, and other loans and leases. Agricultural loans continued to make up less than 1 percent of total assets at noncommunity banks. Total assets at noncommunity banks increased more than fivefold over the study period,
while their holdings of consumer loans increased more than sixfold, and their holdings of mortgage loans increased almost sevenfold.
Lending Specialty GroupsBeyond analyzing the changes in the aggregate lending mix at both community and noncommunity banks, it is
Table 5.1 Changes in the Portfolio Composition of Community and Noncommunity Banks, 1984-2011
Loan or Asset Category
Community BanksYear-End 1984 Year-End 2011
Dollars in Billions
Percent of Total Assets
Dollars in Billions
Percent of Total Assets
Mortgage Loans* $399.7 29.0% $400.3 20.3%Consumer Loans $114.3 8.3% $53.0 2.7%Commercial Real Estate (CRE) Loans** $182.1 13.2% $523.8 26.6%
Construction and Development (C&D) Loans $34.0 2.5% $83.8 4.3%Commercial and Industrial (C&I) Loans $115.1 8.3% $163.5 8.3%Agricultural Loans*** $35.4 2.6% $85.5 4.3%Other Loans and Leases $1.6 0.1% $21.4 1.1%Less: Loan Loss Provisions and Unearned Income $14.3 1.0% $23.5 1.2%Net Loans and Leases $834.0 60.4% $1,224.0 62.0%Securities $350.9 25.4% $450.1 22.8%Other Assets $194.9 14.1% $298.6 15.1%Total Assets $1,379.8 100.0% $1,972.7 100.0%
Loan or Asset Category
Noncommunity BanksYear-End 1984 Year-End 2011
Dollars in Billions
Percent of Total Assets
Dollars in Billions
Percent of Total Assets
Mortgage Loans* $299.8 13.2% $2,088.3 17.5%Consumer Loans $196.7 8.7% $1,254.6 10.5%Commercial Real Estate (CRE) Loans* $203.6 9.0% $994.9 8.3%
Construction and Development (C&D) Loans $67.3 3.0% $156.2 1.3%Commercial and Industrial (C&I) Loans $466.9 20.5% $1,183.1 9.9%Agricultural Loans*** $15.2 0.7% $44.5 0.4%Other Loans and Leases $235.7 10.4% $663.0 5.6%Less: Loan Loss Provisions and Unearned Income $27.5 1.2% $169.4 1.4%Net Loans and Leases $1,390.4 61.2% $6,059.1 50.8%Securities $322.8 14.2% $2,400.2 20.1%Other Assets $560.1 24.6% $3,460.2 29.0%Total Assets $2,273.3 100.0% $11,919.5 100.0%Source: FDIC.* Mortgage loans include home equity lines of credit, junior liens and other loans secured by residential real estate.**CRE loans include construction and development (C&D) loans, loans secured by multifamily properties, and loans secured by nonfarm, nonresidential real estate.*** Agricultural loans include production loans and loans secured by farm real estate.
Table 5.2 Holdings of Major Loan Types by FDIC-Insured Community Banks, Year-End 2011
Loan Type
Percent of Community Banks With
Positive Holdings
Loan Type as Percent of Total Assets
Mean
Percentiles
5th 10th 25th50th
(Median) 75th 90th 95thCommercial Real Estate (CRE) Loans 99.3% 21.4% 1.9% 3.6% 8.9% 19.4% 31.4% 41.9% 48.3%Construction and Development (C&D)
Loans (Subset of CRE) 90.2% 3.5% 0.0% 0.0% 0.7% 2.4% 5.2% 8.3% 10.7%Mortgage Loans 99.4% 19.8% 2.6% 4.8% 9.4% 16.4% 26.0% 40.8% 50.6%Agricultural Loans 77.0% 8.1% 0.0% 0.0% 0.0% 2.3% 11.5% 25.7% 34.6%Commercial and Industrial (C&I) Loans 96.8% 7.7% 0.3% 1.4% 3.5% 6.4% 10.4% 15.4% 19.5%Consumer Loans 99.1% 3.3% 0.1% 0.3% 0.9% 2.2% 4.2% 7.1% 9.4%Source: FDIC. Based on 6,799 community banks reporting at year-end 2011.
FDIC CommunIty BankIng StuDy ■ DeCemBer 2012 5–3
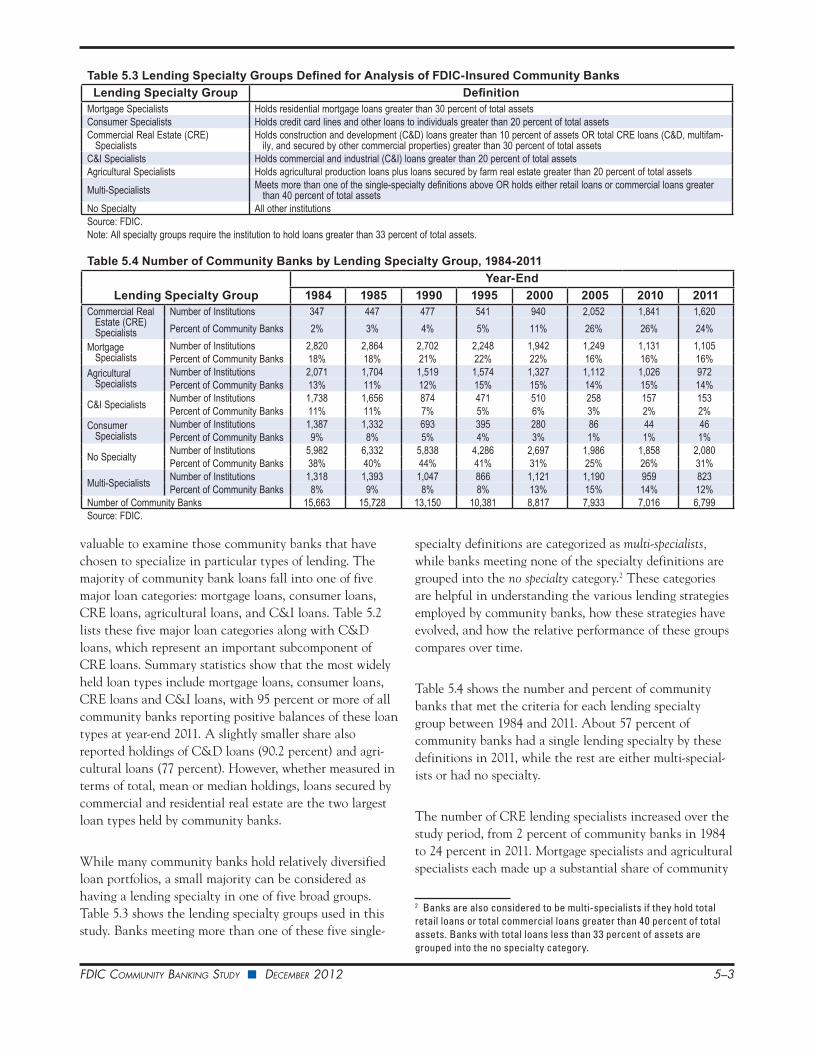
valuable to examine those community banks that have chosen to specialize in particular types of lending. The majority of community bank loans fall into one of five major loan categories: mortgage loans, consumer loans, CRE loans, agricultural loans, and C&I loans. Table 5.2 lists these five major loan categories along with C&D loans, which represent an important subcomponent of CRE loans. Summary statistics show that the most widely held loan types include mortgage loans, consumer loans, CRE loans and C&I loans, with 95 percent or more of all community banks reporting positive balances of these loan types at year-end 2011. A slightly smaller share also reported holdings of C&D loans (90.2 percent) and agri-cultural loans (77 percent). However, whether measured in terms of total, mean or median holdings, loans secured by commercial and residential real estate are the two largest loan types held by community banks.
While many community banks hold relatively diversified loan portfolios, a small majority can be considered as having a lending specialty in one of five broad groups. Table 5.3 shows the lending specialty groups used in this study. Banks meeting more than one of these five single-
specialty definitions are categorized as multi-specialists, while banks meeting none of the specialty definitions are grouped into the no specialty category.2 These categories are helpful in understanding the various lending strategies employed by community banks, how these strategies have evolved, and how the relative performance of these groups compares over time.
Table 5.4 shows the number and percent of community banks that met the criteria for each lending specialty group between 1984 and 2011. About 57 percent of community banks had a single lending specialty by these definitions in 2011, while the rest are either multi-special-ists or had no specialty.
The number of CRE lending specialists increased over the study period, from 2 percent of community banks in 1984 to 24 percent in 2011. Mortgage specialists and agricultural specialists each made up a substantial share of community
2 Banks are also considered to be multi-specialists if they hold total retail loans or total commercial loans greater than 40 percent of total assets. Banks with total loans less than 33 percent of assets are grouped into the no specialty category.
Table 5.3 Lending Specialty Groups Defined for Analysis of FDIC-Insured Community BanksLending Specialty Group Definition
Mortgage Specialists Holds residential mortgage loans greater than 30 percent of total assetsConsumer Specialists Holds credit card lines and other loans to individuals greater than 20 percent of total assetsCommercial Real Estate (CRE)
SpecialistsHolds construction and development (C&D) loans greater than 10 percent of assets OR total CRE loans (C&D, multifam-
ily, and secured by other commercial properties) greater than 30 percent of total assetsC&I Specialists Holds commercial and industrial (C&I) loans greater than 20 percent of total assetsAgricultural Specialists Holds agricultural production loans plus loans secured by farm real estate greater than 20 percent of total assetsMulti-Specialists Meets more than one of the single-specialty definitions above OR holds either retail loans or commercial loans greater
than 40 percent of total assetsNo Specialty All other institutionsSource: FDIC.Note: All specialty groups require the institution to hold loans greater than 33 percent of total assets.
Table 5.4 Number of Community Banks by Lending Specialty Group, 1984-2011
Lending Specialty GroupYear-End
1984 1985 1990 1995 2000 2005 2010 2011Commercial Real
Estate (CRE) Specialists
Number of Institutions 347 447 477 541 940 2,052 1,841 1,620Percent of Community Banks 2% 3% 4% 5% 11% 26% 26% 24%
Mortgage Specialists
Number of Institutions 2,820 2,864 2,702 2,248 1,942 1,249 1,131 1,105Percent of Community Banks 18% 18% 21% 22% 22% 16% 16% 16%
Agricultural Specialists
Number of Institutions 2,071 1,704 1,519 1,574 1,327 1,112 1,026 972Percent of Community Banks 13% 11% 12% 15% 15% 14% 15% 14%
C&I Specialists Number of Institutions 1,738 1,656 874 471 510 258 157 153Percent of Community Banks 11% 11% 7% 5% 6% 3% 2% 2%
Consumer Specialists
Number of Institutions 1,387 1,332 693 395 280 86 44 46Percent of Community Banks 9% 8% 5% 4% 3% 1% 1% 1%
No Specialty Number of Institutions 5,982 6,332 5,838 4,286 2,697 1,986 1,858 2,080Percent of Community Banks 38% 40% 44% 41% 31% 25% 26% 31%
Multi-Specialists Number of Institutions 1,318 1,393 1,047 866 1,121 1,190 959 823Percent of Community Banks 8% 9% 8% 8% 13% 15% 14% 12%
Number of Community Banks 15,663 15,728 13,150 10,381 8,817 7,933 7,016 6,799Source: FDIC.
FDIC CommunIty BankIng StuDy ■ DeCemBer 2012 5–4
banks over the study period, although the number and share of mortgage specialists declined after 2000. The share of consumer specialists declined sharply during the study period, from 9 percent of community banks in 1984 to 1 percent (or just 46 banks) in 2011, as noncommunity banks increasingly migrated toward this line of business. Although the total share of C&I loans held by community banks as a percent of assets in 2011 remained unchanged from 1984 (at 8 percent), fewer community banks (in both number and percent) were C&I specialists by the end of the study. Over 11 percent of community banks qualified as C&I specialists in 1984, but only 2 percent (153 banks) met that definition in 2011. Community banks with no lending specialty represented a significant share of commu-nity banks each year, and were the largest group of community banks in 2011 (31 percent). Multi-specialists
increased slightly during the study period, from 8 percent of community banks in 1984 to 12 percent in 2011.
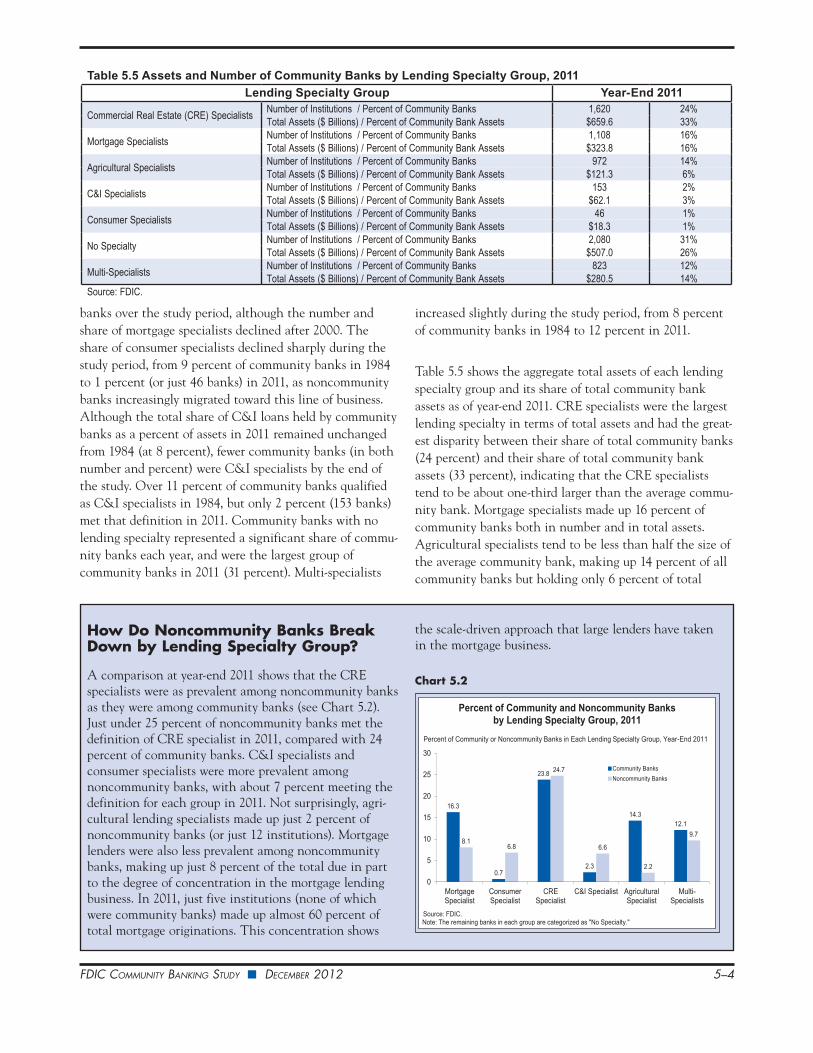
Table 5.5 shows the aggregate total assets of each lending specialty group and its share of total community bank assets as of year-end 2011. CRE specialists were the largest lending specialty in terms of total assets and had the great-est disparity between their share of total community banks (24 percent) and their share of total community bank assets (33 percent), indicating that the CRE specialists tend to be about one-third larger than the average commu-nity bank. Mortgage specialists made up 16 percent of community banks both in number and in total assets. Agricultural specialists tend to be less than half the size of the average community bank, making up 14 percent of all community banks but holding only 6 percent of total
Table 5.5 Assets and Number of Community Banks by Lending Specialty Group, 2011Lending Specialty Group Year-End 2011
Commercial Real Estate (CRE) Specialists Number of Institutions / Percent of Community Banks 1,620 24%Total Assets ($ Billions) / Percent of Community Bank Assets $659.6 33%
Mortgage Specialists Number of Institutions / Percent of Community Banks 1,108 16%Total Assets ($ Billions) / Percent of Community Bank Assets $323.8 16%
Agricultural Specialists Number of Institutions / Percent of Community Banks 972 14%Total Assets ($ Billions) / Percent of Community Bank Assets $121.3 6%
C&I Specialists Number of Institutions / Percent of Community Banks 153 2%Total Assets ($ Billions) / Percent of Community Bank Assets $62.1 3%
Consumer Specialists Number of Institutions / Percent of Community Banks 46 1%Total Assets ($ Billions) / Percent of Community Bank Assets $18.3 1%
No Specialty Number of Institutions / Percent of Community Banks 2,080 31%Total Assets ($ Billions) / Percent of Community Bank Assets $507.0 26%
Multi-Specialists Number of Institutions / Percent of Community Banks 823 12%Total Assets ($ Billions) / Percent of Community Bank Assets $280.5 14%
Source: FDIC.
How Do Noncommunity Banks Break Down by Lending Specialty Group?
A comparison at year-end 2011 shows that the CRE specialists were as prevalent among noncommunity banks as they were among community banks (see Chart 5.2). Just under 25 percent of noncommunity banks met the definition of CRE specialist in 2011, compared with 24 percent of community banks. C&I specialists and consumer specialists were more prevalent among noncommunity banks, with about 7 percent meeting the definition for each group in 2011. Not surprisingly, agri-cultural lending specialists made up just 2 percent of noncommunity banks (or just 12 institutions). Mortgage lenders were also less prevalent among noncommunity banks, making up just 8 percent of the total due in part to the degree of concentration in the mortgage lending business. In 2011, just five institutions (none of which were community banks) made up almost 60 percent of total mortgage originations. This concentration shows
the scale-driven approach that large lenders have taken in the mortgage business.
Chart 5.2
16.3
0.7
23.8
2.3
14.312.1
8.16.8
24.7
6.6
2.2
9.7
0
5
10
15
20
25
30
MortgageSpecialist
ConsumerSpecialist
CRESpecialist
C&I Specialist AgriculturalSpecialist
Multi-Specialists
Community BanksNoncommunity Banks
Source: FDIC. Note: The remaining banks in each group are categorized as "No Specialty."
Percent of Community or Noncommunity Banks in Each Lending Specialty Group, Year-End 2011
Percent of Community and Noncommunity Banks by Lending Specialty Group, 2011

FDIC CommunIty BankIng StuDy ■ DeCemBer 2012 5–5
community bank assets. C&I specialists comprised 2 percent of the number of community banks, but 3 percent of total community bank assets, indicating that they were larger than the average community bank. Consumer specialists comprised 1 percent of both the number and total assets of community banks. Those community banks with no lending specialty or that are multi-specialists reported 26 percent and 14 percent of total community bank assets, respectively. This indicates that community banks with no lending specialty tend to be smaller than the average community bank, while multi-specialists tend to be slightly larger.
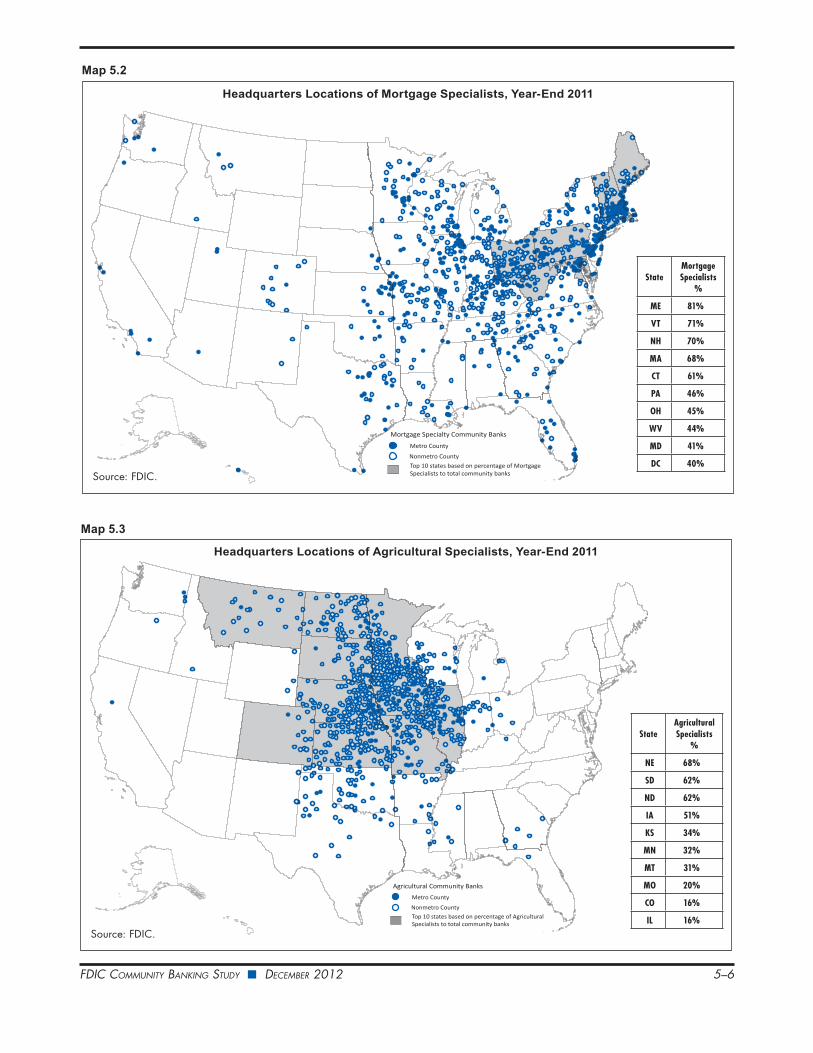
The Geography of the Lending Specialist GroupsAs might be expected, community banks with the same lending specialty tend to have relatively similar geographic characteristics. Maps 5.1 through 5.6 show the headquar-ters of community banks with CRE, mortgage, and agricul-ture specialties, as well as the headquarters of multi-specialists, banks with no lending specialty, and those with at least 10 percent of total assets in C&D loans. Each map shades the ten states that had the highest proportion of community banks with that particular lend-
ing specialty, and differentiates between metro and nonmetro headquarters locations.3
As Map 5.1 shows, CRE specialists were primarily head-quartered in metro counties (80 percent) and tended to be located in the West and the Southeast, where more than one-half of community banks had a CRE lending specialty. Nonetheless, only about one-quarter of CRE specialists were headquartered in the ten most concentrated states and the remaining CRE specialists are distributed across the country.
Mortgage specialists also tended to be headquartered in metro counties (61 percent) and are largely located in the eastern half of the country as shown in Map 5.2. In partic-ular, the Northeast and nearby states had the highest concentration of mortgage specialists. In Maine, Vermont, New Hampshire, and Massachusetts, mortgage specialists made up at least two-thirds of community banks.
Not surprisingly, agricultural specialists were largely head-quartered in nonmetro areas (84 percent) and tightly clus-
3 In this geographic analysis, states include the District of Columbia, but do not include U.S. Territories.
Headquarters Locations of CRE Specialists, Year-End 2011
Source: FDIC.
Metro County
Nonmetro County
Commercial Real Estate Community Banks
Top 10 states based on percentage of CRE Specialists to total community banks
StateCRE
Specialists %
DE 89%
CA 70%
AK 67%
OR 67%
FL 64%
DC 60%
AZ 58%
UT 55%
NV 54%
NC 53%
Map 5.1
FDIC CommunIty BankIng StuDy ■ DeCemBer 2012 5–6
Headquarters Locations of Mortgage Specialists, Year-End 2011
Source: FDIC.
Metro County
Nonmetro County
Mortgage Specialty Community Banks
Top 10 states based on percentage of Mortgage Specialists to total community banks
StateMortgage Specialists
%
ME 81%
VT 71%
NH 70%
MA 68%
CT 61%
PA 46%
OH 45%
WV 44%
MD 41%
DC 40%
Headquarters Locations of Agricultural Specialists, Year-End 2011
Source: FDIC.
Metro County
Nonmetro County
Agricultural Community Banks
Top 10 states based on percentage of Agricultural Specialists to total community banks
StateAgricultural Specialists
%
NE 68%
SD 62%
ND 62%
IA 51%
KS 34%
MN 32%
MT 31%
MO 20%
CO 16%
IL 16%
Map 5.2
Map 5.3

FDIC CommunIty BankIng StuDy ■ DeCemBer 2012 5–7
Headquarters Locations of Community Banks That Are Multi-Specialists, Year-End 2011
Source: FDIC.
Metro County
Nonmetro County
Multi Specialty Community Banks
Top 10 states based on percentage of multi specialty community banks to total community banks
StateMulti-
Specialists %
DE 36%
CA 31%
AK 24%
OR 22%
FL 20%
DC 17%
AZ 17%
UT 17%
NV 16%
NC 16%
Headquarters Locations of Community Banks With No Lending Speciality, Year-End 2011
Source: FDIC.
Metro County
Nonmetro County
No Lending Specialty Community Banks
Top 10 states based on percentage of community banks with no lending specialty to total community banks
StateNo
Specialty %
AL 59
MS 58
TX 51
OK 48
AR 47
LA 47
KY 43
WV 41
IL 39
KS 39
Map 5.4
Map 5.5

FDIC CommunIty BankIng StuDy ■ DeCemBer 2012 5–8
tered in the center of the country as shown in Map 5.3. In Nebraska, South Dakota, North Dakota, and Iowa, more than one-half of community banks were agricultural specialists. In total, the ten most concentrated states for agricultural specialists had 84 percent of all community banks with that specialty.
Map 5.4 shows that multi-specialists were distributed throughout the country, but were more likely to be found in metro counties (57 percent) than in nonmetro counties. States with the highest concentration of such institutions
Headquarters Locations of Community Banks With at Least 10 Percent of Total Assets in C&D Loans, Year-End 2011
Source: FDIC.
Metro County
Nonmetro County
C&D Community Banks
Top 10 states based on percentage of C&D Specialists to total community banks
StateC&D
Concentrated %
UT 31
NC 29
DE 22
SC 21
GA 19
VA 19
TN 16
WA 13
AZ 13
CO 12
Table 5.6 Pretax Return on Assets (ROA) by Lending Specialty Group, 1985-2011
Lending Specialty Group
Time PeriodFive-Year Intervals
2011All Years: 1985-20111986-1990 1991-1995 1996-2000 2001-2005 2006-2010
Agricultural Specialists 0.98% 1.68% 1.65% 1.50% 1.25% 1.38% 1.40%Consumer Specialists 0.85% 1.55% 1.55% 1.44% 0.89% 2.22% 1.27%C&I Specialists 0.60% 1.09% 1.50% 1.45% 1.04% 0.89% 1.03%Mortgage Specialists 0.55% 1.24% 1.39% 1.33% 0.63% 0.69% 1.00%CRE Specialists -1.57% 0.75% 1.78% 1.68% 0.25% 0.37% 0.64%No Specialty 0.88% 1.48% 1.62% 1.42% 1.05% 1.08% 1.28%Multi-Specialists 0.28% 1.15% 1.65% 1.52% 0.69% 0.72% 0.98%Total 0.47% 1.31% 1.56% 1.49% 0.60% 0.75% 1.02%Source: FDIC. Note: Figures represent weighted average pretax return on assets for federally insured community banks reporting in each group during the period.
What Factors Explain Differences in Pretax ROA Among Community Banks?
Local economic conditions have important influences on pretax ROA, but individual bank management deci-sions do as well.
To evaluate which bank management decisions are most important in determining the pretax ROA of commu-nity banks, a model constructed for this study estimates the effects of factors such as bank underwriting stan-
Map 5.6

FDIC CommunIty BankIng StuDy ■ DeCemBer 2012 5–9
were clustered in the Pacific Northwest. However, multi-specialists were not as common as other lending special-ties. Rhode Island and Idaho were the only states where multi-specialists made up more than one-quarter of community banks.
Community banks with no lending specialty were also widely distributed, but were more likely to be headquar-tered in nonmetro counties (59 percent) than in metro counties as shown in Map 5.5. States with the highest proportion of banks with no lending specialty were located in the South and Midwest. Over half of community banks in Alabama, Mississippi and Texas had no lending specialty.
Finally, community banks with at least 10 percent of assets in C&D loans were primarily located in metro areas (74 percent), and clustered in the Southeast and the West, as shown in Map 5.6. Utah, North Carolina, Delaware, and South Carolina were the only states where such institu-tions make up more than 20 percent of community banks.
Performance Comparisons Across Community Bank Lending Specialty GroupsThe long time series of data for community banks permits a comparative analysis of the performance of these lending specialties over the study period. This section examines pretax ROA, the income and expense components of pretax ROA, and the incidence of failures across the lend-ing specialty groups.
Table 5.6 compares the weighted average pretax ROA for community banks in each lending specialty group over five-year intervals and for the entire study period. Agricul-tural specialists (with a weighted average pretax ROA of 1.4 percent) were the strongest performers over the entire study period, followed by the no specialty group (1.28 percent) and consumer specialists (1.27 percent). CRE specialists, with an average pretax ROA of 0.64 percent, were the weakest performers over the entire study period. In the middle were three groups with very similar overall performance in terms of pretax ROA: multi-specialists
dards, loan growth, capital base, funding mix, lending specializations, security investments, and staffing. Based on a sample period that extends from 1994 through 2011, the model also controls for changes in macroeconomic conditions over time, as well as differences between indi-vidual banks that do not change over time.1 The model focuses on community banks that raise 50 percent or more of their deposits from a single county, which would typically imply that most of the banks’ lending activity is also confined to this geographic area. By targeting these “very local” community banks, the model can control for local economic conditions by introducing county-level data on unemployment, home prices, credit card delin-quencies, and wage growth.
The model finds that community banks that “stick to the basics” with regard to lending and deposit gathering typi-cally perform better than other community banks. Higher ROAs are associated with higher loan volumes, as opposed to higher volumes of other assets such as securi-ties, and a more diversified loan portfolio. Holdings of commercial and industrial (C&I), construction and development (C&D) and other commercial real estate (CRE) loans are associated with lower ROA compared with holdings of other asset types. Moreover, specializing in these commercial loan types especially hurts the earn-ings of “local” banks that do more business outside of their local area. Minimizing nonperforming loans also
1 Typically, this would be referred to as a 9 panel dataset.
increases ROA, implying that solid underwriting and loan administration practices are important to commu-nity bank profitability. Banks that limit their use of noncore funding and maintain lower overall funding costs also generate relatively higher returns. Last, community banks appear to benefit when retail banking in the county is concentrated in fewer institutions, indi-cating less competition in the local market area.
The model also provides a useful framework for testing the extent to which economies of scale exist for this set of local community banks. The model finds modest, but statistically significant, gains in ROA as banks exceed the average size. For the sample of banks that raised more than 75 percent of their deposits from one county, the gain is maximized when asset size approaches $1 billion.2 The estimated increase in ROA that accrues from above-average size is relatively small—about 6 basis points in all—and most of this benefit is realized when asset size reaches about $600 million. Taken together, these results indicate that asset size offers very limited benefits in determining the financial performance of local commu-nity banks.
See: http://www.fdic.gov/regulations/resources/cbi/report/cbi-roa.pdf.
2 The ROA analysis adjusts asset size to constant dollars as of the fourth quarter of 2000.

FDIC CommunIty BankIng StuDy ■ DeCemBer 2012 5–10
(0.98 percent), mortgage specialists (1 percent) and C&I specialists (1.03 percent).
The worst average performance for all community banks and for every lending specialty group occurred during the 1986-1990 and 2006-2010 periods. These periods were marked by high credit losses and large numbers of bank failures. The three five-year intervals from 1991 through 2005 represent a time of comparatively strong performance across the lending specialty groups. Every lending specialty group reported an average pretax ROA of at least 1 percent in each five-year interval between 1991 and 2005 with one
exception, when CRE specialists earned just 0.75 percent in the period 1991-1995. CRE specialists clearly experi-enced the most volatile earnings performance as shown in Table 5.6, reporting the lowest pretax ROA of any group in three intervals (1986-1990, 1991-1995, and 2006-2010), and the highest pretax ROA of any group in the other two intervals (1996-2000 and 2001-2005). However, this elevated volatility of earnings for CRE specialists was not accompanied with higher average earnings. Over the entire study period, the pretax ROA of CRE specialists trailed the community bank average by more than one-third.
Table 5.7 Net Interest Income to Average Assets by Lending Specialty Group, 1985-2011
Lending Specialty Group
Time PeriodFive-Year Intervals
2011All Years: 1985-20111986-1990 1991-1995 1996-2000 2001-2005 2006-2010
Consumer Specialists 4.14% 4.47% 4.41% 3.97% 3.84% 4.12% 4.25%C&I Specialists 4.10% 4.36% 4.34% 4.01% 3.89% 3.35% 4.13%Agricultural Specialists 3.90% 4.13% 3.97% 3.84% 3.67% 3.66% 3.86%CRE Specialists 2.19% 4.07% 4.40% 3.96% 3.54% 3.53% 3.62%Mortgage Specialists 2.38% 3.37% 3.34% 3.25% 3.01% 3.18% 2.99%Multi-Specialists 3.08% 4.07% 4.16% 3.86% 3.57% 3.65% 3.66%No Specialty 3.51% 3.96% 3.89% 3.51% 3.28% 3.27% 3.64%Total 3.04% 3.82% 3.85% 3.67% 3.43% 3.43% 3.51%Source: FDIC.Note: Figures represent weighted average net interest income as a percent of average total assets for federally insured community banks reporting in each group during the period.
Table 5.9 Noninterest Expense to Average Assets by Lending Specialty Group, 1985-2011
Lending Specialty Group
Time PeriodFive-Year Intervals
2011All Years: 1985-20111986-1990 1991-1995 1996-2000 2001-2005 2006-2010
Mortgage Specialists 2.30% 2.55% 2.53% 2.60% 2.70% 2.93% 2.51%Agricultural Specialists 2.88% 2.95% 2.83% 2.80% 2.72% 2.63% 2.80%CRE Specialists 3.28% 3.65% 3.25% 2.98% 3.03% 3.06% 3.09%C&I Specialists 3.68% 3.92% 3.53% 3.37% 3.26% 2.72% 3.57%Consumer Specialists 3.73% 3.86% 3.67% 3.32% 3.46% 4.07% 3.68%No Specialty 3.04% 3.23% 3.03% 3.00% 3.04% 2.93% 3.07%Multi-Specialists 3.06% 3.43% 3.26% 3.12% 3.06% 3.18% 3.15%Total 2.88% 3.08% 2.96% 2.94% 2.97% 3.00% 2.96%Source: FDIC. Note: Figures represent weighted average noninterest expense as a percent of average total assets for federally insured community banks reporting in each group during the period.
Table 5.8 Noninterest Income to Average Assets by Lending Specialty Group, 1985-2011
Lending Specialty Group
Time PeriodFive-Year Intervals
2011All Years: 1985-20111986-1990 1991-1995 1996-2000 2001-2005 2006-2010
Consumer Specialists 1.07% 1.31% 1.29% 1.20% 1.10% 2.69% 1.20%C&I Specialists 0.95% 1.19% 1.09% 1.14% 0.94% 0.72% 1.04%CRE Specialists 0.79% 0.92% 0.90% 0.92% 0.72% 0.65% 0.80%Agricultural Specialists 0.61% 0.65% 0.71% 0.66% 0.65% 0.59% 0.65%Mortgage Specialists 0.63% 0.57% 0.62% 0.67% 0.66% 0.80% 0.64%No Specialty 0.81% 0.91% 0.92% 1.05% 1.16% 1.02% 0.95%Multi-Specialists 0.89% 0.88% 0.97% 1.02% 0.88% 0.88% 0.93%Total 0.77% 0.81% 0.84% 0.91% 0.82% 0.82% 0.83%Source: FDIC. Note: Figures represent weighted average noninterest income as a percent of average total assets for federally insured community banks reporting in each group during the period.
FDIC CommunIty BankIng StuDy ■ DeCemBer 2012 5–11
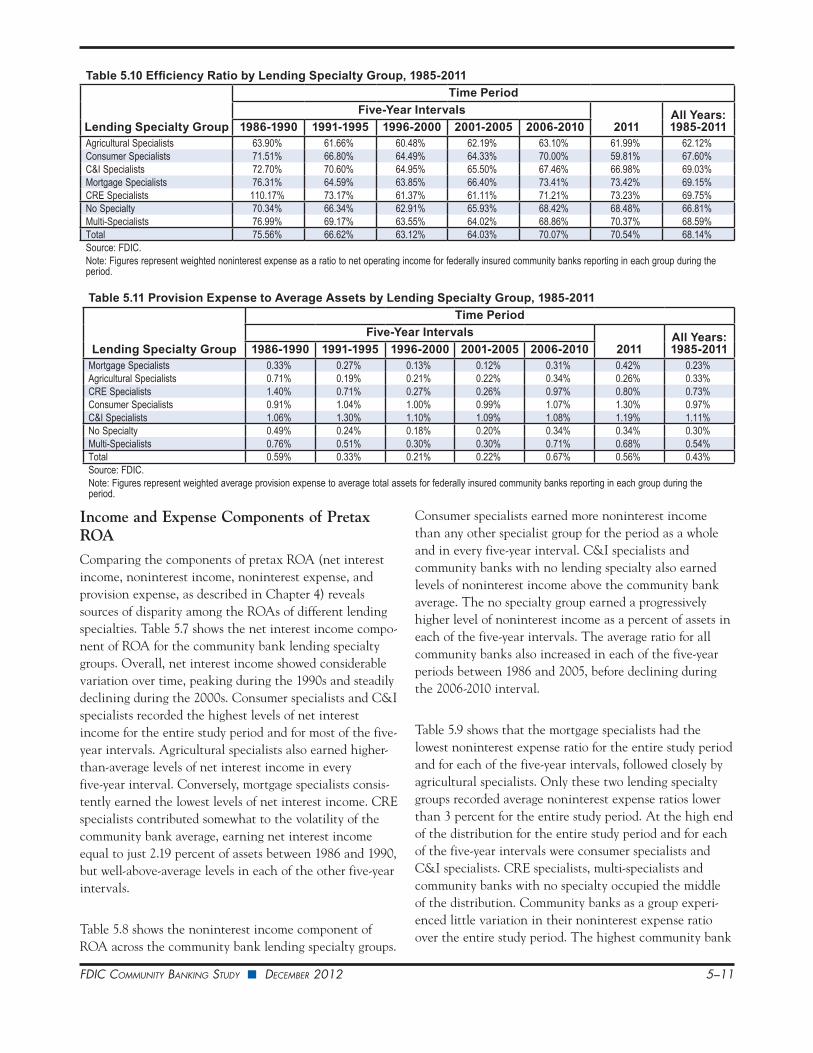
Income and Expense Components of Pretax ROA Comparing the components of pretax ROA (net interest income, noninterest income, noninterest expense, and provision expense, as described in Chapter 4) reveals sources of disparity among the ROAs of different lending specialties. Table 5.7 shows the net interest income compo-nent of ROA for the community bank lending specialty groups. Overall, net interest income showed considerable variation over time, peaking during the 1990s and steadily declining during the 2000s. Consumer specialists and C&I specialists recorded the highest levels of net interest income for the entire study period and for most of the five-year intervals. Agricultural specialists also earned higher-than-average levels of net interest income in every five-year interval. Conversely, mortgage specialists consis-tently earned the lowest levels of net interest income. CRE specialists contributed somewhat to the volatility of the community bank average, earning net interest income equal to just 2.19 percent of assets between 1986 and 1990, but well-above-average levels in each of the other five-year intervals.
Table 5.8 shows the noninterest income component of ROA across the community bank lending specialty groups.
Consumer specialists earned more noninterest income than any other specialist group for the period as a whole and in every five-year interval. C&I specialists and community banks with no lending specialty also earned levels of noninterest income above the community bank average. The no specialty group earned a progressively higher level of noninterest income as a percent of assets in each of the five-year intervals. The average ratio for all community banks also increased in each of the five-year periods between 1986 and 2005, before declining during the 2006-2010 interval.
Table 5.9 shows that the mortgage specialists had the lowest noninterest expense ratio for the entire study period and for each of the five-year intervals, followed closely by agricultural specialists. Only these two lending specialty groups recorded average noninterest expense ratios lower than 3 percent for the entire study period. At the high end of the distribution for the entire study period and for each of the five-year intervals were consumer specialists and C&I specialists. CRE specialists, multi-specialists and community banks with no specialty occupied the middle of the distribution. Community banks as a group experi-enced little variation in their noninterest expense ratio over the entire study period. The highest community bank
Table 5.11 Provision Expense to Average Assets by Lending Specialty Group, 1985-2011
Lending Specialty Group
Time PeriodFive-Year Intervals
2011All Years: 1985-20111986-1990 1991-1995 1996-2000 2001-2005 2006-2010
Mortgage Specialists 0.33% 0.27% 0.13% 0.12% 0.31% 0.42% 0.23%Agricultural Specialists 0.71% 0.19% 0.21% 0.22% 0.34% 0.26% 0.33%CRE Specialists 1.40% 0.71% 0.27% 0.26% 0.97% 0.80% 0.73%Consumer Specialists 0.91% 1.04% 1.00% 0.99% 1.07% 1.30% 0.97%C&I Specialists 1.06% 1.30% 1.10% 1.09% 1.08% 1.19% 1.11%No Specialty 0.49% 0.24% 0.18% 0.20% 0.34% 0.34% 0.30%Multi-Specialists 0.76% 0.51% 0.30% 0.30% 0.71% 0.68% 0.54%Total 0.59% 0.33% 0.21% 0.22% 0.67% 0.56% 0.43%Source: FDIC. Note: Figures represent weighted average provision expense to average total assets for federally insured community banks reporting in each group during the period.
Table 5.10 Efficiency Ratio by Lending Specialty Group, 1985-2011
Lending Specialty Group
Time PeriodFive-Year Intervals
2011All Years: 1985-20111986-1990 1991-1995 1996-2000 2001-2005 2006-2010
Agricultural Specialists 63.90% 61.66% 60.48% 62.19% 63.10% 61.99% 62.12%Consumer Specialists 71.51% 66.80% 64.49% 64.33% 70.00% 59.81% 67.60%C&I Specialists 72.70% 70.60% 64.95% 65.50% 67.46% 66.98% 69.03%Mortgage Specialists 76.31% 64.59% 63.85% 66.40% 73.41% 73.42% 69.15%CRE Specialists 110.17% 73.17% 61.37% 61.11% 71.21% 73.23% 69.75%No Specialty 70.34% 66.34% 62.91% 65.93% 68.42% 68.48% 66.81%Multi-Specialists 76.99% 69.17% 63.55% 64.02% 68.86% 70.37% 68.59%Total 75.56% 66.62% 63.12% 64.03% 70.07% 70.54% 68.14%Source: FDIC. Note: Figures represent weighted noninterest expense as a ratio to net operating income for federally insured community banks reporting in each group during the period.

FDIC CommunIty BankIng StuDy ■ DeCemBer 2012 5–12
ratio (3.08 percent) was recorded in the 1991-1995 interval, while the ratios measured for the final three other five-year intervals were all very close to the study period average of 2.96 percent.
The previous three earnings ratios discussed also represent the components of the efficiency ratio, or the ratio of noninterest expense to net operating revenue. Table 5.10 compares weighted average efficiency ratios for the community bank lending specialty groups for the entire study period. Agricultural specialists stand out in this comparison for their strong, lower-than-average efficiency ratios. For the entire study period, agricultural specialists reported an average efficiency ratio of just 62 percent, compared with the overall community bank average of 68 percent. As discussed above, agricultural specialists have consistently demonstrated lower-than-average noninterest expenses and higher-than-average net interest income, setting them apart from the other specialists in terms of both ROA and the efficiency ratio. The highest average efficiency ratio over the entire study period was reported
by CRE specialists at 70 percent. Moreover, the efficiency ratios of the CRE specialists were somewhat volatile over time, far exceeding the community bank average in the 1986-1990 and 1991-1995 intervals, and coming in under the average during the 1996-2000 and 2001-2005 intervals. As described above, much of the efficiency ratio volatility on the part of CRE specialists came from variation in net interest income.
The lending specialty groups also showed substantial differences in provision expense for loan and lease losses (see Table 5.11). For the entire study period, the average provision expenses reported by agricultural specialists, multi-specialists and the no specialty group all remained relatively close to the overall community bank average. Mortgage specialists reported the lowest provision expense of any group of community banks over the entire period, averaging just 0.23 percent of total assets. Conversely, the highest average provision expenses were reported by C&I specialists (1.11 percent), consumer specialists (0.97 percent) and CRE specialists (0.73 percent). While provi-
Table 5.12 Community Bank Failure Index by Lending Specialty Group, 1985-2011
Lending Specialty Group
Time PeriodFive-Year Intervals
2011All Years: 1985-20111986-1990 1991-1995 1996-2000 2001-2005 2006-2010
CRE Specialists 3.34 4.62 0.00 0.72 2.30 3.42 2.25C&I Specialists 1.87 1.58 3.02 6.27 0.53 0.51 2.19Consumer Specialists 0.96 1.03 0.00 0.00 0.00 0.00 1.20Mortgage Specialists 1.11 1.57 0.45 1.24 0.45 0.00 1.03Agricultural Specialists 0.76 0.07 1.31 0.00 0.16 0.08 0.53Multi-Specialists 2.02 2.34 2.54 2.24 1.27 0.42 1.71No Specialty 0.42 0.39 0.80 0.19 0.19 0.09 0.41Total 1.00 1.00 1.00 1.00 1.00 1.00 1.00Number of Failures 1,328 441 20 17 270 88 2,284Source: FDIC. Note: The failure index for each group is calculated as failures within that group as a ratio to all failures, divided by institutions in that group as a ratio to all institutions in that period. Index values above 1 indicate that institutions in the group failed more often than their prevalence in the population, while index values less than 1 indicate that they failed less often. The failure index is calculated for federally insured community banks.
Chart 5.3
$58.0 B, 11%
$198.8 B, 38%
$183.1 B, 35%
$20.3 B, 4%
$63.5 B, 12%
Source: FDIC.
Commercial Real Estate Loans Held by FDIC-InsuredCommunity Banks, Year-End 2011
Loans Secured by Nonfarm,
Nonresidential Properties:
$381.9 B, 73%
Secured byNonowner-Occupied Properties
Secured byOwner-Occupied Properties
Construction and Development (C&D) Loans:
$83.8 B, 16%
Residential
Nonresidential
Loans Secured by Multifamily Properties
Chart 5.4
0%
10%
20%
30%
40%
50%
1984 1986 1988 1990 1992 1994 1996 1998 2000 2002 2004 2006 2008 2010
Mortgage SpecialistsConsumer SpecialistsMulti-SpecialistsCRE SpecialistsC&I SpecialistsAg SpecialistsNo Specialty
Source: FDIC.
Percent of Community Banks by Lending Specialty Group, 1984-2011
FDIC CommunIty BankIng StuDy ■ DeCemBer 2012 5–13
sion expenses were relatively high for C&I specialists and consumer specialists in every five-year interval, provision expenses dipped sharply for CRE specialists in the 1996-2000 and 2001-2005 intervals, when generally strong real estate market conditions helped to keep CRE credit losses low. Mortgage specialists, agricultural specialists, multi-specialists and the no specialty group also experienced relatively low loan loss provision expenses during these intervals.
This discussion of expense ratios and efficiency naturally leads to the question of whether smaller institutions are at a competitive disadvantage as a result of economies of scale that enable larger institutions to operate at a lower average cost. Because this is such an important topic, additional FDIC analysis evaluated the importance of economies of scale among community bank lending specialty groups. The results of this analysis are summarized in the inset box “Do Economies of Scale Work Against Small Commu-nity Banks?” and show that while benefits of economies of scale do exist for community banks, they are exhausted when community banks reach a modest asset size.
Incidence of FailureAnother comparison of the performance of the lending specialty groups uses the failure index introduced in Chap-ter 2. The failure index for each group is calculated as the ratio of failures within that group to failures of all commu-nity banks, divided by the ratio of the number of banks in that group to the total number of community banks. A lending specialty group with a failure index of “1” indicates that those banks failed in numbers proportional to their share of all community banks during the period, while a lending specialty group with a failure index of “2” indicates
that those banks failed twice as often as their share of community banks.
Table 5.12 shows that the lending specialty groups with the lowest failure indexes for the entire period were banks with no specialty (0.41) and agricultural specialists (0.53). Conversely, the groups with the highest failure indexes were CRE specialists (2.25), C&I specialists (2.19), and multi-specialists (1.71). Institutions in these three groups failed far more frequently than the average community bank. Table 5.12 also shows that the most important time-frames for determining the relative frequency of failure were 1986-1990 (1,328 community bank failures), 1991-1995 (441 failures) and 2006-2010 (270 failures). CRE specialists had a high frequency of failure, while C&I specialists were well above the overall community bank average during the period 1986-1990, when more than one-half of all commu-nity bank failures took place. C&I specialists were also well above the overall community bank average during the 1996-2000 and 2001-2005 five-year intervals. However, these high failure indexes represent a total of eight failures of C&I specialists during these two five-year intervals when relatively few community bank failures occurred. Multi-specialists were more than twice as likely to fail as the average community bank in all of the five-year inter-vals from 1986 through 2005.
A Closer Look at Commercial Real Estate Lending by Community BanksChart 5.3 shows the types of loans that comprise total commercial real estate loans held by community banks at year-end 2011. The three main components are loans secured by nonfarm, nonresidential properties (73 percent of CRE loans), loans for the acquisition, construction and
Chart 5.5
0
5
10
15
20
25
30
35
40
45
1984 1986 1988 1990 1992 1994 1996 1998 2000 2002 2004 2006 2008 2010
Total CRE > 30% of Assets and C&D > 10% of Assets
Total CRE > 30% of Assets (Only)
C&D > 10% of Assets (Only)
Source: FDIC.
Percent of Community Banks that Exceed CRE Thresholds
Criteria Met:
The Most Notable Long-Term Development in Community Bank Lending Strategies Has Been the Shift Toward Commercial Real Estate Lending
Chart 5.6
0%
5%
10%
15%
20%
25%
30%
35%
1984 1986 1988 1990 1992 1994 1996 1998 2000 2002 2004 2006 2008 2010
Ag Specialists C&I Specialists
CRE Specialists Mortgage Specialists
No Specialty Consumer Specialists
Multi-Specialtists
Source: FDIC.
Nonfarm Nonres. Loans as a Percent of Assets, by Community Bank Lending Specialty Group
CRE Loans Secured by Nonfarm, Nonresidential Properties Have Risen Steadily Over Time at Community Banks in Every Specialty Group

FDIC CommunIty BankIng StuDy ■ DeCemBer 2012 5–14
development of real estate (C&D loans, 16 percent of CRE loans), and loans secured by multifamily properties (11 percent of CRE loans). C&D loans can be further subdi-vided into those secured by 1-to-4 family residential proj-ects and all other C&D projects, with all other C&D loans making up about three-quarters of the total in 2011.
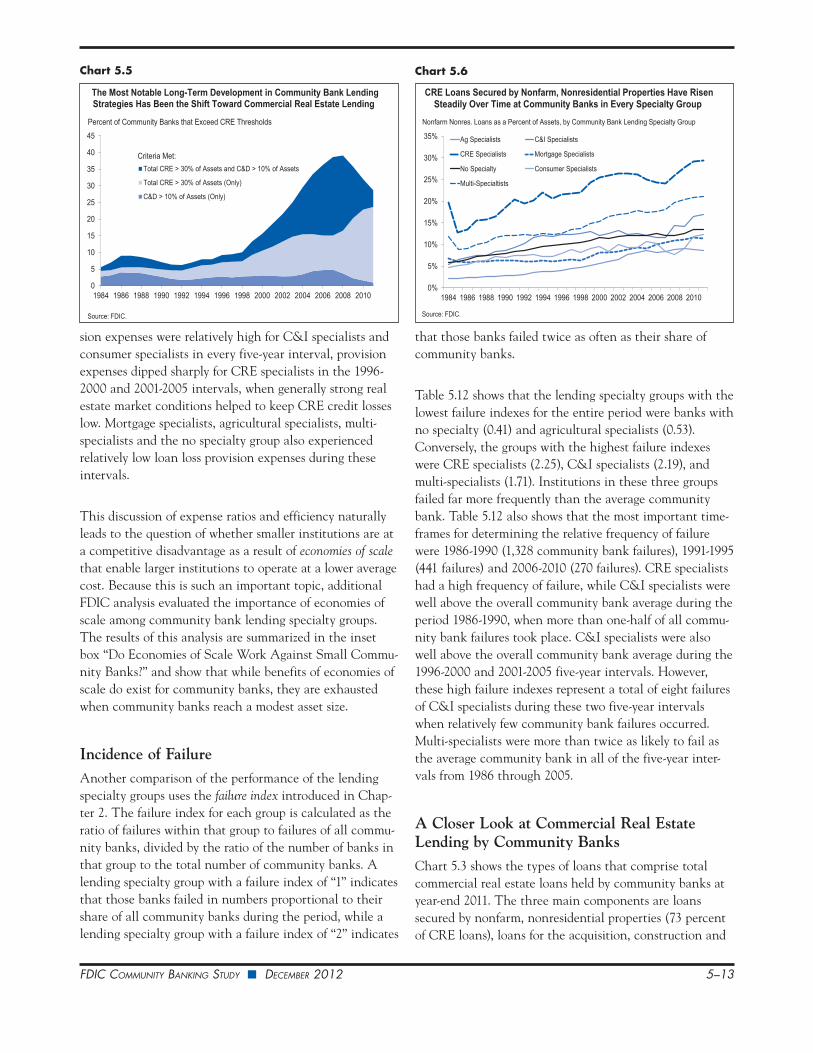
CRE Specialists Increase in ImportanceThe most noteworthy change in community bank lending strategies over the study period was the large increase in CRE lending specialists. Between 1991 and 2007, the number of CRE specialists increased fivefold, from 474 to 2,274. The increase was even larger as a percent of all community banks. Chart 5.4 shows that CRE specialists were less than 4 percent of all community banks in 1991, in the wake of the regional real estate downturns of the late 1980s and early 1990s, but grew to almost 30 percent of community banks at their peak in 2007. The figures are even higher if the analysis also considers multi-specialists that have CRE as one of their lending specialties.
Chart 5.5 tracks the rise of community banks that met the CRE specialty designation criteria in each year based on whether the designation was derived from C&D lending, CRE lending, or both.4 It shows that most of the large percentage increase between 1998 and 2008 occurred among community banks that held both C&D loans greater than 10 percent of assets and total CRE loans greater than 30 percent of assets. These institutions declined sharply after the onset of recession in 2008, because of large declines in C&D balances. After more
4 Chart 5.5 includes any community bank that met the CRE specialty definition, even community banks that were identified as multi-specialists.
than doubling between 2003 and 2007 to a peak level of $206 billion, total C&D loans held by community banks fell by almost 60 percent over the next four years.
Chart 5.6 shows that holdings of loans secured by nonfarm, nonresidential real estate grew steadily through-out most of the study period for community banks in every lending specialty group. While CRE specialists and multi-specialists held more nonfarm, nonresidential loans as a percent of assets than the other specialty groups in every year, all of the other lending specialty groups followed the same general pattern of rising nonfarm, nonresidential real estate loans over virtually the entire study period.
Previously, Chart 5.3 also showed that as of 2011, commu-nity banks held $183 billion of loans secured by owner-occupied commercial properties and another $199 billion of CRE loans secured by nonowner-occupied properties. This distinction is important because CRE loans secured by owner-occupied commercial real estate in many cases do not represent loans for which a rental income stream from the property is the primary source of repayment. In fact, community banks held more CRE loans secured by owner-occupied properties than C&I loans ($164 billion) in 2011.
While it would be very useful to know how much this owner-occupied CRE category contributed to the large increases in total CRE lending by community banks over the entire study period, this breakdown is available in the Call Report data only since 2007. As of 2011, these data show that owner-occupied loans made up 48 percent of all community bank CRE loans secured by nonfarm, nonresi-
Chart 5.7
0%
10%
20%
30%
40%
50%
60%
70%
80%
90%
1970 1974 1978 1982 1986 1990 1994 1998 2002 2006 2010
Credit Market Debt
Total Liabilities
Source: Federal Reserve, Flow of Funds.
Mortgage Debt Has Consistently Made Up Well More Than Half of the Credit Market Debt of Noncorporate Businesses for More Than 40 Years
Mortgage Debt as Percent of:
U.S. Noncorporate Businesses, Mortgage Debt as Percent of Credit Market Debt, Total Liabilities
48%
71%
Chart 5.8
0.0
0.5
1.0
1.5
2.0
2.5
3.0
3.5
4.0
2006 2007 2008 2009 2010 2011
C&I
Farmland
Multifamily
Owner-Occupied Nonfarm Nonres.
Other Nonfarm Nonres.
Performance Characteristics of Commercial Loans in Community Banks: Noncurrent Loan Rates, FDIC-Insured Institutions, 2006-2011
Noncurrent Loans as a Percent of Average Loans in Category
Source: FDIC. Note: Noncurrent loans are loans 90 days or more past due or on nonaccrual status.

FDIC CommunIty BankIng StuDy ■ DeCemBer 2012 5–15
dential properties, a percentage that has remained virtually unchanged since 2008.5
CRE loans secured by owner-occupied properties more closely resemble C&I loans for which the commercial real estate collateral has been attached in an abundance of caution. This trend in owner-occupied CRE appears to represent an increasingly preferred method for community banks to make secured commercial loans to business customers that are not necessarily engaged in real estate activities. Therefore, the role of owner-occupied CRE lend-ing must be taken into account when interpreting the overall increase in CRE lending by community banks, the rise in the number of CRE specialists, and the decrease in the number of C&I specialists, If one assumes that the loans secured by owner-occupied properties could be
5 Call Report reporting requirements for the breakout of nonfarm, nonresidential real estate loans in 2007 were subject to a de minimis test. Banks with less than $300 million in assets whose total commer-cial real estate loans were less than 150 percent of equity capital did not have to report the breakout.
regarded as C&I loans rather than CRE loans, the share of the C&I lending specialty group among community banks would likely not have experienced the decrease shown in Chart 5.4.
There is other evidence to support the notion that owner-occupied CRE lending may be a substitute for C&I lend-ing. The Flow of Funds data from the Federal Reserve show that real estate secured loans have long been an important source of credit to small businesses. In fact, mortgage credit has averaged 57 percent of the total liabilities of nonfarm, noncorporate businesses since 1970, and 73 percent of their credit market debt—percentages that have declined modestly from peak levels in the mid-1980s (see Chart 5.7).
Performance of CRE and Other Commercial Loan CategoriesCharts 5.8 and 5.9 trace noncurrent loans and net loan charge-offs at community banks, respectively, for five main
Chart 5.9
0.0
0.2
0.4
0.6
0.8
1.0
1.2
1.4
1.6
1.8
2.0
2006 2007 2008 2009 2010 2011
C&I
Farmland
Multifamily
Owner-Occupied Nonfarm Nonres.
Other Nonfarm Nonres.
Performance Characteristics of Commercial Loans in Community Banks:Net Charge-Off Rates, FDIC-Insured Institutions, 2006-2011
Net Loan Charge-Offs as a Percent of Average Loans in Category
Source: FDIC.
Chart 5.10
0%
5%
10%
15%
20%
25%
1984 1986 1988 1990 1992 1994 1996 1998 2000 2002 2004 2006 2008 2010
Mortgage Specialists Consumer Specialists
CRE Specialists C&I Specialists
Ag Specialists Multi-Specialtists
No Specialty
Source: FDIC.
C&D Loans as a Percent of Assets, by Community Bank Lending Specialty Group
Construction Lending by Community Banks Has Risen in Real Estate Boom Years, Led by CRE Specialists and Multi-Specialists
Table 5.13 Failure Index for Federally Insured Community Banks by Select Lending Specialty Groups and by C&D Loans to Assets, 1985-2011
Lending Specialty Group
Time PeriodFive-Year Intervals
2011
All Years: 1985-20111986-1990
1991-1995
1996-2000
2001-2005
2006-2010
CRE Specialists C&D < 10% 2.59 4.38 0.00 1.51 1.01 1.70 1.37C&D > 10% 3.60 4.88 0.00 0.00 2.95 8.49 2.90
Multi-Specialists C&D < 10% 1.92 1.79 3.23 3.03 0.62 0.20 1.33C&D > 10% 2.17 3.83 0.00 0.00 2.54 2.37 2.60
All Community Banks C&D < 10% 0.87 0.86 1.06 1.14 0.41 0.42 0.83C&D > 10% 2.78 4.35 0.00 0.00 2.85 5.82 2.80
Number of Failures 1,328 441 20 17 270 88 2,284Source: FDIC. Note: The failure index for each group is calculated as failures within that group as a ratio to all failures, divided by institutions in that group as a ratio to all institutions in that period. Index values above 1 indicate that institutions in the group failed more often than their prevalence in the population, while index values less than 1 indicate that they failed less often. The failure index is calculated for federally insured community banks.
FDIC CommunIty BankIng StuDy ■ DeCemBer 2012 5–16
classes of commercial loans since the beginning of 2006—CRE loans secured by owner-occupied nonfarm, nonresi-dential properties, CRE loans secured by other nonfarm, nonresidential properties, CRE loans secured by multifam-ily properties, farmland loans, and C&I loans. Each of the five loan categories, including CRE loans secured by nonfarm, nonresidential properties (both owner-occupied and otherwise), experienced increases in problem loans and loan charge-offs during the recent crisis, with improvement noted in 2011. Farmland loans experienced the best overall performance of any group, both in terms of the noncurrent loan ratio and the net loan charge-off ratio. The three CRE loan categories performed better than C&I loans in terms of net loan charge-off rates, but experienced higher noncurrent loan ratios, with CRE loans secured by owner-occupied nonfarm, nonresidential properties generally performing better than the other CRE loan categories. Although the net loan charge-off ratio was better at the peak of the recent crisis for the CRE loan categories compared with the ratio for C&I loans, data from the end of the last crisis (1991-1993) suggest that banks record charge-offs on C&I loans more quickly than charge-offs on nonfarm, nonresidential property loans, in part due to the length of the foreclosure process and ulti-mate sale of the foreclosed collateral. Taken together, these trends suggest that care must be taken to differentiate between CRE loans secured by income-producing proper-ties and CRE loans secured by owner-occupied properties when evaluating the risk characteristics of CRE loan port-folios. The performance characteristics of C&D loans were markedly different from CRE loans secured by owner-occu-pied and other CRE properties during the last several years and are therefore reviewed separately.
The Role of C&D Lending at Community BanksThe patterns of C&D lending shown in Chart 5.10 suggests that C&D lending has been a highly cyclical activity pursued mostly by CRE specialists and multi-specialists. While C&D loans never exceeded 5 percent of total assets for any of the other specialty groups in any year, they totaled more than 5 percent of assets for CRE specialists and multi-specialists in every year until 2011, when the percentage for multi-specialists fell to 4.8 percent. Moreover, during the real estate booms of the mid-1980s and the early- to mid-2000s, holdings of C&D loans increased sharply as a percent of assets at CRE specialists and, to a lesser degree, multi-specialists, while holding steady among every other lending specialty.
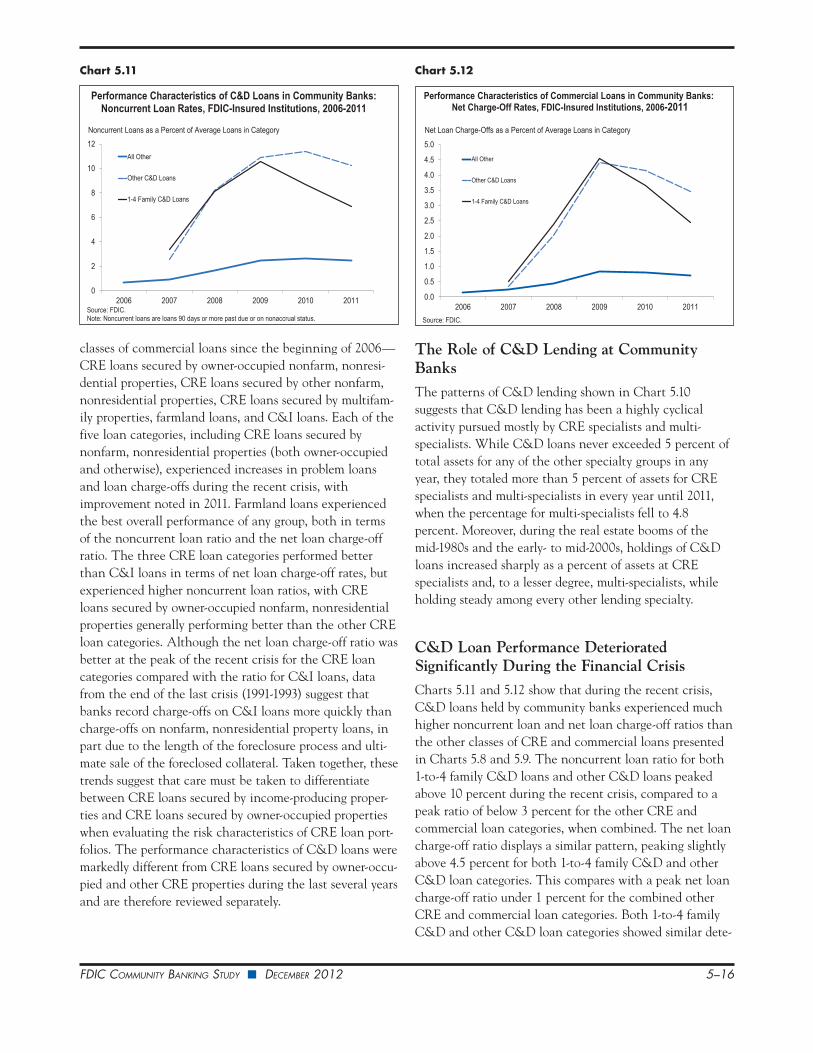
C&D Loan Performance Deteriorated Significantly During the Financial CrisisCharts 5.11 and 5.12 show that during the recent crisis, C&D loans held by community banks experienced much higher noncurrent loan and net loan charge-off ratios than the other classes of CRE and commercial loans presented in Charts 5.8 and 5.9. The noncurrent loan ratio for both 1-to-4 family C&D loans and other C&D loans peaked above 10 percent during the recent crisis, compared to a peak ratio of below 3 percent for the other CRE and commercial loan categories, when combined. The net loan charge-off ratio displays a similar pattern, peaking slightly above 4.5 percent for both 1-to-4 family C&D and other C&D loan categories. This compares with a peak net loan charge-off ratio under 1 percent for the combined other CRE and commercial loan categories. Both 1-to-4 family C&D and other C&D loan categories showed similar dete-
Chart 5.11
0
2
4
6
8
10
12
2006 2007 2008 2009 2010 2011
All Other
Other C&D Loans
1-4 Family C&D Loans
Performance Characteristics of C&D Loans in Community Banks: Noncurrent Loan Rates, FDIC-Insured Institutions, 2006-2011
Noncurrent Loans as a Percent of Average Loans in Category
Source: FDIC. Note: Noncurrent loans are loans 90 days or more past due or on nonaccrual status.
Chart 5.12
0.0
0.5
1.0
1.5
2.0
2.5
3.0
3.5
4.0
4.5
5.0
2006 2007 2008 2009 2010 2011
All Other
Other C&D Loans
1-4 Family C&D Loans
Performance Characteristics of Commercial Loans in Community Banks: Net Charge-Off Rates, FDIC-Insured Institutions, 2006-2011
Net Loan Charge-Offs as a Percent of Average Loans in Category
Source: FDIC.
FDIC CommunIty BankIng StuDy ■ DeCemBer 2012 5–17
rioration as the recent crisis intensified and both categories performed markedly worse than the other CRE and C&I loans.
Higher Levels of C&D Lending Are Associated With Higher Rates of Failure During the crisis years of the late 1980s and early 1990s, as well as the interval starting in 2006, the subset of commu-nity banks with C&D loans greater than 10 percent of assets stands out even among the main lending specialist groups in terms of adverse financial performance. Table 5.13 compares the failure index for CRE specialists, multi-specialists and all community banks according to whether the members of each group held C&D loans greater than 10 percent of total assets.6 For the entire study period, community banks with C&D loans greater than 10 percent of assets were 2.8 times more likely to fail than the average community bank, while those with C&D loans less than 10 percent of assets were less likely to fail than the average community bank. Even among the CRE and multi-specialist groups, those with C&D loans greater than 10 percent were far more likely to fail than other members of these groups. This was particularly the case in the 2006-2010 interval and in 2011, when banks with a 10 percent concentration in C&D loans were several times more likely to fail than other institutions.
6 According to the definitions of the lending specialty groups, any bank with C&D loans greater than 10 percent of assets cannot belong to the mortgage, consumer, C&I or agricultural specialties. In rare cases, it is possible for a bank with C&D loans greater than 10 percent of assets to belong to the no specialty group if that institution has total loans less than 33 percent of assets.
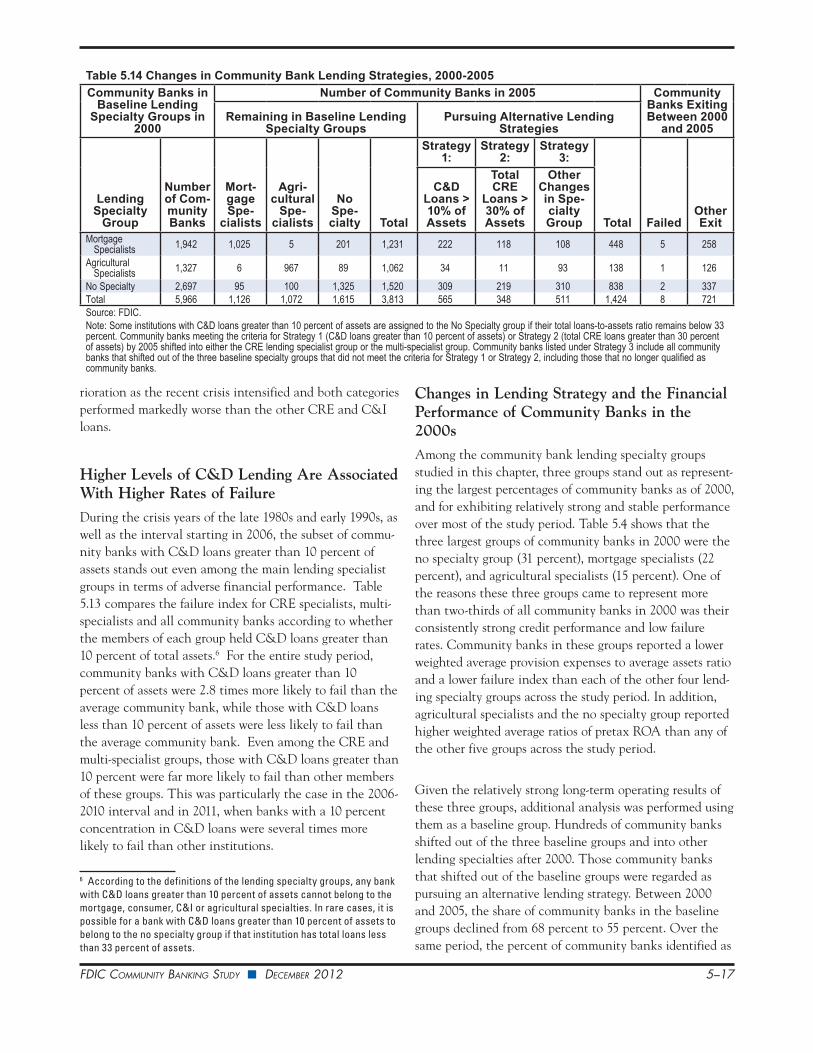
Changes in Lending Strategy and the Financial Performance of Community Banks in the 2000sAmong the community bank lending specialty groups studied in this chapter, three groups stand out as represent-ing the largest percentages of community banks as of 2000, and for exhibiting relatively strong and stable performance over most of the study period. Table 5.4 shows that the three largest groups of community banks in 2000 were the no specialty group (31 percent), mortgage specialists (22 percent), and agricultural specialists (15 percent). One of the reasons these three groups came to represent more than two-thirds of all community banks in 2000 was their consistently strong credit performance and low failure rates. Community banks in these groups reported a lower weighted average provision expenses to average assets ratio and a lower failure index than each of the other four lend-ing specialty groups across the study period. In addition, agricultural specialists and the no specialty group reported higher weighted average ratios of pretax ROA than any of the other five groups across the study period.
Given the relatively strong long-term operating results of these three groups, additional analysis was performed using them as a baseline group. Hundreds of community banks shifted out of the three baseline groups and into other lending specialties after 2000. Those community banks that shifted out of the baseline groups were regarded as pursuing an alternative lending strategy. Between 2000 and 2005, the share of community banks in the baseline groups declined from 68 percent to 55 percent. Over the same period, the percent of community banks identified as
Table 5.14 Changes in Community Bank Lending Strategies, 2000-2005Community Banks in
Baseline Lending Specialty Groups in
2000
Number of Community Banks in 2005 Community Banks Exiting Between 2000
and 2005Remaining in Baseline Lending
Specialty GroupsPursuing Alternative Lending
Strategies
Lending Specialty
Group
Number of Com-munity Banks
Mort-gage Spe-
cialists
Agri-cultural
Spe-cialists
No Spe-cialty Total
Strategy 1:
Strategy 2:
Strategy 3:
Total FailedOther Exit
C&D Loans > 10% of Assets
Total CRE
Loans > 30% of Assets
Other Changes in Spe-cialty Group
Mortgage Specialists 1,942 1,025 5 201 1,231 222 118 108 448 5 258
Agricultural Specialists 1,327 6 967 89 1,062 34 11 93 138 1 126
No Specialty 2,697 95 100 1,325 1,520 309 219 310 838 2 337Total 5,966 1,126 1,072 1,615 3,813 565 348 511 1,424 8 721Source: FDIC. Note: Some institutions with C&D loans greater than 10 percent of assets are assigned to the No Specialty group if their total loans-to-assets ratio remains below 33 percent. Community banks meeting the criteria for Strategy 1 (C&D loans greater than 10 percent of assets) or Strategy 2 (total CRE loans greater than 30 percent of assets) by 2005 shifted into either the CRE lending specialist group or the multi-specialist group. Community banks listed under Strategy 3 include all community banks that shifted out of the three baseline specialty groups that did not meet the criteria for Strategy 1 or Strategy 2, including those that no longer qualified as community banks.
FDIC CommunIty BankIng StuDy ■ DeCemBer 2012 5–18
CRE specialists increased from 11 percent to 26 percent. As depicted in Charts 5.4 and 5.5, the main vehicles for these shifts to alternative lending specialties were increases in holdings of C&D loans and other CRE loans.
Table 5.14 shows the number of community banks in each of the three baseline groups in 2000, as well as those that shifted to alternative lending specialties or exited the industry by 2006. In defining the shift in lending strategy, Table 5.14 first identifies community banks that left one of the three baseline groups because they accumulated C&D loans greater than 10 percent of total assets, followed by those that accumulated total CRE loans greater than 30 percent, and finally those that left one of the three base-line groups for any other reason, including if they were no longer designated as a community bank.7 These shifts in lending strategy are labeled Strategy 1 (C&D loans greater than 10 percent of assets), Strategy 2 (total CRE loans greater than 30 percent of assets), and Strategy 3 (all other specialty group changes). Table 5.14 shows that more than
7 Some institutions with C&D loans greater than 10 percent of assets may remain in the No Specialty group if their total loans-to-assets ratio remains below 33 percent. Community banks meeting the criteria for Strategy 1 (C&D loans greater than 10 percent of assets) or Strategy 2 (total CRE loans greater than 30 percent of assets) by 2005 have shifted into either the CRE lending specialist group or the multi-specialist group. Community banks listed under Strategy 3 include all community banks that shifted out of the three baseline specialty groups that did not meet the criteria for Strategy 1 or Strategy 2, including those that no longer qualified as community banks.
1,400 community banks shifted out of one of the baseline groups between 2000 and 2005, with the largest number of them doing so by accumulating C&D loans greater than 10 percent of assets (Strategy 1).
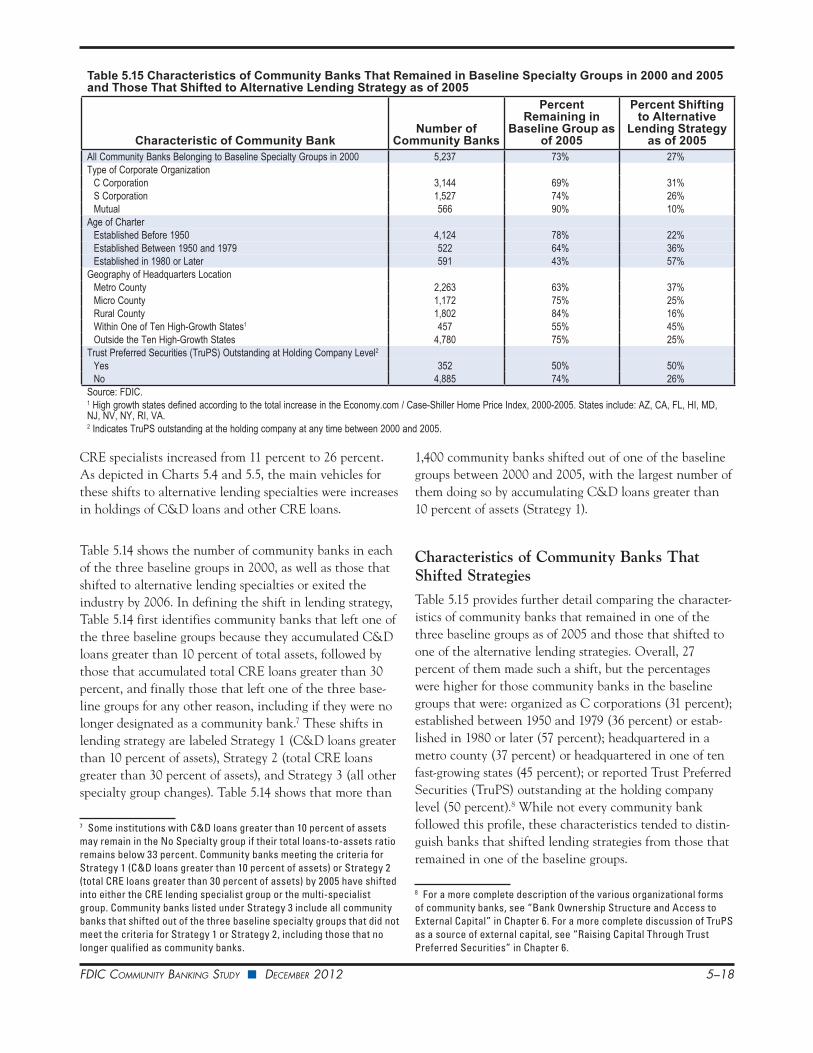
Characteristics of Community Banks That Shifted StrategiesTable 5.15 provides further detail comparing the character-istics of community banks that remained in one of the three baseline groups as of 2005 and those that shifted to one of the alternative lending strategies. Overall, 27 percent of them made such a shift, but the percentages were higher for those community banks in the baseline groups that were: organized as C corporations (31 percent); established between 1950 and 1979 (36 percent) or estab-lished in 1980 or later (57 percent); headquartered in a metro county (37 percent) or headquartered in one of ten fast-growing states (45 percent); or reported Trust Preferred Securities (TruPS) outstanding at the holding company level (50 percent).8 While not every community bank followed this profile, these characteristics tended to distin-guish banks that shifted lending strategies from those that remained in one of the baseline groups.
8 For a more complete description of the various organizational forms of community banks, see “Bank Ownership Structure and Access to External Capital” in Chapter 6. For a more complete discussion of TruPS as a source of external capital, see “Raising Capital Through Trust Preferred Securities” in Chapter 6.
Table 5.15 Characteristics of Community Banks That Remained in Baseline Specialty Groups in 2000 and 2005 and Those That Shifted to Alternative Lending Strategy as of 2005
Characteristic of Community BankNumber of
Community Banks
Percent Remaining in
Baseline Group as of 2005
Percent Shifting to Alternative
Lending Strategy as of 2005
All Community Banks Belonging to Baseline Specialty Groups in 2000 5,237 73% 27%Type of Corporate Organization
C Corporation 3,144 69% 31%S Corporation 1,527 74% 26%Mutual 566 90% 10%
Age of CharterEstablished Before 1950 4,124 78% 22%Established Between 1950 and 1979 522 64% 36%Established in 1980 or Later 591 43% 57%
Geography of Headquarters LocationMetro County 2,263 63% 37%Micro County 1,172 75% 25%Rural County 1,802 84% 16%Within One of Ten High-Growth States1 457 55% 45%Outside the Ten High-Growth States 4,780 75% 25%
Trust Preferred Securities (TruPS) Outstanding at Holding Company Level2Yes 352 50% 50%No 4,885 74% 26%
Source: FDIC. 1 High growth states defined according to the total increase in the Economy.com / Case-Shiller Home Price Index, 2000-2005. States include: AZ, CA, FL, HI, MD, NJ, NV, NY, RI, VA.2 Indicates TruPS outstanding at the holding company at any time between 2000 and 2005.
FDIC CommunIty BankIng StuDy ■ DeCemBer 2012 5–19
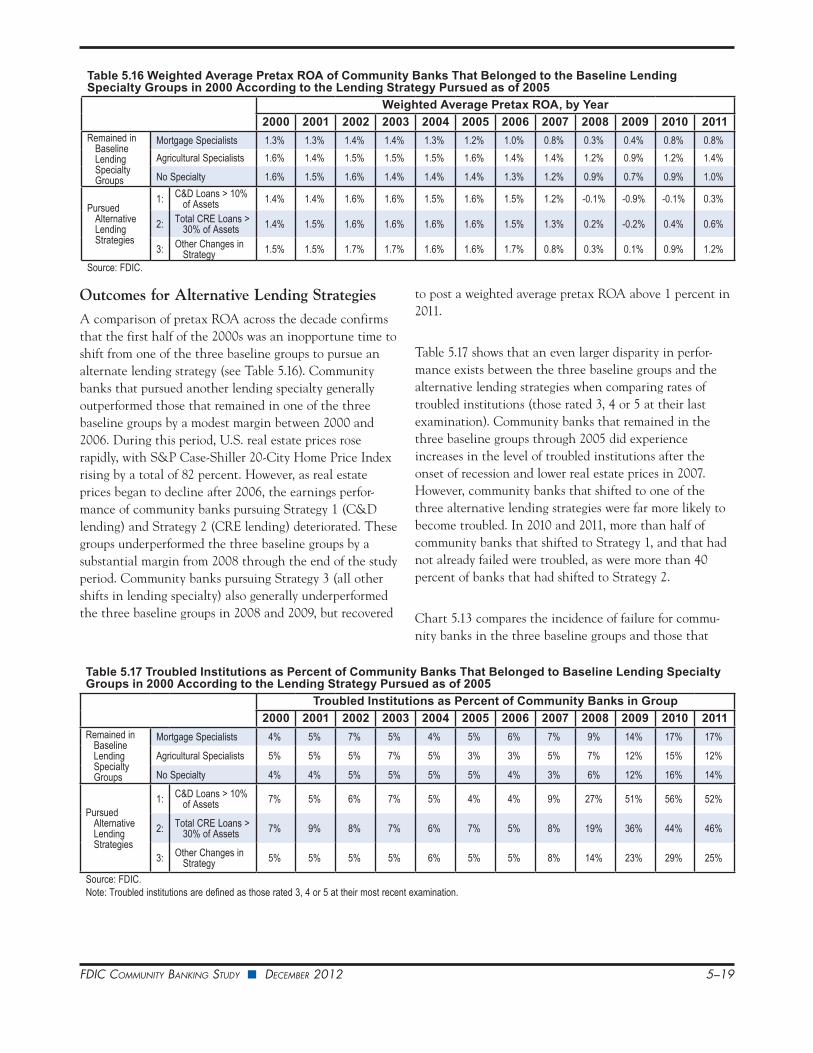
Outcomes for Alternative Lending StrategiesA comparison of pretax ROA across the decade confirms that the first half of the 2000s was an inopportune time to shift from one of the three baseline groups to pursue an alternate lending strategy (see Table 5.16). Community banks that pursued another lending specialty generally outperformed those that remained in one of the three baseline groups by a modest margin between 2000 and 2006. During this period, U.S. real estate prices rose rapidly, with S&P Case-Shiller 20-City Home Price Index rising by a total of 82 percent. However, as real estate prices began to decline after 2006, the earnings perfor-mance of community banks pursuing Strategy 1 (C&D lending) and Strategy 2 (CRE lending) deteriorated. These groups underperformed the three baseline groups by a substantial margin from 2008 through the end of the study period. Community banks pursuing Strategy 3 (all other shifts in lending specialty) also generally underperformed the three baseline groups in 2008 and 2009, but recovered
to post a weighted average pretax ROA above 1 percent in 2011.
Table 5.17 shows that an even larger disparity in perfor-mance exists between the three baseline groups and the alternative lending strategies when comparing rates of troubled institutions (those rated 3, 4 or 5 at their last examination). Community banks that remained in the three baseline groups through 2005 did experience increases in the level of troubled institutions after the onset of recession and lower real estate prices in 2007. However, community banks that shifted to one of the three alternative lending strategies were far more likely to become troubled. In 2010 and 2011, more than half of community banks that shifted to Strategy 1, and that had not already failed were troubled, as were more than 40 percent of banks that had shifted to Strategy 2.
Chart 5.13 compares the incidence of failure for commu-nity banks in the three baseline groups and those that
Table 5.16 Weighted Average Pretax ROA of Community Banks That Belonged to the Baseline Lending Specialty Groups in 2000 According to the Lending Strategy Pursued as of 2005
Weighted Average Pretax ROA, by Year2000 2001 2002 2003 2004 2005 2006 2007 2008 2009 2010 2011
Remained in Baseline Lending Specialty Groups
Mortgage Specialists 1.3% 1.3% 1.4% 1.4% 1.3% 1.2% 1.0% 0.8% 0.3% 0.4% 0.8% 0.8%Agricultural Specialists 1.6% 1.4% 1.5% 1.5% 1.5% 1.6% 1.4% 1.4% 1.2% 0.9% 1.2% 1.4%
No Specialty 1.6% 1.5% 1.6% 1.4% 1.4% 1.4% 1.3% 1.2% 0.9% 0.7% 0.9% 1.0%
Pursued Alternative Lending Strategies
1: C&D Loans > 10% of Assets 1.4% 1.4% 1.6% 1.6% 1.5% 1.6% 1.5% 1.2% -0.1% -0.9% -0.1% 0.3%
2: Total CRE Loans > 30% of Assets 1.4% 1.5% 1.6% 1.6% 1.6% 1.6% 1.5% 1.3% 0.2% -0.2% 0.4% 0.6%
3: Other Changes in Strategy 1.5% 1.5% 1.7% 1.7% 1.6% 1.6% 1.7% 0.8% 0.3% 0.1% 0.9% 1.2%
Source: FDIC.
Table 5.17 Troubled Institutions as Percent of Community Banks That Belonged to Baseline Lending Specialty Groups in 2000 According to the Lending Strategy Pursued as of 2005
Troubled Institutions as Percent of Community Banks in Group2000 2001 2002 2003 2004 2005 2006 2007 2008 2009 2010 2011
Remained in Baseline Lending Specialty Groups
Mortgage Specialists 4% 5% 7% 5% 4% 5% 6% 7% 9% 14% 17% 17%
Agricultural Specialists 5% 5% 5% 7% 5% 3% 3% 5% 7% 12% 15% 12%
No Specialty 4% 4% 5% 5% 5% 5% 4% 3% 6% 12% 16% 14%
Pursued Alternative Lending Strategies
1: C&D Loans > 10% of Assets 7% 5% 6% 7% 5% 4% 4% 9% 27% 51% 56% 52%
2: Total CRE Loans > 30% of Assets 7% 9% 8% 7% 6% 7% 5% 8% 19% 36% 44% 46%
3: Other Changes in Strategy 5% 5% 5% 5% 6% 5% 5% 8% 14% 23% 29% 25%
Source: FDIC. Note: Troubled institutions are defined as those rated 3, 4 or 5 at their most recent examination.

FDIC CommunIty BankIng StuDy ■ DeCemBer 2012 5–20
shifted to one of the three alternative lending strategies. The failure index indicates the prevalence of failed banks in each group relative to the prevalence of that group in the larger population of community banks. Between 2006 and 2011, failures among community banks that shifted to Strategy 1 (C&D lending) were almost five times higher than their share of the overall population, while failures among those that shifted to Strategy 2 (CRE lending) were almost double their share of the population. Meanwhile, community banks that remained in one of the three base-line groups failed at rates significantly below their share of all community banks in the population.
Did Newcomers Fare Worse in the Real Estate Downturn?Given the underperformance of community banks that shifted from one of the three baseline groups to one of the alternative lending strategies, it is natural to ask whether community banks that were already engaged in these lend-ing strategies in 2000 fared better because of their longer track record with that strategy. The data suggest that this is not the case. Table 5.18 calculates troubled institutions as a percent of community banks that shifted to Strategy 1 (C&D lending), Strategy 2 (CRE lending) and those that were already pursuing these strategies as of 2000. The results indicate that community banks that became
Chart 5.13
1.1
1.9
4.7
0.3
0.3
0.6
0 1 2 3 4 5
Strategy 3: Other
Strategy 2: CRE
Strategy 1: C&D
No Specialty
Agricultural Specialists
Mortgage Specialists
Source: FDIC.
Failure Index, 2006-2011
The failure index for each group is calculated as failures within that group as a ratio to all failures, divided by institutions in that group as a ratio to all institutions.
Failure Index 2006-2011Community Banks That Belonged to Baseline Specialty Groups in 2000
According to 2005 Lending Strategy Remained in Baseline
Groups
Pursued Alternative Strategies
Table 5.18 Troubled Institutions as Percent of Community Banks That Pursued C&D and CRE Lending Strategies
Strategy GroupTroubled Institutions as Percent of All Community Banks in Group
2000 2001 2002 2003 2004 2005 2006 2007 2008 2009 2010 2011Shifted from
Baseline Specialty Group in 2000 to Alternative Strategy as of 2005
1: C&D Loans > 10% of Assets 7% 5% 6% 7% 5% 4% 4% 9% 27% 51% 56% 52%
2:Total CRE
Loans > 30% of Assets
7% 9% 8% 7% 6% 7% 5% 8% 19% 36% 44% 46%
Already Engaged in Lending Strategy as of 2000
1: C&D Loans > 10% of Assets 7% 8% 8% 8% 6% 4% 5% 9% 39% 58% 64% 58%
2:Total CRE
Loans > 30% of Assets
10% 9% 9% 8% 7% 7% 6% 8% 26% 51% 57% 52%
Source: FDIC.
FDIC CommunIty BankIng StuDy ■ DeCemBer 2012 5–21
engaged earlier in the C&D or CRE lending strategies actually fared worse than those that later shifted to those strategies.
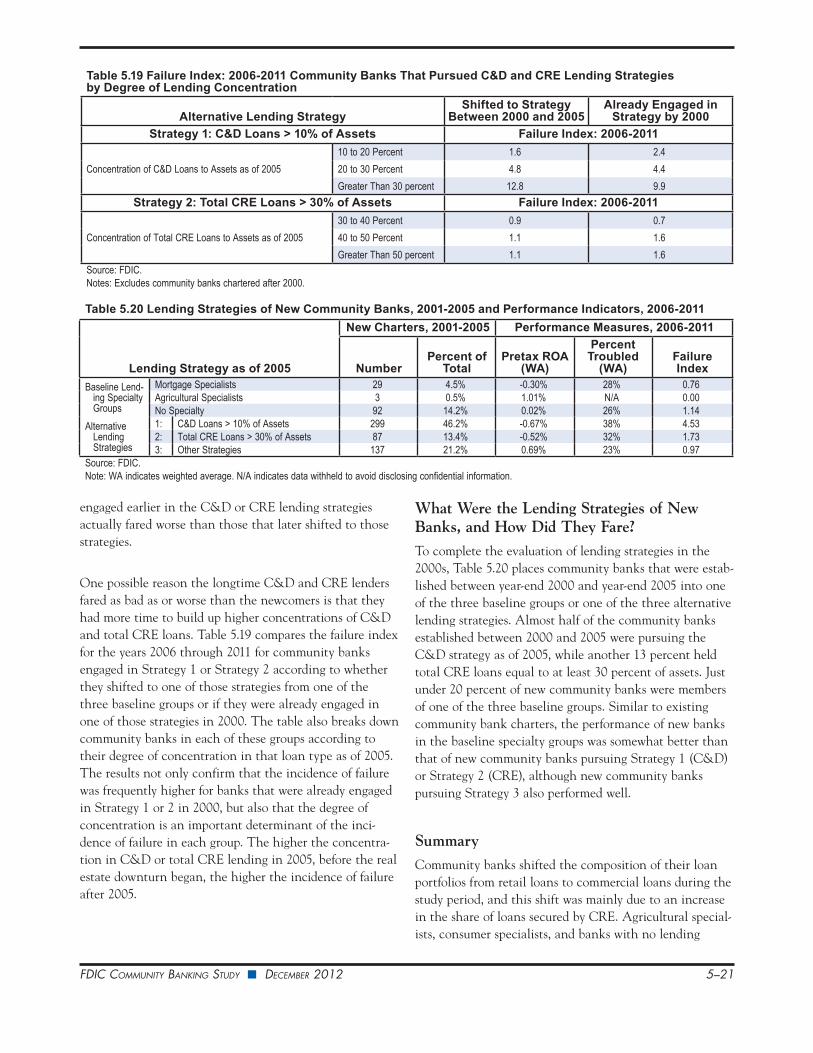
One possible reason the longtime C&D and CRE lenders fared as bad as or worse than the newcomers is that they had more time to build up higher concentrations of C&D and total CRE loans. Table 5.19 compares the failure index for the years 2006 through 2011 for community banks engaged in Strategy 1 or Strategy 2 according to whether they shifted to one of those strategies from one of the three baseline groups or if they were already engaged in one of those strategies in 2000. The table also breaks down community banks in each of these groups according to their degree of concentration in that loan type as of 2005. The results not only confirm that the incidence of failure was frequently higher for banks that were already engaged in Strategy 1 or 2 in 2000, but also that the degree of concentration is an important determinant of the inci-dence of failure in each group. The higher the concentra-tion in C&D or total CRE lending in 2005, before the real estate downturn began, the higher the incidence of failure after 2005.
What Were the Lending Strategies of New Banks, and How Did They Fare?To complete the evaluation of lending strategies in the 2000s, Table 5.20 places community banks that were estab-lished between year-end 2000 and year-end 2005 into one of the three baseline groups or one of the three alternative lending strategies. Almost half of the community banks established between 2000 and 2005 were pursuing the C&D strategy as of 2005, while another 13 percent held total CRE loans equal to at least 30 percent of assets. Just under 20 percent of new community banks were members of one of the three baseline groups. Similar to existing community bank charters, the performance of new banks in the baseline specialty groups was somewhat better than that of new community banks pursuing Strategy 1 (C&D) or Strategy 2 (CRE), although new community banks pursuing Strategy 3 also performed well.
SummaryCommunity banks shifted the composition of their loan portfolios from retail loans to commercial loans during the study period, and this shift was mainly due to an increase in the share of loans secured by CRE. Agricultural special-ists, consumer specialists, and banks with no lending
Table 5.19 Failure Index: 2006-2011 Community Banks That Pursued C&D and CRE Lending Strategies by Degree of Lending Concentration
Alternative Lending StrategyShifted to Strategy
Between 2000 and 2005Already Engaged in
Strategy by 2000Strategy 1: C&D Loans > 10% of Assets Failure Index: 2006-2011
Concentration of C&D Loans to Assets as of 200510 to 20 Percent 1.6 2.420 to 30 Percent 4.8 4.4Greater Than 30 percent 12.8 9.9
Strategy 2: Total CRE Loans > 30% of Assets Failure Index: 2006-2011
Concentration of Total CRE Loans to Assets as of 200530 to 40 Percent 0.9 0.740 to 50 Percent 1.1 1.6Greater Than 50 percent 1.1 1.6
Source: FDIC. Notes: Excludes community banks chartered after 2000.
Table 5.20 Lending Strategies of New Community Banks, 2001-2005 and Performance Indicators, 2006-2011
Lending Strategy as of 2005
New Charters, 2001-2005 Performance Measures, 2006-2011
NumberPercent of
TotalPretax ROA
(WA)
Percent Troubled
(WA)Failure Index
Baseline Lend-ing Specialty Groups
Mortgage Specialists 29 4.5% -0.30% 28% 0.76Agricultural Specialists 3 0.5% 1.01% N/A 0.00No Specialty 92 14.2% 0.02% 26% 1.14
Alternative Lending Strategies
1: C&D Loans > 10% of Assets 299 46.2% -0.67% 38% 4.532: Total CRE Loans > 30% of Assets 87 13.4% -0.52% 32% 1.733: Other Strategies 137 21.2% 0.69% 23% 0.97
Source: FDIC. Note: WA indicates weighted average. N/A indicates data withheld to avoid disclosing confidential information.
FDIC CommunIty BankIng StuDy ■ DeCemBer 2012 5–22
specialty generally performed best among lending specialty groups, while CRE specialists were the worst performers over the entire study period. CRE specialists performed slightly better than the average for all community banks in good economic times, but performed significantly worse during the periods that coincided with banking crises. The largest segment of CRE lending was secured by nonfarm, nonresidential properties. About half of these loans at community banks were secured by properties that depend upon rental income for repayment and the other half were secured by owner-occupied properties. The loans secured by owner-occupied properties have many similarities to C&I loans. During the recent crisis, both types of nonfarm, nonresidential CRE loans had lower loss rates than C&I loans. Another important segment of CRE lending was C&D lending, which has been one of the poorest performing loan types in periods of economic distress. While C&D lending rose mainly at banks that focused on that product, the prevalence of nonfarm, nonresidential loans rose across all types of community banks. The performance of CRE specialists was marked by volatile net interest income and high credit costs. Most notably, banks that had high levels of C&D loans performed significantly worse than other banks.
Lending strategy is an important factor in community bank success, and it proved to be especially so in the tumultuous second half of the 2000s decade. More than two-thirds of community banks entered the decade as
members of one of three baseline lending specialty groups that demonstrated consistently strong performance across the study period. Nonetheless, hundreds of community banks left these baseline groups in the first half of the decade as the U.S. real estate boom was nearing a peak and pursued alternative lending strategies built on C&D or CRE lending. These institutions slightly outperformed those that remained in the baseline lending groups while real estate prices were rising. After 2007, community banks that shifted to these alternative lending strategies under-performed those that remained in one of the three base-line groups by a substantial margin, as did community banks that began the decade already engaged in the C&D and CRE lending strategies. Finally, almost 60 percent of community banks chartered between 2000 and 2005 also were engaged in the C&D or CRE lending strategies by 2005, and these institutions also generally underperformed new community banks that pursued one of the three base-line lending strategies.
The implication of these results is that community banks that stuck to one of the three baseline lending strategies performed well, on average, across the study period as a whole and even during the crisis years of the late 2000s. Community banks that abandoned those lending special-ties for the small bit of extra yield that could be obtained from C&D and other CRE lending during the boom proved to be much more vulnerable to the effects of the crisis once it occurred.
Do Economies of Scale Work Against Small Community Banks?
Economies of scale exist when the average cost of producing a unit of output declines as the volume of output increases. In sectors such as manufacturing, where physical inputs and outputs can be easily identified and measured, it is relatively straightforward to estimate economies of scale. In service industries like banking, it becomes more diffi-cult to define economies of scale, in part because it is less clear what constitutes a unit of input or output. For exam-ple, a demand deposit could be considered either an input or an output. Due to such ambiguities, there are many possible ways to measure banking output and average costs. Nonetheless, there are reasons to suspect that economies of scale could indeed arise in some segments of the banking industry. Larger banks may be better able to diversify risks, especially when they can operate across many geographic regions that differ in their degree of correlation with the national economic business cycle. Larger banks may also be able to lower their funding costs by issuing debt directly to the capital markets. Moreover, there may be opportunities for larger banks to spread fixed costs, such as those associated with technology and information processing, across a large portfolio made up of multiple lines of business.
If economies of scale were to be found in banking, larger institutions would reap ongoing cost advantages, and the potential of achieving these advantages could serve as an impetus for consolidation among smaller institutions.

FDIC CommunIty BankIng StuDy ■ DeCemBer 2012 5–23
Besides economies of scale, there is evidence that many banks operate with less than optimal efficiency compared with similarly sized institutions. The existence of inefficient banks also serves as an impetus for consolidation as effi-cient banks may gain by acquiring less efficient institutions and altering management practices. Following a merger, it can be difficult to identify whether gains are achieved from improved operating efficiency or from enhanced scale benefits. The empirical evidence suggests that consolidation can lead to improved efficiency. Stiroh (1999) finds that banking industry consolidation in the early 1990s reallocated assets toward more profitable institutions while the least profitable institutions exited the industry. Boyd and Graham (1998) also find that small-bank mergers from this period were associated with significant improvements in cost and profit efficiency.
For the most part, the literature that uses bank data from the 1980s finds that banks achieve a minimum level of aver-age costs somewhere between $75 million and $300 million in total assets.1 Numerous studies from this period also find evidence of diseconomies of scale (increasing average costs) for the largest institutions. Stiroh (1999) finds that consolidation over the second half of the 1990s, a period characterized by mergers among larger institutions, was asso-ciated with reduced profitability as the largest bank mergers underperformed. Boyd and Graham (1998) also find that consolidation among the largest banks produced little evidence of cost or profit efficiency gains over this period. However, subsequent research has identified methodological limitations that may call into question the evidence for diseconomies of scale.
Newer approaches to this topic have shifted the modeling approach away from an assumption that banks simply mini-mize costs and toward a framework in which bank managers maximize profits. Additionally, the literature has increas-ingly focused on estimating the importance of scale economies at the largest bank holding companies, especially since the financial crisis. Many of these newer studies find evidence that the very largest institutions do benefit from econo-mies of scale (e.g., Hughes and Mester [2011], Hughes [2011], Wheelock and Wilson [2012]).
In light of the lack of recent studies relating to economies of scale in community banks, the FDIC conducted research specifically designed to determine if economies of scale exist among community banks.2 This analysis places particular emphasis on whether scale economies are important enough to prompt community banks to try to lower their average costs through consolidation. In the FDIC analysis, a bank’s average cost of producing output is measured as total bank costs divided by bank balance sheet assets. Total costs are defined as the sum of interest expenses, provisions for loan and lease losses, and noninterest expenses.
The FDIC analysis uses a non-parametric regression model to estimate the form and shape of the average cost curve for community banks. The cost curve is measured for two years, 2006 and 2009 (both measured in 2011 dollars) to capture years of both economic expansion and recession. Separate analysis was conducted for different lending special-ist groups because they may have unique costs and technologies that lead to distinctive patterns of scale economies.
1 See Berger, Hunter Timme, 1993.2 Paul Kupiec and Stefan Jacewitz, 2012.
Chart 5.14 Chart 5.15
3%
4%
5%
6%
7%
8%
9%
10%
$10,000,000 $100,000,000 $1,000,000,000 $10,000,000,000
Estimate 95% Confidence
Estimated Average Costs
Total AssetsSource: FDIC.
Estimated Average Total Costs as a Function of Asset SizeFDIC-Insured Community Banks (CRE Lending Specialists), 2006
3%
4%
5%
6%
7%
8%
9%
10%
$10,000,000 $100,000,000 $1,000,000,000 $10,000,000,000
Estimate 95% Confidence
Estimated Average Costs
Total AssetsSource: FDIC.
Estimated Average Total Costs as a Function of Asset SizeFDIC-Insured Community Banks (CRE Lending Specialists), 2009

FDIC CommunIty BankIng StuDy ■ DeCemBer 2012 5–24
Cost curves for two of the community bank lending specialist groups, CRE and agriculture, are shown in the follow-ing charts. In each of the charts, the center line represents an estimated average cost curve that varies with asset size, while the outer lines represent a 95 percent confidence interval constructed by the regression model. Among the lend-ing specialist groups, CRE specialists have the largest potential benefit from economies of scale, as their 2006 average costs decline by about 400 basis points between asset sizes of $10 million and $10 billion (see Chart 5.14). However, the estimated curve shows little difference in average costs between community banks with assets between $100 million and $1 billion, and very small benefits beyond $1 billion. In other words, the majority of efficiency gains are achieved by $100 million in total assets. The average cost curve estimated for CRE specialists for 2009 looks somewhat different from the 2006 cost curve because of changes in the composition of the group, not the least of which was the failure of 88 community bank CRE specialists during that interval (see Chart 5.15). Nevertheless, the 2009 cost curve still shows that the average costs level off above $500 million, indicating that most cost advantages are realized at that size.
For the agricultural lending specialty group, there is less evidence of economies of scale (see Charts 5.16 and 5.17). There is very little difference in estimated costs between the smallest and largest banks, and there are no statistically significant cost advantages beyond $100 million in total assets. Analysis of other community bank specialty lending groups shows that, while the cost-minimizing scale varies between $75 million and $300 million depending on the lender specialty, there is no evidence of economies of scale for any specialty group beyond $500 million. These results using 2006 and 2009 data are consistent with the findings of many banking studies that use data from the 1980s.
These results show that while some small community banks may be able to reduce their average costs through growth, there is no indication of any significant benefit beyond $500 million in asset size. Much of the benefit from economies of scale appears to dissipate once community banks reach $100 million in total assets. Therefore, while economies of scale may create incentives for banks to grow toward $100 million to $300 million in assets, depending on lending specialty, scale considerations are probably not the most important factor driving consolidation above that size threshold.
Chart 5.16 Chart 5.17
3%
4%
5%
6%
7%
8%
9%
10%
$10,000,000 $100,000,000 $1,000,000,000 $10,000,000,000
Estimate 95% Confidence
Estimated Average Costs
Total AssetsSource: FDIC.
Estimated Average Total Costs as a Function of Asset SizeFDIC-Insured Community Banks (Agricultural Lending Specialists), 2006
3%
4%
5%
6%
7%
8%
9%
10%
$10,000,000 $100,000,000 $1,000,000,000 $10,000,000,000
Estimate 95% Confidence
Estimated Average Costs
Total AssetsSource: FDIC.
Estimated Average Total Costs as a Function of Asset SizeFDIC-Insured Community Banks (Agricultural Lending Specialists), 2009