Embed Size (px)
Citation preview

145
CHAPTER 5 CHARACTERISTICS OF PARYLENE-C FILM
5.1 Overview
In this chapter, a systematical study of some parylene-C’s properties is performed
and discussed. To explore parylene-C’s mechanical, rheological, and viscoplastic
properties, the chapter starts with the introduction of parylene-C’s polymer properties:
polymerization, densification, and oxidation followed by a detailed study of
crystallization/densification and discussions about them. It shows that the crystallization
is one of the major effects causing parylene-C to behave differently after thermal
treatment.
The mechanical properties, rheological properties and viscoplastic properties of
the parylene-C film were studied using TA Instruments DMA Q800. Among many
mechanical properties, Young’s modulus, tensile strength and elongation are primarily
concerning in terms of implantation applications and therefore were considered in this
chapter. Mechanical properties can be known by many ways. For example, Young’s
modulus and residual stress can be obtained simultaneously by load-deflection approach
[103, 138]. In our study, mechanical properties were obtained by uniaxial tensile test due
to its simplicity and popularity.
Although it has been long since people started to use parylene-C in the
implantable devices, its rheological properties and viscoplastic properties have not been

146
thoroughly studied yet. By using the same testing setup as mentioned above, creep and
stress relaxation, and viscoplastic properties were measured as well. These properties
provide very important information for parylene-C-based medical devices in terms of
their fabrication and later implantation in human bodies. With the knowledge of these
properties, the life-time of the devices is predictable, the device fabrication time could be
reduced, and the residual stress generation by annealing the device at a proper
temperature is avoidable.
It also shows that the rheological testing results of parylene-C film are highly
temperature-dependent. To understand this, except the crystallization results, the glass
transition temperature was measured by both dynamic mechanical analysis (DMA)
approach and a ramping-temperature-dependent modulus experiment. Both obtained
results were compared and discussed to explain the rheological testing results.
5.2 Introduction to Parylene-C Polymerization
The current most common way to prepare Parylene-C film is done by chemical
vapor deposition invented by W. F. Gorham in 1966 [172]. Gorham’s approach is also
commonly used to prepare other parylene (poly-para-xylylene) family members, such as
parylene-N (poly-para-xylylene), parylene-D (poly-dichloro-para-xylylene), parylene-C
(poly-chloro-para-xylylene), or parylene-HT (or parylene-F, poly-tetrafluoro-para-
xylylene) to name a few. During the parylene-C preparation, the parylene-C dimer is
sublimated at elevated temperature (180°C in our deposition process), and pyrolysed at
690°C. The parylene-C film can conformally deposit onto the substrate and also the
temperature of the chamber wall could range from -196°C to room temperature [173,

147
174]. Because the paylene-C polymerizes right from the gaseous type, the process is also
called vapor deposition polymerization (VDP) [175].
It is parylene-N polymerization which was first focused on and studied. Errede
published the mechanism of polymerization of prylene-N in 1960 [176]. Rather than
using Gorham’s vapor deposition approach to get the parylene-N film, Errede prepared p-
xylylene monomer liquid solution at -78°C. Polymerization happens when the solution is
disturbed by momentary contact with a warm surface. Beach proposed a model for the
vapor deposition parylene-N for the first time in 1978 [177]. Gaynor, Rogojevic and
Fortin also developed different kinds of models to describe the vapor deposition of
parylene-N thin film after Beach [178–180].
Some of previous researchers’ important findings are summarized in this section.
The molecular weight of parylene-N is found to be 200,000 to 400,000 g/mol, which
corresponds to 2000–4000 units per chain length [178]. In addition, the deposition rate of
parylene-C is found to decrease as the deposition temperature rises, which is opposite to
the regular chemical vapor deposition reaction that shows higher deposition rate as the
deposition temperature rises. It is suggested that the higher deposition rates of the
parylene family at lower temperature are caused by increased monomer condensation rate
on the substrate surfaces [181].
5.3 Densification
Densification means the polymer chain becoming more compact than its original
chain structure. Theoretically speaking, densification can be caused by thermal treatment
which gives polymer chain energy to move, or by stretch force which causes the polymer
chain to align closer. In densification, the polymer chains do not need to be well

148
organized to form a lamella, but the polymer chains are getting closer to fill in the voids
of the material, which usually results in the reduction of the volume. Therefore, the
densification can be observed by measuring the materials’ dimension. There hasn’t been
too much research work done to study the densification of the parylene-C film to our best
knowledge. The first related study could be found to be done by Wu in 1995 [182]. Wu
and the coworkers measured in situ the thickness of parylene-N and parylene-F at
elevated temperature up to the sample decomposing. Their results showed no thickness
reduction or increment before the samples decomposed, regardless of whether the
annealing was done in air, nitrogen or vacuum. In 2005, Huang et al. published a paper
studying the glass transition temperature of ultra-thin parylene-C film (21 nm) deposited
on silicon substrate by in situ measuring the film’s thickness change [183]. They used an
ellipsometer to measure the thickness of the sample from temperature at 0°C to 120°C.
The results showed that the thickness increases monotonically, with a thermal expansion
coefficient turning point occurring at the glass transition temperature or so. In spite of
their successful findings of the glass transition temperature, the thermal expansion
coefficients found from their results showed a value of 1190 ppm and 2143 ppm below
and above the glass transition temperature, respectively. Because of the contradiction
between Wu and Huang, it is of interest to measure the parylene-C film thickness change
in the usage thickness range.
In this section, the densification of 20-µm-thick parylene-C film is studied at
100°C. In addition, the parylene-C film’s length change during thermal annealing at
ramping rate of 3.33°C/min is measured as well.

149
5.3.1 Thickness-change measurement
To measure the thickness change of 20-µm-thick parylene-C film, a layer of
parylene-C film of 20 µm thickness was first deposited on top of a clean glass plate. A
parylene-C step was then created by stripping part of the parylene-C film for later
thickness measurement. Parylene-C film was put in the convection oven which was
preheated at 100°C for a targeted duration. When time was up, the parylene-C was taken
out and cooled down to room temperature. A KLA-Tencor P-15 profiler was used to
measure the parylene-C thickness. The measurement was performed before the thermal
annealing and every time the parylene-C film was cooled down. 5 data points at different
positions were obtained in each measurement corresponding to each annealing time.
Figure 5-1: Measured thickness of 20 µm parylene-C film annealed at 100°C in the
convection oven
0 10 20 30 40 50 60 70 80 90 100 110 12020.0
20.1
20.2
20.3
20.4
20.5
20.6
Aver
age
Thic
knes
s (µ
m)
Time (min)
Average ThicknessParylene-C film was targeted at 20 µm.Annealing at 100oC in convection oven.n=5 at each measuring time.
20.0
20.1
20.2
20.3
20.4
20.5
20.6
Aver
age
Thic
knes
s (µ
m)

150
The obtained thickness data versus annealing time is shown in Figure 5-1.
Although there is some variation (error bar) at each measurement, the average thickness
falls in a constant range without too much change during the thermal annealing. The
changing of the average thickness versus time cannot show any correlation between the
thickness and annealing time as the thickness always lies in the error range. The results
demonstrate that the parylene-C film thickness change is not detectable within the 2
hours of annealing at 100°C in convection oven with our current measuring capabilities.
Our measuring data agrees well with Wu’s results. It might be due to the thickness effect
that Huang’s parylene-C film behaves differently.
5.3.2 In situ length-change measurement during thermal annealing
5.3.2.1 Length change under long-time thermal annealing process at 100°C
An experiment monitoring the length change of the parylene-C film during the
thermal annealing was also conducted. With the same sample thickness prepared as
above (as-deposited parylene-C film), the free standing parylene-C film was cut into 5.3
mm (W) by 10mm (L) in dimension and mounted onto the clamps of the DMAQ800 with
a tiny little force (0.0027N). The chamber temperature was ramped up to 100°C in the
machine’s fastest way and the length of the sample was monitored at the same time.
After the chamber was thermally stabilized, the sample was annealed in this environment
for eight hours to observe its length change. Once the annealing is done, the chamber
was then fast cooled down to room temperature by blowing cool nitrogen gas into the
chamber. The whole system was kept in room temperature for another two hours to
observe the parylene-C film length change.

151
The obtained length change of parylene-C film annealed at 100°C is shown in
Figure 5-2. All system response is corrected and thus the data shown represents the true
parylene-C film response. Figure 5-2 (a) shows the length change of the whole annealing
and cooling period. Figure 5-2 (b) shows the closer view of the length response of the
parylene-C film between 0–2.5 minutes. Figure 5-2 shows that the as-deposited
parylene-C film length actually shrinks when the environmental temperature increases
higher than ~ 40°C. The rate of the length change reduces after the temperature reaches
the target temperature, and slows down. In Figure 5-2 (b), it is observed that the sample
length actually elongates before 0.25 minutes, which corresponds to 38.76°C in the raw
data, and start to shrink afterward. It infers that the parylene-C starts to have some
structural change at 38.76°C and thus the length shrinks. The hypothesis of this
phenomenon is that the parylene-C is likely to start to crystallize at 38.76°C. As from the
conventional wisdom of solid state thermodynamic transitions regarding the glass
transition, no crystallization should be able to take place below the glass transition
temperature [184, 185], plus the parylene polymer chain orientation is proved to lie in the
plane of the film [186], Figure 5-2 could be treated as an evidence that the parylene-C
film crystallization starts from temperature at 38.76°C, i.e., the onset of glass transition
range. The concept and experiments regarding the glass transition temperature will be
discussed more in detail in Section 5.6. It is postulated that the parylene polymer chain
folds into several lamellae, constituting the spherulite of the parylene-C. Therefore, the
parylene-C length reduces during this crystallization process. The slowly length
shortening after thermally stabilized at 100°C is likely attributed to the slow isothermal
crystallization behavior, which will be studied by XRD approach in Section 5.5.

152
Figure 5-2: (a) Obtained length change of the parylene-C film annealed at 100°C in air
for 8 hours, and (b) a closer view of the length change during the first 2.5 minutes
In order to further prove that the as-deposited parylene-C is crystallized during the
annealing process, the parylene-C sample previously annealed at 100°C for eight hours
was tested again in the same annealing condition for another two hours, and the testing
results is shown in Figure 5-3. It can be clearly seen that, rather than length shrinkage,
the parylene-C film expands during the early temperature ramping up period, which is
totally opposite to the as-deposited parylene-C’s results. Although the parylene-C is very
likely still crystallizing during this period, the thermal expansion effect of the parylene
spherulite dominates the length change. Thus the overall effect shows that the parylene-
C film is expanding. After the chamber is thermally stabilized again, the parylene-C film
has no (or very little) expansion and the crystallization mechanism dominates the length
change again. The thermal coefficients of expansion (TCE) of as-deposited and annealed
parylene-C film are also estimated from Figure 5-2 (a) and Figure 5-3. Three TCE
0 100 200 300 400 500 600
-1.2
-1.0
-0.8
-0.6
-0.4
-0.2
0.0
0.2
As-deposited parylene-CSt
rain
(%)
Time (min)
-20-100102030405060708090100110120
Temperature
Tem
pera
ture
ο C0.0 0.5 1.0 1.5 2.0 2.5
-1.2
-1.0
-0.8
-0.6
-0.4
-0.2
0.0
0.2
Stra
in (%
)
Time (min)
-20-100102030405060708090100110120
Tem
pera
ture
o C
(a) (b)

153
obtained from these two figures are shown in the first three columns of Table 5-1: TCE of
the 8-hours-annealed sample cooled down, TCE of the annealed sample heated up, and
TCE of the 10-hours-annealed sample cooled down.
Figure 5-3: Length change of the parylene-C film which was annealed at 100°C in air for
8 hours in the previous test. The sample was annealed again at 100°C for another 2
hours.
Table 5-1: Table of thermal coefficients of expansions obtained in different states of the
parylene-C film. The literature values are also listed for comparison.
Annealed 8 hours at 100°C, cooled down to
room temperature
(Figure 5-2 (a))
Followed from the previous
sample and heated up to
100°C (Figure 5-3)
Annealed another 2 hours and
cooled down to room
temperature (Figure 5-3)
As-deposited parylene-C heated up to
transition (Figure 5-4)
Literature value by Beach [101]
Experimental value
obtained by Dabral [110]
TCE (ppm) 60 56.3 58.8 35.5 35 50
0 25 50 75 100 125 150 175 200-0.05
0.00
0.05
0.10
0.15
0.20
0.25
0.30
0.35
0.40
0.45
0.50
Stra
in (%
)
Time (min)
Parylene-C annealed @ 100oC for 8 hours in air
-100
-80
-60
-40
-20
0
20
40
60
80
100
Temperature
Tem
pera
ture
o C

154
5.3.2.2 One cycle thermal annealing treatment
Although the TCE below parylene-C’s glass transition temperature can be
obtained from the experiments described in Section 5.3.2.1, the temperature ramping,
however, is extremely fast in that case. Therefore another test under a slower
temperature ramping rate was performed to verify the expansion behavior below and
above the glass transition temperature and the results are shown in Figure 5-4. It could
be seen that in a slower temperature ramping profile, the sample expands until 53.75°C
owing to the thermal expansion and starts to shrink afterward. The temperature, 53.75°C,
actually agrees perfectly well with our glass transition found in Section 5.6 and therefore
it is hypothesized that the parylene-C starts to crystallize at 53.75°C. The expansion
phenomenon above 120°C is likely due to the dominating oxidation effect. The oxygen
atoms are involved into the parylene-C structure and therefore expand the parylene-C
sample again until it gets decomposed at 240°C.
The obtained TCE of each region is shown in Table 5-1. From Table 5-1, the
TCE of annealed parylene-C usually lies in the range of 56.3–60 ppm. The TCE obtained
before parylene-C’s glass transition is 35.5 ppm, which agrees well with Beach’s
literature value measured at 25°C [101]. The difference of the TCE between annealed
and as-deposited parylene-C can be explained on the basis of changes in the parylene-C’s
properties due to annealing which gives parylene-C higher crystallinity [110]. More
discussion and study of crystallinity will be in Section 5.5. In addition, Dabral obtained
TCE as 50 ppm from his annealing samples below 150°C. The difference between his
result and our TCE result is about 11.2–16.7%. Apart from the measuring resolution
errors, it is very likely that Dabral’s parylene-C film has been annealed up to 250°C,

155
which could introduce another polymer structure transition from α form to β form. Thus
the Dabral’s TCE could represent the property of β-form parylene-C film while ours
could represent α form as our sample annealed only up to 100°C.
Figure 5-4: Length change of parylene-C film annealed under the temperature ramping
rate at 3.33°C/min and its hypothesized phenomenon interpretation by dominant effect
5.3.2.3 Cyclic thermal annealing treatment up to 120°C
The experiment done in Section 5.3.2.2 shows only one cycle of parylene-C
thermal annealing. The TCEs before and after the thermal annealing are found. Figure
5-4 also demonstrates that the parylene-C sample decomposed at ~ 240°C in the normal
air environment. In this section, another experiment was designed to study the behavior
of the parylene-C sample annealed under cyclic thermal conditions. As-deposited
0 10 20 30 40 50 60 70 80 90 100 110 120 130 140-2.00
-1.75
-1.50
-1.25
-1.00
-0.75
-0.50
-0.25
0.00
0.25
0.50
0.75
1.00 As-deposited parylene-C
Stra
in (%
)
Time (min)
020406080100120140160180200220240260 Temperature
Tem
pera
ture
o C
Thermal expansion
53.75°C
Crystallization~ 120°C
Oxidation~ 245°C
Decomposed
Oxided parylene-C shrinkage
156
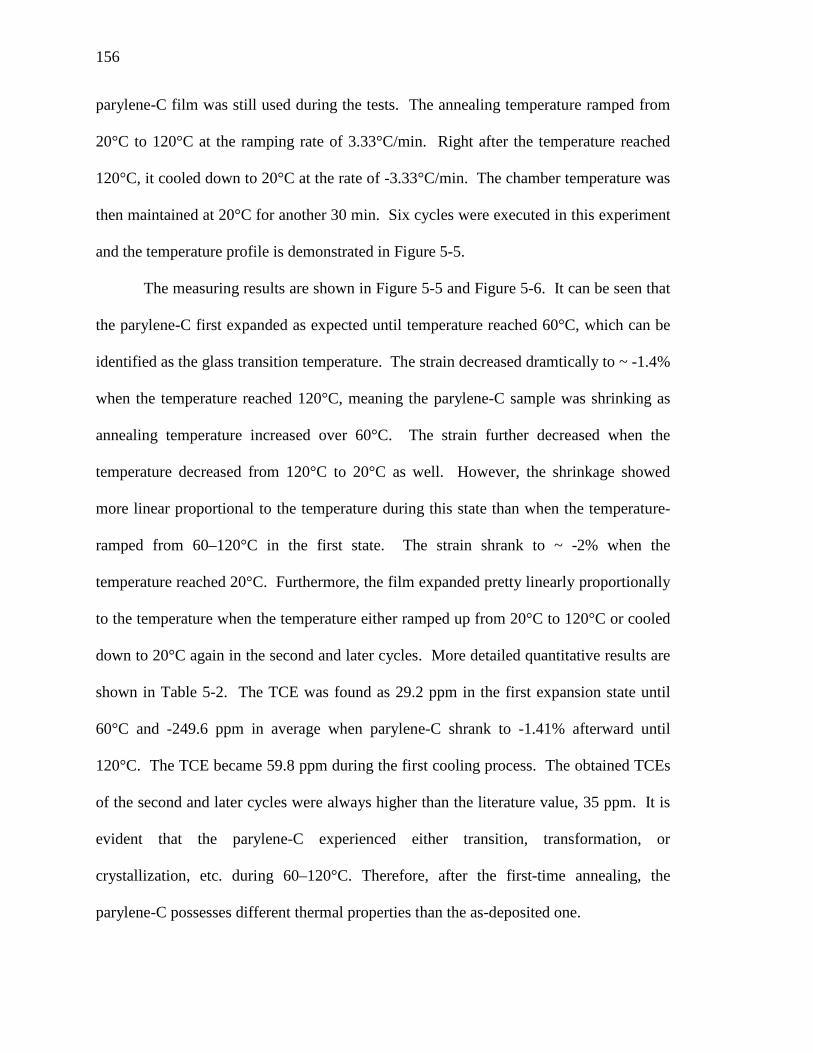
parylene-C film was still used during the tests. The annealing temperature ramped from
20°C to 120°C at the ramping rate of 3.33°C/min. Right after the temperature reached
120°C, it cooled down to 20°C at the rate of -3.33°C/min. The chamber temperature was
then maintained at 20°C for another 30 min. Six cycles were executed in this experiment
and the temperature profile is demonstrated in Figure 5-5.
The measuring results are shown in Figure 5-5 and Figure 5-6. It can be seen that
the parylene-C first expanded as expected until temperature reached 60°C, which can be
identified as the glass transition temperature. The strain decreased dramtically to ~ -1.4%
when the temperature reached 120°C, meaning the parylene-C sample was shrinking as
annealing temperature increased over 60°C. The strain further decreased when the
temperature decreased from 120°C to 20°C as well. However, the shrinkage showed
more linear proportional to the temperature during this state than when the temperature-
ramped from 60–120°C in the first state. The strain shrank to ~ -2% when the
temperature reached 20°C. Furthermore, the film expanded pretty linearly proportionally
to the temperature when the temperature either ramped up from 20°C to 120°C or cooled
down to 20°C again in the second and later cycles. More detailed quantitative results are
shown in Table 5-2. The TCE was found as 29.2 ppm in the first expansion state until
60°C and -249.6 ppm in average when parylene-C shrank to -1.41% afterward until
120°C. The TCE became 59.8 ppm during the first cooling process. The obtained TCEs
of the second and later cycles were always higher than the literature value, 35 ppm. It is
evident that the parylene-C experienced either transition, transformation, or
crystallization, etc. during 60–120°C. Therefore, after the first-time annealing, the
parylene-C possesses different thermal properties than the as-deposited one.

157
Figure 5-5: Six cycles of thermal annealing of parylene-C film up to 120°C: The length
of the film never goes back to its original length after the first-time thermal annealing.
Figure 5-6: The parylene-C film behaves differently after the first-time thermal
annealing.
0 50 100 150 200 250 300 350 400 450 500-2.50
-2.25
-2.00
-1.75
-1.50
-1.25
-1.00
-0.75
-0.50
-0.25
0.00
0.25
0.50
Stra
in (%
)
Time (min)
Strain (%)
0
10
20
30
40
50
60
70
80
90
100
110
120 Temperature (oC)
Tem
pera
ture
(o C)
20 30 40 50 60 70 80 90 100 110 120-2.50
-2.25
-2.00
-1.75
-1.50
-1.25
-1.00
-0.75
-0.50
-0.25
0.00
0.25
Stra
in (%
)
Temperature (oC)

158
Table 5-2: Derived TCEs from six cycles shown in Figure 5-5 and Figure 5-6
nth cycle 1 2 3 4 5 6 Temperature range (°C)
From 22.0 57.9 118.6 20.0 119.7 20 119.7 20 119.3 20 119.3 20 119.4 To 57.9 118.6 20.0 119.7 20 119.7 20 119.3 20 119.3 20 119.4 25.5
Strain variation
(%)
From 0 0.105 -1.41 -2.08 -1.61 -2.18 -1.69 -2.23 -1.77 -2.27 -1.78 -2.29 -1.82
To 0.11 -1.41 2.0 -1.61 -2.15 -1.69 -2.20 -1.77 -2.23 -1.78 -2.25 -1.82 -2.19
TCE (ppm) 29.2 249.6 59.8 47.4 53.9 49.1 51.2 46.3 46.3 49.3 47.3 47.3 39.4
5.3.3 Summary
Three experiments measuring the length change during the parylene-C thermal
annealing were done. In the past, it was generally believed that the parylene-C film
expands when it is heated up. In our tests, however, the as-deposited parylene-C film
actually expands only up to the glass transition temperature and shrinks afterward until
the temperature reaches 120°C. It is likely due to the crystallization effect above the
glass transition temperature. The experimental results also show that the parylene-C
sample expands again after 120°C, which is believed that the oxidation dominates this
stage and oxygen atoms get involved into the parylene-C structure. The sample
decomposed at temperature higher than 245°C. The thermal coefficients of expansion of
as-deposited and annealed parylene-C film are found to be different. The thermal
coefficient of expansion of as-deposited parylene-C is found pretty similar to the
literature value, but it becomes higher after the thermal annealing. This is likely
attributed to the higher crystallinity of annealed samples. Due to the miniature size of the
MEMS devices, this thermal expansion effect and difference can be a critical issue when
designing the parylene-C related MEMS devices and thus should be considered in the
devices’ design to avoid unwanted cracks or residual stress.

159
5.4 Oxidation
Like many other kinds of polymers, parylene-C can get oxidized by either
thermally heating [187–189] or by UV light photoluminescence [190–194]. Because
parylene-C is transparent, colorless, and conformal well to all irregularities, and has low
permeability to air and moisture, and pin-hole free material structure, it has been used for
conservation materials [187]. Therefore, research about parylene-C oxidation should
focus more on predicting the lifetime of the as-deposited parylene-C film. Nowlin et al.
published a paper studying the thermal oxidation of parylene-C film at temperatures
between 125 to 200°C [189]. Nowlin used neutron activation (NA) oxygen analysis to
quantitatively analyze the oxidative degradation of the parylene-C film’s mechanical
properties. Their result indicates that the amount of oxygen incorporated into the
parylene-C before a significant degradation in mechanical properties is 5000 ppm. The
activation energy for the parylene-C oxidation is found to be 27±3 kcal/mole. The
temperature for 100,000 hour lifetime use of parylene-C is predicted as 72°C. In
addition, they used IR spectrometer to conclude that the oxidation took place throughout
the entire sample, not just on the surface. By IR spectrometry, Nowlin also claimed that
the oxidized species produced during the oxidation process should be in the form shown
in Figure 5-7, which contained the carbonyl bond, rather than the cleavage of the carbon-
carbon bond. Baker founded in 1977 that no aging effects of yield stress and tensile
modulus were noted in the parylenec-C annealed at 71°C [195]. Monk also suggested in
1997 that 105°C is the recommended maximum annealing temperature where parylene-C
will not crack in their encapsulation coatings [188], which infers very little oxidation
happens at those temperatures. In this section, the oxidative behavior will be first studied

160
by XPS (photoelectron spectroscopy) and FTIR (Fourier transform infrared
spectroscopy). The corresponding mechanical properties will be discussed in later
sections.
CH2
Cl
C CH2
Cl
O
CH2
Figure 5-7: The oxidative species of parylene-C proposed by Nowlin [189]
5.4.1 XPS
XPS (X-ray photoelectron spectroscopy) is widely used by chemists in surface
chemistry analysis. In XPS, the high-energy x-ray photons are emitted onto the material
surface and the material’s electrons are excited and come out due to the “photoelectron
effect”. The escaped electrons are collected by the detector and their corresponding
electron energy (or binding energy) is analyzed. Because electrons’ binding energy are
different from molecule to molecule, the material’s surface compound can be derived
according to these obtained binding energy data. The XPS machine we used is M-Probe
XPS by Surface Science Instruments. Argon sputter was always on to calibrate the peak
which represents carbon at 285 eV.
To measure the level of the oxidation of the parylene-C film versus the annealing
time, several as-deposited parylene-C films were annealed at 200°C in convection oven
for different time durations. A figure of typical XPS scanning results representing four
different oxidation treatments is shown in Figure 5-8: as-deposited, 200°C for two
minutes, 200°C for one hour, and 200°C for two days, all in the convection oven. The
XPS faithfully displays the chemical contents of parylene-C. The chlorine is shown by

161
two peaks of 199.9 eV (2p) and 270 eV (2s), respectively, and carbon is shown at the
peak of 284.6 eV. If the oxygen exists on the parylene-C surface, the XPS can find it as a
peak located at 531.6 eV. To clearly see the difference of oxygen peaks between
parylene-C films of different treatment, a closer view around the oxygen peak at 531.6
eV is also magnified in the top left of Figure 5-8. The contents of the three atoms
(oxygen, carbon and chlorine) can be calculated by integrating over every peak
representing the corresponding atom, and the percentage is shown in Table 5-3. From the
XPS results of as-deposited parylene-C film, it can be found that the ratio of contents of
chlorine to carbon is about 1:8, which agrees well with the parylene-C’s chemical
compound structure. The correct XPS-measured ratio demonstrates the accuracy of the
XPS equipment.
Figure 5-8: Typical XPS results of parylene-C samples. Top left: A closer view of the
peak of 531.6 eV representing the content of oxygen
1000 800 600 400 200 00
500
1000
1500
2000
2500
3000
3500
4000
600 580 560 540 520 500 480 460200
300
400
500
600
700
800
900
1000
Coun
ts
Binding Energy (eV)
As_deposited 2 minutes @ 200oC 1 hour @ 200oC 2 days @ 200oC
Coun
ts
Binding Energy (eV)
Cl 2p: 199.9 eV
C 1s: 284.6 eV
O 1s: 531.6 eV
Cl 2s: 270 eV
O 1s: 531.6 eV

162
Table 5-3: Measured atom percentage of chlorine, carbon, and oxygen for different
oxidative parylene-C films
Atom Percentage
Parylene-C treatment Chlorine Carbon Oxygen
As-deposited 10.46 84.76 4.78
200°C 2 min. in air 13.00 87.00 Non-detectable
200°C 1 hour in air 12.57 84.44 2.99
200°C 2 days in air 11.41 82.03 6.56
200°C 2 days in vacuum 12.06 85.11 2.83
From Figure 5-8, and Table 5-3, it is observed that a small amount of oxygen
signal can be originally found in the as-deposited parylene-C. After baking at 200°C in
the air for the first 2 minutes, the oxygen peak becomes non-detectable by XPS. It infers
that the oxygen found in the as-deposited parylene-C is likely from the moisture
contamination, and it disappears after few minutes of baking. In terms of oxidation, the
oxygen peak becomes detectable again after thirty minutes of annealing at 200°C in our
experiments. The oxygen peaks shown in Figure 5-8 get higher when the annealing time
gets longer, which means that parylene-C on the sample surface gets more oxidized
during the annealing process.
Because oxidation can deteriorate the mechanical properties of the parylene-C
[101], it is generally suggested to anneal the material in the vacuum system to avoid the
oxidation. To verify that the vacuum environment can prevent oxidation, another
parylene-C sample was annealed at 200°C for two days in vacuum and the result is
shown in Figure 5-9. It clearly shows that the oxygen peak of the parylene-C annealed in

163
vacuum is much lower than in the air, meaning that the oxygen content in the annealed
sample is much reduced by adopting this vacuum approach. The improvement can also
be found in Table 5-3, the oxygen content is improved from 6.56% in air to 2.83% in
vacuum. The little amount of oxygen detected can be explained by few oxygen residues
remaining in the vacuum system.
Figure 5-9: Comparison of two XPS results of parylene-C annealed at 200°C for two
days in air and in vacuum
5.4.2 FTIR
Although XPS can provide us with the content of atoms involved in the oxidative
parylene-C film surface, it is generally believed that XPS can only measure the surface
chemical compounds of the material. In addition, XPS cannot provide us with a correct
prediction of the chemical bonding of the oxidative species. Therefore, another
1000 800 600 400 200 00
500
1000
1500
2000
2500
3000
3500
4000
600 580 560 540 520 500 480 460200
300
400
500
600
700
800
900
1000
Cou
nts
Binding Energy (eV)
Coun
ts
Binding Energy (eV)
2 days @ 200oC in air 2 days @ 200oC in vacuumO 1s: 531.6 eV
O 1s: 531.6 eV

164
experiment using FTIR (Fourier transform infrared spectroscopy) is performed here to
study whether the oxidation happens throughout the samples, and also what the chemical
bonding after the oxidation is.
FTIR uses a broad band of infrared light to obtain material’s IR absorption (or
transmission) spectrum. As different chemical functional groups absorb different
wavenumbers of infrared, the IR spectrum tells the specific chemical bond and functional
group inside the material, which can be used to analyze the intermediate oxidative species
of the material.
The FTIR scanning results of the parylene-C annealed in different situations are
shown in Figure 5-10 to Figure 5-12. In Figure 5-10, all parylene-C were annealed at
100°C in the convection oven, but for different time durations. Two curves representing
as-deposited parylene-C and parylene-C annealed at 100°C in the vacuum are shown for
comparison. It is more interesting to look at the wavenumbers of carbon-oxygen single
bond located at 1100–1300cm-1, and also carbonyl bond located at 1695 cm-1 which show
the clue of the oxidation. From Figure 5-10, it can be seen that no observable difference
could be found among the five results within these two interested wavenumber ranges.
No difference between the results of 100°C both in air and in vacuum means that the
parylene-C gets oxidized very slowly at 100°C, which has also been pointed out by Monk
in their real device parylene-C coating tests [188]. Same conclusion can also be obtained
from Figure 5-10 that the annealing time of 4 days in the air makes no big difference to
the as-deposited parylene-C film. The wave form variations between 1750–2750cm-1 and
also among above 3250 cm-1 is likely due to the thickness variations of different samples.

165
Figure 5-10: Typical FTIR results of parylene-C film. The black curve represents the as-
deposited parylene-C film, while the others represent the results of annealing at 100°C.
Figure 5-11 shows the results of parylene-C annealed at 200°C in the convection
oven. It can be clearly seen that the curves shift down more and more as the annealing
time gets longer and longer. Both peaks representing carbon-oxygen single bond and
carbonyl bond get deeper with the increasing annealing time, implying that more amount
of parylene-C gets oxidized during the annealing. The peak growing at 1695 cm-1 means
that the intermediate oxidative species have carbonyl functional group, which was also
found by Nowlin [189]. Except for the three sharp peaks representing the C-H stretching,
it is also found that the curve between 2500–3550 cm-1 gradually gets deeper as the
annealing time gets longer. The regular FTIR database tells us that this range represents
the OH functional group [196]. Therefore, the broader and deeper curve from 2500 cm-1
4000 3500 3000 2500 2000 1500 1000 500-10
0
10
20
30
40
50
60
70
80
90
100
As-deposited 1 day @ 100oC in air 2 days @ 100oC in air 2 days @ 100oC in vacuum 4 days @ 100oC in air
Tran
smitt
ance
(%)
Wavenumber (cm-1)
C=O (1695)
C-O (1300–1100)

166
to 3550 cm-1 might infer that the parylene-C has started to decompose into some chemical
compound after 1 day of annealing at 200°C, which has incorporated moisture to form
the OH functional group.
Figure 5-11: FTIR results of parylene-C annealed at 200°C in air for different times
To verify the vacuum improvement to the annealing, two results of praylene-C
annealed at 200°C with one in the air and one in the vacuum are shown in Figure 5-12. It
clearly shows that parylene-C annealed even at the temperature as high as 200°C in
vacuum has no observable curve difference from the as-deposited parylene-C. It
concludes that annealing in vacuum can preserve the parylene-C material and agrees well
with what we found in Figure 5-9.
4000 3500 3000 2500 2000 1500 1000 500-10
0
10
20
30
40
50
60
70
80
90
100
As-deposited 2 hours @ 200oC 1 day @ 200oC 2 days @ 200oCTr
ansm
ittan
ce (%
)
Wavenumbers (cm-1)
C=O (1695)
C-O (1300–1100)O-H (2500–3550)

167
Figure 5-12: Comparison of the FTIR results of parylene-C annealed at 200°C in air and
vacuum, all for two days
5.4.3 Summary and discussion
In this section, XPS and FTIR techniques have been used to study the oxidation
behavior of the parylene-C film. Both techniques show that the parylene-C film has very
little oxidation happening at 100°C. The results agree well with Nowlin and Monk’s
study, which is shown in Table 5-4. In Table 5-4, the oxidation rate is only found at the
temperature higher than 125°C. If the oxidation rate at 125°C, i.e., 16 ppm [O]/hr, is
taken for calculation, it can be estimated that it takes about 13 days for parylene-C to
have a significant tensile strength degradation (5000 ppm). This demonstrates that
parylene-C is still a very inert material at 100°C in the air.
4000 3500 3000 2500 2000 1500 1000 500-10
0
10
20
30
40
50
60
70
80
90
100
Tran
smitt
ance
(%)
Wavenumbers (cm-1)
As-deposited 2 days @ 200oC in vacuum 2 days @ 200oC in air C=O (1695)
C-O (1300–1100)O-H (2500–3550)

168
Table 5-4: Measured initial (after 1 hour oxidation) oxygen uptake rate for parylene-C by
Nowlin [189]
Temperature (°C) (ppm [O]/hr)
125 152 175 200
16 290 1500 6600
Although XPS only qualitatively demonstrates the oxygen atom percentage of the
paryelen-C film, the oxygen found on parylene-C surface could either come from the real
oxidation during the annealing or the moisture contamination. This measuring
insufficiency of the machines is compensated by using FTIR in our experiments. FTIR
tells the present bonds throughout the parylene-C thickness. Therefore, it can be used to
determine whether the oxygen atom comes from the moisture or the oxidative species. It
is found that the oxidative species of parylene-C have a lot of carbonyl functional group,
which has been predicted by Nowlin. The carbon-oxygen single bond found at 1100–
1300 cm-1, however, needs more studies to figure out its origin. By FTIR, it shows that
the parylene-C might have already started to decompose after one day annealing at 200°C
in the air. Both XPS and FTIR results provide strong evidence that annealing parylene-C
at 200°C in vacuum does prevent serious parylene-C oxidation.

169
5.5 Crystallization
Crystallization is a process of phase transformation [197]. Like most of other
polymers, parylene-C also has a certain degree of crystallization. It is reported that the
crystallinity of the as-deposited parylene-C is about 60% [198–200], and is found to
increase after post-fabrication thermal annealing [104, 184, 201]. On the other hand,
however, parylene-C shares different paths of crystallization from other conventional
polymers: it takes place during its chemical vapor deposition. Conventional polymers'
crystallization is carried out by cooling the material from liquid type at higher
temperature, Tm, to crystallization temperature, Tc, and hold at Tc until the crystallization
is completed, which is called “isothermal crystallization”. The mechanism, model, and
theory of the crystallization of conventional polymers such as polyethylene,
poly(phenylene sulfide), nylon-11, etc., have been extensively described and discussed
[197, 202]. In contrast, the mechanism of polymer crystallization occurring during the
chemical vapor deposition in which the polymerization happens is relatively less studied
and discussed. In the 70s, Wunderlich’s group had done some researches on the
crystallization of poly-para-xylylene (parylene or parylene-N) during its polymerization
process [198, 199, 203, 204]. Their results qualitatively reveal that the parylene
deposited at room temperature starts to crystallize subsequent to polymerization but
before the molecule is complete. Although it was parylene-N that Wunderlich worked
on, it is generally believed that the parylene-C shares the same crystallization mechanism
as well.
Researchers used to focus more on parylene-N’s crystal structures. In 1953,
Brown and Farthing found two types of crystal structures of the parylene-N, α form and β

170
form, and transition from α to β is achieved by thermal annealing (e.g., 220°C for
parylene-N) [205, 206]. Iwamoto found that the parylene-N deposited at 80°C shows a
mixture of α and β forms, while parylene-N deposited between 0–60°C only shows α
form. Niegisch showed that the unit length of parylene-N is 6.58 Å and the orientation of
parylene-N’s polymer chains are aligned with lattice ac plane, which is parallel to the
film plane [186, 207]. Iwamoto used x-ray diffraction technique to completely determine
the structure of parylene-N’s α form, finding that the parylene’s benzene ring is parallel
to the b axis, which is preferentially oriented along the direction perpendicular to the
substrate surface [208]. The parylene-N is also found to have a monoclinic unit cell with
a=5.92 Å, b=10.64 Å, c (fiber axis)=6.55 Å, and β=134.7°. L. You used x-ray pole figure
technique to quantify the crystalline portion of the parylene-N film [200]. It was not until
1984 that, for the first time, Murthy used x-ray diffraction technique to figure out α form
structure of alkylated and chlorinated poly-p-xylylene, i.e., parlene-C [209]. Murthy
claimed that the dimensions of lattice constants in the plane, which was a and c, did not
change with the substituents, but lattice constant b changed from 10.64 Å for parylene-N
to 12.8Å for parylene-C.
The crystallinity and crystalline structure of parylene-C and parylene-N deposited
at different temperatures have been studied by Surendran in 1987 [174, 210]. For
parylene-C, several interesting findings are shown in Surendran’s study:
1. The crystallinity of parylene-C increases as the dimer sublimation rate increases
during the deposition process.
2. No polymorphism is observed either by decreasing the deposition temperature of
by increasing the sublimation rate of the dimer.

171
3. Isothermal annealing increase brings the crystallization without any structural
transformation.
4. At low temperature (< -60°C), all parylene-C depositions are all amorphous.
In this section, the parylene-C’s crystallization was studied in more detail at
100°C in Helium to understand its crystallization kinetics. An in-situ temperature
ramping annealing test was also performed to study its crystallization behavior at various
temperatures. Several parameters of parylene-C’s crystallite structure, e.g., d-spacing
and crystallite size, are calculated and discussed. The time constant of the crystallization
is evaluated in the last part of the section.
5.5.1 X-ray diffraction method
X-ray diffraction technique (XRD) has been widely used to study materials’
crystallinity, crystal orientation, fiber structures, and even the stress inside the materials.
The technique is executed by emitting x-ray onto the sample’s surface via different
incident angles. The x-ray is scattered by materials atoms and the reflected light is
collected by a light sensor. The structure of the tested material can then be figured out by
the observed light information. The machine used in our study is X’Pert PRO MRD
made by Philips. The x-ray anode source is copper and its wavelength is 1.5406 Å.
5.5.1.1 In situ consecutive XRD scanning at 100°C
Our first XRD experiment was performed to measure the crystallinity and
crystallite size of the parylene-C annealed at 100°C consecutively for four hours. The
parylene-C sample was held on the sample holder and the x-ray was scanning the sample
with the angle from 10° to 40° continuously, which took 5.3 minutes to finish one
scanning. The temperature was ramped from room temperature to 100°C at the rate of

172
3°C/min. An inert gas of helium was flushed into the chamber all the time during the
scanning to eliminate any possible oxidation effect.
A typical XRD scanning results showing the curve from 10°–30°is shown in
Figure 5-13. It can be seen that a clear peak happens at 2θ = ~ 14°, which represents the
(020) surface of the monoclinic unit cell. Lots of information can be obtained from the
XRD results and they are introduced and defined as follows.
Figure 5-13: Typical XRD scanning results showing curve from 10°–30°C
5.5.1.1.1 Crystallinity
Two fundamental approaches are usually utilized to calculate the material’s
crystallinity through the XRD scanning results. If either completely amorphous or
crystallized state of the polymer under scanning exists, the XRD results can be calibrated
according to them and the crystallinity at any state could be found [211–214]. Another
10 12 14 16 18 20 22 24 26 28 300
2500
5000
7500
10000
12500
15000
17500
20000
22500
25000
XRD scattering curve Crystalline and amorphous boudary
Coun
ts
Position [o2θ](Copper(Cu))
(020)Peak at ~ 14o
FWHM
173
way to determine the crystallinity is using Hermans method [215–218], which resolves
the curve into amorphous and crystallized portions, as shown in Figure 5-13. The
crystallinity is then defined as the ratio of the crystallized portions, i.e., area bounded by
the back and red lines in Figure 5-13, to the whole area under the black line.
Because the parylene-C shows as neither a completely amorphous nor completely
crystallized polymer right after the deposition, Hermans method is adopted here to
estimate the parylene-C’s crystallinity [174, 210]. However, even though the boundary
in Figure 5-13 can be determined by the commercial software, the estimated crystallinity
still varies based on the algorithm of the boundary determinations. Since the crystallinity
of the as-deposited parylene-C has been published as 60%, all our XRD results were
calibrated to this crystallinity of the as-deposited parylene-C and then the crystallinity at
any state was estimated based on this assumption. It is obvious that the crystallinity
obtained in our experiments is not absolute, but only for comparison purposes.
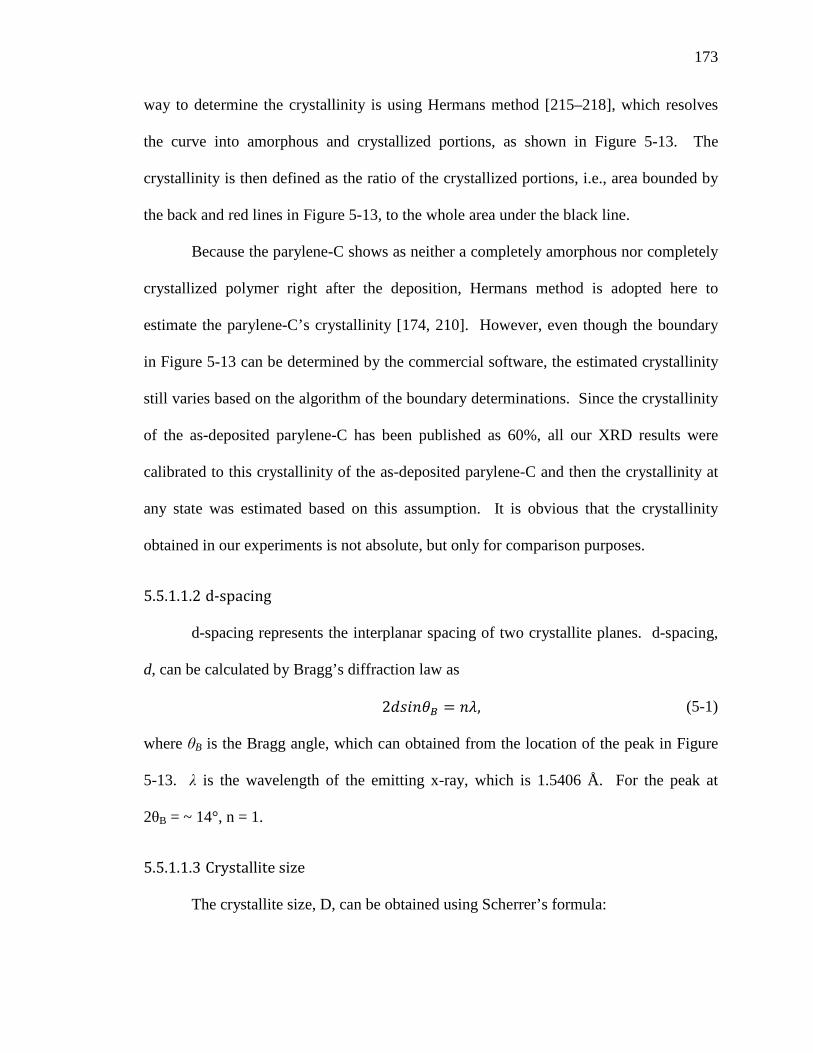
5.5.1.1.2 d-spacing
d-spacing represents the interplanar spacing of two crystallite planes. d-spacing,
d, can be calculated by Bragg’s diffraction law as
2𝑑𝑠𝑖𝑛𝜃𝐵 = 𝑛𝜆, (5-1)
where θB is the Bragg angle, which can obtained from the location of the peak in Figure
5-13. λ is the wavelength of the emitting x-ray, which is 1.5406 Å. For the peak at
2θB = ~ 14°, n = 1.
5.5.1.1.3 Crystallite size
The crystallite size, D, can be obtained using Scherrer’s formula:

174
𝐷 =
0.9𝜆𝐵𝑐𝑜𝑠𝜃𝐵
, (5-2)
where λ and θB are the same as in eqn. (5-1). B is the full width at half maximum
(FWHM), which can be found from the XRD results by commercial software.
Figure 5-14 shows the in situ XRD measurement results of the parylene-C
consecutively annealed at 100°C in Helium. The first obtained curve was at the
temperature of 30°C due to the machine’s limitation. After the temperature reached
100°C, the machine scanned the sample every 5.3 minutes. It can be seen from Figure
5-14 that the height of the curve grows fast between 30° and 100°C. Once the
temperature stabilizes at 100°C, the height keeps growing, but grows at a much slower
rate. As the temperature ramp rate here is 3°C/min, the time constant of the parylene-C
crystallization will be evaluated in Section 5.5.2 by individually annealing every sample.
Figure 5-14: XRD results of in situ XRD measurement of parylene-C consecutively
annealed at 100°C in helium
12.0 12.5 13.0 13.5 14.0 14.5 15.0 15.5 16.00
1000
2000
3000
4000
5000
6000
7000
8000
9000
100oC @ 309.5 min. 100oC @ 208.8 min. 100oC @ 92.2 min. 100oC @ 60.4 min. 100oC @ 44.5 min. 100oC @ 39.2 min. 100oC @ 33.9 min. 30oC @ 5.3 min.
Coun
ts
Position [o2θ] (Copper (Cu))

175
Table 5-5 is the list of the calculated parameters using the in-situ XRD measuring
results of the parylene-C consecutively annealed at 100°C in helium. It can be seen that
the crystallinity is growing up with the annealing time. The crystallinity does not go back
after the parylene-C cools down to 30°C, meaning that the parylene-C structure has gone
through crystallization and is irreversible. The position of the peak of 2θ is found to be at
around 14°. The angle decreases to a bit less than 14.0194 during the annealing, but goes
back to 14.1330. The varying 2θ position implies that d-spacing is changing during
annealing. It can be found that the d-spacing increases more during 30–100°C than
staying at 100°C. The d-spacing increase, therefore, could be explained by the thermal
expansion of the parylene-C. Although the height is found to increase during the
annealing, the FWHM, however, is also found to be narrower at the same time. The
decreasing of the FWHM results in the increasing of the parylene-C crystallite size. As
aforementioned, the crystallinity obtained through Hermans method for parylene-C is not
absolute, it is more reasonable to use parylene-C crystallite size to analyze the level of the
parylene-C crystallization behavior. The crystallite size of parylene-C annealed
consecutively at 100°C versus annealing time is shown in Figure 5-15. It is found that
the crystallite size saturates quickly once the temperature reaches 100°C, meaning that
the crystallization of parylene-C responds spontaneously to the environmental
temperature increase. The results show that the crystallite size saturates within 10
minutes. As the temperature ramping rate is slow, the time constant will be studied in
Section 5.5.2 by annealing the samples in a pre-heated convection oven with different
annealing time to mimic the step temperature change.

176
Table 5-5: A list of calculated parameters using the in situ XRD measurement results of
parylene-C consecutively annealed at 100°C in helium
Time Temperature Crystallinity Position Height FWHM d-spacing Crystallite size
min °C % 2θ Counts 2θ Å Å
5.3 30 60.34 14.1755 2645.00 1.3382 6.2480 59.8226
33.93 100 86.39 14.0408 5985.00 0.9368 6.3076 85.4430
39.23 100 89.06 14.0277 6792.00 0.9368 6.3135 85.4418
44.53 100 89.81 14.0260 7146.00 0.8029 6.3143 99.6908
60.43 100 89.70 14.0261 7565.00 0.8029 6.3142 99.6908
92.23 100 90.45 14.0215 7944.00 0.8029 6.3163 99.6903
208.8 100 91.71 14.0199 8349.00 0.8029 6.3170 99.6901
309.5 100 90.45 14.0194 8476.00 0.6691 6.3172 119.6251
320.7 30 90.27 14.1330 8407.00 0.8029 6.2667 99.7023
Figure 5-15: Crystallite size growing history of parylene-C annealed at 100°C in helium
0 50 100 150 200 250 300 350556065707580859095
100105110115120125 Crystallite Size
Crys
talli
te S
ize (Å
)
Time (min)
20
40
60
80
100
120 Temperature
Tem
pera
ture
(o C)

177
5.5.1.2 In situ temperature ramping annealing study
Another experiment was performed to study the crystallization effect at different
temperatures. In this experiment, the environmental temperature of the parylene-C
sample was ramped up at the rate of 3°C/min up to 300°C. Each scanning also took 5.3
minutes, and the machine kept scanning the sample 6 times after the machine reached the
targeted temperature; hence the parylene-C sample would experience each annealing
temperature for about 31.8 minutes. Helium was also used during the experiment to
prevent the oxidation especially in the high temperature.
The XRD results of the annealing temperatures from 30° to 50°C are shown in
Figure 5-16. For temperature from 80°–250°C, the results are shown in Figure 5-17 in
comparison with the result for 30°C. For Figure 5-16 and Figure 5-17, only the sixth
scanning results for each temperature was selected and drawn, which is believed to be
closely enough to reflect the crystallization saturation at each temperature. The derived
crystallization parameters are listed in Table 5-6, and the crystallite growing history is
shown in Figure 5-18. It is found from Figure 5-16 that parylene-C show very little
crystallization when the temperature is below (including) 50°C. Although the curve of
50°C in Figure 5-16 is higher than that of the lower temperatures, the calculated
crystallite size at 50°C still does not show any clue of growing up, which would imply
that the crystallization does not happen yet, but have a more organized structure at 50°C.
This phenomenon agrees well with the measured length change in 5.3.2. The result again
proves that the parylene-C does not crystallize (or crystallize very little) below 50°C, i.e.,
the glass transition temperature, which can be explained well by thermodynamics. After
the temperature is over 50°C, the height of the XRD curve starts to grow up dramatically,

178
and also shifts to the left as the temperature increases. This shift results in the increase of
the d-spacing, which can be explained as the thermal expansion. The crystallite size also
starts to increase when the temperature ramps up higher than 50°C and keeps growing as
the temperature increases until 250°C. When the temperature reaches 300°C, the
crystallize size suddenly drops, because it is believed that the parylene-C has been
decomposed or melted, as shown in Figure 5-18. The obtained parylene-C decomposing
(or melting) temperature agrees well with the literature value of 290°C [100, 101].
Although the XRD curves of each temperature is always getting higher in the first
scanning, the crystallite size shown Figure 5-18 demonstrates a flat line at most of the
temperatures, except at 80° and 100°C. It reveals that the crystallization of parylene-C is
very likely to have been done within the first 5.3 minutes scanning. The non-flat results
at 80° and 100°C implies that the higher the annealing temperature, the shorter the
crystallization time constant.
Figure 5-16: XRD results of parylene-C annealed at 30°, 37°, 40°, and 50°C
12.0 12.5 13.0 13.5 14.0 14.5 15.0 15.5 16.00
500
1000
1500
2000
2500
3000
3500
50oC 40oC 37oC 30oC
Coun
ts
Position [o2θ](Copper(Cu))

179
Figure 5-17: XRD results of in situ XRD measurement of parylene-C consecutively
annealed at different temperatures in helium. Temperature ramping rate = 3°C/min.
Table 5-6: A list of calculated parameters based on the in situ XRD measurement of
parylene-C consecutively annealed at different temperatures in helium
Time Temperature Crystallinity Position Height FWHM d-spacing Crystallite size
min °C % 2θ Counts 2θ Å Å 31.8 30 62.20 14.0482 2914.00 1.3382 6.3044 59.8144 65.7 37 60.74 14.0285 2935.00 1.3382 6.3132 59.8131 98.1 40 59.65 14.0473 2981.00 1.3382 6.3047 59.8143 133.0 50 58.11 14.0055 3273.00 1.3382 6.3235 59.8117 174.7 80 69.65 13.9203 5865.00 0.9368 6.3620 85.4320 213.1 100 75.04 13.8757 8117.00 0.8029 6.3823 99.6748 251.2 120 79.86 13.8393 10725.00 0.8029 6.3990 99.6709 292.6 150 81.64 13.7948 15898.00 0.6691 6.4196 119.5965 340.7 200 85.73 13.7270 27791.00 0.5353 6.4511 149.4794 388.8 250 86.21 13.6667 45185.00 0.5353 6.4795 149.4699
12.0 12.5 13.0 13.5 14.0 14.5 15.0 15.5 16.00
5000
10000
15000
20000
25000
30000
35000
40000
45000
50000 250oC 200oC 150oC 120oC 100oC 80oC 30oC
Coun
ts
Position [o2θ](Copper(Cu))

180
Figure 5-18: Crystallite size growing history of parylene-C annealed at different
temperatures in helium
5.5.2 Time constant of parylene-C annealed at 100°C
Hsu has suggested in 2008 that the crystallization reaction is likely to be
completed during the brief 20 min of annealing [201]. To find the time constant of the
crystallization of the parylene-C at 100°C, several parylene-C samples were annealed at
100°C but for different annealing durations. To mimic a step-function temperature
increasing profile, a convection oven was first pre-heated to 100°C before the samples
were put in. The samples were taken out when the desired annealing time was up and
then scanned separately by XRD machine.
The list of the XRD results of all parylene-C samples with different thermal
treatment is shown in Table 5-7. It can be found that the crystallite size grows very fast
in the early annealing process and saturates at 99.7 Å in two minutes. The crystallite size
0 50 100 150 200 250 300 350 400 450
30405060708090
100110120130140150160
Crystallite Size
Crys
talli
te S
ize (Å
)
Time (min)
020406080100120140160180200220240260280300320
Temperature
Tem
pera
ture
(o C)
Decomposed between
250oC- 300oC

181
as a function of the annealing time is drawn in Figure 5-19. The data points are curve
fitted to the exponential equation as follows:
crystallite size= 𝐴 + 𝐵𝑒𝑥𝑝 �− 𝑡𝜏�, (5-3)
where A and B are constants and τ is the time constant. The curve fitting result shows
that A is 99.98 Å, B is -40.50 Å and the time constant is 0.845 min. The short time
constant means that parylene-C is very sensitive to heat and crystallization happens very
fast at the annealing temperature. It is attributed to that the polymer chain motion is
restricted during the vapor deposition polymerization (VDP), hence the as-deposited
parylene-C is generally in a metastable state, which means parylene-C is not fully
crystallized right after the VDP [101, 219]. It is postulated that the parylene-C’s polymer
chain tends to move immediately once the temperature reaches the temperature higher
than the glass transition temperature and the crystallization takes place easily afterward.
Figure 5-19: The crystallite size versus the annealing time
0 10 20 30 40 50 60 70 80 90 100 110 120 13050
55
60
65
70
75
80
85
90
95
100
105
Crys
talli
te S
ize
(Å)
Annealing Time (Min.)
Crystallite Size Exponetial fit to A+Bexp(-t/τ)

182
Table 5-7: The lists of the parameters of the crystallization of parylene-C individually
annealed at 100°C for different annealing times
Time Temperature Crystallinity Position FWHM d-spacing Crystallite size
min °C % 2θ 2θ Å Å
0 Room Temperature 60.11 13.9535 1.3382 6.3469 59.8083
1 100 70.12 13.9141 0.9368 6.3648 85.4314
2 100 67.65 14.1324 0.8029 6.2670 99.7022
4 100 73.41 13.9785 0.8029 6.3356 99.6857
6 100 75.79 13.9886 0.8029 6.3311 99.6868
8 100 73.89 13.9729 0.8029 6.3382 99.6851
10 100 73.72 13.9776 0.8029 6.3360 99.6856
20 100 78.67 13.9615 0.8029 6.3433 99.6839
40 100 77.99 13.9894 0.8029 6.3307 99.6869
120 100 75.05 13.9910 0.8029 6.3300 99.6870
5.5.3 Effect of deposition pressure difference
In the previous research, it is found that increasing the deposition pressure will
also increase the deposition rate [201] but decrease the crystallinity [104, 220]. When
previous researchers were doing the parylene-C crystallization study, many of them
usually used the height (or counts) signal of the XRD scanning results to represent
parylene-C crystallinity [104, 201]. However, as has been discussed before, the FWHM

183
also narrows when the curve height increases, therefore the height might not be an
adequate indicator to describe parylene-C’s crystallization behavior.
Rather than using the height of the XRD results, the parylene-C’s crystallite size
is used to study the parylene-C’s crystallization behavior in this section. Another as-
deposited parylene-C film deposited at 35 mTorr was also prepared and scanned by the
XRD machine. The calculated crystallization parameters are shown in Table 5-8 and the
scanning results are shown in Figure 5-17 with the curve of 22 mTorr shown together for
comparison. It is found that the peak of 35 mTorr curve is lower than 22 mTorr as
expected. On the other hand, the obtained 2θ position, d-spacing, and the crystallite size
are all very similar between the two parylene-C deposited at different pressures.
Therefore it could be concluded that the crystallite structures of the two parylene-C films
with different deposition conditions should be similar. The lower height (or intensity),
and hence the lower crystallinity, of the parylene-C deposited at 35 mTorr is likely
attributed to the fact that the percentage of amorphous phase is higher in parylene-C
deposited at 35 mTorr than 22 mTorr. The corresponding mechanical properties will be
discussed in detail in Sections 5.7–5.9.
Table 5-8: XRD results of two as-deposited parylene-C films deposited at 22 mTorr and
35 mTorr, respectively
Deposition pressure Crystallinity Position Height FWHM d-spacing Crystallite
size
mTorr % 2θ Counts 2θ Å Å
22 60.27 14.0241 3979.00 1.3382 6.3151 59.8129
35 21.95 14.0507 1824.00 1.2044 6.3032 66.4595

184
Figure 5-20: Comparison of the results of XRD measurement of parylene-C deposited at
22 mT and 35 mT
5.5.4 Summary and discussion
In this section, the crystallinity of parylene-C annealed at various temperatures or
deposited at different pressures is studied. The time constant of parylene-C annealed at
100ºC is found to be around 0.845 minutes. It infers that as-deposited parylene-C is at a
metastable state and is very sensitive to heat. The crystallization at 100ºC could be done
within only less than one minute. The in situ ramping temperature experiments show that
the parylene-C starts to crystallize above the glass transition temperature, which is found
to be 50ºC in this section via XRD approach. In addition, the crystallinity, or crystallite
size increases as the annealing temperature increases.
In our experiments, the crystallite size of as-deposited parylene-C is found to be
~ 59.8 Å and increases to ~ 149.5 Å at 250ºC and parylene-C decomposes at 300ºC. It is
10 11 12 13 14 15 16 17 18 19 200
500
1000
1500
2000
2500
3000
3500
4000
4500
22 mTorr 35 mTorr
Coun
ts
Position [o2θ] (Copper(Cu))

185
pointed out in Section 5.2 that the molecular length of the parylene-N is about 2000–4000
units per chain. If the unit length of 6.58Å is used, the chain length could be about
13160–26320 Å, or 1.32–2.63 µm. Based on the crystallite size shown in this section, it
can be concluded that the one parylene-C polymer chain is very likely to contribute to
more than one single parylene-C crystallite. The hypothesis is that parts of the long
parylene-C polymer chain are folded to form multiple ordered crystalline structures, or
called lamella, which might happen irregularly in between single polymer chain [221].
The rest of the polymer chain remains in amorphous type. When the parylene-C is heated
up, the parylene-C polymer gets enough energy to move, therefore more polymer chains
become well-organized, and therefore results in the length shortening shown in Section
5.3. It has been reported that another XRD peak happens at 28.2º when the parylene-C is
annealed at 200ºC. The same phenomenon is also found in our XRD scanning results. It
is very likely that another structure transformation takes place at this temperature.
However, to our best knowledge, not too many papers have been working on the effect of
the generation of this peak. The future work would focus on the cause of this peak and
its corresponding crystallite structure. In addition, the future work would also focus on
an another interesting claim which was made by Shaw in 1970 [222]. They claimed that
the free radicals buried in the parylene film would react with other radicals at other
polymer chain ends when annealing directly after the film deposition. Therefore the
annealing process would terminate the as-deposited parylene film radicals and the
radicals would not react with the available oxygen. It might imply that the annealing of
as-deposited parylene-C film could hinder the oxidation of the material, which is very
worthwhile to look into.

186
5.6 Glass Transition Temperature
It is well known that viscoelastic behaviors of polymers differ below and above
the glass transition temperature. To understand the mechanism of polymer transition, the
concept of free volume is first introduced in the first part of this section. The free volume
of the polymer is defined as the space a molecule has for internal movement [223]. The
polymer chain cannot move freely if there is not enough space for a single C-C bond to
rotate. It is believed that the typical free volume of the polymer is 2.5 Vol.-% and it
requires free volume to be greater than 2.5 Vol.-% for macromolecules to start to move
[185].
Figure 5-21: Elastic modulus response versus temperature change
As shown in Figure 5-21, the leftmost region is called glassy region. In this
region, the material has relatively higher and flatter elastic modulus than others. The
macromolecule is ceased in the glassy region and hence the polymer behaves like a
εσ E= εησ =
Glassyregion
GlassTransition region
Rubberyregion
Glass transition temperature Melting temperature

187
perfect elastic material at low temperature. It has been demonstrated that the free volume
increases as the temperature increases [185, 223]. Therefore, as the temperature goes
over a critical temperature, i.e., glass transition (or second transition) temperature, Tg, the
free volume increases to be higher than 2.5 Vol.-%, permitting different kind of chain
movements as well as moving in various directions [185, 223]. In addition, higher
temperature also provides the polymer chain more energy and makes the chain movement
even easier. Therefore, the elastic modulus decreases gradually due to this higher
polymer chain mobility.
Glass transition temperature denotes a plastic material’s onset of the transition of
the reduced Young’s modulus. The transition usually appears as a temperature range
rather than just a deep-dropping step. This transition range is called the glass transition
range. When the temperature passes the glass transition region, the elastic modulus
enters another region called rubbery region. The plastic in this region has rubber-like
response and its behavior can be predicted by viscous materials’ model. The glass
transition temperature usually defines one end of the materials’ usage temperature,
depending on what value the strength and stiffness is needed. The material can be used
in the glassy region with a higher elastic modulus, or in the rubbery region with a lower
elastic modulus. In any case, however, the operating range of the material should not fall
within the glass transition region to avoid unpredictable material behaviors. Therefore,
knowing the elastic modulus with a broad temperature spectrum and the temperature
range of each region helps us select the right materials and also use it in the right
operating temperature range. Furthermore, understanding the mechanism of the polymer
elastic modulus transition can even help us tailor the materials’ glass transition

188
temperature to fit our needs. This section would focus on the measurement of the glass
transition temperature range of parylene-C and also several possible ways to modify it.
5.6.1 Identification of glass transition temperature
5.6.1.1 Reported glass transition temperature of parylene-C
Gorham did the first experiment to measure the glass transition temperature of
parylene-C [172] in 1966 using secant modulus-temperature curve, and characterized
parylene-C’s glass transition temperature to be 80ºC. Many researchers have attempted
to study parylene-C’s Tg after Gorham. A table listing some Tg measuring results is
shown in Table 5-9. Although most the Tg values lie in the range of 13-150ºC, the result
demonstrate a sporadically spread numbers, indicating that the complexity of measuring
paylene-C’s glass transition temperature. As this second transition is attributed to the
polymer movement as described before, it is postulated that the variation might be due to
the parylene-C property difference (structure or crystallinity) of the samples obtained by
different research groups, which might be influenced by different deposition conditions
or post-deposition treatments. In this section, not only as-deposited parylene-C’s Tg is
characterized, but Tg of parylene-C annealed in different temperatures and environments
is also studied to understand the Tg change with respect to the temperature, i.e.,
crystallinity.
As shown in Table 5-9, multiple approaches can be applied to measure parylene-
C’s glass transition temperature. From engineering point of view, measuring the
relationship of the elastic modulus with respect to the temperature is most useful as it
provides the information of not only elastic modulus at different temperature, but also the
material thermodynamic properties including glass transition temperature. In this section,

189
the elastic modulus was measured by two methods: ramping-temperature-dependent
modulus experiment and dynamic mechanical analysis (DMA).
Table 5-9: Some of the previous published parylene-C Tg characterizing results
Study Tg (ºC) Approach Post script
Gorham, 1966 [172] 80 Secant modulus Gilch, 1966 [224] 70 NA Kubo, 1972 [199] 50–80 NA
Alpaugh, 1974 [225] 50 DSC
Iwamoto, 1975 [198] 65 DSC
As-deposited parylene-N, Heating rate: 10°C/min, Nitrogen atmosphere,
Measured Tg varies with respect to the polymerization
temperature (Tg=63–78)
Beach, 1989 [101] 13 NA Tg is expected to have similar Tg as parylene-N’s.
Dabral, 1991[110] 150 Stress-temperature curve
Likely to be 50ºC, according to the presented data.
Gratten, 1991 [187] 110 NA
Senkevich, 1999 and 2000 [184, 226] 35–36, 44 DSC
Different testing rate corresponds to different Tg results.
Quoted by Kamezawa, Suzuki and Kasagi as 50°C [227].
Noh, 2004 [228, 229] < 90 DSC
Huang, 2005 [183] 42.5–62.5 Thermal coefficient of thickness expansion
Tg is 10°C higher when thickness is < 50 nm.
Youn, 2007 [220] 90 NA Tewari, 2009 [230] 70 Current density peak 1-µm-thick sample
5.6.1.2 Ramping-temperature-dependent modulus experiment
The concept of this ramping-temperature-dependent modulus experiment is
shown in Figure 5-22. The test was done with samples under a temperature ramping

190
from -20°C to 150°C. During the temperature ramping, a series of short and quick tensile
tests were performed under 0.3N as the applied static force. In Figure 5-22, every peak
represents one uniaxial tensile test. The stress-strain curve of every uniaxial tensile test is
obtained and the elastic modulus is calculated.
Figure 5-22: Concept of the ramping-temperature-dependent modulus experiment. Every
peak represents one uniaxial tensile test.
Figure 5-23 shows four typical elastic modulus (Young’s modulus) versus
temperature curves, which are characterized by the ramping-temperature-dependent
modulus experiments. Each curve in the Figure 5-23 can be identified into three regions:
the glassy region, the transition region and the rubbery region. The measured elastic
modulus and temperature range of each range of four differently-treated parylene-C are
shown in Table 5-10. The first region (glassy region) shows the glassy state of the testing
sample. The measured elastic modulus of parylene-C at this region varies mildly before
the temperature reaches the onset of the next region. The range of the glass transition
region was found between 30–60°C for as-deposited paryleneC and 80–120°C for
parylene-C annealed at 100°C. When the temperature reaches the glass transition region,
-20 0 20 40 60 80 100 120 140 1600.0
0.1
0.2
0.3
0.4
Stat
ic Fo
rce (
N)
TemperatureoC
Applied Force=0.3N
Temperature sweeping

191
the elastic modulus starts to drop quickly until the temperature reaches the onset of the
third region, which is 60°C for as-deposited parylene-C and 120°C for parylene-C
annealed at 100°C.
Figure 5-23: Elastic (Young’s) modulus versus temperature curve. The transition region
I represents the general glass transition region for as-deposited parylene-C, while
transition region II represents the general glass transition region for parylene-C annealed
at 100°C.
The four glass transition temperatures, Tg, which is normally defined as the
maximum turndown point in the curve, i.e., maximum 𝑑2𝐸/𝑑𝑇2 [231], are found and
shown all in Table 5-10. The obtained Tg of as-deposited parylene-C are both 50°C for
samples deposited at 22 mTorr and 35 mTorr. The Tg of parylene-C annealed at 100°C is
between 100–120°C, which will be identified more clearly in the next section. The
elastic modulus of the parylene-C obtained in the rubbery region was approximately one
-25 0 25 50 75 100 125 150 175 200 2250.1
0.2
0.30.40.50.60.70.80.91
2
34567
Parylene-C (22 mTorr) annealed at 100C for 3 days in vacuum
Parylene-C (22 mTorr) annealed at 100C for 1 day in vacuum
Parylene-C deposited at 35 mTorr Parylene-C deposited at 22 mTorr
Youn
g's
Mod
ulus
(GPa
)
Temperature (oC)
Glassy region
Transition region I
Transition region II
Rubbery region

192
order smaller than in the glassy region, implying that parylene-C can be stretched much
easier than in its glassy state.
Table 5-10: Measured elastic modulus and temperature range of glassy, transition, and
rubbery regions
Parylene-C treatment
Glassy region range Transition region range Rubbery region
range
GPa (°C) GPa (°C) Glass transition temperature, Tg
(°C) GPa (°C)
As-deposited
(22 mT) 3.38–2.68 -20–30 2.68–0.96 30–60 50 0.96–0.29 60–200
As-deposited
(35 mT) 3.57–2.64 -20–30 2.64–1.12 30–60 50 1.12–0.50 60–150
As-deposited annealed at
100°C for 1 day 4.88–2.31 -20–80 2.31–0.68 80–120 100 0.68–0.19 120–200
As-deposited annealed at
100°C for 3 days 6.15–3.08 -20–80 3.08–1.00 80–120 100 1.00–0.33 120–200
Although the ramping-temperature-dependent modulus experiment has shown its
success characterizing Tg of the parylene-C samples, the uniaxial tensile test performed in
this method is not continuous. If the temperature increment is too large, the Tg cannot be
clearly resolved and only a rough Tg range can be identified. The Tg of parylene-C
annealed at 100°C in Figure 5-23 demonstrates the problem. Another approach called
dynamic mechanical analysis is commonly adopted to solve this problem and is
introduced in the next section.

193
5.6.1.3 Dynamic mechanical analysis
Dynamic Mechanical Analysis (DMA) is a technique used to study material’s
viscoelastic/viscoplastic properties. As show in Figure 5-24 (a), the machine applied a
continuous sinusoidal oscillatory stress, which is within material’s linear elastic region,
either by torsion, compression or tension to the specimen. The responded sinusoidal
strain is recorded with respect to the time and the phase delay, δ, between the applied
stress and the responded strain can be found as well. For a perfectly elastic material, δ
equals to 0°; for a viscous material, δ equals to 90°. If δ falls in between 0° and 90°, the
material is called viscoelastic material [223]. If the amplitude of the measured strain, ε, is
denoted as ε0, the frequency of the applied stress is ω, the measured strain can be
represented as
𝜀 = 𝜀0 sin(𝜔𝑡 + 𝛿) = 𝜀0𝑐𝑜𝑠𝛿 sin(𝜔𝑡) + 𝜀0𝑠𝑖𝑛𝛿 cos(𝜔𝑡)
= 𝜀′ sin(𝜔𝑡) + 𝜀" cos(𝜔𝑡), (5-4)
or
𝜀∗ = 𝜀′ + 𝑖𝜀", (5-5)
where ε*is called the complex strain, ε’ is the strain which is in-phase with the applied
stress and the ε” is the out-of-phase strain. If the amplitude of applied stress is σ0, the
modulus of the material can also be considered and represented as:
𝐸 = �𝜎0𝜀0� 𝑐𝑜𝑠𝛿 + �
𝜎0𝜀0� 𝑠𝑖𝑛𝛿 = 𝐸′ + 𝑖𝐸", (5-6)
or
𝐸∗ = 𝐸′ + 𝑖𝐸", (5-7)
where E*is called the complex modulus and the E’ is called the storage modulus and the
E” is called the loss modulus. The relationships of E*, E’, and E” can be shown in

194
Figure 5-24 (b). Physically, E” represents the energy dissipation of the materials during
the oscillatory excitation. E’ represents how elastic the material is and ideally it is
equivalent to Young’s modulus [223]. Tan δ is the parameter representing the damping
properties of the materials. Tan δ is an indicator of how efficiently the materials loses
energy to molecular rearrangements and internal friction [223].
Figure 5-24: The concept of dynamic analytical analysis. (a) A sinusoidal oscillatory
stress is applied and the material’s sinusoidal strain response with a phase delay
(viscoelastic materials) is measured. (b) The relationship of complex modulus (E*), the
storage modulus (E’), and the loss modulus (E”)
This sinusoidal oscillatory experiment can be performed under different
temperatures and the corresponding mechanical parameters are then measured and
calculated. A typical DMA result is shown in Figure 5-25. The solid line represents the
Appl
ied
stre
ss
Time
Mea
sure
d st
rain
Time
Phase lag δ
δ
E*
E”
E’
E*: Complex modulus=stress/strain
E’: Storage modulus=E*cos(δ)E”: Loss modulus=E*sin(δ)Tan δ=E”/E’
σ0
ε0
(a) (b)
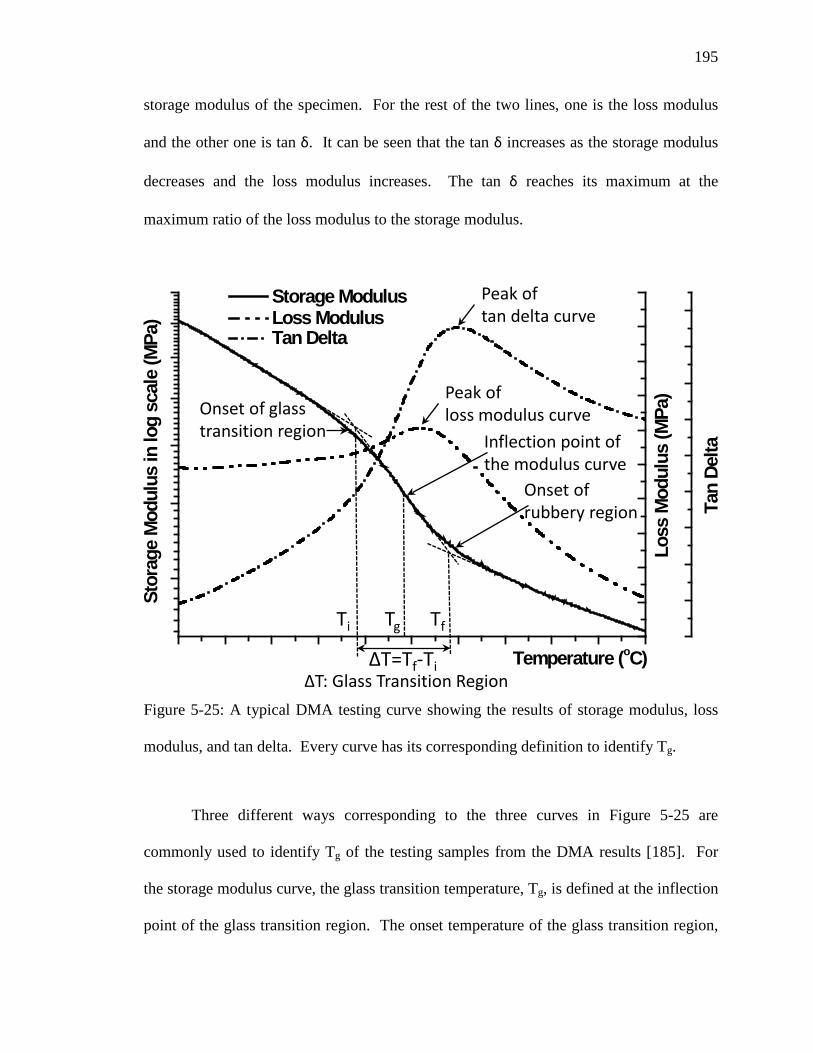
195
storage modulus of the specimen. For the rest of the two lines, one is the loss modulus
and the other one is tan δ. It can be seen that the tan δ increases as the storage modulus
decreases and the loss modulus increases. The tan δ reaches its maximum at the
maximum ratio of the loss modulus to the storage modulus.
Figure 5-25: A typical DMA testing curve showing the results of storage modulus, loss
modulus, and tan delta. Every curve has its corresponding definition to identify Tg.
Three different ways corresponding to the three curves in Figure 5-25 are
commonly used to identify Tg of the testing samples from the DMA results [185]. For
the storage modulus curve, the glass transition temperature, Tg, is defined at the inflection
point of the glass transition region. The onset temperature of the glass transition region,
Storage Modulus
Stor
age
Mod
ulus
in lo
g sc
ale
(MPa
)
Temperature (oC)
Loss Modulus
Loss
Mod
ulus
(MPa
)
Tan Delta
Tan
Delta
Ti Tg Tf
ΔT=Tf-Ti
Onset of glass transition region
Onset ofrubbery region
Inflection point of the modulus curve
ΔT: Glass Transition Region
Peak of tan delta curve
Peak of loss modulus curve

196
Ti, is defined as the intersection of the two tangents of the storage modulus curve in the
glassy region and the glass transition region. The onset temperature of the rubbery
region, or the end of the glass transition region, Tf, is defined as the intersection of the
two tangents of the storage modulus curve in the glass transition region and the rubbery
region. The glass transition temperature of the loss modulus curve and the tan δ curve
are both defined as the peak of the curves. As the storage modulus represents the
Young’s modulus, it is more meaningful to use the storage modulus curve to study the
glass transition region, and therefore will be used in our whole glass transition
temperature study.
To compare the accuracy and the capability of the two approaches discussed
above, a comparison of two typical results of the two approaches is shown in Figure 5-26.
The sample tested is the parylene-C annealed at 100°C for one day in vacuum oven. The
Tg provided by DMA is 113.1°C and the other method measures the Tg to be in the range
between 100°C and 110°C. The comparison shows that two methods both provide results
which are very close to each other. The discrepancy found between two curves might be
attributed to the testing frequency difference, which is worth more studying. From the
analytical point of view, however, the DMA approach provides a much smoother, non-
interrupted curve so that Tg is able to be defined more accurately. Therefore, DMA
measurement is generally used in most glass transition temperature study in the thesis
unless otherwise specified.

197
Figure 5-26: A comparison of the results of the ramping-temperature-dependent modulus
experiment and the DMA test. Parylene-C sample was annealed at 100°C for one day in
vacuum. Tg is found at the inflection point of each glass transition region.
5.6.2 Measuring results and discussion
Several selected measured storage modulus curves and their obtained
corresponding Tg are shown in Figure 5-27, Figure 5-28, Figure 5-29, and Figure 5-30.
The convection oven used in the Tg measurement experiment was always preheated to the
target temperature before the parylene-C sample loading, and therefore samples always
experienced step-function temperature profile during the annealing. In Figure 5-27, three
samples were annealed at 100°C but for different annealing times with one curve
representing the as-deposited parylene-C for comparison purposes. In Figure 5-28, four
parylene-C samples were all annealed at 100°C, but for a different period of times shorter
Tg found by DMA
Tg found by ramping-temperature-dependent modulus experiment
-25 0 25 50 75 100 125 150 175 200 2250.1
0.2
0.30.40.50.60.70.80.9
2
34567
Ramping-Temperature-Dependent modulus experiment
Elastic Modulus of DMA
Elas
tic M
odul
us (G
Pa)
Temperature (oC)

198
than Figure 5-27, with one as-deposited parylene-C result for comparison. In Figure
5-29, two parylene-C samples were annealed at 200°C in vacuum for one and two days
and one parylene-C annealed at 100°C for two days, with one as-deposited parylene-C
result for comparison. In Figure 5-30, seven parylene-C samples were annealed at
different temperatures as shown in the DMAQ800 chamber (no vacuum) for the first 30
minutes followed by the regular Tg measurement procedures. Several observations and
conclusions can be found from those four figures:
1. It is clearly seen from Figure 5-27 to Figure 5-30 that the measured Tg increases
as the annealing temperature increases. As shown in Figure 5-29, because all the
parylene-C samples shown in the figure were all annealed in vacuum, the
possibility of the oxidation effect could be eliminated. Therefore, the Tg
increment is very likely attributed to the crystallinity increase after the parylene-C
annealed at high temperature. Compared to the amorphous part of the polymer,
the crystallite part is generally assumed to be much stronger and will remain
intact under the applied force [185]. As it has been verified in Section 5.5 that the
crystallinity increases when the annealing temperature increases, the deformable
amorphous part of the annealed parylene-C reduces. Owing to the less
amorphous part after higher temperature annealing, the molecular structure of
parylene-C becomes more difficult to move, and hence the Tg is obtained to be
higher after annealed. The result found agrees well with Senkevich’s observation:
“semicrystalline polymers exhibit an increase in their Tg, a larger Tg range and a
decrease in ΔCp, making Tg determination more difficult as less amorphous
material exists to contribute to the Tg” [184].

199
2. The measured Tg increases as the annealing time increases. The effect can be
found in Figure 5-27 to Figure 5-29. This phenomenon could be explained by the
same reason of parylene-C crystallinity increment. As described in Section 5.5
that the longer annealing time increases the crystallinity of the parylene-C, and
therefore it can thus increase the Tg as well, as the amorphous part is the weaker
part inside the polymer.
3. It is also found that the Tg increases extremely fast at the early stage of the
annealing when it experiences the elevated temperature. As shown in Figure
5-28, it can be seen that Tg increases to 86.2°C after the first 30sec of annealing at
100°C and the Tg increasing rate slows down afterward. According to the
previous conclusion that parylene-C’s Tg increases due to its crystallization, the
testing result is another strong evidence that parylene-C crystallizes fast when it
experiences temperature higher than its Tg, i.e., ~ 50°C found from Section
5.6.1.2. It further confirms that the time constant of the parylene-C crystallization
is shorter than one minute, which agrees well with our findings in Section 5.5.2.
4. From Figure 5-27 to Figure 5-30, it is found that the obtained Tg is usually close
to, but a bit higher than, the annealing temperature. This can be explained that the
free volume inside the annealed paryelne-C has been reduced to or lower than
2.5% [185] during the annealing. As it requires making the free volume go over
2.5% to make the parylene-C reach glass transition again, the temperature needs
to go at least as high as or even a bit higher than the prior annealing temperature
and therefore the re-measured Tg will be close to the prior annealing temperature.

200
5. The glass transition region of the storage modulus curve of parylene-C annealed
at 200°C becomes very vague and hard to find a definite Tg. According to the
trend of other Tg of the parylene-C annealed at lower temperature, this Tg might
be higher than 200°C and cannot be defined from Figure 5-29 because of the
insufficient testing data. Both curves of parylene-C annealed at 200°C for either
one or two days shown in Figure 5-29 look like almost linear, which implies
parylene-C would behave similar to the perfectly elastic material at temperatures
lower than 200°C after annealed at 200°C. This will be verified again by the
creep tests in Section 5.8.1.
6. It can be found from Figure 5-30 that there is no significant difference between
the Tg measured at the temperature at 20°C and 40°C. As the Tg of the as-
deposited parylene-C can been revealed to be around 50°C from Figure 5-27, it is
hypothesized that the crystallization does not happen at temperatures less or equal
to 40°C. Therefore, when the parylene-C is annealed at 20 or 40°C, there is not
enough energy to cause the parylene-C polymer chains to move and crystallize. It
could be concluded that Tg of parylene-C will not change as long as the prior
annealing temperature is less than Tg.
7. The measured elastic modulus, i.e., Young’s modulus, increases when either the
annealing temperature or time increases. As it is generally believed that the
crystallite has a much stronger modulus than amorphous part, it could also imply
that more parylene-C is crystallized at higher annealing temperatures or longer
annealing times. This finding agrees well with what has been found in Section
5.5. In addition, the descending slopes of the storage modulus are all very similar

201
before and after the glass transition region. In the same region, either glassy or
rubbery region, the descending slopes of the storage modulus curve of every
sample are also similar to each other no matter what kind of treatment the sample
has experienced prior to the DMA test.
8. It is observed that the glass transition range tends to broaden as either the
annealing temperature or annealing time increases. It is also likely due to that fact
that the amorphous part of the annealed parylene-C is reduced, and therefore it
takes more energy, i.e., higher temperature, to bring parylene-C into the rubbery
region.
Figure 5-27: Measured Tg of four parylene-C annealed in different conditions: 3 samples
at 100°C, with as-deposited parylene-C as a comparison
-40 -20 0 20 40 60 80 100 120 140 160 180 200
1
2
3
4
567 100oC annealed in vacuum for 2 days. (T
g1)
100oC annealed in air for 1 day. (Tg2)
100oC annealed in air for 30 min. (Tg3)
As-deposited. (Tg4)
Stor
age
Mod
ulus
in lo
g sc
ale
(GPa
)
Temperature (oC)
Tg 1=115.2°C
Tg 2=111.8°C
Tg 3=108.2°C
Tg 4=51.0°C

202
Figure 5-28: Measured Tg of parylene-C samples all annealed in 100°C but for different
times: 30 sec, 1 min, 3 min, and 30 min
Figure 5-29: Measured Tg of four parylene-C samples annealed in different temperatures
-40 -20 0 20 40 60 80 100 120 140 160 180 200
1
2
3
4
5678
As-Deposited 30 sec. at 100oC 1 min. at 100oC 3 min. at 100oC 30 min. at 100oC
Stor
age
Mod
ulus
(MPa
)
Temperature (oC)
Tg _30sec=86.2°C
Tg _1 min=87.3°C
Tg _AD=54.9°C
Tg _3 min=93.0°CTg _30 min=105.6°C
-40 -20 0 20 40 60 80 100 120 140 160 180 200
1
2
3
4
5678
200oC annealed in vacuum for 2 days. (Tg1)
200oC annealed in vacuum for 1 day. (Tg2)
100oC annealed in vacuum for 2 days. (Tg3)
As-deposited. (Tg4)
Stor
age
Mod
ulus
in lo
g sc
ale
(GPa
)
Temperature (oC)
Tg 4=51.0°C
Tg 3=115.2°C
Hard to define Tg1 and Tg2

203
Figure 5-30: Measured Tg of seven parylene-C samples annealed in different
temperatures. Samples were annealed in the DMA Q800 chamber for 30 min prior to the
Tg test.
Table 5-11 systematically and quantitatively displays the measured Tg and the
glass transition region of every testing sample shown in Figure 5-27 through Figure 5-30.
In addition, the Tg obtained by the peak of loss modulus curve and the tan δ curve are
also listed for comparison.
-40 -20 0 20 40 60 80 100 120 140 160 180 200
1
2
3
4
567
20oC (Tg_20) 40oC (Tg_40) 60oC (Tg_60) 80oC (Tg_80) 100oC (Tg_100) 120oC (Tg_120) 150oC (Tg_150)St
orag
e M
odul
us in
log
scal
e (G
Pa)
Temperature (oC)
Tg _20=53.4°C ≈ Tg_40=53.7
Tg _60=69.6°CTg _80=88.2°C
Tg _100=108.2°C
Tg _120=131.0°C
Tg _150=161.1°C

204
Table 5-11: Measured glass transition temperature via DMA approach
Parylene-C treatment Tg obtained by
storage modulus (°C)
Tg obtained by peak of loss
modulus (°C)
Tg obtained by
peak of tan δ
Sample treated in DMA chamber Ti Tg Tf ΔT TL
As-deposited 50.2 53.4 57.0 6.8 68.4 94.1
40°C in air for 30 min 50.8 53.7 55.5 4.7 67.2 91.6
60°C in air for 30 min 65.3 69.6 73.3 8 78.15 93.84
80°C in air for 30 min 83.6 88.2 94.9 11.3 95.3 101.14
100°C in air for 30 min 105.6 108.2 115.6 10 113.9 119.1
120°C in air for 30 min 124.9 131.0 138.0 13.1 136.8 143.6
150°C in air for 30 min 155.3 161.1 169.1 13.8 168.9 - Sample treated outside
DMA chamber Ti Tg Tf ΔT TL
As-deposited at 35 mT 52.5 55.1 58.8 6.3 71.6 92
As-deposited 50.2 53.4 57.0 6.8 68.4 94.1
100°C in air for 30 sec 78.4 87.3 98.4 20 95.3 101.8
100°C in air for 1 min 81.8 86.2 100.6 18.8 93.7 103.9
100°C in air for 3 min 82.7 93.0 103.2 20.5 98.9 107.0
100°C in air for 30 min. 96.7 105.6 115.8 19.1 111.2 120.6
100°C in air for 1 hour 95.1 103.0 109.6 14.5 106.7 115.9
100°C in air for 2 hour 96.2 101.5 109.6 13.4 109.6 114.4
100°C in air for 3 hour 96.4 101.8 111.2 14.8 108.3 115.9
100°C in air for 6 hour 97.8 106.3 115.9 18.1 112.2 118.9
100°C in air for 16 hour 103.1 110.3 118.9 15.8 116.8 122.9
100°C in air for 1 day 104.4 111.8 119.7 15.3 117.4 123.3
100°C in air for 2 days 106.9 114.7 122.3 15.4 120.2 125.3
100°C in air for 3 days 111.4 116.9 122.2 10.8 122.1 128.0
100°C in vacuum for 1 day 100.5 113.1 121.5 21.0 118.4 124.7
100°C in vacuum for 2 days 103.7 115.2 122.4 18.7 120.2 125.3
200°C in vacuum for 1 day Hard to find a Tg
200°C in vacuum for 2 days Hard to find a Tg

205
Apart from the findings aforementioned, more things can be observed from Table
5-11:
1. The Tg of as-deposited parylene-C is found at 53.4°C. On the contrast to the
ramping-temperature-dependent modulus experiment which provides a rough Tg
and the glass transition range, DMA measurement provides much more accurate
Tg of the parylene-C and also its range. Even though, Tg provided by both
methods are very close, meaning that they are both reliable approaches.
2. It is shown in Table 5-11 that Tg of the parylene-C deposited at 35 mTorr
(55.1°C) similar to 22 mTorr (53.4°C). Although it has been shown in Section
5.5.3 that the parylene-C is likely have lower crystallinity when the deposition
pressure increases, the crystallinity difference does not seem to influence the Tg
results of these two parylene-C samples. On the other hand, however, it also
shows in Section 5.5.3 that the crystallite size of these two parylene-C deposited
at different pressure are very similar, which might explain the Tg-similarity result
obtained in this section. More future work is required to figure out the cause of
this observation.
3. As discussed in Section 5.4, it is assumed that the mechanical properties of
parylene-C annealed at 100°C have no significant difference between in the air or
in the vacuum. The hypothesis applies in Table 5-11 as well. For instance, there
is no distinguishable difference found between the Tg of the parylene-C annealed
at 100°C for one day in air (111.8°C) or vacuum (113.1°C). Therefore, sample
oxidation is likely not to be the dominant issue in terms of the Tg measurement.

206
4. Although Tg increases as the annealing time increases, it is found that Tg actually
increases fast from 53.4°C to 87.3°C during the first 30 sec when annealed at
100°C, and reaches 105.6°C after 30 min of annealing. As the parylene-C’s Tg
change within only one minute agrees well with result of Section 5.5.1 that the
time constant of the crystallization of parylene-C annealed at 100°C is less than 1
minute, it can be concluded that the Tg is mainly influenced by the fast progress
of the crystallization of the parylene-C.
5. It is also phenomenally observed that the Tg obtained using the peak of the loss
modulus curve and the tan δ curve is usually higher than storage modulus curve.
In spite of the discrepancies between Tg obtained from storage modulus, loss
modulus and tan δ, researchers accept it as the glass transition represents a range
of the behavior and people have agreed to accept a single temperature as the
indicator for certain standards [232]. Scientists working on different aspects may
pick up different values from the same set of data. In our experiments, the order
of the three Tg can be generally shown as:
Storage modulus Tg< Loss modulus Tg< Tan δ Tg
6. Dabral et al. predicted the parylene-C Tg as 150ºC according to the their obtained
stress-temperature curve [110]. The Tg was determined by them at the time when
the stress started to show no large variations. However, it is also noted that the Tg
could be found as different via a different approach and therefore a different value
is obtained according our new observation. It is first found from Dabral’s curve
that the as-deposited parylene-C shows -6 MPa (i.e. compressive stress) after the
deposition. The stress then decreases (i.e., becomes more compressive) as the

207
temperature increases until 50ºC. The stress keeps increasing until it balances
with the silicon substrate. From Dabral’s reported curve of stress versus
temperature, a turning point is found at 50ºC. The most negative stress (i.e., the
most compressive stress) is found at this turning point and then starts to increase
as the temperature increases and then stabilizes after 100ºC. The assumption of
this phenomenon is that the parylene-C expands until 50ºC due to thermal
expansion of the sample, and starts to shrink after the temperature becomes higher
than 50ºC due to the crystallization. This result actually agrees well with what
has been found in Section 5.3. Therefore, according to our discussion in Sections
5.3, 5.5 and also Dabral’s stress-temperature curve, the parylene-C starts to
crystallize at around 50ºC, and therefore the Tg could be defined as 50ºC.
5.6.3 Summary
Although the study of parylene-C Tg started as early as in 1966 by Gorham, the
past results indicated that there still exists inconsistency of the reported glass transition
temperatures of parylene C, which widely ranged from 13 to 150ºC. It can be found from
Table 5-9 that different measuring techniques can produce different Tg results. This is
not surprising, though. Different researchers from research fields would adopt different
approaches which is more relevant to their works. The different can be as much as 25
degree difference in data from a DSC to DMA data reported as peak of tan delta [232].
In two of our experiments, ramping-temperature-dependent modulus experiment and
DMA analysis, the obtained Tg of as-deposited parylene-C show consistent results and all
of them fall in the range of ~ 50–55°C. Our measured Tg agrees well with the numbers
published by Alpaugh, Senkevich and Huang. Annealing temperature and time are

208
proved to be the main cause affecting the results of Tg and its range. High annealing
temperature (higher than the Tg of as-deposited parylene-C) and long annealing time can
make the parylene-C more crystallized and therefore increases its final Tg. Apart from
the different measuring approaches, it could be concluded that unstandardized parylene-C
sample preparation is likely one of the reasons causing the variation of the Tg’s literature
value. On the other hand, the deposition pressure does not seem to influence the
measured Tg, in our tests, which need more data points to verify this observation. Future
work would also focus on the influence of the deposition temperature and also the
deposition rate.
With its superb biocompatibility and its compatibility with the CMOS fabrication
process, parylene-C is widely used as a biocompatible material in MEMS technology.
Since many cleanroom processes introduce high temperature during the process,
parylene-C is very likely to be annealed during the device fabrication. These heat-
generating processes could cause the Tg to shift during the fabrication and the parylene-C
will not behave the same as the as-deposited one after the clean room fabrication process.
In other words, knowing the temperature history of the parylene-C fabrication is crucial
and can be very helpful in predicting its glass transition temperature and also mechanical
properties, therefore the device properties after the manufacturing. If the device’s
parylene-C mechanical property is the main concern during its operation, the temperature
history needs to be recorded in order to control its final functional behaviors.
5.7 Uniaxial Tensile Test
Uniaxial tensile test is one of the most fundamental and popular tests used to
measure the mechanical properties of a material. Figure 5-31 shows a typical stress-

209
strain curve of an as-deposited parylene-C film obtained from our uniaxial tensile test at
room temperature. The solid line shows the nominal stress-strain curve while the dashed
line represents the modified true stress-strain one. From the regular engineering aspect,
nominal curve is more conservative and therefore will be considered in this section unless
otherwise specified. In most of the testing results, it is very common to see an artifact
showing a toe region in the early stage of the testing curve as seen in the Figure 5-31.
This is caused by a takeup of slack and needs to be corrected to obtain correct parameters
following the ASTM standards D882-09 and D638-08 [233, 234]. In this section, five
different parameters: elastic modulus (Young’s modulus, E), nominal tensile strength
(σT), yield strength (σY), percent elongation (%El) and percent elongation at yield (εY)
were considered and calculated according to the definition of ASTM standards. In terms
of the identification of the yield point, there are different ways to find out the point
depending on the curve feature of the material. Provided by ASTM standard D638-08,
the yield point is defined as the first point on the stress-strain curve at which an increase
in strain occurs without an increase in stress. By this definition, it is very likely the
nominal tensile strength shares the same value of the yield strength due to parylene-C’s
stress-strain curve characteristics.
A film of 20µm thick parylene-C was first deposited on a clean glass plate and
then the film was cut into 5.3-µm-wide strips for testing. The gauge length was taken as
10 mm for uniaxial tensile test. The parylene-C strips were then treated at different
temperatures to study the temperature effects. In addition, parylene-C film deposited at
different pressure was also obtained to study the deposition pressure influence. As
oxidation is recognized as a key control factor affecting final parylene-C’s properties, it

210
Figure 5-31: Typical as-deposited parylene-C film uniaxial tensile test results obtained by
TA instrument DMA Q800 system. Toe region is compensated to give the final correct
calculated parameters. All terminologies follow the definition of the ASTM standard
D882-09 and D638-08 [233, 234].
was also explored in this section. The testing environmental temperature was 20°C
unless otherwise specified. The strain loading rate was 1% / min. At least three samples
treated in the same condition were tested to calculate the average number and standard
deviation of the parameters. Table 5-12 shows the uniaxial tensile tests testing results of
parylene-C film treated under different conditions. The literature numbers provided by
SCS, and reported by Gorham [172], Spivack [235], Baker [195], and Beach [101, 102]
0 50 100 150 2000
10
20
30
40
50
60
70
80
90
100St
ress
(MPa
)
Nominal Strain (%)
True Stress Nominal Stress
Nominal Tensile Strength/ Tensile Strength at Yield
Slope= Elastic modulus
Percent Elongation at break
Tear initiates
0.0 0.10
1
2
3
4
Toe Region

211
are also listed for comparison. The results of different post-deposition treatment and their
different effects are discussed in the following sections.
5.7.1 As-deposited parylene-C film
The as-deposited parylene-C was deposited at 20°C and 22 mTorr. A typical
uniaxial tensile curve of the as-deposited parylene-C is shown in Figure 5-31. Table 5-12
lists five different types of mechanical properties of the as-deposited parylene-C film
obtained in our uniaxial tensile test. Due to a common toe region effect, elastic modulus
can be calculated based on two different reference points. One is to take the tangent to a
short section of the proportional region after toe region correction, denoted as E. The
other is to take a slope from the measuring point with respect to 0 MPa in stress and 0 %
in strain, denoted as E0. The value shown in Table 5-12 is always higher than the
literature values. Because the proportional region of parylene-C does not show a linear
line but a gradually-changing curve, it is believed that the elastic modulus measured at
different strain can be different and the value decreases with the increase of the strain.
Two values of tensile strength are provided here as well. One is the maximum
nominal tensile stress, σT, according to ASTM standard D882-09, while the other one
represents the modified maximum true stress, σT. For the tensile strength obtained from
SCS, the value represents the maximum stress prior to plastic deformation. However,
whether the value is calculated as nominal or true stress is not clearly stated from the
parylene-C provider. Therefore both our measured numbers are listed to compare to the
literature values.

212
Table 5-12: Measured mechanical properties of parylene-C film’s uniaxial tensile test
Parameter
Parylene-C treatment
Elastic modulus
Elastic modulus
from 0 MPa and 0%
Nominal tensile
strength
Max true
tensile stress
Yield strength
Percent elongation
at yield
Percent elongation
Symbol E E0 σT σTT σY εY %El Unit GPa GPa MPa MPa MPa % % SCS 2.758 68.948* 55.158 2.9 Up to 200
Gorham [172] 3.172 73.08** NA NA 220
Spivack [235]* 2.354; 2.746 (1% strain) 61.302; 68.658 57.9; 54.9 4.2; 2.9 170; 200
Baker [195] 2.917 NA 56.904 NA NA Beach [101, 102] 3.2 70** 55 2.9 200
As-deposited (22 mTorr) 3.841 3.470 58.37 67.869 58.37 2.861 119.139
Standard deviation 0.315 0.285 5.718 7.290 5.718 0.472 17.611 As-deposited (35 mTorr) 2.999 2.452 49.189 50.45 49.189 2.506 66.325
Standard deviation 0.156 0.066 2.186 2.264 2.186 0.039 23.767 30 sec100°C in air 4.339 3.650 77.506 80.938 77.506 4.260 43.969 Standard deviation 0.125 0.355 1.307 1.274 1.307 0.271 4.250 1 min100°C in air 4.680 4.060 77.233 81.066 75.687 3.197 37.848 Standard deviation 0.094 0.197 6.660 6.016 9.188 0.873 11.224 3 min100°C in air 4.467 3.757 81.087 84.733 81.087 4.164 43.383 Standard deviation 0.234 0.517 2.520 2.460 2.520 0.374 5.896 30 min100°C in air 4.251 3.239 74.153 77.276 74.153 4.153 36.963 Standard deviation 0.057 0.052 4.273 4.147 4.273 0.598 6.037 1 day 100°C in air 4.547 4.070 83.921 86.834 83.921 3.367 8.526 Standard deviation 0.292 0.286 1.288 1.204 1.288 0.313 1.366
1 day 100°C in vacuum 4.312 4.058 72.700 75.166 72.700 2.200 6.897
Standard deviation 0.189 0.264 2.893 3.227 2.893 1.530 5.172 2 day 100°C in vacuum 5.298 4.835 92.185 95.135 92.185 3.157 6.313
Standard deviation 0.216 0.165 3.466 3.666 3.466 0.286 1.312 1 day 200°C in vacuum 4.961 4.472 81.659 84.636 81.659 3.399 6.515
Standard deviation 0.086 0.192 2.439 3.034 2.439 0.357 3.236 2 day 200°C in vacuum 6.058 5.629 102.933 106.591 102.933 3.449 4.512
Standard deviation 0.129 0.268 7.490 8.325 7.490 0.603 0.447 *The first number corresponds to 0.12–28.0 µm thick while the second one is 25 µm thick. **It is not clearly specified what type of tensile strength— nominal or true tensile stress—is given in the SCS parylene-C data sheet and references [100–102].

213
The yield strength given by SCS is calculated with a 0.2% offset from the elastic
strain. Because different elastic modulus could lead to different yield strength value, the
tensile strength shown in Table 5-12 is calculated according to standard ASTM D882-09.
The obtained value is higher than SCS’s due to the offset, but the deviation is within
10%.
Percent of elongation is obtained as 119.14 %, which is much smaller than the
literature value. It is believed that the testing specimen tore before the specimen really
broke which is actually caused by a nicks or imperfect cutting edge. Cutting the
parylene-C film specimen needs to be very careful to prevent nicks or tears at the edge.
With the knowledge of the fracture mechanics, when the loading goes high, the nicks can
induce stress concentration locally and suddenly propagate, becoming a crack causing the
rupture earlier to happen and lead to anomalous results. Specimen with nicks at the edge
will end up with a lower percent elongation at break. In practice, however, micro nicks
are difficult to avoid and tears happen very often during the tests as shown in Figure
5-31. In addition, it is also found that the alignment of the specimen installed in the
testing machine affects the percent of elongation. A proper installation of the specimen
gets rid of unwanted bending stress and thus helpful in getting a more appropriate testing
result.
5.7.2 Deposition pressure influence
To study the deposition pressure influence of parylene-C mechanical properties,
another parylene-C film deposited with pressure at 35 mTorr was also prepared with the
same geometry and then tested under the same testing conditions. The testing data is also
shown in Table 5-12. It is found that all mechanical properties of parylene-C film

214
deposited at 35 mTorr have smaller values compared with parylene-C film deposited at
22 mTorr. It is likely because the parylene-C deposited at higher pressure has a higher
deposition rate and thus more polymerization centers form. It then results in more micro
voids of the parylene-C film deposited at 35 mTorr than 22 mTorr, and thus the
mechanical properties show smaller values. Such kind of parylene-C has more and
shorter polymer chains and therefore cannot organize in order as they can at low
deposition pressures [104]. As aforementioned in Sections 5.5 and 5.6, because
amorphous parylene-C is weaker than crystalline parylene-C, it is reasonable that the
mechanical properties of parylene-C deposited at 35 mTorr are more amorphous and
therefore generally smaller than 22 mTorr.
Figure 5-32 shows the comparison of typical stress-strain curves of parylene-C
film deposited at the pressures with both 35 mTorr and 22 mTorr. It is observed that the
elongation of parylene-C film deposited at 35 mTorr is smaller than at 22 mTorr. It can
also be seen that there is no strain hardening for parylene-C deposited at 35 mTorr. It is
probably because the looser structure or the likely short polymer chain of the parylene-C
film which cause the material easy to be broken, which means less ductility. Although
the parylene-C film deposited at 22 mTorr shows better ductility, the sporadic spread data
points, however, make it still hard to exactly conclude the influence of the deposition
pressure to the percent elongation. The same phenomenon, i.e., widely spread percent of
elongation data points, was also observed by Hassler [104]. One interesting observation
in Hassler’s result shows: in spite of the widely spread data values, Hassler’s parylene-C
film deposited at 20 mTorr has only 20% elongation at break in average, which is much
less than the literature value of 200%, and also our testing value of 119.139%. In

215
addition, it also has been found that a lower strain rate will favor higher elongations and
somewhat lower stress values [235]. Therefore, although Hassler prepared parylene-C
samples with the same thickness as ours, it is shown that Hassler’s strain rate was much
faster than ours (about 1%/sec versus our 1%/min), and thus Hassler had much less
percent of elongation results than ours.
Figure 5-32: Comparison of parylene-C film deposited at different pressures. (a) Two
stress-strain curves. (b) A closer view of elastic modulus and yield point
5.7.3 Oxidation effect
It has been discussed in Section 5.4 that parylene-C can be oxidized either by heat
or ultraviolet (UV) light. To study the influence of the thermal oxidation effect on
parylene-C’s mechanical properties, two different parylene-C film samples are prepared:
one is parylene-C film annealed at 100°C for 1 day in the convection oven, i.e., in the air,
the other one is annealed at the same temperature for the same time but in vacuum. The
0 2 4 60
10
20
30
40
50
60
Nom
inal
Stre
ss (M
Pa)
Strain (%)0 20 40 60 80 100 120 140 160 180
0
10
20
30
40
50
60 Parylene-C film deposited at 35 mTorr. Parylene-C film deposited at 22 mTorr.
Nom
inal
Stre
ss (M
Pa)
Strain (%)
(a) (b)

216
quantitative results are both shown in Table 5-12, and a closer view representing the
strain less than 15% is shown in Figure 5-33.
Figure 5-33: Comparison of uniaxial tensile test results of parylene-C film with three
different treatments: as-deposited, 1 day annealed at 100°C in air, and 1 day annealed in
vacuum
The Young’s modulus of the sample annealed in the air is 4.547 GPa and 4.312
GPa in the vacuum, which are both higher than the as-deposited. This is attributed to the
crystallization of the parylene-C film. Two Young’s modulus do not show an significant
difference as both average numbers fall in the other’s standard deviation range. Two
tensile strengths, or the yield strengths, are obtained as 83.9 MPa in the air and 72.7 MPa
for in vacuum, which are both higher than the as-deposited parylene-C film. The tensile
strength obtained for the samples annealed in the air seems to have consistantly higher
values. It is likely implying that samples annealed in the vacuum system preserve the
0 1 2 3 4 5 6 7 8 9 10 11 12 13 14 150
10
20
30
40
50
60
70
80
90
100
As-Deposited parylene-C (22 mTorr) 1 day annealed at 100oC in air 1 day annealed at 100oC in vacuum
Nom
inal
Stre
ss (M
Pa)
Nominal Strain (%)

217
parylene-C’s mechanical properties. The tensile strength difference, however, is only
within 13%. More tests need to be done to statistically isolate the two groups of results
and confirm this hypothesis.
The percent of elongation of the two samples are both much lower than the as-
deposited sample. Again, the difference between samples annealed in the air and in the
vacuum still cannot be statistically distinguished. Lower percent of elongation infers that
the parylene-C is more brittle. That is, the toughness decreases. This is attributed the
crystallization that happens during the annealing at 100°C. Since two samples were both
annealed at the same temperature for the same time, the crystallinity of the two samples
should be similar and therefore it is reasonable that they had similar percent of
elongations.
In summary, according to the uniaxial tensile test results of the two samples
annealed at 100°C in the air and in vacuum, oxidation seems not to be mainly responsible
for the mechanical properties change of parylene-C, which agrees well with the
conclusion in Section 5.4. The main reason causing the mechanical properties to change
should be the crystallization of the parylene-C, which happens quickly during the
annealing.

218
5.7.4 Annealing temperature and time influence
The influence of the annealing temperature in terms of the mechanical properties
of parylene-C will be discussed in the section. Five different parylene-C samples were
annealed at five different conditions: 100°C for 30 min, one day and two days, and 200°C
for one day and two days. To eliminate the possibility of the oxidation effect, all samples
were annealed in vacuum with the exception of the sample annealed at 100°C for 30 min.
The quantitative results are shown in Table 5-12 and graphical results of the full strain
range are shown in Figure 5-34 with the result of as-deposited parylene-C for
comparison. A closer view of the stress-strain curves within 5% strain is also shown in
Figure 5-35.
Figure 5-34: Comparison of uniaxial tensile test results of parylene-C film with six
different treatments
0 5 10 15 20 25 30 35 400
10
20
30
40
50
60
70
80
90
100
110
As-deposited parylene-C 30 minutes annealed at 100oC in air 1 day annealed at 100oC in vacuum 2 day annealed at 100oC in vacuum 1 day annealed at 200oC in vacuum 2 day annealed at 200oC in vacuum
Nom
inal
Stre
ss (M
Pa)
Nominal Strain (%)
Break
Percent elongation up to 182%
Break
Break

219
Figure 5-35: A closer view of Figure 5-34 (strain lower than 10%)
According to the testing results shown in Figure 5-35, the order of the Young’s
modulus of six parylene-C samples can be found as follows:
6.058 GPa (200°C, 2 days) > 5.298 GPa (100°C, 2 days) > 4.961 GPa (200°C, 1 day) >
4.321 GPa (100°C, 1 day) > 4.251 GPa (100°C, 30 min.) > 3.841 GPa (as-deposited).
It is therefore observed that the Young’s modulus increases as the temperature increases.
Similar effects are also found on tensile strength and the percent of elongation. The order
of the tensile strength is found as:
102.933 MPa (200°C, 2 days) > 92.185 MPa (100°C, 2 days) > 81.659 MPa (200°C, 1 day)
>72.700 MPa (100°C, 1 day) > 74.153 MPa (100°C, 30 min.) > 58.370 MPa (as-deposited).
0 1 2 3 4 5 6 7 8 9 100
10
20
30
40
50
60
70
80
90
100
110
As-deposited parylene-C 30 minutes annealed at 100oC in air 1 day annealed at 100oC in vacuum 2 day annealed at 100oC in vacuum 1 day annealed at 200oC in vacuum 2 day annealed at 100oC in vacuum
Nom
inal
Stre
ss (M
Pa)
Nominal Strain (%)

220
The order of the percent of elongation is found as:
4.512% (200°C, 2 days) < 6.313% (100°C, 2 days) < 6.515% (200°C, 1 day) <
6.897% (100°C, 1 day) < 36.963% (100°C, 30 min.) < 119.139% (as-deposited).
Therefore, the parylene-C stiffness, tensile strength and the toughness (brittleness)
can be tailored by annealing the material at the necessary temperature to achieve the
desired properties. According to what has been found in Section 5.5, it is not surprising
that parylene-C becomes stiffer, stronger and more brittle as either the annealing
temperature or time increase. This is attributed to the occurrence of the parylene-C
crystallization during the thermal annealing which reduces the amorphous part that is in
charge of the polymer chain movement. During the sample preparation, it is found that
parylene-C annealed at 200°C in air became too brittle to handle and mount on to the
testing equipment after the first hour annealing. Therefore there are no data points
obtained to represent the condition of annealing at 200°C in the air. This is in contrast to
the results of parylene-C samples annealed at 200C in the vacuum, which can still be
handled easily and still maintain most mechanical properties. It can be concluded that the
oxidation is a strong effect that can deteriorate the parylene-C film at 200°C. This agrees
well with the conclusion in Section 5.4.
The time constant of the parylene-C crystallization at 100°C has been found to be
less than one minute in Section 5.5.2. It infers that the parylene-C’s mechanical
properties should have experienced a big change during the first few minutes due to the
crystallization. To further confirm this, another three samples were also prepared and
tested to verify the assumption. Those three samples were all annealed at 100°C but for
different times: 30 sec, 1 min and 3 min, which are all much shorter than 30 min. The

221
results are also shown in Table 5-12. It can be seen that the elastic modulus increases
from 3.841 GPa (as-deposited) to 4.339 GPa (30 sec annealing) within only 30 seconds.
The value has already reached the number which normally can be found for 30 minutes
annealing or longer. The elastic modulus does not seem to show any significant
increment for the parylene-C samples annealed at the time longer than 30 sec until 2 days
of annealing. Similarly, the tensile strength increases from 58.37 MPa (as-deposited) to
77.506 MPa (30 sec annealing) after only 30 seconds annealing and shows saturation (or
grows slowly) afterward. Combining what we have found in Section 5.5.2, it is evident
that the parylene-C does crystallize extremely fast with a time constant less than one
minute (0.845 min) and therefore the mechanical properties change fast in the first few
minutes. In addition, from the discussion in Section 5.6, it is also evident that the
crystallization can actually affect the glass transition temperature, and therefore would
hugely change parylene-C’s viscoelastic/viscoplastic properties, as will be discussed later
in Sections 5.8 and 5.9.
5.7.5 Effect of testing environmental temperature
Most of the uniaxial tensile tests discussed in the previous few sections were
performed at room temperature. Because parylene-C is often used in implantable
biomedical devices, the mechanical properties of parylene-C at different temperatures
(especially the human body temperature) needs to be understood as well. In this section,
seven uniaxial tensile tests of the as-deposited parylene-C were performed at seven
different temperatures: 20°C, 40°C, 60°C, 80°C, 100°C, 120°C, and 150°C. The parylene-
C sample were first heated up to the targeted temperature and then annealed for 30
minutes to crystallize and stabilize the mechanical properties. After that, rather than
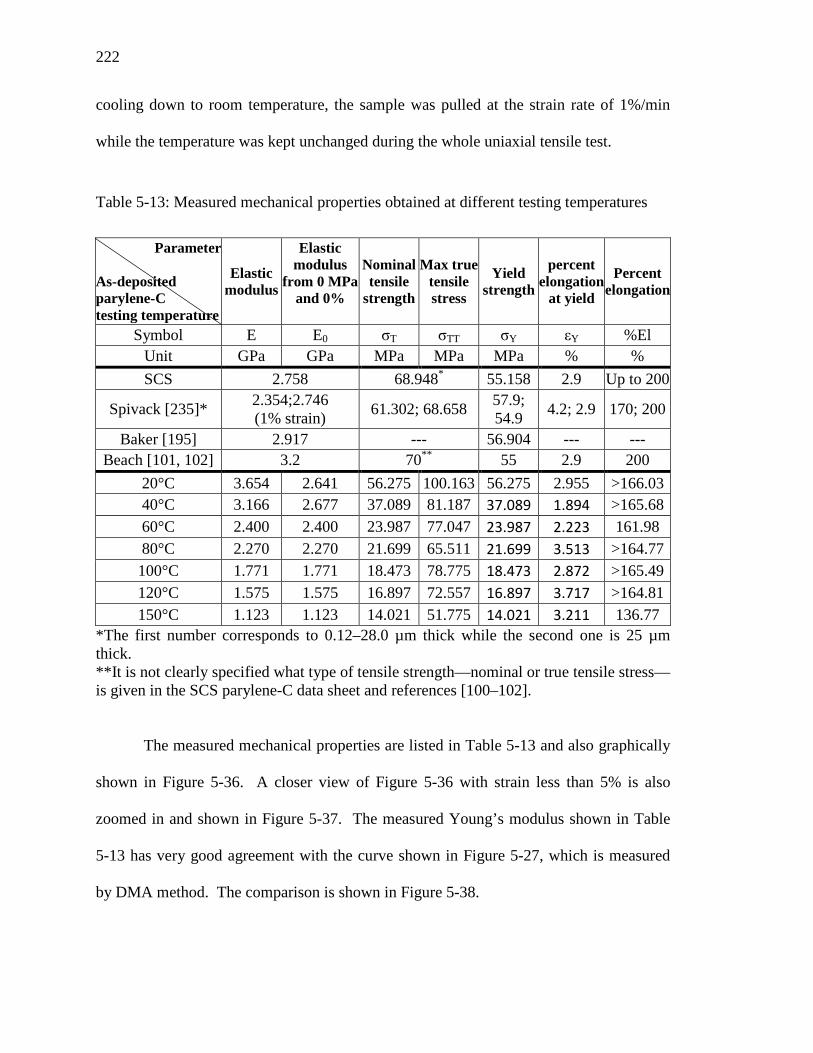
222
cooling down to room temperature, the sample was pulled at the strain rate of 1%/min
while the temperature was kept unchanged during the whole uniaxial tensile test.
Table 5-13: Measured mechanical properties obtained at different testing temperatures
Parameter As-deposited parylene-C testing temperature
Elastic modulus
Elastic modulus
from 0 MPa and 0%
Nominal tensile
strength
Max true tensile stress
Yield strength
percent elongation
at yield
Percent elongation
Symbol E E0 σT σTT σY εY %El Unit GPa GPa MPa MPa MPa % % SCS 2.758 68.948* 55.158 2.9 Up to 200
Spivack [235]* 2.354;2.746 (1% strain) 61.302; 68.658 57.9;
54.9 4.2; 2.9 170; 200
Baker [195] 2.917 --- 56.904 --- --- Beach [101, 102] 3.2 70** 55 2.9 200
20°C 3.654 2.641 56.275 100.163 56.275 2.955 >166.03 40°C 3.166 2.677 37.089 81.187 37.089 1.894 >165.68 60°C 2.400 2.400 23.987 77.047 23.987 2.223 161.98 80°C 2.270 2.270 21.699 65.511 21.699 3.513 >164.77 100°C 1.771 1.771 18.473 78.775 18.473 2.872 >165.49 120°C 1.575 1.575 16.897 72.557 16.897 3.717 >164.81 150°C 1.123 1.123 14.021 51.775 14.021 3.211 136.77
*The first number corresponds to 0.12–28.0 µm thick while the second one is 25 µm thick. **It is not clearly specified what type of tensile strength—nominal or true tensile stress—is given in the SCS parylene-C data sheet and references [100–102].
The measured mechanical properties are listed in Table 5-13 and also graphically
shown in Figure 5-36. A closer view of Figure 5-36 with strain less than 5% is also
zoomed in and shown in Figure 5-37. The measured Young’s modulus shown in Table
5-13 has very good agreement with the curve shown in Figure 5-27, which is measured
by DMA method. The comparison is shown in Figure 5-38.

223
Figure 5-36: A series of uniaxial tensile tests of parylene-C performed at different
environmental temperatures
Figure 5-37: A closer view of Figure 5-36 (strain lower than 5%)
0 20 40 60 80 100 120 140 160 180
05
1015202530354045505560
20oC ; 40oC 60oC ; 80oC 100oC ; 120oC 150oC
Stre
ss (M
Pa)
Strain (%)
0.0 0.5 1.0 1.5 2.0 2.5 3.0 3.5 4.0 4.5 5.00
5
10
15
20
25
30
35
40
45
50
55
60 20oC ; 40oC 60oC ; 80oC 100oC ; 120oC 150oC
Stre
ss (M
Pa)
Strain (%)

224
Figure 5-38: A comparison of elastic modulus measured by DMA (as-deposited curve in
Figure 5-27 in 5.6) and obtained from Table 5-13
It is clearly found from Table 5-13 that the Young’s modulus, tensile strength,
and yield strength all decrease as the testing temperature increases. In addition, parylene-
C tested at the elevated temperature normally shows elongation larger than 160%, except
the one tested at 150°C. Many samples did not break when the machine reached its
clamp displacement limit, meaning the parylene-C molecule can move easily without any
interruption. Although the sample is crystallized, the results imply that the amorphous
part of the material is softened at the elevated temperature. Therefore the parylene-C is
weaker and more ductile when it is tested at the elevated temperatures.
One of the interesting results is found when the parylene-C was stretched at
150°C, which snapped earlier than most other lower temperatures. Although parylene-C
might be expected even softer at 150°C than other temperatures, the phenomenon that
-20 0 20 40 60 80 100 120 140 160 180 200
1
2
3
4
56
Storage modulus measured by DMA Elastic modulus measured by uniaxial
tensile test under different temperatures
Stor
age
(Ela
stic
) Mod
ulus
(GPa
)
Temperature (oC)

225
parylene-C snapped earlier at 150°C is likely due to sample at 150°C as described in the
Section 5.4.
In terms of the yield strength determination, the numbers shown in Table 5-13
still follow the definition in ASTM standard D638-08. However, whether the sample can
restore to its original length under a stress state lower than the yield strength shown in
Table 5-13 is still questionable. A more accurate loading-unloading experiment, which
will be introduced in Section 5.6, needs to be executed to figure out the yield point by
definition: the point that material starts not to behave elastically.
5.7.6 Summary
It is generally believed that parylene-C with higher crystallinity increases the
Young’s modulus and the tensile strength, and lowers the percent of elongation [101].
However, there is still lack of quantitative representation of the statements. In this
section, the uniaxial tensile results quantitatively provide more information about the
relationship between the crystallinity and the mechanical properties. Before every
uniaxial tensile test, the crystallinity is tailored by systematically annealing the parylene-
C samples at different temperatures and time. It is found that the first minute contributes
to most of the change in mechanical. This implies that most sample crystallization has
completed in this short period of annealing time. Higher crystallinity introduces larger
Young’s modulus, larger tensile strength, and less percent of elongation, which
correspond to produce stiffer, stronger and more brittle (less tough) parylene-C. In
addition, it is also found that the oxidation effect is not very obvious when parylene-C is
annealed at 100°C. However, the early snapping of the parylene-C stretched at 150°C
implies the oxidation plays an important role at this temperature.

226
As the annealing temperature influence the crystallinity of the parylene-C and
thus the mechanical properties, Hsu suggested thermal anneal the device at a higher
temperature than the device’s designed operation temperature [201]. This would generate
and maintain stable parylene-C crystallinity throughout the device operation period and
thus the mechanical properties.
Thickness effect has never been discussed in the section. It has been pointed out
by Spivack in 1972 that the uniaxial mechanical properties show very little variation with
thickness [235]. Future work would focus on the time constants of the mechanical
properties change. In addition, the degree of crystallinity may affect the electrical
properties (dielectric loss) and the optical properties (birefringence) [201], which all
needs more studies and attentions before the implantable devices are designed and
fabricated.
5.8 Rheological Properties of Parylene-C Film
It is well know that parylene-C is a thermoplastic material. Like many other
thermoplastic materials such as polypropylene and polycarbonate, it shows
viscoelastic/viscoplastic behaviors, i.e., characteristics with combined elastic and viscous
properties especially beyond glass transition temperature, Tg [236, 237]. In addition, with
its biocompatibility, parylene-C has been widely used for many biomedical implantable
devices [238]. It is then important to study its viscoelasticity/viscoplasticity especially at
human body temperature.
Unfortunately, although many properties, such as Young’s modulus and tensile
strength of parylene-C have been studied [100, 101, 172, 195, 235], there is still a lack of
study of viscoelasticity/viscoplasticity of parylene-C. On the other hand, viscoelastic and

227
vsicoplastic behaviors of a material depend upon many parameters such as temperatures,
loading frequencies, and stress/strain rates. Among various viscoelastic tests, creep and
stress relaxation are two of the most fundamental studies. Creep test, i.e., the tendency of
a solid material to slowly move or deform under the influence of constant stress, is done
as a tensile test that the applied stress is maintained constant while the strain is measured
during the loading. On the other hand, stress relaxation, i.e., the tendency of a solid
material to slowly release the built-in stress under the influence of a constant strain, is
done as a tensile test that the applied strain is maintained constant while the stress is
measured during the strain loading. Creep and stress relaxation tests characterize the
time dependent behavior of a polymer [239].
In this section, a series of creep and stress relaxation tests are performed.
Following previous sections, parylene-C samples annealed at different conditions are
prepared for creep and stress-relaxation experiments.
As aforementioned, parylene-C annealed at different temperatures results in
different crystallinity. Therefore, the creep and stress relaxation tests of parylene-C
annealed at different temperature reveal the rheological response of the parylene-C at
different crystallinity. However, to study the creep behavior of the as-deposited
parylene-C, i.e., creep test without first 30 minutes thermal stabilization to avoid the
crystallization as much as possible, the current DMA Q800 machine will not do the job
due to its inherent limitations of the sample loading design and the temperature ramping
rate. To overcome the problem, another creep experiment was also performed in the pre-
heated convection oven with a transparent observing window.

228
5.8.1 Creep of parylene-C
5.8.1.1 Creep overview
A typical creep test curve measures the total strain (under a constant stress, Figure
5-39 (a)) versus time at a fixed temperature as shown in Figure 5-39 (b). As shown, the
creep curve is traditionally divided into 3 different regions [240]. The primary creep,
also called transient creep, represents the first instantaneous elastic strain and also the
early stage of the creep behavior. In this stage, the main feature is that the strain rate of
the polymer tends to decrease gradually from a very high initial rate. The secondary
creep region, also called steady state region, shows a constant or little changing strain rate
at a fixed temperature. The tertiary creep region shows an expedited or fast growing
strain rate and ends at the material’s rupture. In addition, the creep test is usually
accompanied with a recovery test, i.e., strain recovery after the loading is removed, as
shown in Figures 5-39 (c) and (d). For an ideal thermoset polymer, the total strain
recovers to zero after a certain amount of time, whereas for a thermoplastic polymer, the
strain never goes back to zero and a permanent deformation exists [239]. Creep is of
great interest to us since parylene-C MEMS has to go through various fabrication
processes with elevated temperatures and stresses, although mostly in the primary creep
region. In addition, as the implantable parylene-C bioMEMS devices are being widely
developed, creep behavior is more important to understand than ever. This section
presents the study of the primary and secondary creep of parylene-C film. Burger’s
model is used to analyze the measured data points. Furthermore, the recovery behavior
after the creep test is also performed and analyzed. For the viscoplastic behavior part will
be discussed more in detail in Section 5.9.

229
Figure 5-39: Creep behavior of polymers: (a) constant applied stress during creep test at
a constant temperature; (b) total strain versus time; (c) removal of the stress at the
beginning of the creep recovery test; (d) recovery strain curve
5.8.1.2 Introduction of the Burger’s model
Many physical models have been developed and utilized to quantitatively analyze
and represent the rheological behavior. The Maxwell model and the Kelvin model are
two of the most fundamental ones. A single Maxwell model consists of one linear spring
in series with a dashpot, while a single Kelvin model is composed of one spring in
parallel with a dashpot, as shown as the inserts in Figure 5-40. Both Maxwell element
and Kelvin element are often combined either in parallel or in series to model material’s
rheological behavior. Among all the possible combinations, one Maxwell element with
multiple Kelvin elements in series is widely used for creep modeling due to its simple
form of the differential equations and ease of solution [239]. In this section, it is found
that 4-element Burger’s model, i.e., a Kelvin element in series with a Maxwell element
Stress, σ
σ0
Time, t
Strain, ε
ε0
Time, tt0t0
SecondaryTertiary
Primary
ruptureInstantaneous elastic strain
Instantaneouselastic recovery strain
ΔtΔε
Stress, σσ0
Time, t
Strain, ε
εp Time, tThermoset
Thermoplasticε0
ε0'
Permanent strain
t0t0
(a) (b)
(c) (d)
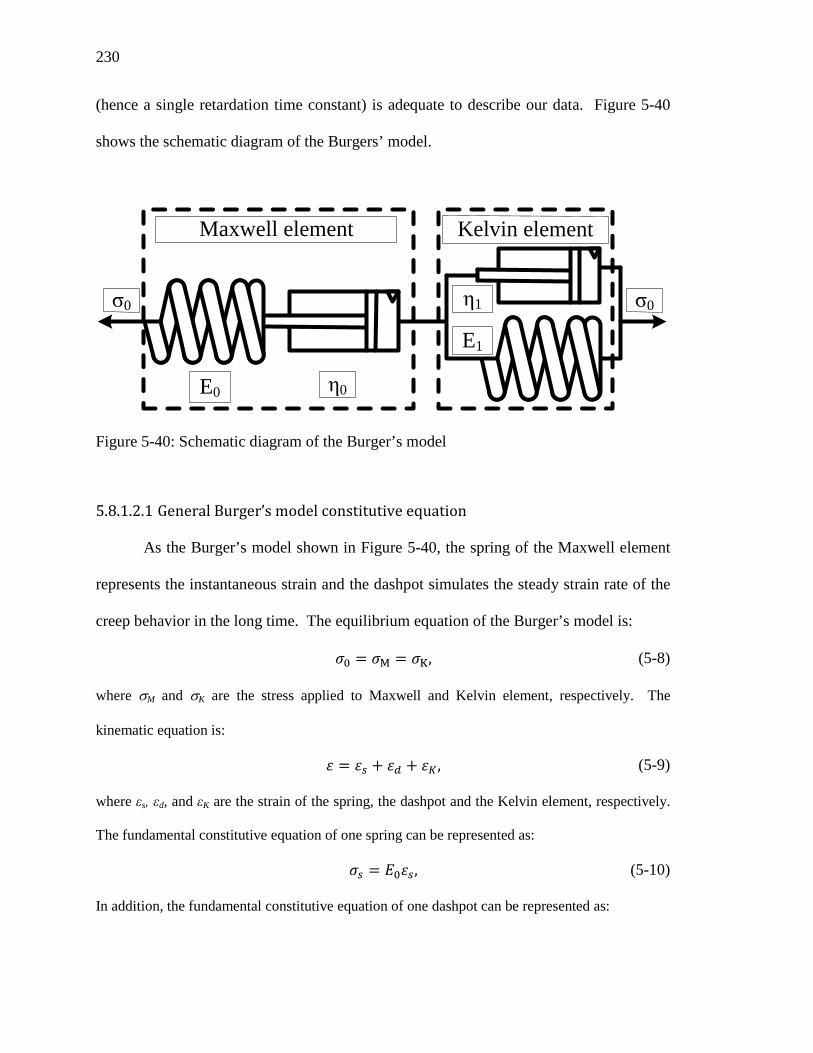
230
(hence a single retardation time constant) is adequate to describe our data. Figure 5-40
shows the schematic diagram of the Burgers’ model.
Figure 5-40: Schematic diagram of the Burger’s model
5.8.1.2.1 General Burger’s model constitutive equation
As the Burger’s model shown in Figure 5-40, the spring of the Maxwell element
represents the instantaneous strain and the dashpot simulates the steady strain rate of the
creep behavior in the long time. The equilibrium equation of the Burger’s model is:
𝜎0 = 𝜎M = 𝜎K, (5-8)
where σM and σK are the stress applied to Maxwell and Kelvin element, respectively. The
kinematic equation is:
𝜀 = 𝜀𝑠 + 𝜀𝑑 + 𝜀𝐾, (5-9)
where εs, εd, and εK are the strain of the spring, the dashpot and the Kelvin element, respectively.
The fundamental constitutive equation of one spring can be represented as:
𝜎𝑠 = 𝐸0𝜀𝑠, (5-10)
In addition, the fundamental constitutive equation of one dashpot can be represented as:
E0
E1
η1σ0
η0
σ0
Maxwell element Kelvin element
231
𝜎𝑑 = 𝜂0
𝑑𝑑𝑡𝜀𝑑, (5-11)
where 𝜂0 is called the viscosity of the dashpot. Combining eqns. (5-8), (5-9), (5-10), and
(5-11), the constitutive equations of the Burger’s model can be represented as:
𝜎0 + �𝜂0𝐸0
+𝜂0𝐸1
+𝜂1𝐸1� 𝜎0̇ +
𝜂0𝜂1𝐸0𝐸1
𝜎0̈ = 𝜂0𝜀̇ +𝜂0𝜂1𝐸1
𝜀̈. (5-12)
5.8.1.2.2 Solution for creep behavior
The Burger’s model can be fit to different rheological situation. To fit the creep
results, given the initial condition as 𝜎 = 𝜎0𝐻(𝑡), where H(t) is the Heavyside function
defined as:
𝐻(t) = �1, for 𝑡 ≥ 0 0, for 𝑡 < 0, (5-13)
the solution of the strain of the model can be derived as
𝜀(𝑡) = 𝜎0 �
1𝐸0
+1𝐸1�1 − 𝑒
−𝑡 𝜏1� �+𝑡𝜂0�. (5-14)
where 𝜏1 = 𝜂1/𝐸1is called the retardation time constant. The creep compliance is
obtained as
𝐷(𝑡) =
1𝐸0
+1𝐸1�1 − 𝑒
−𝑡 𝜏1� �+𝑡𝜂0
. (5-15)
5.8.1.2.3 Solution for creep recovery behavior
To model the strain behavior of creep recovery after the applied stress is
unloaded, the initial strain ε(t0) is set to be 𝜀(𝑡0) = 𝜀(𝑡0)𝐻(𝑡0 − 𝑡) in eqn. (5-12), where
t0 is the starting point of the removal of the stress. The stress then can be derived as
𝜀(𝑡) = 𝑃1 + 𝑃2 exp �−
(𝑡 − 𝑡0)𝜏𝑟
�. (5-16)

232
where the time constant 𝜏𝑟 = 𝐸1𝜂1
, P1 and P2 are material dependents.
5.8.1.3 Primary and secondary creep of parylene-C
5.8.1.3.1 Sample preparation and the experiments
Parylene-C film was deposited using an SCS (Specialty Coating Systems)
parylene deposition machine (i.e., PDS 2010 LABCOTER). The film was coated onto
the surface a flat mask glass plate. The parylene-C film was then cut into uniform 5.3
mm wide strips. The length of each testing sample was 15 ± 0.05 mm for the creep test.
The tests were done by a dynamic mechanical analyzer, TA instruments DMA Q800.
Similar to the previous Section 5.7, eight different parylene-C samples were treated
differently by annealing in different conditions to study the oxidation effect, temperature
effect, deposition pressure effect, and also annealing time effect. As it has been found in
Section 5.6 that the glass transition temperature of the as-deposited parylene-C is about
50°C, 25°C was chosen for tests of creep behavior below Tg; 40°C, and 60°C were chosen
to be around Tg, and 80°C, 100°C, 120°C, and 150°C were chosen to be above Tg.
Before the creep test started, the testing chamber was first heated up with the
parylene-C sample mounted and then waited for 30 minutes to ensure that the whole
system reaches thermal equilibrium with our targeted temperature, as graphically shown
in Figure 5-41 (a). Then, a constant stress of 2.43MPa was applied onto the sample for
120 minutes, while the total strain is measured. To observe the recovery behavior of the
sample, the stress was then removed and the total strain was continuously recorded for
another 60 minutes.

233
5.8.1.3.2 Results and discussion
As a whole, the results of the creep test and the recovery of eight different pre-
treated parylene-C are shown in Figure 5-41 (a) to Figure 5-48 (a). Each figure includes
seven curves representing different testing temperatures. Besides, the Burger’s model
curve fitting results of the creep and recovery are also shown in Table 5-14 to Table 5-21.
From these eight figures and tables, several observations and conclusions can be made:
1. It is noted from all figures that there is always little or no primary creep at the
temperature lower than the glass transition temperature. For example, from the
creep results of as-deposited parylene-C deposited at 35 mTorr shown in Figure
5-42 (a) (one extra curve was performed at 10°C), it can be found that 10° and
25°C, which are significantly below the glass transition temperature (55.1°C in
Table 5-11) show no or very little creep. Figure 5-42 (a) further validated that the
total strain obtained at 10°C is similar to that at 25°C because the Young’s
moduli at 10°C and 25 °C are very close to each other. In addition, there is very
little or no permanent strain found after the recovery, meaning that the paryelne-C
is in the elastic regime. The second example would focus on the creep results of
the parylene-C annealed at 100°C for one day in vacuum as shown Figure 5-45
(a). Tg of this parylene-C sample is found as 113.1°C from Table 5-11. It is
observed from Figure 5-45 (a) that there is also no or very little creep found at 25,
40, 60 and 80°C, which are all far below the Tg. Most of the strain remaining
measured after the creep tests at these temperatures are also hard to identify. The
third example would be aimed at the creep results of parylene-C annealed at
200°C for one day in vacuum as shown in Figure 5-47 (a). As also obtained from

234
Table 5-11, Tg of this parylene-C cannot be figured out by the experiments as
described in Section 5.6. In one of our conclusions in 5.6.3, the measured Tg is
found to be always a bit higher than the annealing temperature according to the
observed experimental trend of Tg. Therefore the Tg would be expected as higher
than 200°C in this parylene-C sample. Therefore, the creep results shown in
Figure 5-47 (a) would not be surprising as all seven creep testing temperatures are
far lower than 200°C. Consequently this parylene-C behaves like elastic material
even at 150°C and thus very little creep is found in the experiment. In addition,
also very little permanent strain is found after the recovery.
2. When the creep test started at t=t0=30 minutes, the applied stress suddenly loaded
onto the sample and it is shown in eight figures that an instantaneous elastic
deformation happens. According to the results, the higher temperature produced
the larger instantaneous elastic strain under constant stress. This is explained by
the smaller Young’s modulus at higher temperature, which agrees well with what
we found from our ramping-temperature-dependent modulus experiment and
DMA tests shown in Section 5.6. These instantaneous strains at different
temperatures were used to calculate the corresponding Young’s moduli and the
results are shown in the first column of the creep results in Table 5-14 to Table
5-21. It is found that Young’s modulus determined at the starting point of the
creep test in this section usually differs a bit than what we got from the ramping-
temperature-dependent modulus experiment or DMA method. It is likely because
of three possible reasons. The first reason would be the thickness variation which
inherently comes from the parylene-C deposition. The second reason could be the

235
thermal history difference. In the DMA method in Section 5.6, the sample is
always tested under the oscillatory force at the testing temperature. In this
section, however, the Young’s modulus is obtained after 30 minutes of annealing.
As discussed in Section 5.5, parylene-C might have gone through a long period of
crystallization and hence the mechanical properties could be different. The third
reason might be the testing strain rate difference. Compared to 1Hz as the
oscillation frequency in Section 5.6.1.3, the strain rate at the starting point of the
creep test is high enough to cause the strain-rate effect in parylene-C [223]: higher
strain rate would introduce higher Young’s modulus. Combining these three
effects, the measured Young’s modulus could sometimes either higher or lower
than in Section 5.6. Even though, the values are always very close to each other,
and also, the descending trend with respect to the temperature still exists.
3. The Young’s modulus at t=t0+120=150 min is found using the elastic recovery
strain at the time when the applied stress is removed. The results are shown in the
first column of the recovery in Table 5-14 to Table 5-21. It can be first seen that
with temperatures around or higher than the glass transition temperature, the
Young’s modulus gets higher after it has being stretched at the constant
temperature for 120 minutes. It is also obvious that at temperatures much higher
than Tg, the increment can be even more serious. According to what has been
demonstrated in the previous few sections, this effect is likely mainly attributed to
the crystallization of the parylene-C. In addition, the similar effect can also be
found at the temperature lower than Tg, although that as significant as at the
temperature higher than Tg. It could be concluded that the pure stretching of the

236
parylene-C would also increase the Young’s modulus either by inducing the
crystallization or aligning the polymer chain under the tension force.
4. The primary creep is significant and increases with temperature. The further
analysis of the creep needs the help of Burger’s model. All creep and the
recovery results were curve fitted to the Burger’s model, and the results are shown
in Table 5-14 to Table 5-21. According to the obtained correlation coefficient,
R2, the Burger’s model explains well with our data whenever the testing
temperature is higher than Tg. However, although Burger’s model can also be
forced to fit with the data lower than Tg, the physical model loses its physical
sense because parylene-C showed little or no creep below Tg. This can be
verified by the lower correlation coefficients (R2<0.99) of every creep experiment
performed at the temperature lower than Tg. These data are shaded with grey
background in the tables. As a result, except at the temperature lower than Tg, it
is shown that the retardation time constant, τ1, decreases with the temperature.
Because τ1 are found to be approximately 6–10 minutes at temperatures higher
than Tg no matter what type annealing history of the samples, it is evident that
120 minutes is long enough to make the creep go into secondary region, and the
creep strain rates have already reached a steady state, which is shown in Figure
5-41 (a) to Figure 5-48 (a). The steady state slopes, 𝜎0𝜂0
, of the creep curves at the
temperature higher than Tg increase slightly when creep temperature goes up.
Both trends of τ1 and 𝜎0𝜂0
show that parylene-C creeps more at higher temperature
when the temperature is higher than Tg. The phenomenon demonstrates the
viscoelastic/viscoplastic behavior of the parylene-C. On the other hand, the creep

237
performed at the temperature lower than Tg, shows little creep and proves that
parylene-C is in the glassy region and thus behaves elastically. Young’s modulus
of the spring of the Kelvin’s element, i.e. E1, can be calculated from 𝜎0𝐸1
given
σ0=2.43MPa. E1 are also generally found to decrease as the testing temperature
going up, which is similar to E0.
5. By comparing the creep results of Figure 5-44 (a) (parylene-C pre-annealed at
100°C one day in the air) and Figure 5-45 (a) (parylene-C pre-annealed at 100°C
one day in the vacuum), the results show that creep strain of the samples pre-
annealed in vacuum has no distinguishable difference to in the air. It infers again
that, even after one day of annealing at 100°C in the air, the oxidation has very
little effect on parylene-C, which agrees well with the conclusion obtained in
Section 5.4. Although the oxidation effect is very little for parylene-C annealed at
100°C in the air, it would be still worthwhile repeating the same creep tests with
more parylene-C samples annealed at 100°C but for longer annealing time, such
as more than 13 days as predicted in Section 5.4.3.
6. The crystallization effect can be investigated by the creep results as well. By
comparing the Figure 5-43 (a) (parylene-C pre-annealed at 100°C 30 min. in the
air), Figure 5-45 (a) (parylene-C pre-annealed at 100°C one day in the vacuum),
and Figure 5-46 (a) (parylene-C pre-annealed at 100°C two days in the vacuum),
it is found that the creep curve of 150°C has a lower total strain after 2 days of
annealing. In addition, the parylene-C pre-annealed at 100°C for 30 minutes has
very little creep difference to two day annealing in terms of the creep
temperatures lower than the Tg. This implies that the crystallization is mostly

238
done in the first 30 minutes annealing, which has been verified many times in the
previous Sections 5.5.2, 5.6.1.3, and 5.7.4. In contrast to the results of 100°C,
however, from Figure 5-47 (a) (parylene-C pre-annealed at 200°C one day in the
vacuum) and Figure 5-48 (a) (parylene-C pre-annealed at 200°C two days in the
vacuum), it can be found that Figure 5-48 (a) generally has a smaller total creep
strain than Figure 5-47 (a). It can be explained as the stronger crystallization at
200°C than 100°C. The elastic behavior of the creep results of the parylene-C
pre-annealed at 200°C implies that crystallility is much higher than annealed at
100°C.
7. Burger’s model also works for the recovery region and the curve fitting results are
shown in Table 5-14 to Table 5-21. The retardation time constants are generally
larger than those measured from the creep, meaning the recovering behavior
progresses slower than the creep. As the time constants of the recovery found
from Table 5-14 to Table 5-21 are generally about 10–15 minutes, it can be
concluded that 60 minutes recovery time is long enough to decide whether the
stain is recovered after the creep or not. As shown in Figure 5-41 (a) to Figure
5-46 (a), a clear permanent strain is generally observed at the testing temperature
higher than each corresponding Tg. The permanent remaining strain under the
stress of 2.43 MPa implies that parylene-C has gone into plastic region at the
testing temperature. It can be seen that the permanent strain is higher when the
testing temperature is higher. This would imply that the yield strength is lower as
the testing temperature increases, and hence parylene-C deforms more at higher
temperature under the same loading.

239
8. The permanent strain phenomenon after the creep test has been observed by many
previous researchers. Many models have been proposed to analyze and predict
this irreversible strain. One of the most commonly used models is combine the
creep behavior before the recovery, and model the recovery behavior as well as
predicting the irreversible strain by powers law. The system constitutive model
can be represented as [241–251]:
εc = ε0 + 𝑘𝜎0�𝐶𝑚 �1 − 𝑒𝑥𝑝 �−
𝑡𝑎𝜎𝜏𝑚
��𝑚
+ εpl(𝑡,𝜎0), (5-17)
9. where εc is the total strain of the material, ε0 is the elastic strain, k is the stress
invariant dependent material property, σ0 is the applied stress, Cm are constants,
aσ is the stress dependent time-scale factor, which is a function of stress,
temperature and also humidity, and εpl is the viscoplastic strain. The term
𝑘𝜎0 ∑ 𝐶𝑚 �1 − exp �1 − 𝑡𝑎𝜎𝜏𝑚
��𝑚 in eqn. (5-17) actually represents the
generalized Kelvin model, which consists of m series of multiple springs and
dashpots in parallel. The viscoplastic strain εpl accumulated in the time period t1
can also be further modeled by powers law as [242]:
εpl(𝑡1,𝜎0) = 𝐶𝑝𝑙𝜎𝑀∗𝑚𝑡1𝑚, (5-18)
where Cpl, M, and m must be determined experimentally. It is clearly that the
term 𝐶𝑝𝑙𝜎𝑀∗𝑚 would depend on the stress level, and also the testing temperatures.

240
Figure 5-41 (a): Creep results of the as-deposited parylene-C deposited at 22 mTorr
(Tg=53.4°C); (b): Stress relaxation results of the as-deposited parylene-C deposited at 22
mTorr (Tg=53.4°C)
024 30 45 60 75 90 105 120 135 150 165 180 195 210 225-0.2
-0.1
0.0
0.1
0.2
0.3
0.4
0.5
0.6
0.7
0.8
0.9
1.0
Applied Stress
Applied Constant Stress=2.43MPa
25oC
40oC60oCSt
rain
(%)
Time (min)
80oC100oC120oC150oC
(recovery starts)(creep starts)
-0.2
-0.1
0.0
0.1
0.2
0.3
0.4
0.5
0.6
0.7
0.8
0.9
1.0
Stra
in (%
)
024 30 45 60 75 90 105 120 135 150 165 180-505
1015202530354045505560
Stre
ss (%
)
Time (min)
25oC
40oC80oC60oC
120oC100oC150oC
-5051015202530354045505560
Stre
ss (%
)
Applied Constant Strain= 1%
(a)
(b)

241
Table 5-14: Burger’s model curve fitting results of the creep and stress relaxation
behaviors of as-deposited parylene-C deposited at 22 mTorr (Tg=53.4°C)
Fitting Results of Parylene-C Creep Behavior
Temperature (°C) E0(t0) (GPa)
𝝈𝟎𝑬𝟎� + 𝝈𝟎
𝑬𝟏� 𝝈𝟎 𝜼𝟎� −𝝈𝟎 𝑬𝟏� 𝝉𝟏 R2
150 0.947 0.586 0.00220 -0.296 7.342 0.992
120 0.918 0.504 0.00167 -0.214 7.334 0.992
100 1.296 0.414 0.00152 -0.203 7.269 0.992
80 1.564 0.362 0.00139 -0.184 7.386 0.992
60 1.615 0.323 0.00116 -0.157 9.472 0.994
40 1.678 0.219 0.00078 -0.068 10.248 0.995
25 2.613 0.103 0.00009 -0.007 4.924 0.976
Fitting Results of Parylene-C Creep Recovery Behavior
Temperature (°C) E0(t0+120) (GPa) P1 P2 τr R2
150 1.325 0.473 0.158 12.708 0.966
120 1.511 0.388 0.127 12.081 0.967
100 1.861 0.327 0.112 12.041 0.966
80 2.294 0.290 0.108 12.657 0.966
60 2.796 0.261 0.097 16.108 0.975
40 3.095 0.147 0.077 18.266 0.979
25 2.967 0.011 0.016 8.462 0.947
Fitting Results of Parylene-C Stress Relaxation Behavior
Temperature (°C) E0(t0) (GPa) A1 τsr1 A2 τsr2 R2
150 0.665 3.450 2.019 2.825 145.960 0.980
120 1.130 5.777 1.800 4.680 130.381 0.978
100 1.379 7.254 1.707 5.549 119.458 0.978
80 1.736 9.759 1.394 6.435 106.734 0.977
60 2.304 13.565 1.294 7.898 82.967 0.977
40 3.279 14.052 4.059 17.038 102.074 0.991
25 3.438 5.106 3.350 28.136 404.606 0.985

242
Figure 5-42 (a): Creep results of the as-deposited parylene-C deposited at 35 mTorr
(Tg=55.1°C); (b): Stress relaxation results of the as-deposited parylene-C deposited at 35
mTorr (Tg=55.1°C)
024 30 45 60 75 90 105 120 135 150 165 180 195 210 225-0.2-0.10.00.10.20.30.40.50.60.70.80.91.01.11.2
40oC
60oC80oC
Stra
in (%
)
Time (min)
10oC ; 25oC
100oC120oC
150oC
-0.2-0.10.00.10.20.30.40.50.60.70.80.91.01.11.2
Stra
in (%
)
024 30 45 60 75 90 105 120 135 150 165 180
05
1015202530354045505560
Stre
ss (M
Pa)
Time (min)
25oC
40oC80oC60oC
120oC100oC
150oC051015202530354045505560
Stre
ss (M
Pa)
(a)
(b)

243
Table 5-15: Burger’s model curve fitting results of the creep and stress relaxation
behaviors of as-deposited parylene-C deposited at 35 mTorr (Tg=55.1°C)
Fitting Results of Parylene-C Creep Behavior
Temperature (°C) E0(t0) (GPa)
𝝈𝟎𝑬𝟎� + 𝝈𝟎
𝑬𝟏� 𝝈𝟎 𝜼𝟎� −𝝈𝟎 𝑬𝟏� 𝝉𝟏 R2
150 0.725 0.878 0.00228 -0.492 7.393 0.992
120 0.795 0.696 0.00270 -0.349 7.964 0.993
100 0.984 0.626 0.00259 -0.338 7.518 0.992
80 0.896 0.591 0.00227 -0.284 7.445 0.992
60 1.380 0.459 0.00193 -0.259 10.816 0.995
40 2.224 0.176 0.00134 -0.059 10.902 0.997
25 2.864 0.096 0.00009 -0.009 4.459 0.983
Fitting Results of Parylene-C Creep Recovery Behavior
Temperature (°C) E0(t0+120) (GPa) P1 P2 τr R2
150 0.876 0.548 0.274 15.733 0.971
120 1.064 0.578 0.169 11.119 0.963
100 1.289 0.545 0.160 10.939 0.960
80 1.551 0.494 0.170 11.193 0.960
60 2.011 0.409 0.136 13.842 0.971
40 2.380 0.134 0.088 16.090 0.975
25 2.896 0.009 0.011 4.936 0.935
Fitting Results of Parylene-C Stress Relaxation Behavior
Temperature (°C) E0(t0) (GPa) A1 τsr1 A2 τsr2 R2
150 0.677 3.579 1.749 2.772 763.768 0.973
120 0.475 2.431 2.033 2.033 137.666 0.980
100 0.721 3.667 1.836 2.979 120.930 0.977
80 1.198 6.603 1.327 4.540 96.500 0.975
60 1.505 8.869 1.391 5.262 78.642 0.979
40 2.297 5.910 4.724 16.209 122.341 0.994
25 2.744 2.479 1.546 24.506 826.375 0.977

244
Figure 5-43 (a): Creep results of the parylene-C annealed at 100°C for 30 minutes in the
convection oven (Tg=108.2°C); (b): Stress relaxation results of the parylene-C annealed
at 100°C for 30 minutes in the convection oven (Tg=108.2°C)
024 30 45 60 75 90 105 120 135 150 165 180 195 210 225-0.2
0.0
0.2
0.4
0.6
0.8
1.0St
rain
(%)
Time (min)
25oC ; 40oC 60oC ; 80oC
100oC120oC
150oC
-0.2
0.0
0.2
0.4
0.6
0.8
1.0
Stra
in (%
)
024 30 45 60 75 90 105 120 135 150 165 180-505
1015202530354045505560
Stre
ss (M
Pa)
Time (min)
25oC
40oC
80oC
60oC
120oC100oC
150oC-5051015202530354045505560
Stre
ss (M
Pa)
(a)
(b)

245
Table 5-16: Burger’s model curve fitting results of the creep and stress relaxation
behaviors of parylene-C annealed at 100°C for 30 minutes in the convection oven
(Tg=108.2°C)
Fitting Results of Parylene-C Creep Behavior
Temperature (°C) E0(t0) (GPa)
𝝈𝟎𝑬𝟎� + 𝝈𝟎
𝑬𝟏� 𝝈𝟎 𝜼𝟎� −𝝈𝟎 𝑬𝟏� 𝝉𝟏 R2
150 0.905 0.662 0.00266 -0.355 6.721 0.993 120 0.873 0.552 0.00175 -0.245 7.401 0.992 100 1.076 0.471 0.00168 -0.218 7.136 0.992 80 1.249 0.270 0.00059 -0.064 4.330 0.986 60 1.721 0.176 0.00016 -0.030 3.604 0.982 40 2.499 0.116 0.00014 -0.015 4.007 0.983 25 2.701 0.095 0.00005 -0.004 0.587 0.906
Fitting Results of Parylene-C Creep Recovery Behavior
Temperature (°C) E0(t0+120) (GPa) P1 P2 τr R2
150 1.212 0.568 0.172 12.445 0.966 120 1.381 0.422 0.133 11.599 0.966 100 1.618 0.363 0.129 12.164 0.964 80 1.953 0.107 0.090 10.837 0.956 60 2.323 0.043 0.038 7.222 0.945 40 2.642 0.012 0.021 5.470 0.933 25 3.070 0.008 0.012 3.180 0.929
Fitting Results of Parylene-C Stress Relaxation Behavior
Temperature (°C) E0(t0) (GPa) A1 τsr1 A2 τsr2 R2
150 0.827 4.217 1.888 3.540 127.971 0.980 120 0.998 5.204 1.768 4.136 125.010 0.979 100 1.206 6.180 1.712 5.011 126.250 0.977 80 2.202 7.515 1.905 13.185 212.748 0.978 60 3.281 7.989 1.775 23.459 494.229 0.974 40 3.824 6.942 2.259 29.976 683.368 0.975 25 4.456 6.067 1.905 37.400 843.503 0.975

246
Figure 5-44 (a): Creep results of the parylene-C annealed at 100°C for 1 day in the
convection oven (Tg=111.8°C); (b): Stress relaxation results of the parylene-C annealed
at 100°C for 1 day in the convection oven (Tg=111.8°C)
024 30 45 60 75 90 105 120 135 150 165 180 195 210 225-0.2
-0.1
0.0
0.1
0.2
0.3
0.4
0.5
0.6
0.7
0.8
0.9
1.0St
rain
(%)
Time (min)
100oC
25oC ; 40oC 60oC ; 80oC
120oC150oC
-0.2
-0.1
0.0
0.1
0.2
0.3
0.4
0.5
0.6
0.7
0.8
0.9
1.0
Stra
in (%
)
024 30 45 60 75 90 105 120 135 150 165 180-505
1015202530354045505560
Stre
ss (M
Pa)
Time (min)
25oC
40oC
80oC60oC
120oC100oC
150oC-5051015202530354045505560
Stre
ss (M
Pa)
(a)
(b)

247
Table 5-17: Burger’s model curve fitting results of the creep and stress relaxation
behaviors of the parylene-C annealed at 100°C for 1 day in the convection oven
(Tg=111.8°C)
Fitting Results of Parylene-C Creep Behavior
Temperature (°C) E0(t0) (GPa)
𝝈𝟎𝑬𝟎� + 𝝈𝟎
𝑬𝟏� 𝝈𝟎 𝜼𝟎� −𝝈𝟎 𝑬𝟏� 𝝉𝟏 R2
150 0.560 0.700 0.00164 -0.241 7.003 0.993 120 0.584 0.622 0.00137 -0.185 7.259 0.993 100 1.663 0.257 0.00103 -0.096 7.442 0.992 80 1.957 0.144 0.00009 -0.016 2.394 0.968 60 2.322 0.124 0.00005 -0.016 3.108 0.975 40 2.406 0.112 0.00006 -0.010 3.040 0.984 25 4.493 0.058 0.00004 -0.003 0.201 0.846
Fitting Results of Parylene-C Creep Recovery Behavior
Temperature (°C) E0(t0+120) (GPa) P1 P2 τr R2
150 1.487 0.548 0.154 13.031 0.969 120 1.853 0.505 0.124 13.244 0.969 100 2.395 0.183 0.078 11.773 0.961 80 2.478 0.022 0.028 4.806 0.930 60 2.885 0.016 0.023 5.188 0.940 40 2.779 0.011 0.016 5.107 0.936 25 4.980 0.004 0.008 4.058 0.939
Fitting Results of Parylene-C Stress Relaxation Behavior
Temperature (°C) E0(t0) (GPa) A1 τsr1 A2 τsr2 R2
150 0.932 4.925 1.647 3.740 126.344 0.978 120 1.386 7.334 1.813 5.617 123.350 0.980 100 1.624 6.969 2.435 7.985 123.436 0.981 80 2.010 3.870 1.701 15.492 543.957 0.973 60 2.283 4.186 1.372 17.838 868.723 0.964 40 2.847 4.386 2.175 23.300 907.844 0.973 25 4.472 5.457 1.786 38.130 1005.754 0.971

248
Figure 5-45 (a): Creep results of the parylene-C annealed at 100°C for 1 day in the
vacuum oven (Tg=113.1°C); (b): Stress relaxation results of the parylene-C annealed at
100°C for 1 day in the vacuum oven (Tg=113.1°C)
024 30 45 60 75 90 105 120 135 150 165 180 195 210 225-0.2
-0.1
0.0
0.1
0.2
0.3
0.4
0.5
0.6
0.7
0.8
0.9
1.0St
rain
(%)
Time (min)
100oC
25oC ; 40oC 60oC ; 80oC
120oC150oC
-0.2
-0.1
0.0
0.1
0.2
0.3
0.4
0.5
0.6
0.7
0.8
0.9
1.0
Stra
in (%
)
024 30 45 60 75 90 105 120 135 150 165 180-505
1015202530354045505560
Stre
ss (M
Pa)
Time (min)
25oC
40oC
80oC
60oC
120oC100oC
150oC-5051015202530354045505560
Stre
ss (M
Pa)
(a)
(b)
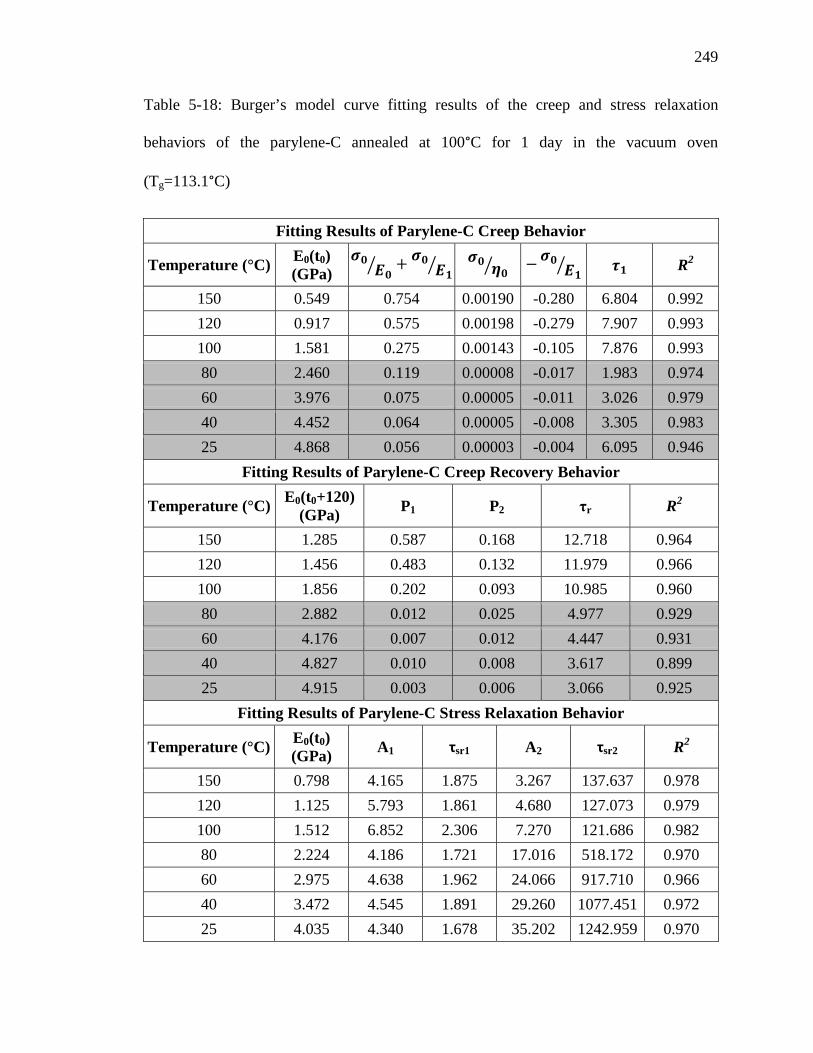
249
Table 5-18: Burger’s model curve fitting results of the creep and stress relaxation
behaviors of the parylene-C annealed at 100°C for 1 day in the vacuum oven
(Tg=113.1°C)
Fitting Results of Parylene-C Creep Behavior
Temperature (°C) E0(t0) (GPa)
𝝈𝟎𝑬𝟎� + 𝝈𝟎
𝑬𝟏� 𝝈𝟎 𝜼𝟎� −𝝈𝟎 𝑬𝟏� 𝝉𝟏 R2
150 0.549 0.754 0.00190 -0.280 6.804 0.992 120 0.917 0.575 0.00198 -0.279 7.907 0.993 100 1.581 0.275 0.00143 -0.105 7.876 0.993 80 2.460 0.119 0.00008 -0.017 1.983 0.974 60 3.976 0.075 0.00005 -0.011 3.026 0.979 40 4.452 0.064 0.00005 -0.008 3.305 0.983 25 4.868 0.056 0.00003 -0.004 6.095 0.946
Fitting Results of Parylene-C Creep Recovery Behavior
Temperature (°C) E0(t0+120) (GPa) P1 P2 τr R2
150 1.285 0.587 0.168 12.718 0.964 120 1.456 0.483 0.132 11.979 0.966 100 1.856 0.202 0.093 10.985 0.960 80 2.882 0.012 0.025 4.977 0.929 60 4.176 0.007 0.012 4.447 0.931 40 4.827 0.010 0.008 3.617 0.899 25 4.915 0.003 0.006 3.066 0.925
Fitting Results of Parylene-C Stress Relaxation Behavior
Temperature (°C) E0(t0) (GPa) A1 τsr1 A2 τsr2 R2
150 0.798 4.165 1.875 3.267 137.637 0.978 120 1.125 5.793 1.861 4.680 127.073 0.979 100 1.512 6.852 2.306 7.270 121.686 0.982 80 2.224 4.186 1.721 17.016 518.172 0.970 60 2.975 4.638 1.962 24.066 917.710 0.966 40 3.472 4.545 1.891 29.260 1077.451 0.972 25 4.035 4.340 1.678 35.202 1242.959 0.970

250
Figure 5-46 (a): Creep results of the parylene-C annealed at 100°C for 2 days in the
vacuum oven (Tg=115.2°C); (b): Stress relaxation results of the parylene-C annealed at
100°C for 2 days in the vacuum oven (Tg=115.2°C)
024 30 45 60 75 90 105 120 135 150 165 180 195 210 225-0.2
-0.1
0.0
0.1
0.2
0.3
0.4
0.5
0.6
0.7
0.8
0.9
1.0St
rain
(%)
Time (min)
25oC ; 40oC 60oC ; 80oC
100oC
120oC150oC
-0.2
-0.1
0.0
0.1
0.2
0.3
0.4
0.5
0.6
0.7
0.8
0.9
1.0
Stra
in (%
)
024 30 45 60 75 90 105 120 135 150 165 180-505
1015202530354045505560
Stre
ss (M
Pa)
Time (min)
25oC40oC
80oC
60oC
120oC100oC150oC
-5051015202530354045505560
Stre
ss (M
Pa)
(a)
(b)

251
Table 5-19: Burger’s model curve fitting results of the creep and stress relaxation
behaviors of the parylene-C annealed at 100°C for 2 days in the vacuum oven
(Tg=115.2°C)
Fitting Results of Parylene-C Creep Behavior
Temperature (°C) E0(t0) (GPa)
𝝈𝟎𝑬𝟎� + 𝝈𝟎
𝑬𝟏� 𝝈𝟎 𝜼𝟎� −𝝈𝟎 𝑬𝟏� 𝝉𝟏 R2
150 0.638 0.637 0.00160 -0.229 6.647 0.992 120 0.686 0.549 0.00133 -0.175 6.535 0.992 100 1.352 0.267 0.00101 -0.074 6.695 0.992 80 1.465 0.187 0.00008 -0.017 2.058 0.967 60 2.876 0.102 0.00006 -0.014 3.760 0.976 40 2.978 0.091 0.00008 -0.008 2.624 0.984 25 3.407 0.076 0.00003 -0.005 0.241 0.900
Fitting Results of Parylene-C Creep Recovery Behavior
Temperature (°C) E0(t0+120) (GPa) P1 P2 τr R2
150 1.455 0.482 0.149 12.553 0.967 120 1.662 0.413 0.123 12.596 0.967 100 2.216 0.175 0.084 11.763 0.961 80 1.846 0.023 0.032 4.598 0.930 60 3.249 0.016 0.014 3.669 0.929 40 3.309 0.012 0.011 2.919 0.938 25 3.821 0.006 0.008 2.744 0.921
Fitting Results of Parylene-C Stress Relaxation Behavior
Temperature (°C) E0(t0) (GPa) A1 τsr1 A2 τsr2 R2
150 0.511 2.654 2.111 2.208 164.820 0.979 120 1.382 7.294 1.789 5.635 123.023 0.980 100 2.099 8.433 2.669 11.187 133.011 0.983 80 2.866 5.154 1.847 22.502 593.552 0.973 60 3.677 5.595 1.857 30.103 924.254 0.970 40 4.345 5.563 2.082 36.799 1085.072 0.973 25 4.751 4.874 1.668 41.734 1281.668 0.972

252
Figure 5-47 (a): Creep results of the parylene-C annealed at 200°C for 1 day in the
vacuum oven (Tg>200°C); (b): Stress relaxation results of the parylene-C annealed at
200°C for 1 day in the vacuum oven (Tg>200°C)
024 30 45 60 75 90 105 120 135 150 165 180 195 210 225
0.00
0.05
0.10
0.15
0.20
0.25St
rain
(%)
Time (min)
150oC 120oC 100oC 80oC 60oC 40oC 25oC
0.00
0.05
0.10
0.15
0.20
0.25
Stra
in (%
)
024 30 45 60 75 90 105 120 135 150 165 180-505
1015202530354045505560
Stre
ss (M
Pa)
Time (min)
25oC
40oC
80oC60oC
120oC100oC
150oC
-5051015202530354045505560
Stre
ss (M
Pa)
(a)
(b)
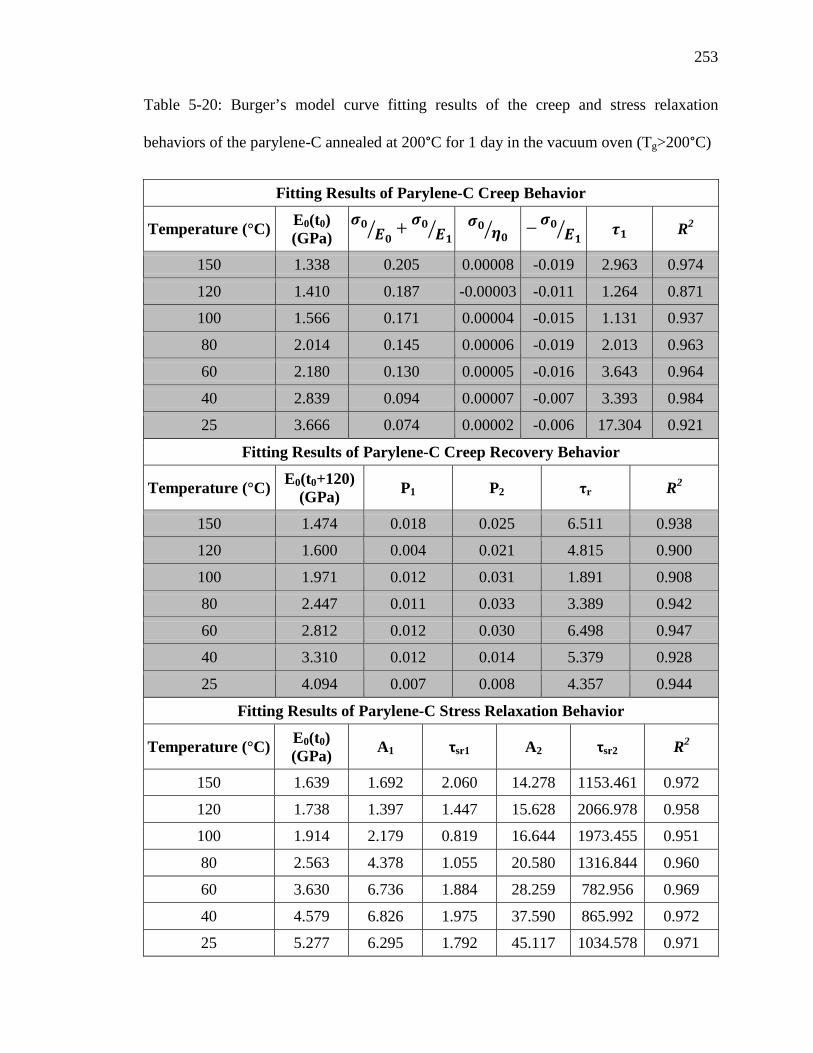
253
Table 5-20: Burger’s model curve fitting results of the creep and stress relaxation
behaviors of the parylene-C annealed at 200°C for 1 day in the vacuum oven (Tg>200°C)
Fitting Results of Parylene-C Creep Behavior
Temperature (°C) E0(t0) (GPa)
𝝈𝟎𝑬𝟎� + 𝝈𝟎
𝑬𝟏� 𝝈𝟎 𝜼𝟎� −𝝈𝟎 𝑬𝟏� 𝝉𝟏 R2
150 1.338 0.205 0.00008 -0.019 2.963 0.974
120 1.410 0.187 -0.00003 -0.011 1.264 0.871
100 1.566 0.171 0.00004 -0.015 1.131 0.937
80 2.014 0.145 0.00006 -0.019 2.013 0.963
60 2.180 0.130 0.00005 -0.016 3.643 0.964
40 2.839 0.094 0.00007 -0.007 3.393 0.984
25 3.666 0.074 0.00002 -0.006 17.304 0.921
Fitting Results of Parylene-C Creep Recovery Behavior
Temperature (°C) E0(t0+120) (GPa) P1 P2 τr R2
150 1.474 0.018 0.025 6.511 0.938
120 1.600 0.004 0.021 4.815 0.900
100 1.971 0.012 0.031 1.891 0.908
80 2.447 0.011 0.033 3.389 0.942
60 2.812 0.012 0.030 6.498 0.947
40 3.310 0.012 0.014 5.379 0.928
25 4.094 0.007 0.008 4.357 0.944
Fitting Results of Parylene-C Stress Relaxation Behavior
Temperature (°C) E0(t0) (GPa) A1 τsr1 A2 τsr2 R2
150 1.639 1.692 2.060 14.278 1153.461 0.972
120 1.738 1.397 1.447 15.628 2066.978 0.958
100 1.914 2.179 0.819 16.644 1973.455 0.951
80 2.563 4.378 1.055 20.580 1316.844 0.960
60 3.630 6.736 1.884 28.259 782.956 0.969
40 4.579 6.826 1.975 37.590 865.992 0.972
25 5.277 6.295 1.792 45.117 1034.578 0.971

254
Figure 5-48 (a): Creep results of the parylene-C annealed at 200°C for 2 days in the
vacuum oven (Tg>200°C); (b): Stress relaxation results of the parylene-C annealed at
200°C for 2 days in the vacuum oven (Tg>200°C)
024 30 45 60 75 90 105 120 135 150 165 180 195 210 225
0.00
0.05
0.10
0.15
0.20
0.25St
rain
(%)
Time (min)
150oC 120oC 100oC 80oC 60oC 40oC 25oC
0.00
0.05
0.10
0.15
0.20
0.25
Stra
in (%
)
024 30 45 60 75 90 105 120 135 150 165 180-505
1015202530354045505560
Stre
ss (M
Pa)
Time (min)
25oC40oC
80oC60oC
120oC100oC
150oC
-5051015202530354045505560
Stre
ss (M
Pa)
(a)
(b)

255
Table 5-21: Burger’s model curve fitting results of the creep and stress relaxation
behaviors of the parylene-C annealed at 200°C for 2 days in the vacuum oven (Tg>200°C)
Fitting Results of Parylene-C Creep Behavior
Temperature (°C) E0(t0) (GPa)
𝝈𝟎𝑬𝟎� + 𝝈𝟎
𝑬𝟏� 𝝈𝟎 𝜼𝟎� −𝝈𝟎 𝑬𝟏� 𝝉𝟏 R2
150 1.502 0.179 -0.00001 -0.015 2.114 0.961 120 1.803 0.147 -0.00002 -0.009 1.002 0.919 100 2.200 0.125 0.00000 -0.012 1.004 0.926 80 3.034 0.098 0.00001 -0.016 1.297 0.970 60 3.862 0.080 0.00007 -0.014 4.095 0.975 40 4.833 0.059 0.00005 -0.007 6.798 0.983 25 5.787 0.049 0.00004 -0.006 6.073 0.975
Fitting Results of Parylene-C Creep Recovery Behavior
Temperature (°C) E0(t0+120) (GPa) P1 P2 τr R2
150 1.645 0.005 0.021 5.552 0.923 120 1.925 0.000 0.013 3.700 0.891 100 2.430 0.001 0.019 1.750 0.912 80 3.261 -0.002 0.021 3.299 0.934 60 4.187 0.009 0.017 5.497 0.946 40 4.793 0.005 0.008 4.699 0.927 25 5.930 0.007 0.004 2.800 0.926
Fitting Results of Parylene-C Stress Relaxation Behavior
Temperature (°C) E0(t0) (GPa) A1 τsr1 A2 τsr2 R2
150 1.386 1.350 2.632 12.238 1194.563 0.978 120 1.813 1.323 1.594 16.456 2154.843 0.956 100 2.030 2.133 0.880 17.877 2167.343 0.958 80 2.411 3.972 1.109 19.528 1386.513 0.962 60 2.822 4.909 1.847 22.285 844.266 0.967 40 3.702 5.514 2.007 30.504 906.889 0.974 25 4.183 4.834 2.125 36.010 1104.291 0.973
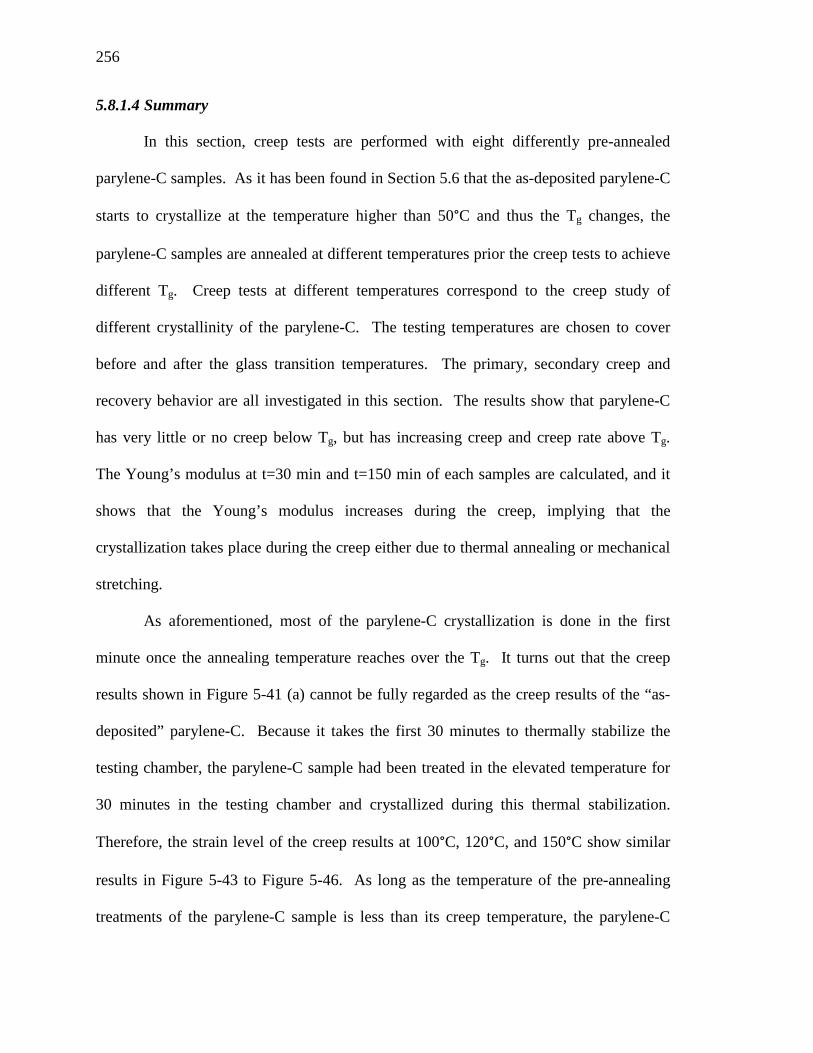
256
5.8.1.4 Summary
In this section, creep tests are performed with eight differently pre-annealed
parylene-C samples. As it has been found in Section 5.6 that the as-deposited parylene-C
starts to crystallize at the temperature higher than 50°C and thus the Tg changes, the
parylene-C samples are annealed at different temperatures prior the creep tests to achieve
different Tg. Creep tests at different temperatures correspond to the creep study of
different crystallinity of the parylene-C. The testing temperatures are chosen to cover
before and after the glass transition temperatures. The primary, secondary creep and
recovery behavior are all investigated in this section. The results show that parylene-C
has very little or no creep below Tg, but has increasing creep and creep rate above Tg.
The Young’s modulus at t=30 min and t=150 min of each samples are calculated, and it
shows that the Young’s modulus increases during the creep, implying that the
crystallization takes place during the creep either due to thermal annealing or mechanical
stretching.
As aforementioned, most of the parylene-C crystallization is done in the first
minute once the annealing temperature reaches over the Tg. It turns out that the creep
results shown in Figure 5-41 (a) cannot be fully regarded as the creep results of the “as-
deposited” parylene-C. Because it takes the first 30 minutes to thermally stabilize the
testing chamber, the parylene-C sample had been treated in the elevated temperature for
30 minutes in the testing chamber and crystallized during this thermal stabilization.
Therefore, the strain level of the creep results at 100°C, 120°C, and 150°C show similar
results in Figure 5-43 to Figure 5-46. As long as the temperature of the pre-annealing
treatments of the parylene-C sample is less than its creep temperature, the parylene-C

257
sample also experiences further crystallization at the creep temperature during the 30
minutes stabilization. To overcome this problem, the best way to do is place the sample
in a pre-heated and thermally stabilized chamber and starts the creep test right after the
placement. The temperature profile of this experiment can be treated as a step function.
As the crystallization time constant is found to be about 0.845 minute, some of the creep
in this experiment happens before the first time constant of its crystallization.
Unfortunately, DMA Q800 does not provide this kind of function due to its sample
loading limitation. An alternate approach was proposed and performed to fulfill this idea,
which will be discussed in Section 5.8.2.
A 4-element Burger’s model is utilized in this section to curve fit our results and
the model agrees well with our creep data according to the obtained correlation
coefficients, with the exception of the results obtained at the temperature lower than Tg.
The derived Tg is generally in between 7-10 minutes for the creep, meaning that 30
minutes, i.e. 3 time constants, is long enough for parylene-C to finish the primary creep
behavior. As the permanent viscoplastic strain is found after the creep test at the
temperature higher than Tg, it is believed that the yield point could be even less than 2.43
MPa at these temperature levels. The future work would focus on the study of this
irreversible strain and also the yield strength of differently pre-annealed parylene-C at
different temperatures. In addition, as only primary and secondary creep behavior have
been studied here, it worth a study of the investigation of the tertiary region of the
parylene-C creep, which leads to the rupture as shown in Figure 5-39 (b). This study can
be achieved by either longer creep with 2.43 MPa, which might take a long time, or a
higher creep loading stress to shorten the testing time.

258
5.8.2 As-deposited parylene-C creep study under a step temperature profile
5.8.2.1 Experimental setup
To solve the problem of the parylene-C’s crystallization occuring during the first
30 minutes of the testing chamber’s thermal stabilization prior to the creep test, a
convection oven is pre-heated at the targeted temperature and thermally stabilized prior to
the real creep tests. The testing setup is shown in Figure 5-49 (a)
Figure 5-49: The testing setup of parylene-C creep with Heaviside temperature profile:
(a) convection oven setup with a video recording apparatus, (b) parylene-C sample
mounting configuration in the convection oven
Parylene-C film was deposited 11.25 µm thick and then cut into uniform 15-mm-
wide strips, each with a length of more than 40 mm, facilitating later binding onto the
Width:1.5 cm
Length:~ 40 mm
Convection oven
Video recording apparatus
Rubber gasket binder
Stress loading
Needle indicator
Parylene-C sample
Ruler
(a) (b)
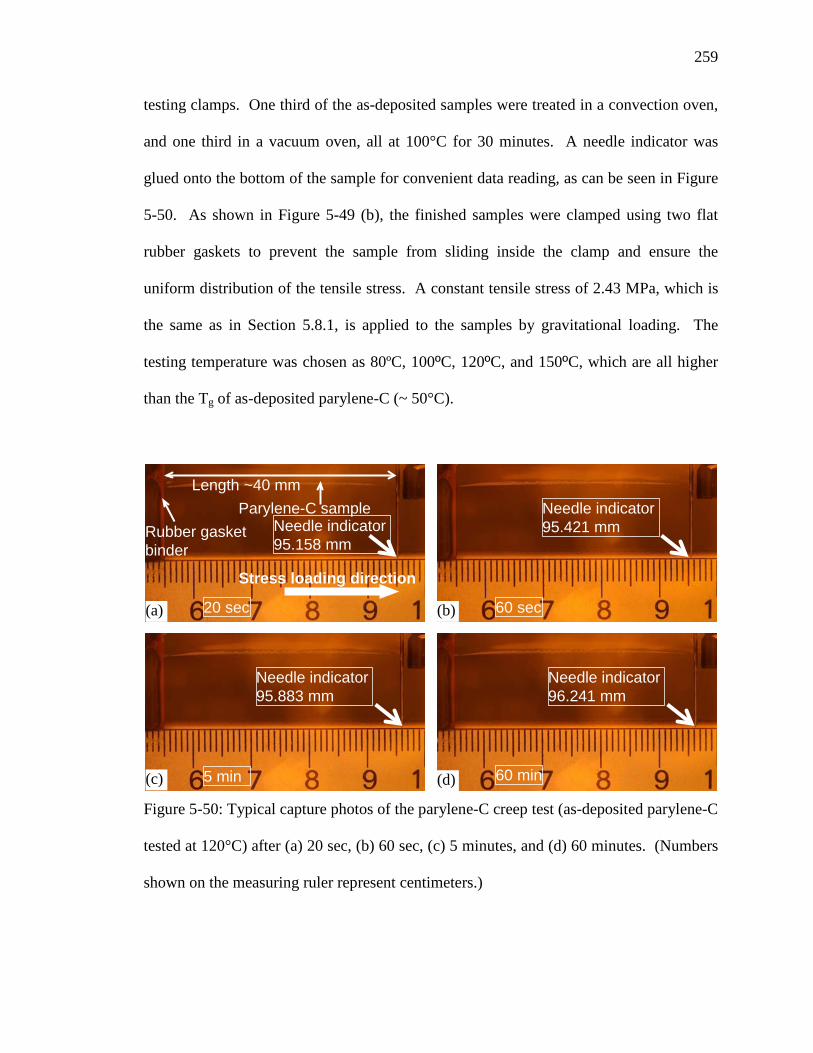
259
testing clamps. One third of the as-deposited samples were treated in a convection oven,
and one third in a vacuum oven, all at 100°C for 30 minutes. A needle indicator was
glued onto the bottom of the sample for convenient data reading, as can be seen in Figure
5-50. As shown in Figure 5-49 (b), the finished samples were clamped using two flat
rubber gaskets to prevent the sample from sliding inside the clamp and ensure the
uniform distribution of the tensile stress. A constant tensile stress of 2.43 MPa, which is
the same as in Section 5.8.1, is applied to the samples by gravitational loading. The
testing temperature was chosen as 80ºC, 100ºC, 120ºC, and 150ºC, which are all higher
than the Tg of as-deposited parylene-C (~ 50°C).
Figure 5-50: Typical capture photos of the parylene-C creep test (as-deposited parylene-C
tested at 120°C) after (a) 20 sec, (b) 60 sec, (c) 5 minutes, and (d) 60 minutes. (Numbers
shown on the measuring ruler represent centimeters.)
Parylene-C sampleNeedle indicator95.158 mm
Needle indicator95.421 mmRubber gasket
binder
Stress loading direction
Length ~40 mm
Needle indicator95.883 mm
Needle indicator96.241 mm
20 sec 60 sec
5 min 60 min
(a) (b)
(c) (d)

260
The convection oven was first pre-heated to the target temperature. Once the
oven’s temperature was stabilized, the parylene-C sample was placed in the oven and the
door was closed immediately. As the Biot number is much less than one, the temperature
distribution is assumed to be uniform within the samples [252]. The theoretical heat flux
was also calculated and verified that the sample was in thermal equilibrium with the
oven’s inner ambient temperature in less than one second. Therefore, parylene-C film is
assumed to fully experience the target temperature right after placement into the oven,
and the samples can be mathematically assumed to experience a Heaviside temperature
profile in this creep test.
The creep test was performed under the previous mentioned temperatures for
longer than 60 minutes, while the location of the needle indicator was filmed by the video
recording apparatus through the observing window of the convection oven, as shown in
Figure 5-49 (a). A picture was first taken prior the sample placed in the oven so that the
original length extension of the sample under the stress of 2.43 MPa can be first
measured. Photos at several critical time intervals during the creep test were then
captured from the video, enhanced by Photoshop and run through a Matlab program to
determine the sample length as a function of time, as shown in Figure 5-50. Thermal
expansion effect of the samples was also considered and eliminated during the data
analysis.
5.8.2.2 Experimental results and discussions
The obtained creep curves of three different pre-annealed parylene-C samples are
shown in Figure 5-51 to Figure 5-53. By comparing Figure 5-51 (the results of as-
deposited parylene-C) and Figure 5-41 (a) (creep results of as-deposited parylene-C pre-

261
annealed for 30 minutes during the chamber thermal stabilization), it is found that the
creep strain obtained under Heaviside temperature profile (Figure 5-51) is much higher
than in Figure 5-41. Take the sample tested at 150ºC for an example, the strain in Figure
5-51 is found to be 7% after 60 minutes of creep, while the strain in Figure 5-41 (a) is
found to be only 0.7%. Because the creep temperature profile during the creep test in this
section is a step function, the creep initiated right after the parylene-C sample was placed
in the oven. Therefore, although the crystallization time constant is found less than one
minute in Section 5.5.2, it still has lots of amorphous molecules when it starts to creep.
As a result, the parylene-C tested in this section can extend much longer than in Section
5.8.1.
Figure 5-51: Creep results of as-deposited parylene-C performed at 80ºC, 100ºC, 120ºC,
and 150ºC with a Heaviside temperature profile
0 10 20 30 40 50 60 70 80-0.50.00.51.01.52.02.53.03.54.04.55.05.56.06.57.07.5
As deposit parylene-C sampleThickness: 11.25 µmWidth: 15 mmStress: 2.43 MPa
T=150oC T=120oC T=100oC T=80oC
Stra
in (%
)
Time (min)
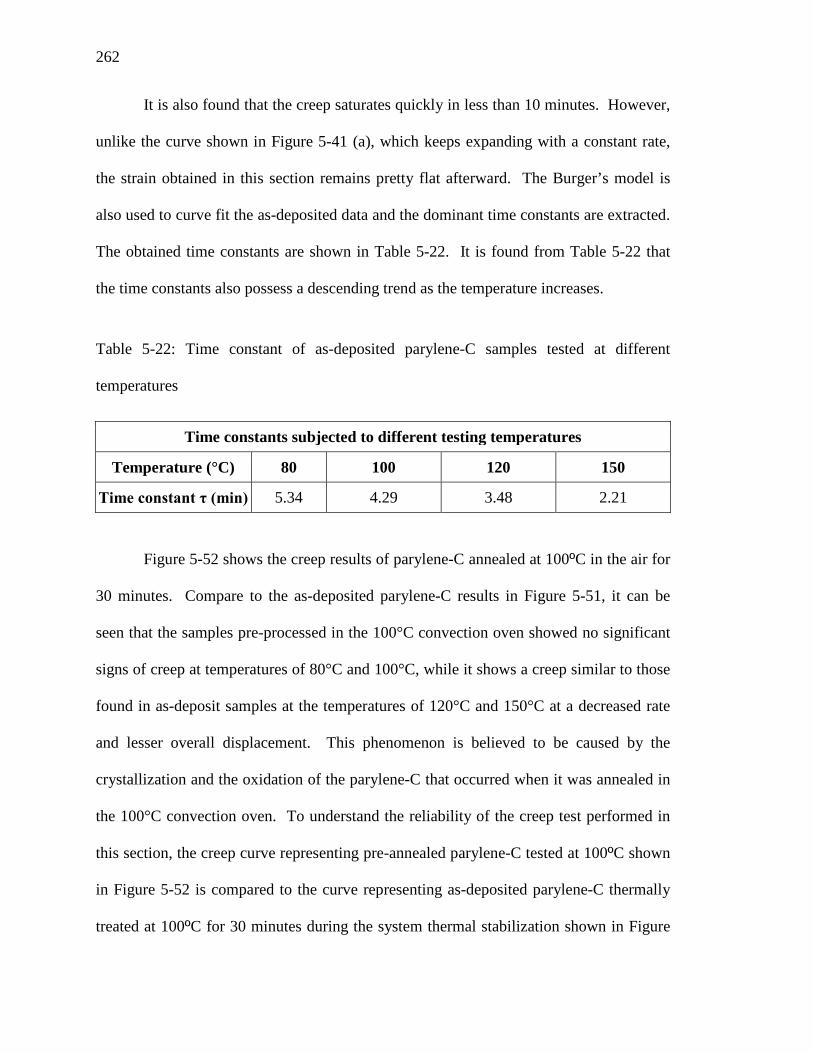
262
It is also found that the creep saturates quickly in less than 10 minutes. However,
unlike the curve shown in Figure 5-41 (a), which keeps expanding with a constant rate,
the strain obtained in this section remains pretty flat afterward. The Burger’s model is
also used to curve fit the as-deposited data and the dominant time constants are extracted.
The obtained time constants are shown in Table 5-22. It is found from Table 5-22 that
the time constants also possess a descending trend as the temperature increases.
Table 5-22: Time constant of as-deposited parylene-C samples tested at different
temperatures
Time constants subjected to different testing temperatures
Temperature (°C) 80 100 120 150
Time constant τ (min) 5.34 4.29 3.48 2.21
Figure 5-52 shows the creep results of parylene-C annealed at 100ºC in the air for
30 minutes. Compare to the as-deposited parylene-C results in Figure 5-51, it can be
seen that the samples pre-processed in the 100°C convection oven showed no significant
signs of creep at temperatures of 80°C and 100°C, while it shows a creep similar to those
found in as-deposit samples at the temperatures of 120°C and 150°C at a decreased rate
and lesser overall displacement. This phenomenon is believed to be caused by the
crystallization and the oxidation of the parylene-C that occurred when it was annealed in
the 100°C convection oven. To understand the reliability of the creep test performed in
this section, the creep curve representing pre-annealed parylene-C tested at 100ºC shown
in Figure 5-52 is compared to the curve representing as-deposited parylene-C thermally
treated at 100ºC for 30 minutes during the system thermal stabilization shown in Figure

263
5-41 (a). From Figure 5-41 (a), the sample tested at 100ºC extends to about 0.5% after
60 minutes of creep, while the curve shown in Figure 5-52 has a strain ranging bout 0.5%
to 1%. Due to the low resolution of the method provided in this section, which is about
0.5%, these two strains do not show a significant difference and therefore the comparison
verifies that the testing method performed in this section is a reliable approach.
Figure 5-52: Creep results of parylene-C pre-annealed at 100ºC in the air, performed at
80ºC, 100ºC, 120ºC, and 150ºC with a Heaviside temperature profile
As shown in Figure 5-53, the creep results of parylene-C samples pre-annealed in
the 100°C vacuum oven show a similar behavior to the as-deposit samples at all four
temperatures, but with a smaller creep strain. The lesser overall strain of the samples
treated at 100°C in vacuum implies the intrinsic polymer transformation, which is mainly
due to the crystallization.
0 10 20 30 40 50 60 70 80
0.0
0.5
1.0
1.5
2.0
2.5
3.0
3.5
4.0Sample 100oC pre-treated in convection ovenThickness: 11.25 µmWidth: 15 mmStress: 2.43 MPa
Stra
in (%
)
Time (min)
T=150oC T=120oC T=100oC T=80oC

264
The oxidation results can also be studied by comparing Figure 5-52 and Figure
5-53. It is found that the strain of the creep curves shown in Figure 5-53 is always higher
than in Figure 5-52 at all four testing temperatures. As two samples are both pre-
annealed at 100°C, in addition, the crystallization effect can be ignored at the time of
instantaneous stain applied, it is evident that the oxidation does happen at 100ºC and
dominates the creep results in this study. It is believed that the oxygen atom embedded in
the parylene-C sample deters the polymer movement during the creep tests. The results
verify that annealing of parylene-C in vacuum keeps the sample oxygen-free and does
preserve its properties.
Figure 5-53: Creep results of parylene-C pre-annealed at 100ºC in the vacuum, performed
at 80ºC, 100ºC, 120ºC, and 150ºC with a Heaviside temperature profile
0 10 20 30 40 50 60 70 80-0.50.00.51.01.52.02.53.03.54.04.55.05.56.0
Sample 100oC pre-treated in vacuum ovenThickness: 11.25 µmWidth: 15 mmStress: 2.43 MPa
Stra
in (%
)
Time (min)
T=150oC T=120oC T=100oC T=80oC

265
5.8.3 Stress relaxation of parylene-C
5.8.3.1 Stress relaxation overview
Stress-relaxation is another experiment which is also commonly used to find the
time-dependent mechanical behavior of the materials. The concept of the stress
relaxation experiment is shown in Figure 5-54. As shown in Figure 5-54 (a), the stress
relaxation test measures the stress evolution under a constant strain. The environmental
temperature is generally constant. The corresponding output of the applied strain is
shown in Figure 5-54 (b). The stress is first induced by the initial instantaneous strain at
t=t0. Both induced stress relaxes and the relaxing rate decrease gradually with respect to
the time. A permanent stress could be found depends on the type of material tested. The
induced stress of the thermoplastic polymer is generally relaxed to zero while a
permanent stress is generally found with the thermoset polymer [239].
Figure 5-54: The stress relaxation test of polymers: (a) constant applied strain during the
stress relaxation test at a constant temperature, (b) the corresponding stress output versus
time
Similar to the creep tests of the parylene-C, stress relaxation tests are also of great
importance as the implantable parylene-C MEMS devices would face the body
Instantaneous stressStrain, εε 0
Time, t
Stress, σ
σp Time, t
ThermosetThermoplastic
σ0
t0t0
Permanent stress
(a) (b)

266
temperature, i.e., 37°C, during its operation, and the built-in stress might dominate the
device’s life. On the other hand, with the knowledge of the stress relaxation of parylene-
C, the residual stress of parylene-C MEMS devices after the fabrication can be relaxed by
treating in a proper post-annealing temperature and time.
5.8.3.2 Solution of the Burger’s model for stress relaxation
With a proper initial condition, the constitutive equation of Burger’s model
expressed in eqn. (5-12) can be solved for stress relaxation. Rewrite eqn. (5-12) as:
𝜎0 + 𝑝1�̇� + 𝑝2�̈� = 𝑞1𝜀̇ + 𝑞2𝜀̈, (5-19)
where
𝑝1 =𝜂0𝐸0
+𝜂0𝐸1
+𝜂1𝐸1
,
𝑝2 =𝜂0𝜂1𝐸0𝐸1
,
𝑞1 = 𝜂0,
𝑞2 =𝜂0𝜂1𝐸1
.
(5-20)
To solve eqn. (5-19) for stress relaxation behavior, the initial strain conditions are
expressed as 𝜀(0) = 𝜀0𝐻(𝑡), where H(t) is the Heaviside function, 𝜀̇(0) = 𝜀0𝛿(𝑡) and
𝜀̈(0) = 𝜀0𝛿(𝑡)𝑑𝑡
. Applied 𝜀(0), 𝜀̇(0), 𝜀̈(0) into eqn. (5-19), the solution of the obtained
stress can be solved as [239, 253, 254]:
𝜎 =𝜀0
�𝑝12 − 4𝑝2[(𝑞1 − 𝑞2𝑟1) exp−𝑟1𝑡 −(𝑞1 − 𝑞2𝑟2) exp−𝑟2𝑡], (5-21)
or for simplicity:
𝜎 = 𝐴1 exp−𝑟1𝑡 +𝐴2 exp−𝑟2𝑡, (5-22)
In eqn. (5-21), r1 and r2 are expressed as:

267
𝑟1 =
𝑝1−�𝑝12−4𝑝2
2𝑝2, and 𝑟2 =
𝑝1+�𝑝12−4𝑝2
2𝑝2. (5-23)
The values of four physical elements of the Burger’s model can be calculated by the
following expressions:
𝐸0 =𝑞2𝑞1
,
𝜂0 = 𝑞0,
𝐸1 =𝐸0𝜂02
𝑝1𝐸0𝜂0 − 𝜂02 − 𝑞2𝐸0,
𝜂1 =𝑞2𝐸1𝜂0
.
(5-24)
In addition, the two time constantsτsr1, and τsr2 can be obtained by the reciprocal of r1 and
r2 as:
𝜏𝑠𝑟1 = 1𝑟1
, and 𝜏𝑠𝑟1 = 1𝑟2
. (5-25)
5.8.3.3 Stress relaxation experiment
5.8.3.3.1 Sample preparation and the experiments
In this section, the stress relaxation was performed with eight parylene-C samples
treated/annealed the same as in Section 5.8.1, as well as with the same geometry. Seven
testing temperatures were also chosen the same as in Section 5.8.1 for comparison.
During the stress relaxation experiment, an instantaneous strain of 1% was applied onto
the sample and the corresponding stress relaxation was monitored for two hours.
Similarly, the system was pre-heated to the target temperature for 30 minutes before the
stress relaxation test.

268
5.8.3.3.2 Results and discussion
The results of the stress relaxation test of eight different pre-treated parylene-C
samples are shown in Figure 5-41 (b) to Figure 5-48 (b) on pages 240 to 254. Similar to
the figures of creep tests, each figure has seven curves corresponding to seven different
testing temperatures. The Burger’s curve fitting results are also shown in the stress
relaxation parts in Table 5-14 to Table 5-21 on pages 241 to 255. From the results shown
in those figures and tables, several founds can be made as follows:
1. It is found that the stress always demonstrates a descending trend at whatever
temperature, and a permanent stress is always found as long as the 1% strain is
applied to the samples. The permanent stress level depends on the testing
temperature. The remaining permanent stress becomes much less when the
testing temperature is higher than Tg. In this case, the higher the testing
temperature, the lesser the permanent stress obtained. It implies the high mobility
of the parylene-C polymer chain at higher temperature. The descending rate
generally also increases as the testing temperature increases. However, when the
testing temperature is lower than Tg, very little descending rate observed and the
permanent stress is relatively higher. It is evident that the glass transition
temperature is a very important indicator that divides the results into two parts:
very little stress is relaxed and also at slower rate with temperature lower than Tg,
while more stress is relaxed and at faster relaxing rate at the temperature higher
than Tg.
2. It is found from Burger’s model expressed in eqn. (5-21) that the solution model
has two time constants: τsr1 and τsr2. The results of the first time constant, τsr1,

269
in Table 5-14 to Table 5-21 generally fall in the range of 1–5 minutes. However,
the value of τsr1 spreads arbitrary and no obvious trend can be found. On the
other hand, according to Table 5-14 to Table 5-21, the values of τsr2 are found
ranging from about 100 up to 2150 minutes, which is much larger than the first
time constant τsr1. Another trend also can be found that τsr2 generally decreases
as the testing temperature increases, with the exception of samples pre-annealed at
200ºC (Table 5-20 and Table 5-21). Again, this infers that the parylene-C is
softer at higher temperature and the polymer chain is easier to deform. The stress
relaxation results of samples pre-annealed at 200ºC all show very large τsr2,
implying very little stress relaxation. Therefore the parylene-C annealed at 200ºC
for either one or two days are very close to elastic material, which has also been
predicted in Section 5.8.1. Because the annealing of parylene-C at 200ºC was
performed in the vacuum oven, it is believed that the oxidation effect can be
ignored during the sample preparation, and thus this material property change
(from viscoelastic to elastic) is attributed to the crystallization of the parylene-C.
As the second time constant is usually longer than 120 minutes, the effect of the
second time constant cannot be seen in the figures shown in this section. Further
study needs to be done to verify the accuracy of model.
3. As aforementioned, it can be graphically found that the remaining permanent
stress decreases as the testing temperature increases. In addition, more stress is
relaxed when the testing temperature gets higher than Tg, which has been found
usually close but a bit higher than the annealing temperature in Section 5.6. It
infers that the parylene-C residual stress resulting from the clean room fabrication

270
can be relaxed by annealing the parylene-C at a temperature higher than the
maximum processing temperature. It turns out that monitoring the temperature
history of the parylene-C fabrication process is helpful in predicting and reducing
its residual stress after the device is done. In our clean room, the temperature
generated in most processes is generally controlled less than 200ºC. Therefore, to
relax the residual stress of the parylene-C-based device, it is suggested to anneal
the device at 200ºC in the vacuum oven. As aforementioned, the time first time
constant τsr1 is generally in the range of 1–5 minutes, it can be concluded that the
residual stress can be mostly relaxed in 15 minutes (3 time constants). Therefore,
two-hours annealing would be long enough to relax most of the residual stress in
the parylene-C device, according to what we have just found in this section.
4. It is also found that the remaining permanent stress is higher as the pre-annealing
temperature gets higher. For example, at the testing temperature of 150ºC,
parylene-C pre-annealed at 200ºC (shown in Figure 5-47 and Figure 5-48) has the
highest stress remaining among all eight different parylene-C samples. This is
likely due to the highest crystallinity coming from the high pre-annealing
temperature. High crystallinity also results in slower stress relaxing rate. This
means parylene-C annealed at 200°C behaves similar to an elastic material, which
is also concluded in Section 5.8.1.
5. From Figure 5-41 (b) to Figure 5-48 (b), it can be seen that the stress is introduced
immediately after the instantaneous 1% strain is applied. The level of the stress
response depends on the Yong’s modulus at the testing temperature. Similar to
the Young’s modulus calculation in Section 5.8.1, the Young’s modulus can be

271
obtained by the measured stress divided by 1% of strain. The results of calculated
Young’s modulus are shown in the first column of the stress relaxation part in
Table 5-14 to Table 5-21. As expected, the obtained Young’s modulus decreases
as the testing temperature increases. As expected, it is found that the Young’s
modulus obtained from stress relaxation experiments are close to the values
obtained from creep experiments. The minor difference is likely attributable to
thickness variation and clamping variations.
5.8.3.4 Summary
A series of stress relaxation experiments at seven different testing temperatures
has been done with eight differently pre-treated parylene-C samples. The stress
relaxation experiments performed at temperatures higher than Tg have faster stress
relaxation rates and less residual stress after 120 minutes than experiments performed
below Tg. The Burger’s model solution for stress relaxation behavior is a solution with
two-time-constants. The curve fitting results show that the first time constant is generally
in the range of 1–5 minutes but no trend could be observed from the current data obtained
in our tests. The second time constant is always found much larger than the first time
constant, falling in the range of ~ 100–2150 minutes. In general the second time constant
decreased with increasing testing temperature, except when parylene-C was pre-annealed
at 200ºC, which behaved elastically at the temperatures lower than 200ºC. Because the
second time constants are usually larger than 120 minutes, the effect of the second time
constant cannot be clearly observed in our results in the Figure 5-41 (b) to Figure 5-48
(b). More stress relaxation experiments with longer testing time are needed to understand
the second time constant behavior.

272
From the stress relaxation results, it is suggested that, in order to relax the residual
stress of a parylene-C-based device, the device can be placed at the temperature which is
higher than the highest temperature that the device had experienced during its fabrication.
The time should be longer than three times the first time constant for complete relaxation.
In our experience, annealing the device at 200ºC in vacuum for two hours is preferable.
It is also found that the parylene-C pre-annealed at higher temperature has higher
remaining permanent stress than at lower temperature after two hours of stress annealing
experiment. This is due to the high crystallinity of the parylene-C generated during its
pre-annealing process. Whether the remaining permanent stress is helpful depends on the
devices’ application. If the remaining permanent stress is not required in its final
application, the device can be annealed at the elevated temperature. If the remained
stress is necessary in the device, the parylene-C is suggested to be pre-annealed at a
higher temperature than its final operational temperature to tailor the Tg to a higher value.
By increasing Tg, it prevents the stress loss in the final application at the operational
temperature and therefore the device’s lifetime can become longer.
5.8.4 Summary
In this section, the creep and the stress relaxation behavior, which represent the
time-dependent behavior of the parylene-C were investigated. This work provides useful
information to help researchers design and make the parylene-C based devices.
According to what has been found in this section, parylene-C is a very thermal-sensitive
material and it takes a lot care to fabricate it carefully in the right temperature. In order
to minimize or reduce the residual stress, the temperature needs to be carefully selected

273
during the device fabrication. The fabrication thermal history has to be monitored to
prevent unpredicted device function behavior.
For example, it is recommended that the device should be pre-annealed at a
temperature higher than its designed operation temperature to stabilize the parylene-C
mechanical properties. In addition, by properly designing the fabrication temperatures
and procedures, the required built-in stress of the device won’t be relaxed during later
clean room fabrication and its normal operations.
On the other hand, if it is necessary to eliminate residual stress or it is necessary
to thermally deform and mold the parylene-C device, the temperature experienced during
the device fabrication needs to be monitored. In such cases, a higher temperature than
the temperature the device has experienced is required.
It is well known that high temperature could be introduced during the parylene-C
fabrication or post fabrication. By understanding the relationship between the
mechanical properties of parylene-C with respect to the temperature, people can design
parylene-C devices to maintain functionality and extend lifetime.

274
5.9 Viscoplasticity of Parylene-C Film at Human Body Temperature
5.9.1 Overview of parylene-C viscoplasticity study
Due to its superior biocompatibility, parylene-C has been a prominent protective
coating material for many biomedical devices since the 1950s [255]. In addition, there is
a fast development of parylene-C bioMEMS technology with many potential
applications, such as, spinal cord implant, glaucoma drainage device and cochlear
implant [238, 255, 256]. However, there were reports on the aging degradation of
parylene-C in animal body fluid. For an example, it was found that the as-deposited
parylene-C showed long-term degradation in the monkey brain two years after the
implantation [257]. Although there is suspicion that the plastic or viscoplastic behavior
of parylene-C is part of the degradation mechanism, this has never been systematically
studied. Therefore, there is concern that the lack of understanding of parylene-C’s plastic
behavior can lead to wrongful use of it, especially for long-term implant devices.
The creep behavior, i.e. total strain change with time under a constant loading
stress, and the stress relaxation behavior, i.e., total stress change with time under a
constant strain, of parylene-C film at different temperatures have been studied in Section
5.8.1. The testing results showed that as-deposited parylene-C film can have plastic
deformation at 37°C as its glass transition temperature range is 35–60°C [258].
Therefore, this work is focused on the plastic, or more accurately, viscoplastic, behaviors
of parylene-C film at 37°C due to its growing population in implantations. To understand
the viscoplastic behaviors of parylene-C film, uniaxial tensile tests under various
conditions are performed including tests under different strain rates, cyclic

275
loading/unloading tests, abrupt strain rate change tests, creep-recovery tests, and stress-
relaxation tests [259, 260]
5.9.2 Sample preparation and viscoplastic experiments
5.9.2.1 Sample preparation and testing environment setup
The testing parylene-C samples were prepared at the same deposition condition
by the same coating system as described in previous few sections. The as-deposited film
was then cut into strips with 5.3 mm in width and 10 mm in length. All tests were
performed in the DMA Q800 by TA instruments at 37°C. Similarly, the testing chamber
was first ramped to 37°C, and waited until the whole system reached thermal equilibrium
before the tests started.
5.9.2.2 Testing results
All testing results from the machine are nominal stresses or strains. In this
section, all nominal stresses and strains are readily converted to the true stresses and
strains unless otherwise specified. (Strain rate tests) 5 different strain rates were chosen
from 8.33x10⁻⁶ s-1 to 8.33x10⁻² s-1 (i.e., the highest strain rate Q800 can apply), each of
which has one order of magnitude jump, as shown in Figure 5-55. (Cyclic
loading/unloading tests) The cyclic loading/unloading tests were done at the strain rate of
8.33x10⁻⁵ s-1 (as shown in Figure 5-56). The first loading/unloading was done at 22.92
MPa and the second done at 32.92 MPa. (Abrupt strain rate change tests) The abrupt
strain rate change test was done by changing strain rate from 8.33x10⁻⁵ S-1 to 8.33x10⁻⁶
S-1 during the uniaxial tensile tests. Two abrupt strain rate change tests were performed.
One was done at the strain of 0.9% and the other at 1.1%, as shown in Figure 5-57.

276
(Creep tests) For creep tests, five stresses were applied: 2.5 MPa, 10 MPa, 20 MPa, 30
MPa, and 40 MPa. These stresses were applied for 120 minutes during the creep tests
and then removed to observe the creep recovery for another 60 minutes. The creep
results are shown in Figure 5-58 and fitted with Burger’s model (discussed below).
(Stress relaxation tests) The stress relaxation tests were performed under 6 different
strains: 0.25%, 0.5%, 0.75%, 1%, 1.5%, and 2%. These constant strains were applied
onto the samples for 120 minutes to observe the stress relaxation behaviors of the
parylene-C film. The stress relaxation results are shown in Figure 5-59, which are also
fitted with Burger’s model.
5.9.2.3 Discussion
In this section, the Burger’s model is still used to analyze all the results shown
below due to its simplicity. Similar to Section 5.8, eqn. (5-14) is used for the creep strain
analysis; eqn. (5-16) is used for the creep recovery analysis; and eqn. (5-22) is used for
stress relaxation stress analysis.
Figure 5-55 shows the experimental results of uniaxial tensile tests under different
strain rates and it clearly shows a rate-dependent behavior. The higher the strain rate, the
larger the yield strength is. Note that, for the strain rates 8.33x10⁻² s-1, 8.33x10⁻³ s-1 and
8.33x10⁻⁴ s-1, the end points of the three data curves are the sample fracture points. It is
found that the parylene-C film tends to break more easily when the applied strain rate is
higher. At strain rates higher than 8.33x10⁻⁴ s-1, the parylene-C film behaves like a brittle
material. The Young’s modulus is found to be about 3GPa for all five curves in the early
linear region, which agrees well with the result found in Sections 5.6, 5.7, and 5.8.

277
Figure 5-55: The results of constant strain-rate tests
Figure 5-56 shows the cyclic loading/unloading test results, where a permanent
strain deformation of 0.09% of parylene-C remains after a stress of 22.92 MPa is loaded
and then unloaded. When the stress is reloaded again, the stress-strain curve shows a
hysteresis, which is another evidence of the creep recovery. However, after a while, the
curves do approach the monotonic curve of the standard uniaxial tensile test without
unloading.
Figure 5-57 is the results from the abrupt strain rate change experiments. It is
found that when the strain rate abruptly decreases from 8.33x10⁻⁵ s-1 to 8.33x10⁻⁶ s-1, the
stress drops and gradually coincides with the lower strain rate curve. This means that,
with a strain rate under 8.33x10⁻⁵ s-1, the Young’s modulus is strain-rate dependent but
not strain-rate-history dependent.
Strain SofteningStrain Hardening
E=3 GPa
0 1 2 3 4 5 6 7 8 9 10 11 12 13 14 150
10
20
30
40
50
60
70
80Tr
ue S
tress
(MPa
)
True strain (%)
Strain rate = 8.33*10-2 s-1
Strain rate = 8.33*10-3 s-1
Strain rate = 8.33*10-4 s-1
Strain rate = 8.33*10-5 s-1
Strain rate = 8.33*10-6 s-1
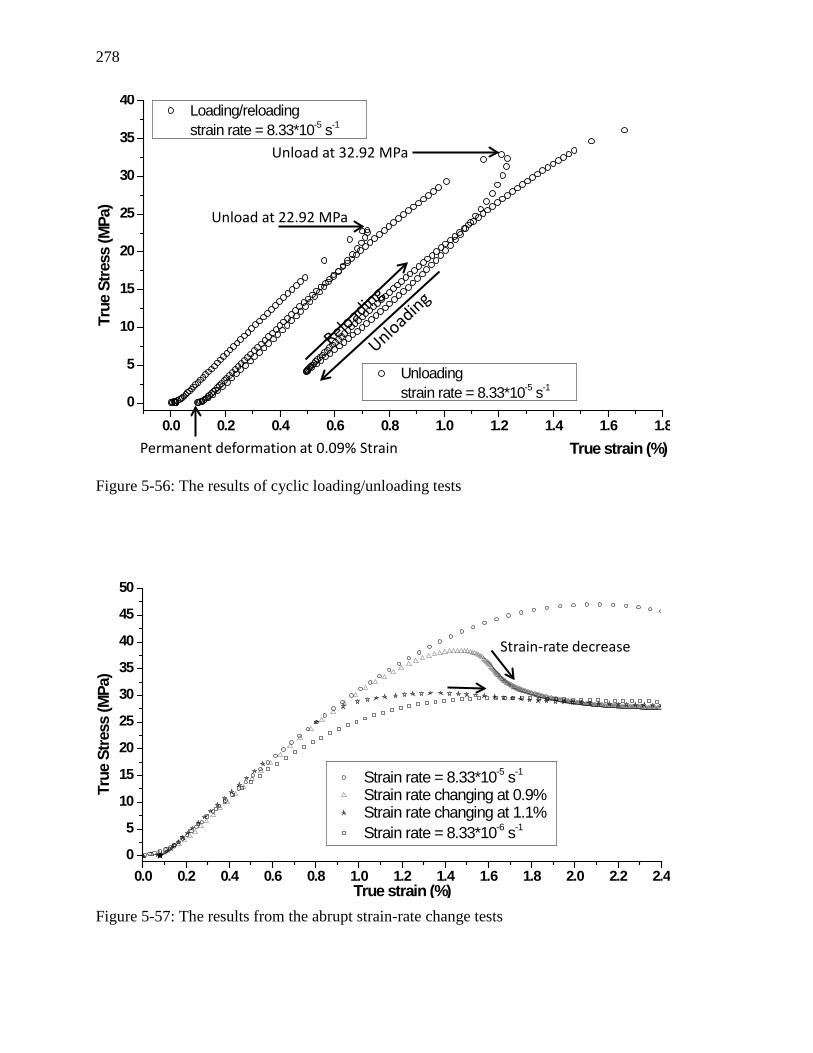
278
Figure 5-56: The results of cyclic loading/unloading tests
Figure 5-57: The results from the abrupt strain-rate change tests
0.0 0.2 0.4 0.6 0.8 1.0 1.2 1.4 1.6 1.80
5
10
15
20
25
30
35
40
Unloading strain rate = 8.33*10-5 s-1
True
Stre
ss (M
Pa)
True strain (%)
Loading/reloading strain rate = 8.33*10-5 s-1
Unload at 22.92 MPa
Unload at 32.92 MPa
Permanent deformation at 0.09% Strain
Strain-rate decrease
0.0 0.2 0.4 0.6 0.8 1.0 1.2 1.4 1.6 1.8 2.0 2.2 2.40
5
10
15
20
25
30
35
40
45
50
True
Stre
ss (M
Pa)
True strain (%)
Strain rate = 8.33*10-5 s-1
Strain rate changing at 0.9% Strain rate changing at 1.1% Strain rate = 8.33*10-6 s-1
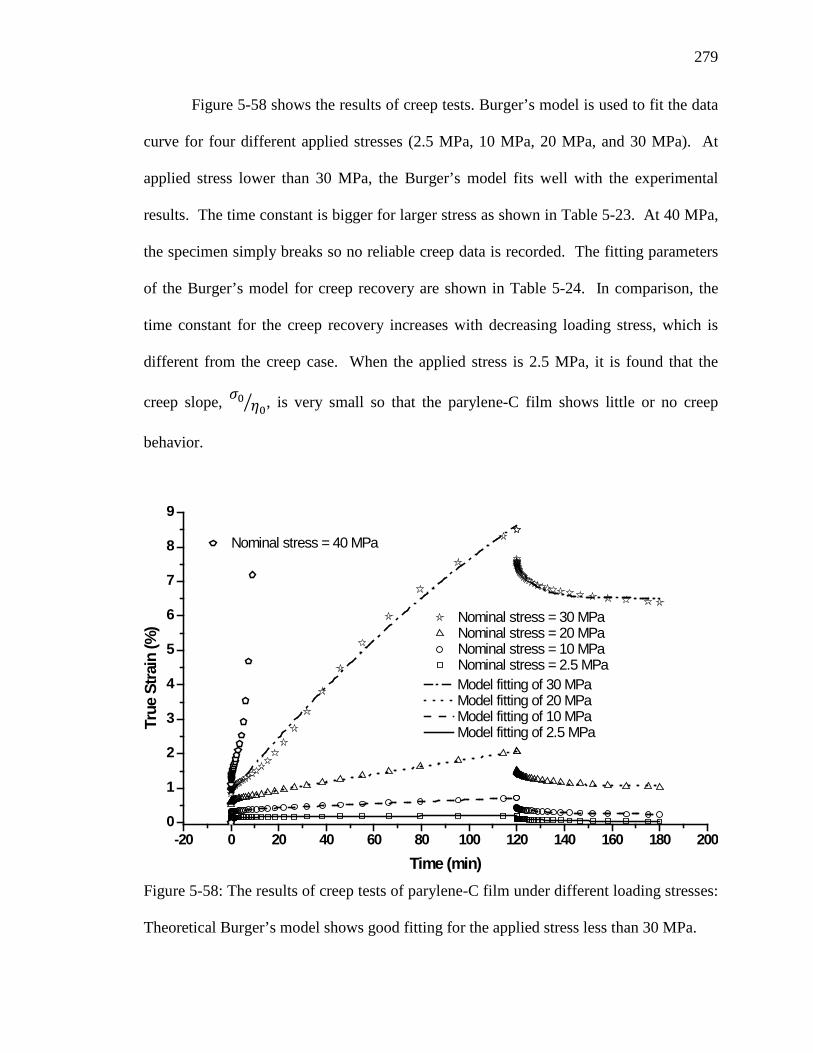
279
Figure 5-58 shows the results of creep tests. Burger’s model is used to fit the data
curve for four different applied stresses (2.5 MPa, 10 MPa, 20 MPa, and 30 MPa). At
applied stress lower than 30 MPa, the Burger’s model fits well with the experimental
results. The time constant is bigger for larger stress as shown in Table 5-23. At 40 MPa,
the specimen simply breaks so no reliable creep data is recorded. The fitting parameters
of the Burger’s model for creep recovery are shown in Table 5-24. In comparison, the
time constant for the creep recovery increases with decreasing loading stress, which is
different from the creep case. When the applied stress is 2.5 MPa, it is found that the
creep slope, 𝜎0 𝜂0� , is very small so that the parylene-C film shows little or no creep
behavior.
Figure 5-58: The results of creep tests of parylene-C film under different loading stresses:
Theoretical Burger’s model shows good fitting for the applied stress less than 30 MPa.
-20 0 20 40 60 80 100 120 140 160 180 2000
1
2
3
4
5
6
7
8
9
Nominal stress = 40 MPa
Nominal stress = 30 MPa Nominal stress = 20 MPa Nominal stress = 10 MPa Nominal stress = 2.5 MPa
True
Stra
in (%
)
Time (min)
Model fitting of 30 MPa Model fitting of 20 MPa Model fitting of 10 MPa Model fitting of 2.5 MPa

280
Figure 5-59 shows the results and the modeling of the stress relaxation tests. Note
that the stress relaxation solution of the Burger’s model inherently give two time
constants, hence Table 5-25 shows two time constants for each test. The first (and
smaller) time constant is identified as the dominant time constant and it decreases as the
applied strain increases. The second time constant is always at least an order of
magnitude larger than the first time constant. Therefore, the second time constant will
not be observed in our experiments due to a limited time span. Accordingly, the stress
relaxation data is consistent with the creep data in the sense that parylene-C exhibits a
significantly stronger plastic flow when the applied stress is higher than 35 MPa
(corresponding to 1% strain). In addition, the stress is relaxed faster with higher stress
loading.
Figure 5-59: The results of stress relaxation tests. Stress relaxation is observed for all the
chosen strains. Higher strain gives faster stress relaxation.
Viscoplasticregime
0 10 20 30 40 50 60 70 80 90 100 110 120 1300
5
10
15
20
25
30
35
40
45
50
55 Strain = 2% ; Model fitting of 2% Strain = 1.5% ; Model fitting of 1.5% Strain = 1% ; Model fitting of 1% Strain = 0.75% ; Model fitting of 0.75% Strain = 0.5% ; Model fitting of 0.5% Strain = 0.25% ; Model fitting of 0.25%
True
Stre
ss (M
Pa)
Time (min)

281
Table 5-23: Parameters of Burger’s model for creep. At 40 MPa, the sample breaks and
no creep could be recorded.
Applied Stress (MPa) 𝝈𝟎𝑬𝟎� + 𝝈𝟎
𝑬𝟏� 𝝈𝟎 𝜼𝟎� 𝝈𝟎𝑬𝟏� 𝝉𝒄 (min)
2.5 0.00174 3.096*10-6 -3.062*10-4 7.522
10 0.00385 2.861*10-5 -6.980*10-4 7.512
20 0.00743 1.109*10-4 -0.0012 10.982
30 4.882 -0.00589 -14.873 2214.1
40 NA NA NA NA
Table 5-24: Parameters of Burger’s model for creep recovery
Applied Stress (MPa) P1 P2 τr
2.5 3.766*10-4 7.707*10-4 20.510
10 0.00256 0.00161 12.168
20 0.0108 0.00385 10.051
30 0.0652 0.00972 8.127
40 NA NA NA
Table 5-25: Parameters of Burger’s model for stress relaxation
Applied Strain (%) P3 τsr1(min) P4 τsr2(min)
0.25 1.475 11.373 4.034 253.611
0.5 3.637 8.033 10.514 163.596
0.75 5.780 8.249 14.971 146.124
1 12.446 7.107 20.989 120.705
1.5 19.500 3.987 23.851 104.838
2 24.778 2.366 24.177 93.888

282
In summary, it is found that the time constants of creep, creep recovery and stress
relaxation are functions of applied stress (or strain), as well as temperature found in
[257]. Besides, above a small strain around 0.1% (~ 2.5 MPa), the parylene-C is clearly
plastic and rate-dependent, hence viscoplastic.
5.9.3 Summary
Five different uniaxial tensile tests under different testing conditions were
performed to study the viscoplastic behaviors of as-deposited 20-µm-thick parylene-C
films. The results show that, above about 0.1% of strain (~ 2.5 MPa) parylene-C is a
strain (or stress) and strain-rate-dependent material. Burger’s model is adequate to
describe its creep and stress relaxation behaviors. Future work would focus on a more
delicate viscoplastic model, e.g., Bodner-Partom model, to analyze parylene-C
viscoplastic behavior [259–266].
5.10 Summary and Conclusion
Several mechanical properties and polymer properties of parylene-C are
investigated in this chapter. The simplest densification experiment is first demonstrated.
It shows that as-deposited parylene-C first extends at temperature lower than ~ 50°C and
starts to shrink at higher temperature, implying that the parylene-C starts to crystallize at
~ 50°C. This assumption was verified by repeating the testing on the same sample with
the same temperature profile. It is found that the parylene-C length does not shrink until
the previous testing temperature, implying the thorough crystallization during the
previous thermal annealing. The thermal coefficient of as-deposited parylene-C is found
as 35.5 ppm/°C, which agrees very well with the available literature value.

283
Oxidation of parylene-C is investigated qualitatively by XPS and FTIR. The
results show that the oxidation of parylene-C is very little at 100°C while it becomes
serious at 200°C. This agrees with the prediction by Nowlin’s neutron activation oxygen
analysis. In contrast to the XPS’s scanning only the surface of the materials, the FTIR
results can prove that the oxidation of parylene-C actually happens through the specimen
thickness. After annealed in air at 200°C, FTIR result also show that the oxidized
parylene-C is composed of CO double bond and CO single bond, and the observed broad
OH spectrum also indicates the likely decomposition and hydrolysis of parylene-C at
high temperature.
Crystallization of parylene-C is studied by using x-ray diffraction technology.
Crystallinity, d-spacing, and crystallite size are all investigated according to the XRD
data. The crystallinity of as-deposited is reported in the literature as 60% to which all
XRD results are calibrated accordingly. It is shown that the paryelne-C crystallinity and
crystallite size increase rapidly when the specimens experience the high testing
temperature. The crystallite size gets bigger with the progression of the annealing time
and also as the annealing temperature increases. The time constant is found as 0.845
minutes according to the pre-annealed parylene-C crystallite size data. It also shows that
the crystallization does not happen until temperature reaches ~ 50°C, which is strong
evidence of showing parylene-C’s glass transition temperature at 50°C. The d-spacing of
(020) plane of parylene-C remains constant at around 6.31 Å during the isothermal XRD
scanning at 100°C.
The glass transition temperature is investigated by using DMA scanning.
Different pre-treated parylene-C specimens are prepared to study the oxidation effect,

284
influences of annealing temperature and of the annealing time. The glass transition
temperature of as-deposited parylene-C is obtained as 53.4°C with glass transition range
as 50.2–57°C. It is found that the glass transition temperature keeps up with the pre-
annealing temperature higher than 60°C, while no Tg shift is found after pre-annealed at
40°C for 30 minutes. On the other hand, the glass transition range gets broader as the
pre-annealing temperature increases. Tg is always obtained as the temperature close to
and a bit higher than the pre-annealing temperature. No Tg difference is found regardless
whether the specimen is pre-annealed in air or in vacuum oven at 100°C. Therefore, it
can be concluded that the Tg is not seriously influenced by oxidation, or the oxidation
effect is not the dominant effect at 100°C. Tg slightly increases with the longer pre-
annealing time at the same annealing temperature. According to the Tg results, it is found
that the Tg is very sensitive to the pre- annealing temperature. Combined with the
crystallization study of the parylene-C, the Tg results can lead to the conclusion that the
crystallization would be the main factor that causes the shift of the glass transition
temperature. It is found that the glass transition temperatures previously reported by
different groups vary widely from room temperature to 150°C. It is likely due to the non-
standardized preparation of parylene-C samples which might have experienced different
thermal processes prior to the glass transition temperature testing, causing difference in
levels of crystallinity among the specimens.
The uniaxial tensile tests are performed on differently pre-annealed parylene-C
samples in this chapter to investigate the influence of the crystallinity on the uniaxial
tensile test results. It is found that parylene-C with higher crystallinity results in larger
Young’s modulus, tensile strength and less percent of elongation, which correspond to
285
stiffer, stronger and more brittle results. In addition, uniaxial tensile tests are also
performed at different temperatures higher than 20°C. It shows that the Young’s
modulus decreases as the testing temperature increases, indicating the softening of the
material and also proves parylene-C as the thermoplastic material.
Viscoelastic and viscoplastic properties of parylene-C have never been studied
before and very rare papers about them are published. In this chapter, the viscoelastic
and viscoplastic properties of parylene-C are first ever explored. It shows that the creep
and stress relaxation results highly depend on the pre-annealing temperature. It is
attributed to the Tg shift after the pre-annealing which renders the crystallinity change at
the temperature for the pre-annealing processes. The creep results of parylene-C
demonstrate a permanent strain remaining after the test, indicating that the parylene-C is
a viscoplastic material. The conclusion can also be derived from the remaining
permanent stress obtained after the stress-relaxation test. The remaining permanent strain
or stress indicating that the yielding point of the parylene-C has changed at the elevated
temperature, and cannot be found just by the regular point where the strain increases with
no stress increase. Therefore, the loading/unloading experiment is performed at 37°C to
understand this phenomenon. With the widely used parylene-C in the development of the
biomedical devices, the viscoelastic and viscoplastic properties of parylene-C at 37°C
need to be understand in more detail to avoid the unwanted device behavior happening in
the human body after the devices implanted.
In summary, all experimental results presented in this chapter suggest that
parylene-C film is a highly temperature-dependent polymer. With all the knowledge
obtained in this chapter, people can tailor parylene-C’s properties in order to satisfy their

286
needs for different applications. Because the CVD as-deposited parylene-C is deposited
at the metastable state, it tends to crystallize immediately at the temperature higher than
Tg and then transforms itself to a more stable state. In order to have devices with more
stable parylene-C mechanical properties, it is suggested to pre-anneal the parylene-C at
the temperature higher than the device’s designed operation temperature prior to the
usage of the devices to prevent the occurrence of the crystallization during its real
operation.


