Embed Size (px)
Citation preview

TIMSS & PIRLS INTERNATIONAL STUDY CENTER, LYNCH SCHOOL OF EDUCATION, BOSTON COLLEGE 177
CHAPTER 5: THE SCIENCE CURRICULUM
Chapter 5The Science CurriculumThe fi rst part of Chapter 5 presents information about the curricular goals in the TIMSS 2003 countries, referred to as the intended curricu-lum. Information is provided about the science subjects offered in each country, whether the participating countries have national curricula and public examinations in science, how the curriculum is supported and monitored within each country, whether countries differentiate the curricula for students with different levels of ability, and the approaches and processes that are emphasized in the intended curriculum. The second part of the chapter presents data about the coverage of the TIMSS science topics in the intended curriculum for each country, as well as teachers’ reports about the science topics actually taught to their students, also known as the implemented curriculum.
In comparing achievement across countries, it is important to consider differences in students’ curricular experiences and how they may affect the science they have studied. Students’ opportu-nity to learn the content, skills, and processes tested in the TIMSS 2003 science assessment depends to a large degree on the curricular goals and intentions inherent in each country’s policies for science education. Just as important as what students are expected to learn, however, is what their teachers choose to teach them. The lessons provided by the teacher ultimately determine the science students are taught.
TIMSS & PIRLS INTERNATIONAL STUDY CENTER, LYNCH SCHOOL OF EDUCATION, BOSTON COLLEGE178
CHAPTER 5: THE SCIENCE CURRICULUM
This chapter presents information about the curricular goals in science in the TIMSS 2003 countries and teachers’ reports about the science content studied. Teachers’ instructional programs for their classes are usually guided by an “offi cial curriculum” that describes the science education that should be provided. The offi cial curriculum can be communicated by means of documents or statements of various types (often called guides, guidelines, or frameworks) prepared by the education ministry or by national or regional education departments. These documents or statements, together with supporting material such as instructional guides or mandated textbooks, are referred to as the intended curriculum. To collect information about the intended science curriculum in each of the TIMSS 2003 countries, the National Research Coordinators (NRCs) responsible for implementing the study completed curriculum questionnaires, often with the assistance of curriculum spe-cialists, and responded to follow-up queries.
In many cases, teachers need to interpret and adapt the intended curriculum according to their perceptions of the needs, abilities, and interests of their students, and this evolves into the implemented cur-riculum. Research has shown that the implemented curriculum, even in highly regulated educational systems, is not identical to the intended curriculum. To collect data about the implemented curriculum, the science teachers of the students tested in TIMSS 2003 completed ques-tionnaires about whether the students had been taught the various science topics included in the assessment.
Which Science Subjects Are Offered Up To and Including Eighth Grade?
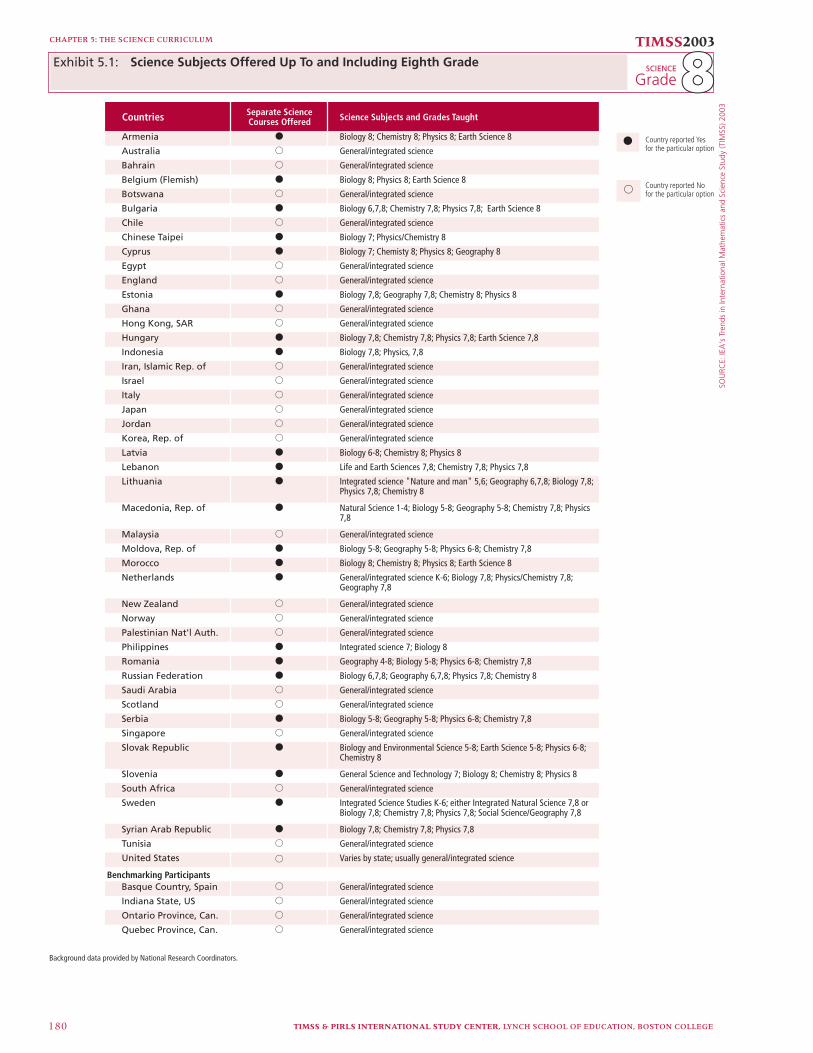
One of the primary differences among science curricula of the TIMSS 2003 countries in eighth and earlier grades is that the sciences are taught as separate subjects in some countries and integrated to form a general science course in others. Exhibit 5.1 shows how science instruc-tion is organized in these grades in the TIMSS countries. By the eighth grade, most of the continental European countries, as well as Chinese
TIMSS & PIRLS INTERNATIONAL STUDY CENTER, LYNCH SCHOOL OF EDUCATION, BOSTON COLLEGE 179
CHAPTER 5: THE SCIENCE CURRICULUM
Taipei, Indonesia, Lebanon, Morocco, and the Philippines, were teach-ing some or all of biology, chemistry, physics, and earth science as separate subjects (in some cases chemistry and physics or biology and earth science are combined), although not necessarily contemporane-ously. Elsewhere, the common practice was to integrate the sciences into a general science curriculum.
SOU
RCE:
IEA
's T
rend
s in
Inte
rnat
iona
l Mat
hem
atic
s an
d Sc
ienc
e St
udy
(TIM
SS) 2
003
TIMSS & PIRLS INTERNATIONAL STUDY CENTER, LYNCH SCHOOL OF EDUCATION, BOSTON COLLEGE180
CHAPTER 5: THE SCIENCE CURRICULUM
TIMSS2003
Grade88SCIENCE
Countries Separate ScienceCourses Offered Science Subjects and Grades Taught
Armenia k Biology 8; Chemistry 8; Physics 8; Earth Science 8
Australia j General/integrated science
Bahrain j General/integrated science
Belgium (Flemish) k Biology 8; Physics 8; Earth Science 8
Botswana j General/integrated science
Bulgaria k Biology 6,7,8; Chemistry 7,8; Physics 7,8; Earth Science 8
Chile j General/integrated science
Chinese Taipei k Biology 7; Physics/Chemistry 8
Cyprus k Biology 7; Chemisty 8; Physics 8; Geography 8
Egypt j General/integrated science
England j General/integrated science
Estonia k Biology 7,8; Geography 7,8; Chemistry 8; Physics 8
Ghana j General/integrated science
Hong Kong, SAR j General/integrated science
Hungary k Biology 7,8; Chemistry 7,8; Physics 7,8; Earth Science 7,8
Indonesia k Biology 7,8; Physics, 7,8
Iran, Islamic Rep. of j General/integrated science
Israel j General/integrated science
Italy j General/integrated science
Japan j General/integrated science
Jordan j General/integrated science
Korea, Rep. of j General/integrated science
Latvia k Biology 6-8; Chemistry 8; Physics 8
Lebanon k Life and Earth Sciences 7,8; Chemistry 7,8; Physics 7,8
Lithuania k Integrated science "Nature and man" 5,6; Geography 6,7,8; Biology 7,8;Physics 7,8; Chemistry 8
Macedonia, Rep. of k Natural Science 1-4; Biology 5-8; Geography 5-8; Chemistry 7,8; Physics7,8
Malaysia j General/integrated science
Moldova, Rep. of k Biology 5-8; Geography 5-8; Physics 6-8; Chemistry 7,8
Morocco k Biology 8; Chemistry 8; Physics 8; Earth Science 8
Netherlands k General/integrated science K-6; Biology 7,8; Physics/Chemistry 7,8;Geography 7,8
New Zealand j General/integrated science
Norway j General/integrated science
Palestinian Nat'l Auth. j General/integrated science
Philippines k Integrated science 7; Biology 8
Romania k Geography 4-8; Biology 5-8; Physics 6-8; Chemistry 7,8
Russian Federation k Biology 6,7,8; Geography 6,7,8; Physics 7,8; Chemistry 8
Saudi Arabia j General/integrated science
Scotland j General/integrated science
Serbia k Biology 5-8; Geography 5-8; Physics 6-8; Chemistry 7,8
Singapore j General/integrated science
Slovak Republic k Biology and Environmental Science 5-8; Earth Science 5-8; Physics 6-8;Chemistry 8
Slovenia k General Science and Technology 7; Biology 8; Chemistry 8; Physics 8
South Africa j General/integrated science
Sweden k Integrated Science Studies K-6; either Integrated Natural Science 7,8 orBiology 7,8; Chemistry 7,8; Physics 7,8; Social Science/Geography 7,8
Syrian Arab Republic k Biology 7,8; Chemistry 7,8; Physics 7,8
Tunisia j General/integrated science
United States j Varies by state; usually general/integrated science
Benchmarking ParticipantsBasque Country, Spain j General/integrated science
Indiana State, US j General/integrated science
Ontario Province, Can. j General/integrated science
Quebec Province, Can. j General/integrated science
Country reported Yesfor the particular option
k
jCountry reported Nofor the particular option
Exhibit 5.1: Science Subjects Offered Up To and Including Eighth Grade
Background data provided by National Research Coordinators.
TIMSS & PIRLS INTERNATIONAL STUDY CENTER, LYNCH SCHOOL OF EDUCATION, BOSTON COLLEGE 181
CHAPTER 5: THE SCIENCE CURRICULUM
Which Countries Have a National Curriculum and Public Examinations in Science?
A common feature of many countries’ educational systems is that cur-ricular decisions are made at the national level, with the ministry of education (or highest authority in the system) being primarily respon-sible for the major decisions governing the direction of education. Some countries, on the other hand, have less centralized systems, with such decisions made at the regional or local level. Centralized decision making can add coherence and uniformity to curriculum coverage, whereas less centralized decision making may give a school or teacher more fl exibility in tailoring instruction to the needs of students.
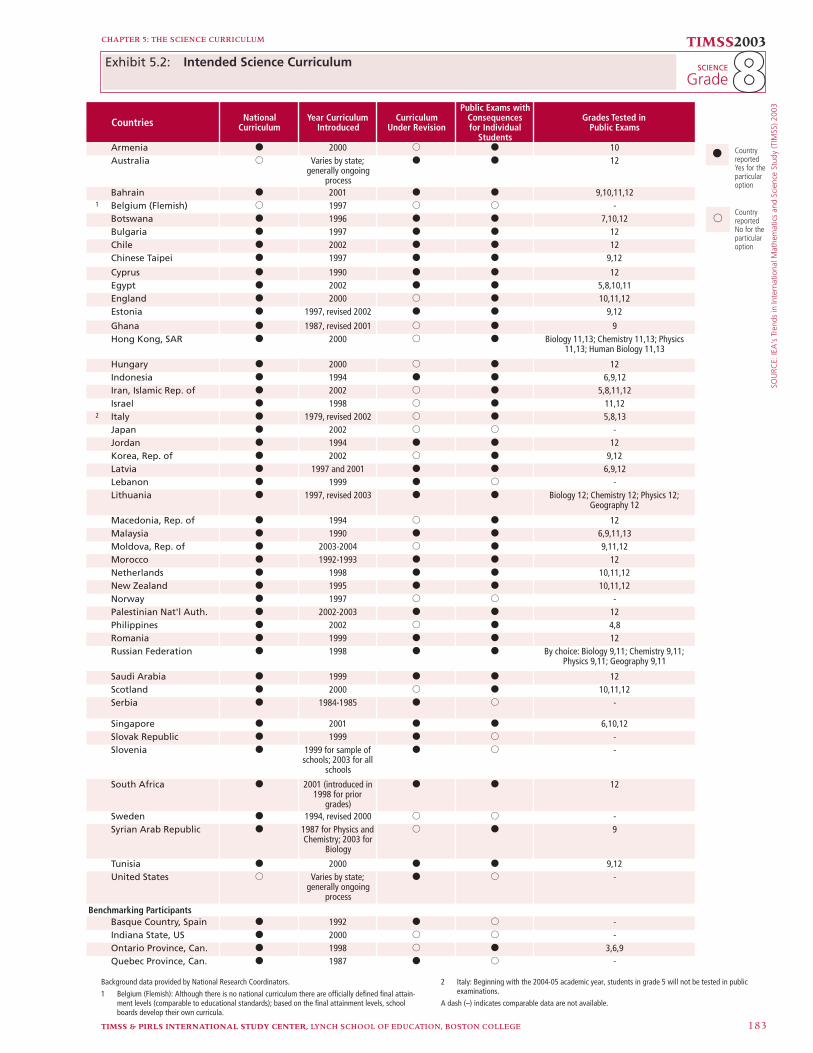
Exhibit 5.2 shows that, of the 47 countries that participated in TIMSS 2003 at the eighth grade,1 all but 3 reported that the specifi ca-tions for students’ curricular goals in science at this level were devel-oped as national curricula. In Australia and the United States, curricula were determined at the state level. In Belgium (Flemish), although there was no national curriculum, there were offi cially defi ned fi nal attainment levels, and school boards developed their own curricula based on these. Among benchmarking participants, the US state of Indiana and the Canadian provinces of Ontario and Quebec had system-wide curricula determined at the state and provincial level, respectively, while in the Basque Country of Spain, 55 percent of the curriculum was determined at the national level and 45 percent at the community level.
In the recent past, it has become common for countries’ intended curricula to be updated regularly. At the time of the TIMSS 2003 testing, the offi cial eighth-grade science curriculum in 27 of the participants had been in place for fi ve years or less, and more than half of those were in revision. Of the 24 participants with an eighth-grade science curriculum of more than fi ve years standing, 18 were revising it at the time of the assessment. For Australia and the United States, with less centralized educational systems, curriculum renewal varied by state and was generally an ongoing process.
1 Curriculum data are presented for the Syrian Arab Republic at the eighth grade, and for Yemen at the fourth grade, because these data are not dependent upon the countries’ samples.

TIMSS & PIRLS INTERNATIONAL STUDY CENTER, LYNCH SCHOOL OF EDUCATION, BOSTON COLLEGE182
CHAPTER 5: THE SCIENCE CURRICULUM
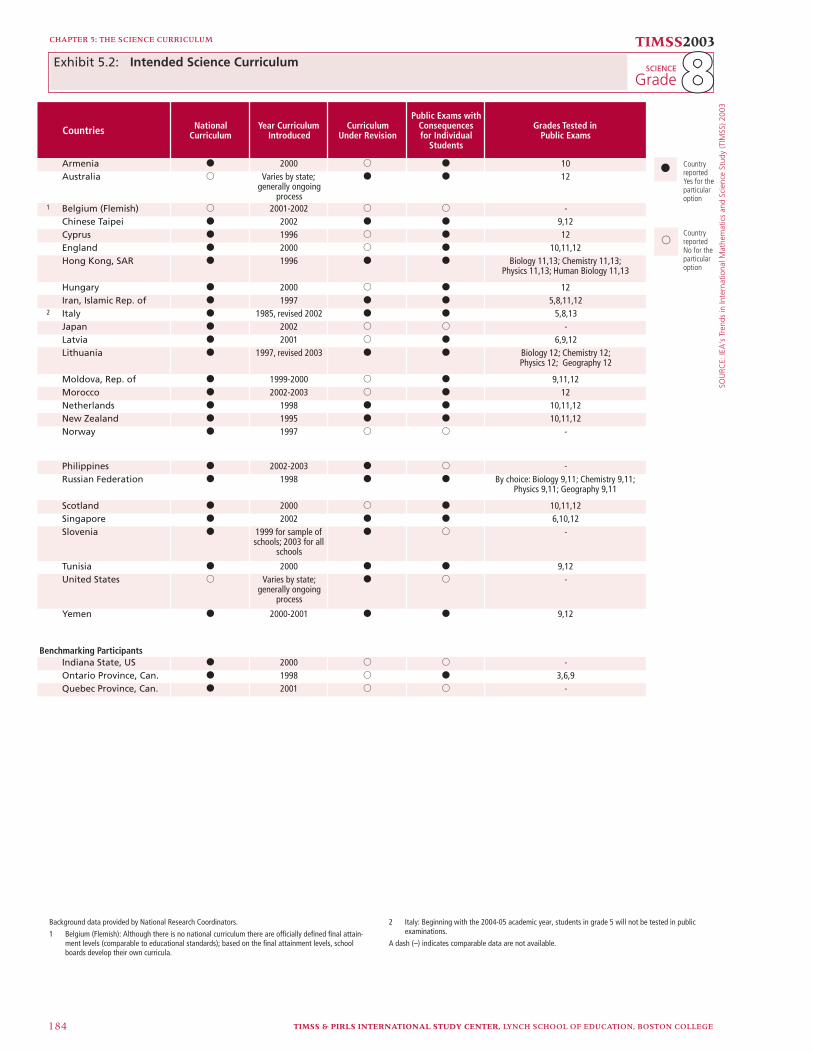
At the fourth grade, Exhibit 5.2 shows that of the 26 coun-tries that participated in TIMSS 2003 at this level, all but 3 reported having national curricula in fourth-grade science. Similar to the eighth grade, fourth-grade science curricula in Australia and the United States were determined at the state level, and school boards in Belgium (Flemish) developed their own curricula based on offi -cially defi ned fi nal attainment levels. Among benchmarkers, Indiana, Ontario, and Quebec had system-wide curricula determined at the state or provincial level, respectively.
At the time of the TIMSS 2003 assessment, the offi cial fourth-grade science curriculum had been in place for fi ve years or less in 20 of the participants, and nearly half of those were in revision. Of the nine participating entities with a fourth-grade science curriculum of more than fi ve years standing, fi ve were revising it at the time of the assess-ment. As at the eighth grade, curriculum renewal in Australia and the United States varied by state and was generally an ongoing process.
Public examinations with consequences for individual students are another common feature of many countries’ educational systems. Although public examinations can provide information of interest to national and regional policymakers, their main purpose is to make decisions about individual students, such as promotion from one grade to another, entry to a higher school system, or graduation from second-ary school. Among all TIMSS 2003 participants, 39 countries and one benchmarking entity reported having public examinations in science at one or more grades. Grade 12 was the most prevalent, with 33 coun-tries giving students public examinations in science at this level.
SOU
RCE:
IEA
's T
rend
s in
Inte
rnat
iona
l Mat
hem
atic
s an
d Sc
ienc
e St
udy
(TIM
SS) 2
003
CHAPTER 5: THE SCIENCE CURRICULUM TIMSS2003
GradeSCIENCE
TIMSS & PIRLS INTERNATIONAL STUDY CENTER, LYNCH SCHOOL OF EDUCATION, BOSTON COLLEGE 183
Countries NationalCurriculum
Year CurriculumIntroduced
CurriculumUnder Revision
Public Exams withConsequencesfor Individual
Students
Grades Tested inPublic Exams
Armenia k 2000 j k 10Australia j Varies by state;
generally ongoingprocess
k k 12
Bahrain k 2001 k k 9,10,11,12
1 Belgium (Flemish) j 1997 j j -Botswana k 1996 k k 7,10,12Bulgaria k 1997 k k 12Chile k 2002 k k 12Chinese Taipei k 1997 k k 9,12
Cyprus k 1990 k k 12Egypt k 2002 k k 5,8,10,11England k 2000 j k 10,11,12Estonia k 1997, revised 2002 k k 9,12
Ghana k 1987, revised 2001 j k 9Hong Kong, SAR k 2000 j k Biology 11,13; Chemistry 11,13; Physics
11,13; Human Biology 11,13
Hungary k 2000 j k 12Indonesia k 1994 k k 6,9,12Iran, Islamic Rep. of k 2002 j k 5,8,11,12Israel k 1998 j k 11,12
2 Italy k 1979, revised 2002 j k 5,8,13Japan k 2002 j j -Jordan k 1994 k k 12Korea, Rep. of k 2002 j k 9,12Latvia k 1997 and 2001 k k 6,9,12Lebanon k 1999 k j -Lithuania k 1997, revised 2003 k k Biology 12; Chemistry 12; Physics 12;
Geography 12
Macedonia, Rep. of k 1994 j k 12Malaysia k 1990 k k 6,9,11,13Moldova, Rep. of k 2003-2004 j k 9,11,12Morocco k 1992-1993 k k 12Netherlands k 1998 k k 10,11,12New Zealand k 1995 k k 10,11,12Norway k 1997 j j -Palestinian Nat'l Auth. k 2002-2003 k k 12Philippines k 2002 j k 4,8Romania k 1999 k k 12Russian Federation k 1998 k k By choice: Biology 9,11; Chemistry 9,11;
Physics 9,11; Geography 9,11
Saudi Arabia k 1999 k k 12Scotland k 2000 j k 10,11,12Serbia k 1984-1985 k j -
Singapore k 2001 k k 6,10,12Slovak Republic k 1999 k j -Slovenia k 1999 for sample of
schools; 2003 for allschools
k j -
South Africa k 2001 (introduced in1998 for prior
grades)
k k 12
Sweden k 1994, revised 2000 j j -Syrian Arab Republic k 1987 for Physics and
Chemistry; 2003 forBiology
j k 9
Tunisia k 2000 k k 9,12United States j Varies by state;
generally ongoingprocess
k j -
Benchmarking ParticipantsBasque Country, Spain k 1992 k j -Indiana State, US k 2000 j j -Ontario Province, Can. k 1998 j k 3,6,9Quebec Province, Can. k 1987 k j -
CountryreportedYes for theparticularoption
k
jCountryreportedNo for theparticularoption
Background data provided by National Research Coordinators.
1 Belgium (Flemish): Although there is no national curriculum there are offi cially defi ned fi nal attain-ment levels (comparable to educational standards); based on the fi nal attainment levels, school boards develop their own curricula.
2 Italy: Beginning with the 2004-05 academic year, students in grade 5 will not be tested in public examinations.
A dash (–) indicates comparable data are not available.
88Exhibit 5.2: Intended Science Curriculum
SOU
RCE:
IEA
's T
rend
s in
Inte
rnat
iona
l Mat
hem
atic
s an
d Sc
ienc
e St
udy
(TIM
SS) 2
003
TIMSS & PIRLS INTERNATIONAL STUDY CENTER, LYNCH SCHOOL OF EDUCATION, BOSTON COLLEGE184
CHAPTER 5: THE SCIENCE CURRICULUM
TIMSS2003
Grade88SCIENCE
Countries NationalCurriculum
Year CurriculumIntroduced
CurriculumUnder Revision
Public Exams withConsequencesfor Individual
Students
Grades Tested inPublic Exams
Armenia k 2000 j k 10Australia j Varies by state;
generally ongoingprocess
k k 12
1 Belgium (Flemish) j 2001-2002 j j -Chinese Taipei k 2002 k k 9,12Cyprus k 1996 j k 12England k 2000 j k 10,11,12Hong Kong, SAR k 1996 k k Biology 11,13; Chemistry 11,13;
Physics 11,13; Human Biology 11,13
Hungary k 2000 j k 12Iran, Islamic Rep. of k 1997 k k 5,8,11,12
2 Italy k 1985, revised 2002 k k 5,8,13Japan k 2002 j j -Latvia k 2001 j k 6,9,12Lithuania k 1997, revised 2003 k k Biology 12; Chemistry 12;
Physics 12; Geography 12
Moldova, Rep. of k 1999-2000 j k 9,11,12Morocco k 2002-2003 j k 12Netherlands k 1998 k k 10,11,12New Zealand k 1995 k k 10,11,12Norway k 1997 j j -
Philippines k 2002-2003 k j -Russian Federation k 1998 k k By choice: Biology 9,11; Chemistry 9,11;
Physics 9,11; Geography 9,11
Scotland k 2000 j k 10,11,12Singapore k 2002 k k 6,10,12Slovenia k 1999 for sample of
schools; 2003 for allschools
k j -
Tunisia k 2000 k k 9,12United States j Varies by state;
generally ongoingprocess
k j -
Yemen k 2000-2001 k k 9,12
Benchmarking ParticipantsIndiana State, US k 2000 j j -Ontario Province, Can. k 1998 j k 3,6,9Quebec Province, Can. k 2001 j j -
CountryreportedYes for theparticularoption
k
jCountryreportedNo for theparticularoption
Exhibit 5.2: Intended Science Curriculum
Background data provided by National Research Coordinators.
1 Belgium (Flemish): Although there is no national curriculum there are offi cially defi ned fi nal attain-ment levels (comparable to educational standards); based on the fi nal attainment levels, school boards develop their own curricula.
2 Italy: Beginning with the 2004-05 academic year, students in grade 5 will not be tested in public examinations.
A dash (–) indicates comparable data are not available.

TIMSS & PIRLS INTERNATIONAL STUDY CENTER, LYNCH SCHOOL OF EDUCATION, BOSTON COLLEGE 185
CHAPTER 5: THE SCIENCE CURRICULUM
How Do Countries Support and Monitor Curriculum Implementation?
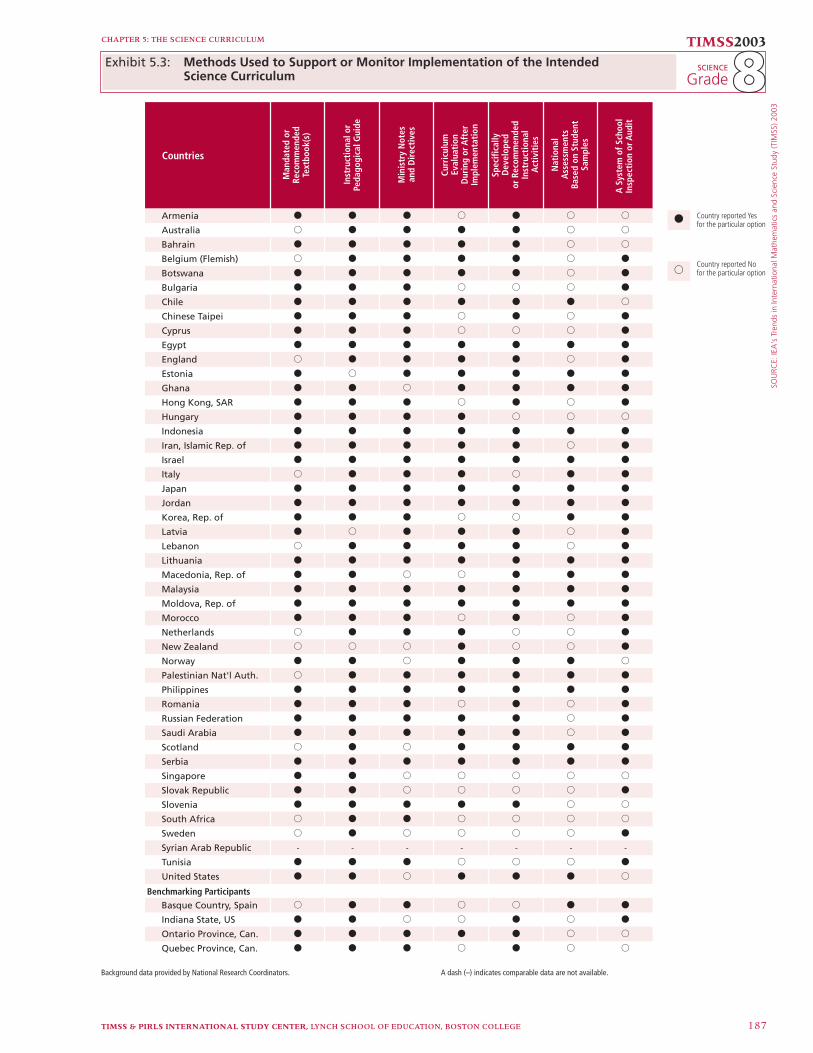
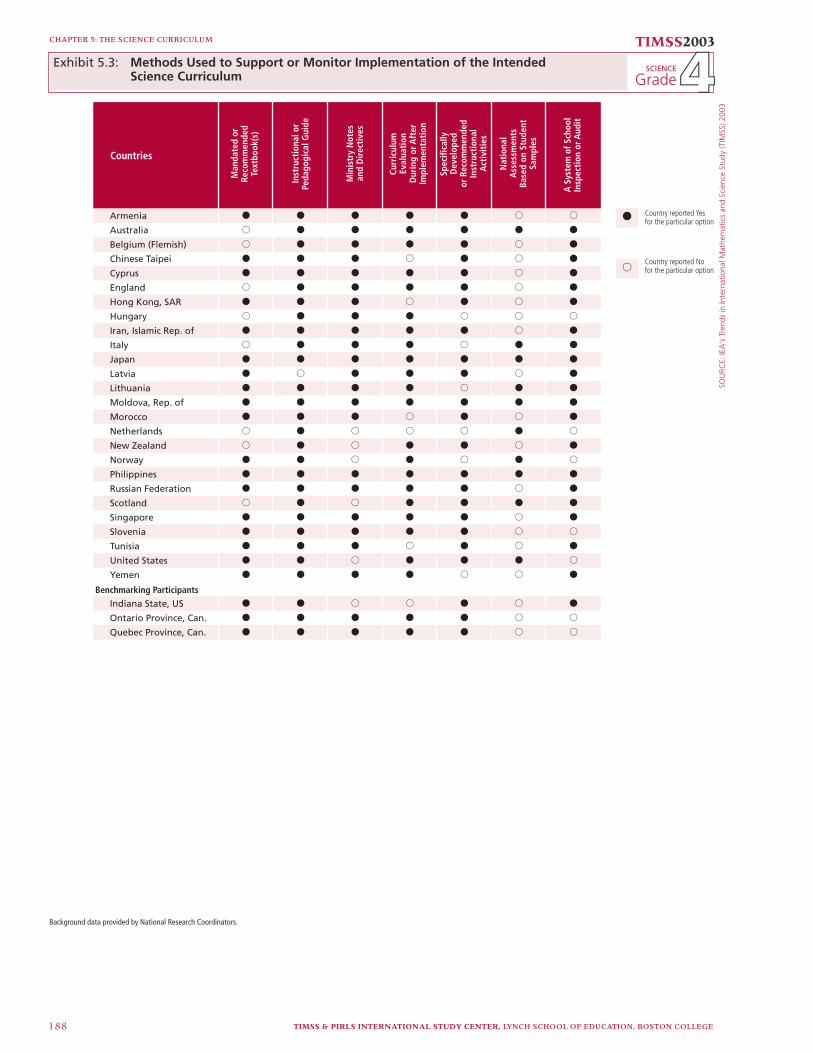
Education systems use different ways to achieve the best match between the intended and the implemented curriculum. The use of public exam-inations as a mechanism to support and monitor implementation of the intended curriculum is prevalent among many countries, as noted above. Another way to help ensure alignment is to develop instruc-tional materials, such as textbooks, instructional guides, and minis-try notes, tailored to the curriculum. In addition, countries can also monitor curriculum implementation by means of national assessments based on student samples, and by systems of school inspection or audit. The different methods used by the TIMSS 2003 countries are shown in Exhibit 5.3, fi rst for countries that participated at the eighth grade and then for those at the fourth grade.
Of the methods for supporting and monitoring curriculum implementation shown in Exhibit 5.3, at the eighth grade, 11 par-ticipants reported using all 7, and an additional 25 used 5 or 6. The most widely used methods were instructional or pedagogical guides (47 participants) and ministry notes and directives (40 participants). Also commonly used were a system of school inspection or audit (38 participants), mandated or recommended textbooks (38 participants), curricular evaluation during or after implementation (35 participants), and the use of specifi cally developed or recommended instructional activities (33 participants). The least widely used method was national assessments based on student samples (21 participants).
At the fourth grade, three participants reported using all seven methods shown in Exhibit 5.3 to support and monitor curriculum implementation, and 21 participants used fi ve or six. The most widely used methods were instructional or pedagogical guides (28 partici-pants), ministry notes and directives (23 participants), and specifi cally developed or recommended instructional activities (23 participants). The use of curriculum evaluation during or after implementation as a means of monitoring the fourth-grade science curriculum was reported
TIMSS & PIRLS INTERNATIONAL STUDY CENTER, LYNCH SCHOOL OF EDUCATION, BOSTON COLLEGE186
CHAPTER 5: THE SCIENCE CURRICULUM
by 22 participants. A system of school inspection or audit was used by 21 participants and mandated or recommended textbooks also by 21 participants. Similar to the eighth grade, the least widely used method at the fourth grade was national assessment based on student samples (10 participants).
An additional method countries often use to support curriculum implementation is to provide science teachers with specifi c preparation in how to teach the intended curriculum as part of their pre-service and/or in-service education. These data are given in Exhibit 6.5 of the next chapter.
SOU
RCE:
IEA
's T
rend
s in
Inte
rnat
iona
l Mat
hem
atic
s an
d Sc
ienc
e St
udy
(TIM
SS) 2
003
CHAPTER 5: THE SCIENCE CURRICULUM
TIMSS2003
GradeSCIENCE
TIMSS & PIRLS INTERNATIONAL STUDY CENTER, LYNCH SCHOOL OF EDUCATION, BOSTON COLLEGE 187
Countries
Armenia k k k j k j j
Australia j k k k k j j
Bahrain k k k k k j j
Belgium (Flemish) j k k k k j k
Botswana k k k k k j k
Bulgaria k k k j j j k
Chile k k k k k k j
Chinese Taipei k k k j k j k
Cyprus k k k j j j k
Egypt k k k k k k k
England j k k k k j k
Estonia k j k k k k k
Ghana k k j k k k k
Hong Kong, SAR k k k j k j k
Hungary k k k k j j j
Indonesia k k k k k k k
Iran, Islamic Rep. of k k k k k j k
Israel k k k k k k k
Italy j k k k j k k
Japan k k k k k k k
Jordan k k k k k k k
Korea, Rep. of k k k j j k k
Latvia k j k k k j k
Lebanon j k k k k j k
Lithuania k k k k k k k
Macedonia, Rep. of k k j j k k k
Malaysia k k k k k k k
Moldova, Rep. of k k k k k k k
Morocco k k k j k j k
Netherlands j k k k j j k
New Zealand j j j k j j k
Norway k k j k k k j
Palestinian Nat'l Auth. j k k k k k k
Philippines k k k k k k k
Romania k k k j k j k
Russian Federation k k k k k j k
Saudi Arabia k k k k k j k
Scotland j k j k k k k
Serbia k k k k k k k
Singapore k k j j j j j
Slovak Republic k k j j j j k
Slovenia k k k k k j j
South Africa j k k j j j j
Sweden j k j j j j k
Syrian Arab Republic - - - - - - -
Tunisia k k k j j j k
United States k k j k k k j
Benchmarking ParticipantsBasque Country, Spain j k k j j k k
Indiana State, US k k j j k j k
Ontario Province, Can. k k k k k j j
Quebec Province, Can. k k k j k j j
Country reported Yesfor the particular optionk
Country reported Nofor the particular optionj
Man
date
d or
Reco
mm
ende
dTe
xtbo
ok(s
)
Inst
ruct
iona
l or
Peda
gogi
cal G
uide
Min
istr
y N
otes
and
Dir
ecti
ves
Curr
icul
umEv
alua
tion
Dur
ing
or A
fter
Impl
emen
tati
on
Spec
ifica
llyD
evel
oped
or R
ecom
men
ded
Inst
ruct
iona
lA
ctiv
itie
s
Nat
iona
lA
sses
smen
tsBa
sed
on S
tude
ntSa
mpl
es
A S
yste
m o
f Sch
ool
Insp
ecti
on o
r Aud
it
Exhibit 5.3:
Methods Used to Support or Monitor Implementation of the Intended Science Curriculum
Background data provided by National Research Coordinators. A dash (–) indicates comparable data are not available.
88
SOU
RCE:
IEA
's T
rend
s in
Inte
rnat
iona
l Mat
hem
atic
s an
d Sc
ienc
e St
udy
(TIM
SS) 2
003
TIMSS & PIRLS INTERNATIONAL STUDY CENTER, LYNCH SCHOOL OF EDUCATION, BOSTON COLLEGE188
CHAPTER 5: THE SCIENCE CURRICULUM TIMSS2003
GradeSCIENCE
Countries
Armenia k k k k k j j
Australia j k k k k k k
Belgium (Flemish) j k k k k j k
Chinese Taipei k k k j k j k
Cyprus k k k k k j k
England j k k k k j k
Hong Kong, SAR k k k j k j k
Hungary j k k k j j j
Iran, Islamic Rep. of k k k k k j k
Italy j k k k j k k
Japan k k k k k k k
Latvia k j k k k j k
Lithuania k k k k j k k
Moldova, Rep. of k k k k k k k
Morocco k k k j k j k
Netherlands j k j j j k j
New Zealand j k j k k j k
Norway k k j k j k j
Philippines k k k k k k k
Russian Federation k k k k k j k
Scotland j k j k k k k
Singapore k k k k k j k
Slovenia k k k k k j j
Tunisia k k k j k j k
United States k k j k k k j
Yemen k k k k j j k
Benchmarking ParticipantsIndiana State, US k k j j k j k
Ontario Province, Can. k k k k k j j
Quebec Province, Can. k k k k k j j
Country reported Yesfor the particular optionk
Country reported Nofor the particular optionj
Man
date
d or
Reco
mm
ende
dTe
xtbo
ok(s
)
Inst
ruct
iona
l or
Peda
gogi
cal G
uide
Min
istr
y N
otes
and
Dir
ecti
ves
Curr
icul
umEv
alua
tion
Dur
ing
or A
fter
Impl
emen
tati
on
Spec
ifica
llyD
evel
oped
or R
ecom
men
ded
Inst
ruct
iona
lA
ctiv
itie
s
Nat
iona
lA
sses
smen
tsBa
sed
on S
tude
ntSa
mpl
es
A S
yste
m o
f Sch
ool
Insp
ecti
on o
r Aud
it
Background data provided by National Research Coordinators.
44Methods Used to Support or Monitor Implementation of the Intended Science Curriculum
Exhibit 5.3:

TIMSS & PIRLS INTERNATIONAL STUDY CENTER, LYNCH SCHOOL OF EDUCATION, BOSTON COLLEGE 189
CHAPTER 5: THE SCIENCE CURRICULUM
How Much Instructional Time is Intended for Science?
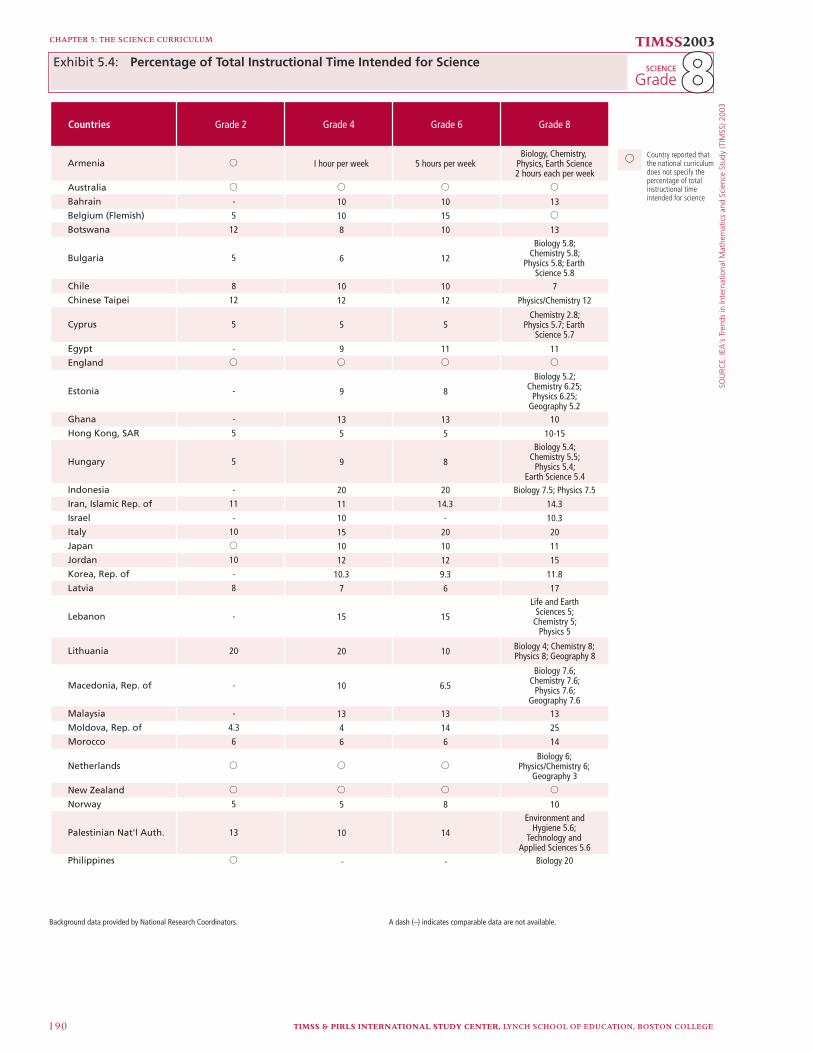
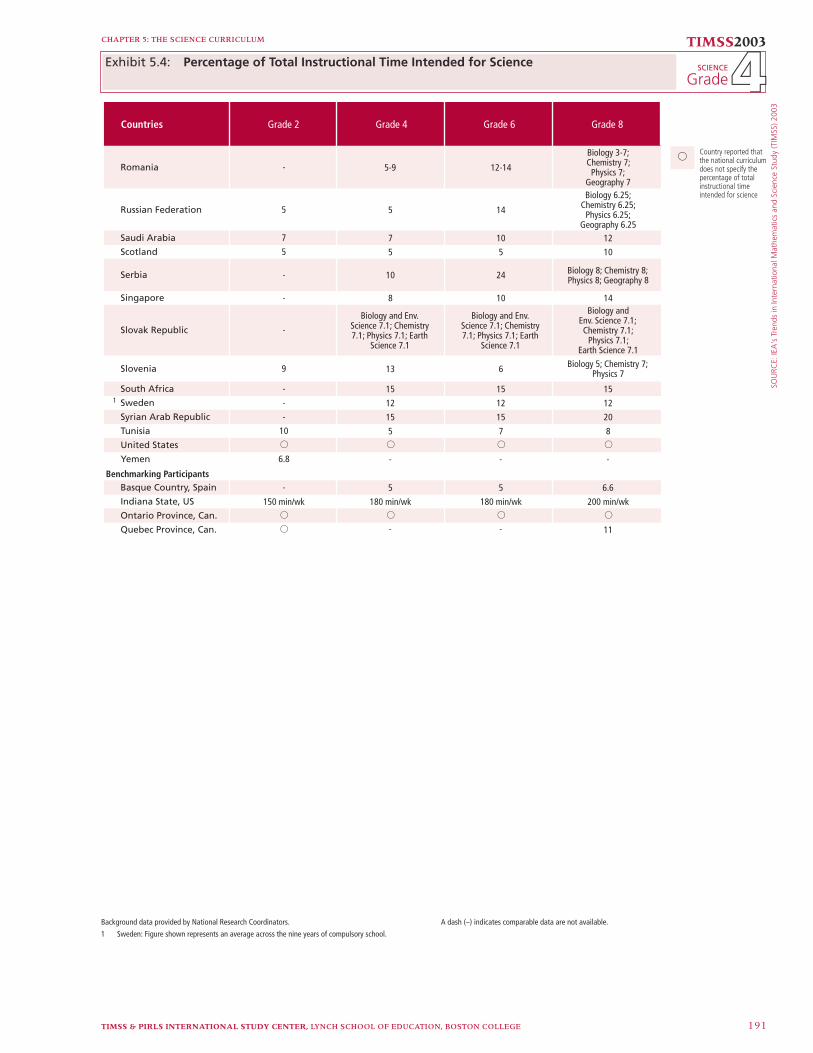
Many countries designate in their intended curriculum the percentage of total instructional time that should be devoted to science and other subjects at different grade levels. The percentage of instructional time designated for science in the intended curriculum for grades 2, 4, 6, and 8 is shown in Exhibit 5.4 for all TIMSS 2003 participants.2 These data provide a good estimate of students’ intended instructional time for science across the primary and middle school years. The general pattern across countries shows that the percentage of time increases or remains the same from grade 2 to grade 4, from grade 4 to grade 6, and from grade 6 to grade 8, with the largest increase usually between grades 6 and 8. Interestingly, the reverse pattern holds for mathemat-ics, with proportionally less instructional time designated at the higher than at the lower grades.3 Where decreases occurred in the percent-age of instructional time designated for science, they generally were between grades 2 and 4. Not all countries conformed to this general pattern, however. The percentage of total instructional time specifi ed for science ranged from 4 to 20 percent at second grade, from 4 to 28 percent at fourth grade, from 5 to 28 percent at sixth grade, and from 7 to 32 percent at eighth grade. Schools’ and teachers’ reports of the percentage of instructional time actually devoted to science at grades 4 and 8, shown in Exhibit 7.3, generally correspond with the intended percentages reported in Exhibit 5.4, although slightly more so at eighth grade than at fourth grade.
2 Some of the countries that teach science as separate subjects at eighth grade provided the percentages individually for each subject, rather than as a total.
3 Mullis, I.V.S., Martin, M.O., Gonzalez, E.J., and Chrostowski, S.J., (2004), TIMSS 2003 International Mathematics Report: Findings from IEA’s Trends in International Mathematics and Science Study at the Eighth and Fourth Grades, Chestnut Hill, MA: Boston College.
SOU
RCE:
IEA
's T
rend
s in
Inte
rnat
iona
l Mat
hem
atic
s an
d Sc
ienc
e St
udy
(TIM
SS) 2
003
TIMSS & PIRLS INTERNATIONAL STUDY CENTER, LYNCH SCHOOL OF EDUCATION, BOSTON COLLEGE190
CHAPTER 5: THE SCIENCE CURRICULUM
TIMSS2003
Grade88SCIENCE Exhibit 5.4:
Countries
Armenia
Australia
Bahrain
Belgium (Flemish)
Botswana
Bulgaria
Chile
Chinese Taipei
Cyprus
Egypt
England
Estonia
Ghana
Hong Kong, SAR
Hungary
Indonesia
Iran, Islamic Rep. of
Israel
Italy
Japan
Jordan
Korea, Rep. of
Latvia
Lebanon
Lithuania
Macedonia, Rep. of
Malaysia
Moldova, Rep. of
Morocco
Netherlands
New Zealand
Norway
Palestinian Nat'l Auth.
Philippines
I hour per week
10
10
8
6
10
12
5
9
9
13
5
9
20
11
10
15
10
12
10.3
7
15
20
10
13
4
6
5
10
j
j
j
j
5 hours per week
10
15
10
12
10
12
5
11
8
13
5
8
20
14.3
-
20
10
12
9.3
6
15
10
6.5
13
14
6
8
14
j
j
j
j
-
5
12
5
8
12
5
-
-
-
5
5
-
11
-
10
10
-
8
-
20
-
- -
-
4.3
6
5
13
j
j
j
j
j
j
j
Biology, Chemistry,Physics, Earth Science2 hours each per week
13
13Biology 5.8;
Chemistry 5.8;Physics 5.8; Earth
Science 5.87
Physics/Chemistry 12
Chemistry 2.8;Physics 5.7; Earth
Science 5.7
11
Biology 5.2;Chemistry 6.25;
Physics 6.25;Geography 5.2
10
10-15Biology 5.4;
Chemistry 5.5;Physics 5.4;
Earth Science 5.4Biology 7.5; Physics 7.5
14.3
10.3
20
11
15
11.8
17Life and Earth
Sciences 5;Chemistry 5;
Physics 5
Biology 4; Chemistry 8;Physics 8; Geography 8
Biology 7.6;Chemistry 7.6;
Physics 7.6;Geography 7.6
13
25
14
Biology 6;Physics/Chemistry 6;
Geography 3
10Environment and
Hygiene 5.6;Technology and
Applied Sciences 5.6
j
j
j
j
Biology 20
Grade 2 Grade 4 Grade 6 Grade 8
jCountry reported thatthe national curriculumdoes not specify thepercentage of totalinstructional timeintended for science
Percentage of Total Instructional Time Intended for Science
Background data provided by National Research Coordinators. A dash (–) indicates comparable data are not available.
SOU
RCE:
IEA
's T
rend
s in
Inte
rnat
iona
l Mat
hem
atic
s an
d Sc
ienc
e St
udy
(TIM
SS) 2
003
CHAPTER 5: THE SCIENCE CURRICULUM
TIMSS2003
GradeSCIENCE
TIMSS & PIRLS INTERNATIONAL STUDY CENTER, LYNCH SCHOOL OF EDUCATION, BOSTON COLLEGE 191
44Exhibit 5.4:
Countries
Romania
Russian Federation
Saudi Arabia
Scotland
Serbia
Singapore
Slovak Republic
Slovenia
South Africa
1 Sweden
Syrian Arab Republic
Tunisia
United States
Yemen
Benchmarking ParticipantsBasque Country, Spain
Indiana State, US
Ontario Province, Can.
5-9
5
7
5
10
8
Biology and Env.Science 7.1; Chemistry7.1; Physics 7.1; Earth
Science 7.1
13
15
12
15
5
j
-
5
180 min/wk
j
12-14
14
10
5
24
10
Biology and Env.Science 7.1; Chemistry7.1; Physics 7.1; Earth
Science 7.1
6
15
12
15
7
j
-
- -
5
180 min/wk
j
Quebec Province, Can.
-
5
7
5
-
-
-
9
-
-
-
10
j
6.8
-
150 min/wk
j
j
Biology 3-7;Chemistry 7;
Physics 7;Geography 7Biology 6.25;
Chemistry 6.25;Physics 6.25;
Geography 6.2512
10
Biology 8; Chemistry 8;Physics 8; Geography 8
14Biology and
Env. Science 7.1;Chemistry 7.1;
Physics 7.1;Earth Science 7.1
Biology 5; Chemistry 7;Physics 7
15
12
20
8
j
-
6.6
200 min/wk
j
11
Grade 2 Grade 4 Grade 6 Grade 8
jCountry reported thatthe national curriculumdoes not specify thepercentage of totalinstructional timeintended for science
Percentage of Total Instructional Time Intended for Science
Background data provided by National Research Coordinators.
1 Sweden: Figure shown represents an average across the nine years of compulsory school.
A dash (–) indicates comparable data are not available.
TIMSS & PIRLS INTERNATIONAL STUDY CENTER, LYNCH SCHOOL OF EDUCATION, BOSTON COLLEGE192
CHAPTER 5: THE SCIENCE CURRICULUM
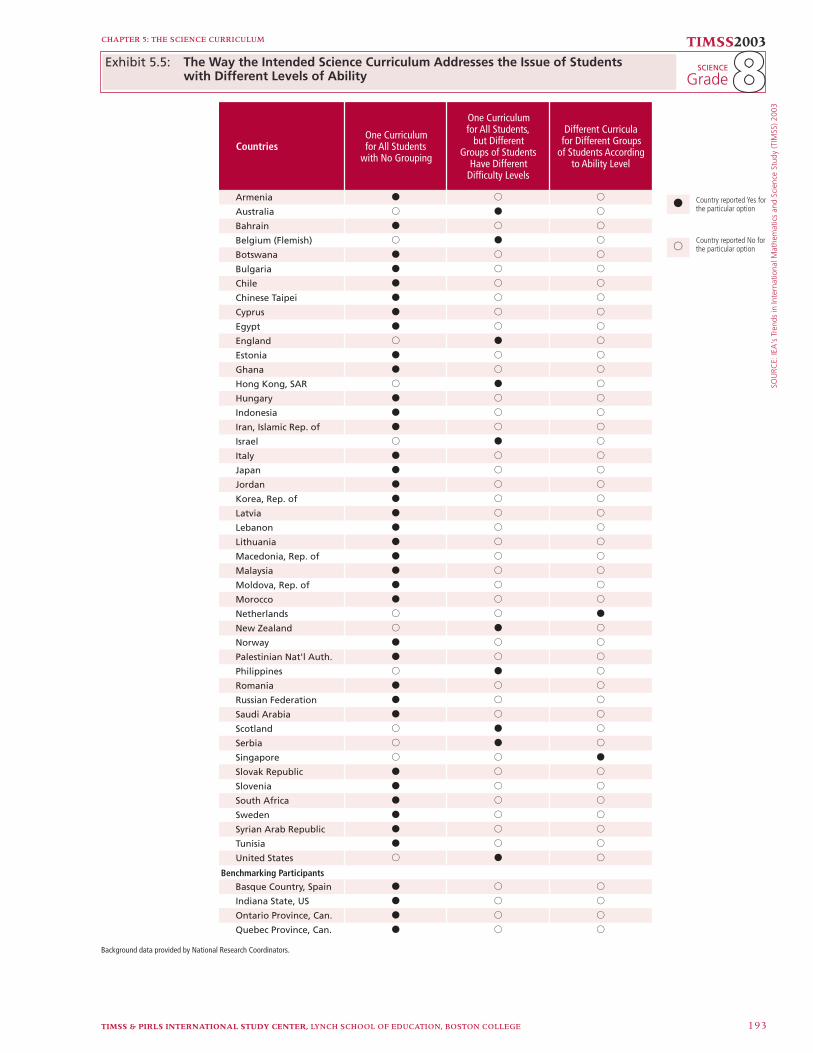
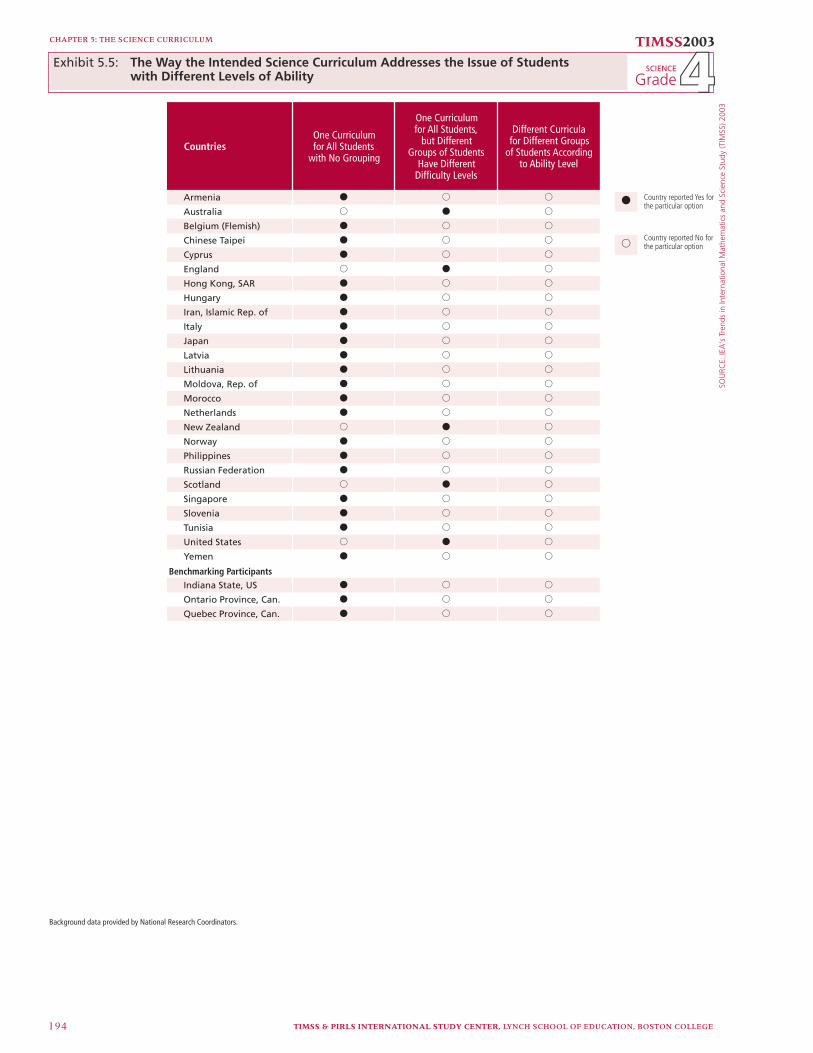
Do Countries Differentiate the Intended Science Curriculum for Students with Different Levels of Ability?
The challenge of maximizing opportunity to learn for students with widely varying abilities is met differently in different countries. Exhibit 5.5 indicates how countries addressed this issue in organizing the intended science curriculum, fi rst for countries that participated at the eighth grade and then for those at the fourth grade.
The most common approach at the eighth grade, reported by 39 participants, was to have the same intended curriculum for all students with no grouping of students. Nine countries reported having one curriculum for all students, but at different diffi culty levels for groups of students with different ability levels. Four coun-tries – Belgium (Flemish), the Netherlands, the Russian Federation, and Singapore – had different curricula for different groups of stu-dents according to their ability level.
At the fourth grade, all participants reported having just one science curriculum for all students, and in most cases with no group-ing by ability level. Five countries, Australia, England, New Zealand, Scotland, and the United States, had just one curriculum for all stu-dents, but provide different levels of diffi culty for students of differing ability levels.
SOU
RCE:
IEA
's T
rend
s in
Inte
rnat
iona
l Mat
hem
atic
s an
d Sc
ienc
e St
udy
(TIM
SS) 2
003
CHAPTER 5: THE SCIENCE CURRICULUM TIMSS2003
GradeSCIENCE
TIMSS & PIRLS INTERNATIONAL STUDY CENTER, LYNCH SCHOOL OF EDUCATION, BOSTON COLLEGE 193
CountriesOne Curriculumfor All Students
with No Grouping
One Curriculumfor All Students,
but DifferentGroups of Students
Have DifferentDifficulty Levels
Different Curriculafor Different Groups
of Students Accordingto Ability Level
Armenia k j j
Australia j k j
Bahrain k j j
Belgium (Flemish) j k j
Botswana k j j
Bulgaria k j j
Chile k j j
Chinese Taipei k j j
Cyprus k j j
Egypt k j j
England j k j
Estonia k j j
Ghana k j j
Hong Kong, SAR j k j
Hungary k j j
Indonesia k j j
Iran, Islamic Rep. of k j j
Israel j k j
Italy k j j
Japan k j j
Jordan k j j
Korea, Rep. of k j j
Latvia k j j
Lebanon k j j
Lithuania k j j
Macedonia, Rep. of k j j
Malaysia k j j
Moldova, Rep. of k j j
Morocco k j j
Netherlands j j k
New Zealand j k j
Norway k j j
Palestinian Nat'l Auth. k j j
Philippines j k j
Romania k j j
Russian Federation k j j
Saudi Arabia k j j
Scotland j k j
Serbia j k j
Singapore j j k
Slovak Republic k j j
Slovenia k j j
South Africa k j j
Sweden k j j
Syrian Arab Republic k j j
Tunisia k j j
United States j k j
Benchmarking ParticipantsBasque Country, Spain k j j
Indiana State, US k j j
Ontario Province, Can. k j j
Quebec Province, Can. k j j
Country reported Yes forthe particular optionk
Country reported No forthe particular optionj
Background data provided by National Research Coordinators.
88Exhibit 5.5: The Way the Intended Science Curriculum Addresses the Issue of Students with Different Levels of Ability
SOU
RCE:
IEA
's T
rend
s in
Inte
rnat
iona
l Mat
hem
atic
s an
d Sc
ienc
e St
udy
(TIM
SS) 2
003
TIMSS & PIRLS INTERNATIONAL STUDY CENTER, LYNCH SCHOOL OF EDUCATION, BOSTON COLLEGE194
CHAPTER 5: THE SCIENCE CURRICULUM TIMSS2003
GradeSCIENCE
CountriesOne Curriculumfor All Students
with No Grouping
One Curriculumfor All Students,
but DifferentGroups of Students
Have DifferentDifficulty Levels
Different Curriculafor Different Groups
of Students Accordingto Ability Level
Armenia k j j
Australia j k j
Belgium (Flemish) k j j
Chinese Taipei k j j
Cyprus k j j
England j k j
Hong Kong, SAR k j j
Hungary k j j
Iran, Islamic Rep. of k j j
Italy k j j
Japan k j j
Latvia k j j
Lithuania k j j
Moldova, Rep. of k j j
Morocco k j j
Netherlands k j j
New Zealand j k j
Norway k j j
Philippines k j j
Russian Federation k j j
Scotland j k j
Singapore k j j
Slovenia k j j
Tunisia k j j
United States j k j
Yemen k j j
Benchmarking ParticipantsIndiana State, US k j j
Ontario Province, Can. k j j
Quebec Province, Can. k j j
Country reported Yes forthe particular optionk
Country reported No forthe particular optionj
Background data provided by National Research Coordinators.
44The Way the Intended Science Curriculum Addresses the Issue of Students with Different Levels of Ability
Exhibit 5.5:
TIMSS & PIRLS INTERNATIONAL STUDY CENTER, LYNCH SCHOOL OF EDUCATION, BOSTON COLLEGE 195
CHAPTER 5: THE SCIENCE CURRICULUM
What Approaches and Processes Do Countries Emphasize in their Intended Science Curriculum?
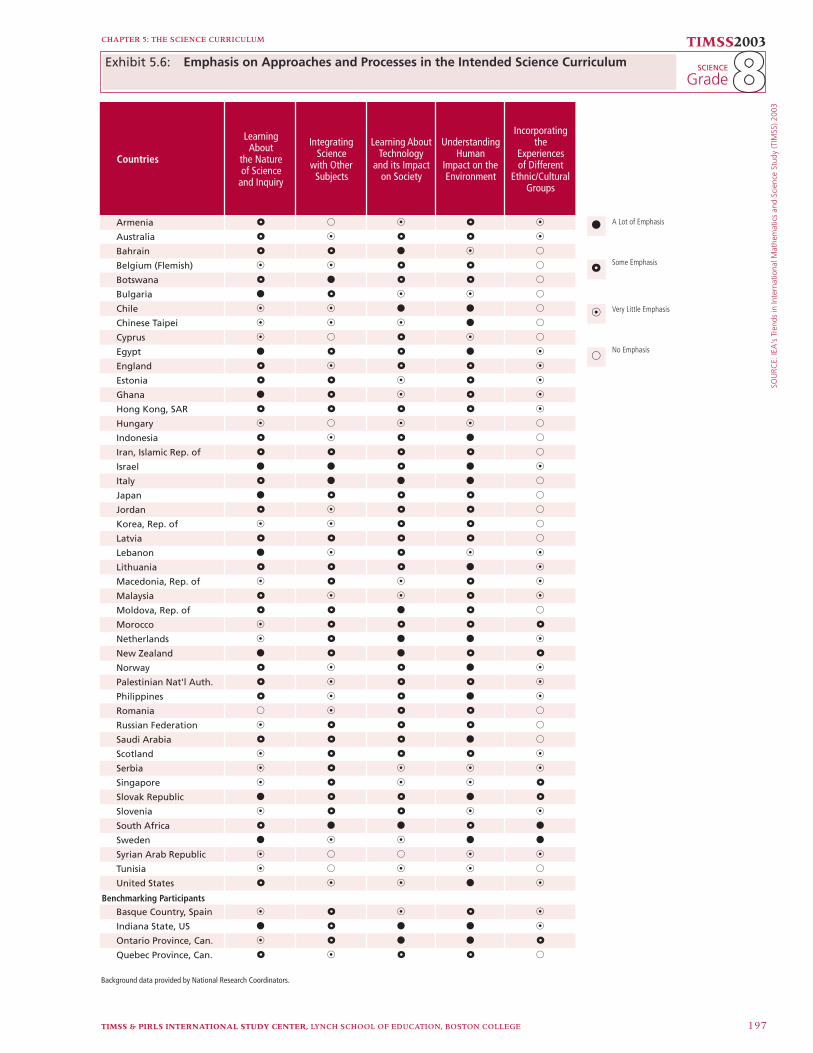
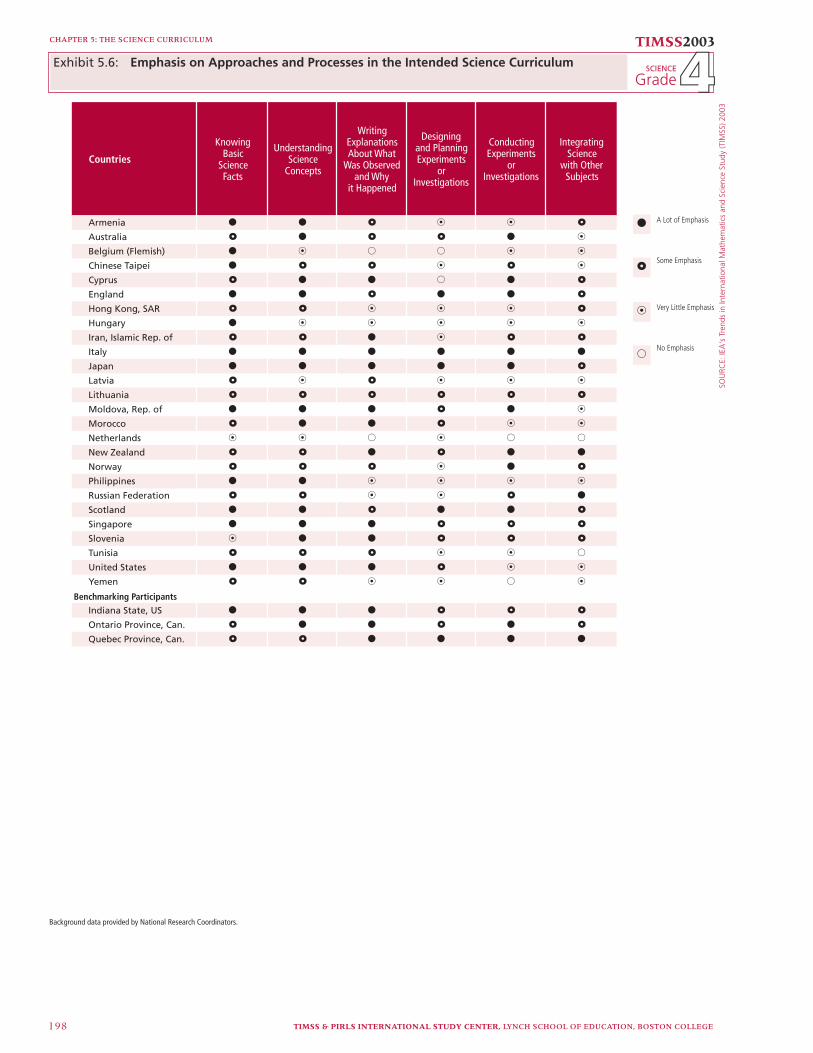
Exhibit 5.6 indicates the relative emphasis given to various aspects of science instruction in the intended curriculum of participating coun-tries, for both eighth and fourth grade. At the eighth grade, “a lot of emphasis” was most commonly placed on understanding science concepts (34 participants) and knowing basic science facts (35 partici-pants). Considerable emphasis also was placed on writing explanations about what was observed and why it happened (20 participants).
Less emphasis was placed internationally on experimental work, with conducting experiments or investigations emphasized a lot in the curricula of 16 participants, formulating hypotheses or predictions to be tested in the curricula of 12 participants, and designing and planning experiments or investigations in the curricula of 9 participants.
Understanding human impact on the environment was given a lot of emphasis in the intended eighth-grade curriculum of 16 par-ticipants, and learning about technology and its impact on society in that of 9 participants. Learning about the nature of science and inquiry received a lot of emphasis in 10 participating entities.
Relative to the other approaches and processes, participants reported placing less emphasis on integrating science with other sub-jects and incorporating the experiences of different ethnic/cultural groups. Only four participants (Botswana, Israel, Italy, and South Africa) reported placing a lot of emphasis on integrating science, and just two countries – South Africa and Sweden – reported placing a lot of emphasis on the multicultural approach in the intended curriculum.
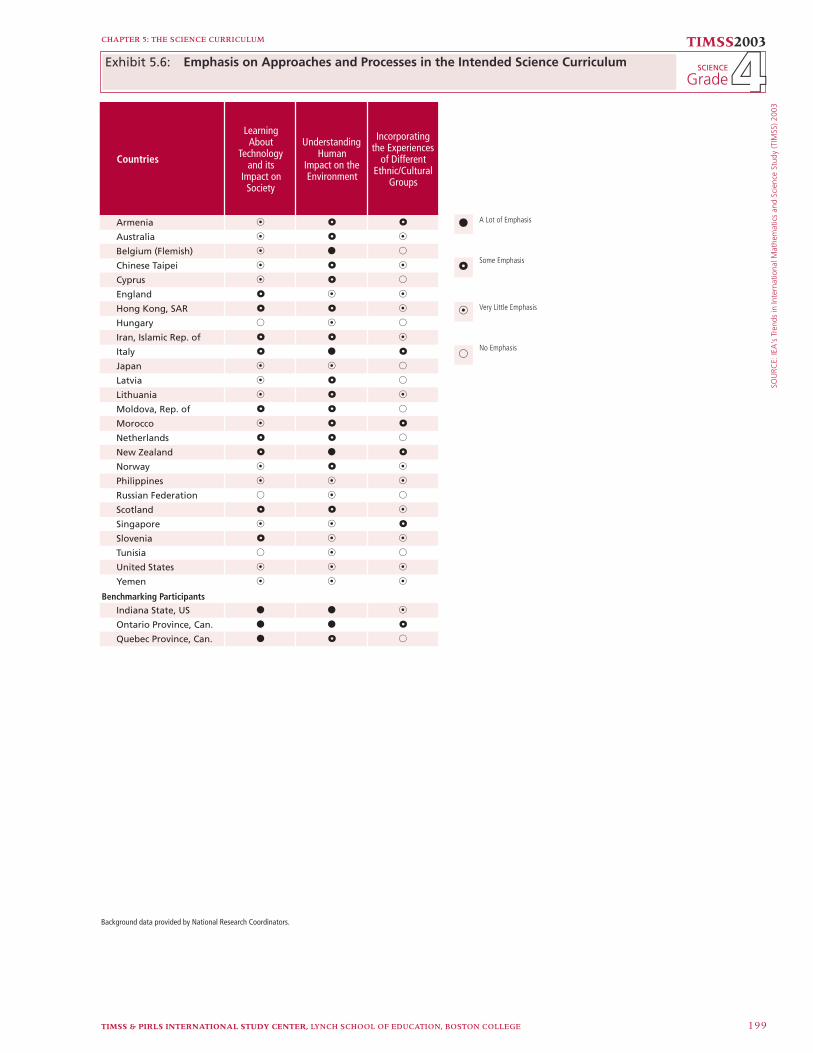
In the intended science curriculum at the fourth grade, most emphasis was placed on understanding science concepts (15 partici-pants emphasized a lot), knowing basic science facts (13 participants), and writing explanations about what was observed and why it hap-pened (13 participants). Conducting experiments or investigations was given a lot of emphasis in 11 participating entities. Designing and

SOU
RCE:
IEA
's T
rend
s in
Inte
rnat
iona
l Mat
hem
atic
s an
d Sc
ienc
e St
udy
(TIM
SS) 2
003
TIMSS & PIRLS INTERNATIONAL STUDY CENTER, LYNCH SCHOOL OF EDUCATION, BOSTON COLLEGE196
CHAPTER 5: THE SCIENCE CURRICULUM
TIMSS2003
Grade88SCIENCE Exhibit 5.6:
Countries
KnowingBasic
ScienceFacts
UnderstandingScience
Concepts
WritingExplanationsAbout What
Was Observedand Why itHappened
FormulatingHypotheses
or PredictionsTo Be Tested
Designing andPlanning
Experimentsor Investigations
ConductingExperiments
or Investigations
Armenia k p p n n n
Australia k k k p p k
Bahrain k k k k p k
Belgium (Flemish) k p p n n n
Botswana k k n n p p
Bulgaria p n p n p n
Chile k k p p n k
Chinese Taipei k k p n n n
Cyprus k p p p n p
Egypt k k k k k k
England k k p p k k
Estonia k p p n n p
Ghana k k k p p p
Hong Kong, SAR k k p p p p
Hungary k p n n n n
Indonesia p p p n p p
Iran, Islamic Rep. of p p k p p p
Israel p k p p p p
Italy k k k k k k
Japan k k k k k k
Jordan k k p p n k
Korea, Rep. of k k k p p p
Latvia p p p n n p
Lebanon p p p n p p
Lithuania k k p p p p
Macedonia, Rep. of p k n n n p
Malaysia k k p p p p
Moldova, Rep. of k p p p p p
Morocco p k p p p n
Netherlands p p p p p p
New Zealand p k k k k k
Norway p p p n p k
Palestinian Nat'l Auth. p k p n p p
Philippines p k k k p p
Romania k k p p n p
Russian Federation k k p n n p
Saudi Arabia k k k p p k
Scotland k k k p p p
Serbia k k n n n n
Singapore k k k n p k
Slovak Republic k k k k p p
Slovenia n k k n p p
South Africa p p n n p p
Sweden k k p k k k
Syrian Arab Republic k p k n j j
Tunisia p p p p n n
United States k k k k k k
Benchmarking ParticipantsBasque Country, Spain k k p n n n
Indiana State, US k k k k k p
Ontario Province, Can. p k k k k k
Quebec Province, Can. k k k k p k
A Lot of Emphasisk
Some Emphasisp
Very Little Emphasisn
No Emphasisj
Emphasis on Approaches and Processes in the Intended Science Curriculum
Background data provided by National Research Coordinators.
SOU
RCE:
IEA
's T
rend
s in
Inte
rnat
iona
l Mat
hem
atic
s an
d Sc
ienc
e St
udy
(TIM
SS) 2
003
CHAPTER 5: THE SCIENCE CURRICULUM TIMSS2003
GradeSCIENCE
TIMSS & PIRLS INTERNATIONAL STUDY CENTER, LYNCH SCHOOL OF EDUCATION, BOSTON COLLEGE 197
Countries
LearningAbout
the Natureof Science
and Inquiry
IntegratingScience
with OtherSubjects
Learning AboutTechnology
and its Impacton Society
UnderstandingHuman
Impact on theEnvironment
Incorporatingthe
Experiencesof Different
Ethnic/CulturalGroups
Armenia p j n p n
Australia p n p p n
Bahrain p p k n j
Belgium (Flemish) n n p p j
Botswana p k p p j
Bulgaria k p n n j
Chile n n k k j
Chinese Taipei n n n k j
Cyprus n j p n j
Egypt k p p k n
England p n p p n
Estonia p p n p n
Ghana k p n p n
Hong Kong, SAR p p p p n
Hungary n j n n j
Indonesia p n p k j
Iran, Islamic Rep. of p p p p j
Israel k k p k n
Italy p k k k j
Japan k p p p j
Jordan p n p p j
Korea, Rep. of n n p p j
Latvia p p p p j
Lebanon k n p n n
Lithuania p p p k n
Macedonia, Rep. of n p n p n
Malaysia p n n p n
Moldova, Rep. of p p k p j
Morocco n p p p p
Netherlands n p k k n
New Zealand k p k p p
Norway p n p k n
Palestinian Nat'l Auth. p n p p n
Philippines p n p k n
Romania j n p p j
Russian Federation n p p p j
Saudi Arabia p p p k j
Scotland n p p p n
Serbia n p n n n
Singapore n p n n p
Slovak Republic k p p k p
Slovenia n p p n n
South Africa p k k p k
Sweden k n n k k
Syrian Arab Republic n j j n n
Tunisia n j n n j
United States p n n k n
Benchmarking ParticipantsBasque Country, Spain n p n p n
Indiana State, US k p k k n
Ontario Province, Can. n p k k p
Quebec Province, Can. p n p p j
A Lot of Emphasisk
Some Emphasisp
Very Little Emphasisn
No Emphasisj
Background data provided by National Research Coordinators.
88Exhibit 5.6: Emphasis on Approaches and Processes in the Intended Science Curriculum
SOU
RCE:
IEA
's T
rend
s in
Inte
rnat
iona
l Mat
hem
atic
s an
d Sc
ienc
e St
udy
(TIM
SS) 2
003
TIMSS & PIRLS INTERNATIONAL STUDY CENTER, LYNCH SCHOOL OF EDUCATION, BOSTON COLLEGE198
CHAPTER 5: THE SCIENCE CURRICULUM TIMSS2003
GradeSCIENCE
Countries
KnowingBasic
ScienceFacts
UnderstandingScience
Concepts
WritingExplanationsAbout What
Was Observedand Why
it Happened
Designingand PlanningExperiments
orInvestigations
ConductingExperiments
orInvestigations
IntegratingScience
with OtherSubjects
Armenia k k p n n p
Australia p k p p k n
Belgium (Flemish) k n j j n n
Chinese Taipei k p p n p n
Cyprus p k k j k p
England k k p k k p
Hong Kong, SAR p p n n n p
Hungary k n n n n n
Iran, Islamic Rep. of p p k n p p
Italy k k k k k k
Japan k k k k k p
Latvia p n p n n n
Lithuania p p p p p p
Moldova, Rep. of k k k p k n
Morocco p k k p n n
Netherlands n n j n j j
New Zealand p p k p k k
Norway p p p n k p
Philippines k k n n n n
Russian Federation p p n n p k
Scotland k k p k k p
Singapore k k k p p p
Slovenia n k k p p p
Tunisia p p p n n j
United States k k k p n n
Yemen p p n n j n
Benchmarking ParticipantsIndiana State, US k k k p p p
Ontario Province, Can. p k k p k p
Quebec Province, Can. p p k k k k
A Lot of Emphasisk
Some Emphasisp
Very Little Emphasisn
No Emphasisj
Background data provided by National Research Coordinators.
Emphasis on Approaches and Processes in the Intended Science Curriculum 44Exhibit 5.6:
SOU
RCE:
IEA
's T
rend
s in
Inte
rnat
iona
l Mat
hem
atic
s an
d Sc
ienc
e St
udy
(TIM
SS) 2
003
CHAPTER 5: THE SCIENCE CURRICULUM TIMSS2003
GradeSCIENCE
TIMSS & PIRLS INTERNATIONAL STUDY CENTER, LYNCH SCHOOL OF EDUCATION, BOSTON COLLEGE 199
44Countries
LearningAbout
Technologyand its
Impact onSociety
UnderstandingHuman
Impact on theEnvironment
Incorporatingthe Experiences
of DifferentEthnic/Cultural
Groups
Armenia n p p
Australia n p n
Belgium (Flemish) n k j
Chinese Taipei n p n
Cyprus n p j
England p n n
Hong Kong, SAR p p n
Hungary j n j
Iran, Islamic Rep. of p p n
Italy p k p
Japan n n j
Latvia n p j
Lithuania n p n
Moldova, Rep. of p p j
Morocco n p p
Netherlands p p j
New Zealand p k p
Norway n p n
Philippines n n n
Russian Federation j n j
Scotland p p n
Singapore n n p
Slovenia p n n
Tunisia j n j
United States n n n
Yemen n n n
Benchmarking ParticipantsIndiana State, US k k n
Ontario Province, Can. k k p
Quebec Province, Can. k p j
A Lot of Emphasisk
Some Emphasisp
Very Little Emphasisn
No Emphasisj
Background data provided by National Research Coordinators.
Emphasis on Approaches and Processes in the Intended Science CurriculumExhibit 5.6:

TIMSS & PIRLS INTERNATIONAL STUDY CENTER, LYNCH SCHOOL OF EDUCATION, BOSTON COLLEGE200
CHAPTER 5: THE SCIENCE CURRICULUM
planning experiments or investigations, integrating science with other subjects, understanding human impact on the environment, and learn-ing about technology and its impact on the environment were among the approaches receiving less emphasis in the intended curriculum, while incorporating the experiences of different ethnic/cultural groups was emphasized least in the fourth-grade science curriculum.
Are the TIMSS Science Topics Included In the Intended Curriculum?
The ability of policymakers to make sound judgments about relative strengths and weaknesses of science education in their systems depends on achievement measures being based, as closely as possible, on what students in their systems have actually been taught. The TIMSS Assess-ment Frameworks and Specifi cations: 2003 served as the basis for the TIMSS 2003 science assessment.4 It delineates the science content and skills to be assessed at both the eighth and fourth grades, and represents a consensus among the countries participating in TIMSS 2003 about the science that students at these grades should be expected to have learned. Content and topic areas are elaborated in the frameworks, with each topic area presented as a comprehensive list of objectives specifi c to the target grades (eighth or fourth grades) covered in a majority of participating countries. However, the frameworks do not consist solely of content and behaviors included in the intended cur-ricula of most participating countries. The aim was to ensure that goals of science education regarded as important in a signifi cant number of countries be included. Hence, not all topics included in the TIMSS 2003 assessment are in all participating countries’ intended curriculum, and consequently the curricula of some countries align more closely than others with the TIMSS frameworks.5
National Research Coordinators were asked to indicate whether each of the TIMSS 2003 science topics was included in their countries’ intended curricula through the target grade (eighth or fourth grade),
4 Mullis, I.V.S., Martin, M.O., Smith, T.A., Garden, R.A., Gregory, K.D., Gonzalez, E.J., Chrostowski, S.J., and O’Connor, K.M. (2003), TIMSS Assessment Frameworks and Specifi cations 2003 (2nd ed.), Chestnut Hill, MA: Boston College.
5 For a full description of the TIMSS 2003 test development effort, please see Smith Neidorf, T.A. and Garden, R. (2004), “Developing the TIMSS 2003 Mathematics and Science Assessment and Scoring Guides” in M.O. Martin, I.V.S. Mullis, and S.J. Chrostowski (eds.), TIMSS 2003 Technical Report, Chestnut Hill, MA: Boston College.
TIMSS & PIRLS INTERNATIONAL STUDY CENTER, LYNCH SCHOOL OF EDUCATION, BOSTON COLLEGE 201
CHAPTER 5: THE SCIENCE CURRICULUM
and if so, whether the topics were intended to be taught to “all or almost all students” or “only the more able students.”
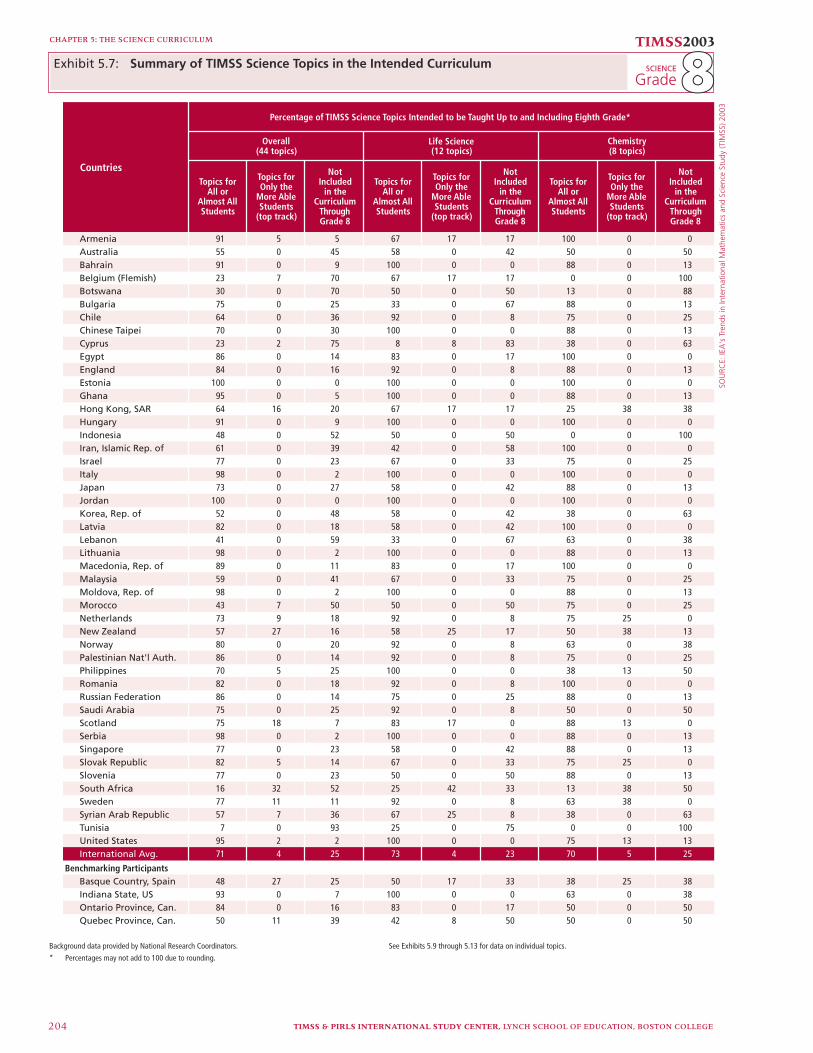
Exhibit 5.7 shows that, for most countries, a great deal of the science content addressed by the TIMSS 2003 assessment was included in their intended curricula. On average, across participants at the eighth grade, 71 percent of the assessment topics were intended for all or almost all students, and a further 4 percent for only the more able stu-dents. In only eight countries were less than half of the topics included in the eighth-grade curriculum: Belgium (Flemish), Botswana, Cyprus, Indonesia, Lebanon, Morocco, South Africa, and Tunisia. Coverage of the TIMSS science topics was particularly sparse in South Africa and Tunisia, with just 16 and 7 percent of the topics, respectively, in the intended curriculum for all or almost all students.
It is noteworthy that in most countries, those topics included in the curriculum were intended for all students. Only in Hong Kong SAR, New Zealand, Scotland, South Africa, Sweden, the Basque Country, and Quebec were more than 10 percent of science topics intended only for the more able students.
Each of the fi ve content areas in the TIMSS eighth-grade science assessment – life science, chemistry, physics, earth science, and envi-ronmental science – was included in the intended curriculum in about equal proportions (65-75%), on average. In life science, 73 percent of the topics, on average, were included in participants’ intended cur-riculum for all or almost all students. At least 10 of the 12 life science topics were included in the curriculum of about half of the participants (25). Participants with relatively low coverage (no more than half of the 12 topics) included Botswana, Bulgaria, Cyprus, Indonesia, Iran, Lebanon, Morocco, Slovenia, Tunisia, and Quebec.
Chemistry had fewer topics than life science (8 vs. 12) but a proportionally similar level of inclusion in the intended curricu-lum – 70 percent of topics, on average. Ten participants included all eight chemistry topics in their curricula, and a further 13 participants included seven of the eight topics. None of the chemistry topics were
TIMSS & PIRLS INTERNATIONAL STUDY CENTER, LYNCH SCHOOL OF EDUCATION, BOSTON COLLEGE202
CHAPTER 5: THE SCIENCE CURRICULUM
included in the intended curriculum in Belgium (Flemish), Indonesia, and Tunisia.
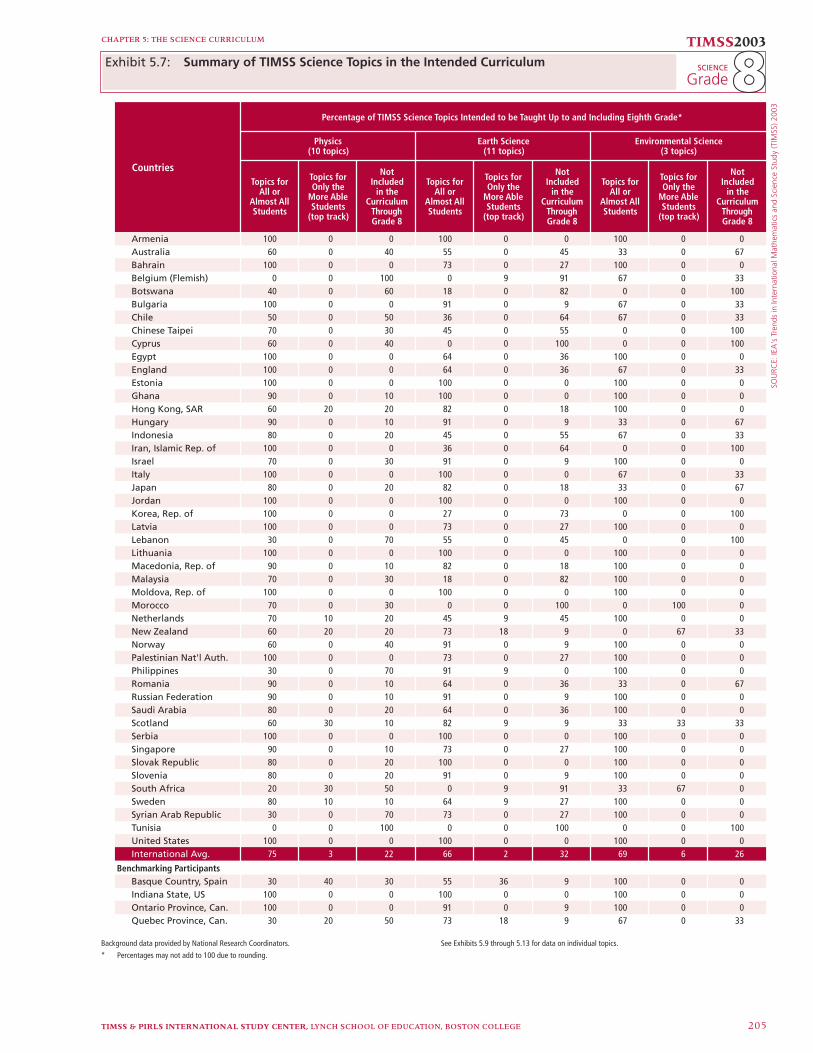
Of the physics topics in the TIMSS assessment, three-fourths, on average, were included in the intended curricula of the participating countries and benchmarking entities for all or almost all students. All 10 physics topics were in the curricula of 17 participants, and 9 of the 10 in that of a further 5 participants. Similar to chemistry, none of the physics topics were included in the curricula of Belgium (Flemish) or Tunisia.
Earth science had, by a small margin, the fewest topics in the participants’ intended curricula – 66 percent, on average. All 11 earth science topics were included in the curricula of 10 of the participating entities, and a further 8 participants had at least 10 of the 11 topics in their curricula. Fewer than half of the 11 topics were intended to be taught in Belgium (Flemish), Botswana, Chile, Chinese Taipei, Cyprus, Indonesia, Iran, Korea, Malaysia, Morocco, South Africa, and Tunisia.
Environmental science had just three topics in the assessment, and about two of the three, on average, were included in the par-ticipants’ curricula for most students. About half of the participants included all three topics in their intended curriculum. In contrast, seven participants – Botswana, Chinese Taipei, Cyprus, Iran, Korea, Lebanon, and Tunisia – included no environmental science topics in their intended curricula.
Unlike mathematics, where the relationship between inclusion in the intended curriculum and student achievement was moderately positive,6 in science this relationship was not as straightforward. The six highest performing countries in science, with the exception of Korea, had relatively high percentages (about 70%) of the science topics in their intended curricula, and there were several examples of lower-per-forming countries with few topics in their curricula – Botswana, Indo-nesia, Lebanon, South Africa, and Tunisia. However, although among the top-performing countries only Korea and Hong Kong, SAR had less than 70 percent of the topics in their curricula, there were some low-performing countries (such as Ghana and the Philippines) with many
6 Mullis, I.V.S., Martin, M.O., Gonzalez, E.J., and Chrostowski, S.J., (2004), TIMSS 2003 International Mathematics Report: Findings from IEA’s Trends in International Mathematics and Science Study at the Eighth and Fourth Grades, Chestnut Hill, MA: Boston College.

TIMSS & PIRLS INTERNATIONAL STUDY CENTER, LYNCH SCHOOL OF EDUCATION, BOSTON COLLEGE 203
CHAPTER 5: THE SCIENCE CURRICULUM
topics in their intended curricula. Belgium (Flemish) is unusual in that it had low coverage of the TIMSS science topics in its intended curriculum (just 23%) but still performed above the international mean. It appears that having at least moderate coverage of the science topics is a pre-requisite for high performance, but that high coverage in the intended curriculum does not of itself lead to high student achievement.
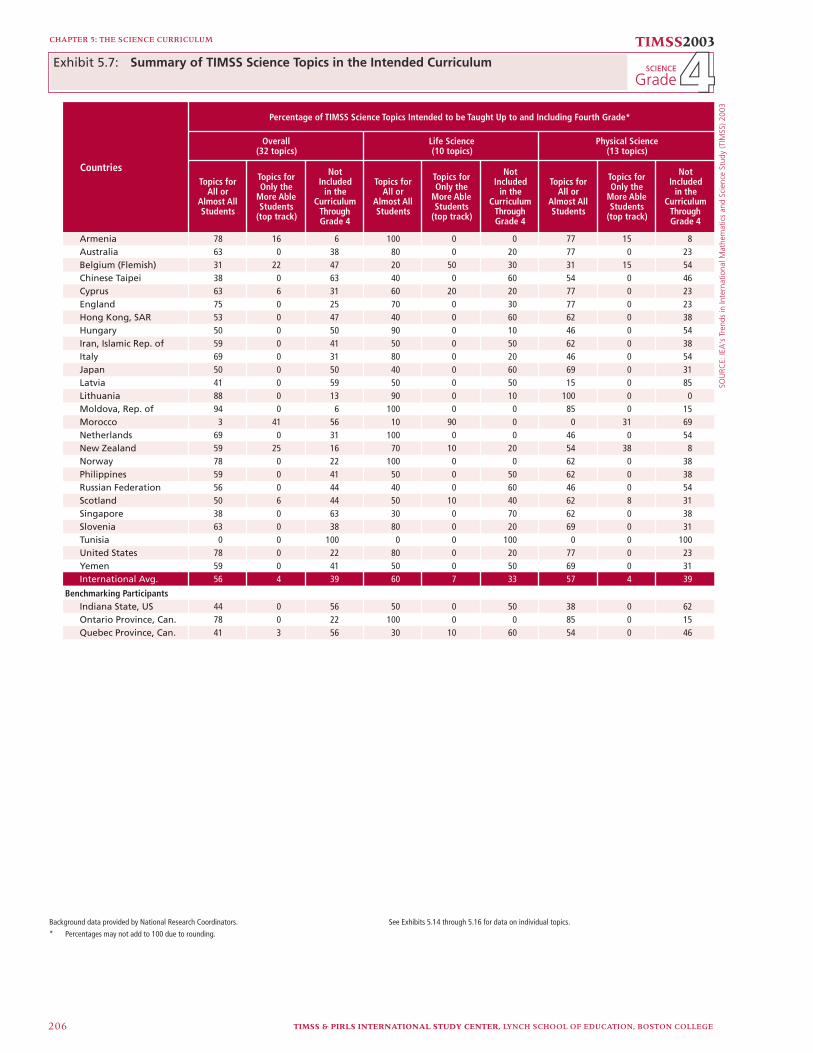
At fourth grade, Exhibit 5.7 shows that internationally, on average, 56 percent of the TIMSS 2003 science topics were included in the intended curricula for all or almost all students, and a further 4 percent for only the more able students. More than 70 percent of the science topics were included in the intended curriculum for all or almost all students in Armenia, England, Lithuania, Italy, Moldova, Norway, the United States, and Ontario.
At the fourth grade even more than at the eighth, those topics that were included in the curriculum were intended for all students. Only Armenia, Belgium (Flemish), Cyprus, Morocco, New Zealand, Scotland, and Quebec had any science topics intended only for the more able students.
Life science, with 10 topics, had the highest percentage of topics included in participants’ intended curricula at the fourth grade (60% for most students and 7% for the top track only). Eleven participants had 8 or more of the 10 topics included. However, there were also eleven participants with no more than half of the life science topics included in their intended curricula at this grade level.
Physical science, which at the fourth grade incorporates topics from both physics and chemistry, was next in terms of inclusion in the intended curriculum, with 57 percent of its topics, on average, intended for most students and a further 4 percent for the top track only. Almost one-third of the participants included 10 or more of the 13 physical science topics in their intended curricula for most students. About the same proportion, however, included no more than half of the topics, mostly the same participants with low levels of inclusion overall.
SOU
RCE:
IEA
's T
rend
s in
Inte
rnat
iona
l Mat
hem
atic
s an
d Sc
ienc
e St
udy
(TIM
SS) 2
003
TIMSS & PIRLS INTERNATIONAL STUDY CENTER, LYNCH SCHOOL OF EDUCATION, BOSTON COLLEGE204
CHAPTER 5: THE SCIENCE CURRICULUM
TIMSS2003
Grade88SCIENCE Exhibit 5.7:
Topics forAll or
Almost AllStudents
Topics forOnly the
More AbleStudents
(top track)
NotIncluded
in theCurriculum
ThroughGrade 8
Topics forAll or
Almost AllStudents
Topics forOnly the
More AbleStudents
(top track)
NotIncluded
in theCurriculum
ThroughGrade 8
Topics forAll or
Almost AllStudents
Topics forOnly the
More AbleStudents
(top track)
NotIncluded
in theCurriculum
ThroughGrade 8
Armenia 91 5 5 67 17 17 100 0 0Australia 55 0 45 58 0 42 50 0 50Bahrain 91 0 9 100 0 0 88 0 13Belgium (Flemish) 23 7 70 67 17 17 0 0 100Botswana 30 0 70 50 0 50 13 0 88Bulgaria 75 0 25 33 0 67 88 0 13Chile 64 0 36 92 0 8 75 0 25Chinese Taipei 70 0 30 100 0 0 88 0 13Cyprus 23 2 75 8 8 83 38 0 63Egypt 86 0 14 83 0 17 100 0 0England 84 0 16 92 0 8 88 0 13Estonia 100 0 0 100 0 0 100 0 0Ghana 95 0 5 100 0 0 88 0 13Hong Kong, SAR 64 16 20 67 17 17 25 38 38Hungary 91 0 9 100 0 0 100 0 0Indonesia 48 0 52 50 0 50 0 0 100Iran, Islamic Rep. of 61 0 39 42 0 58 100 0 0Israel 77 0 23 67 0 33 75 0 25Italy 98 0 2 100 0 0 100 0 0Japan 73 0 27 58 0 42 88 0 13Jordan 100 0 0 100 0 0 100 0 0Korea, Rep. of 52 0 48 58 0 42 38 0 63Latvia 82 0 18 58 0 42 100 0 0Lebanon 41 0 59 33 0 67 63 0 38Lithuania 98 0 2 100 0 0 88 0 13Macedonia, Rep. of 89 0 11 83 0 17 100 0 0Malaysia 59 0 41 67 0 33 75 0 25Moldova, Rep. of 98 0 2 100 0 0 88 0 13Morocco 43 7 50 50 0 50 75 0 25Netherlands 73 9 18 92 0 8 75 25 0New Zealand 57 27 16 58 25 17 50 38 13Norway 80 0 20 92 0 8 63 0 38Palestinian Nat'l Auth. 86 0 14 92 0 8 75 0 25Philippines 70 5 25 100 0 0 38 13 50Romania 82 0 18 92 0 8 100 0 0Russian Federation 86 0 14 75 0 25 88 0 13Saudi Arabia 75 0 25 92 0 8 50 0 50Scotland 75 18 7 83 17 0 88 13 0Serbia 98 0 2 100 0 0 88 0 13Singapore 77 0 23 58 0 42 88 0 13Slovak Republic 82 5 14 67 0 33 75 25 0Slovenia 77 0 23 50 0 50 88 0 13South Africa 16 32 52 25 42 33 13 38 50Sweden 77 11 11 92 0 8 63 38 0Syrian Arab Republic 57 7 36 67 25 8 38 0 63Tunisia 7 0 93 25 0 75 0 0 100United States 95 2 2 100 0 0 75 13 13International Avg. 71 4 25 73 4 23 70 5 25
Benchmarking ParticipantsBasque Country, Spain 48 27 25 50 17 33 38 25 38Indiana State, US 93 0 7 100 0 0 63 0 38Ontario Province, Can. 84 0 16 83 0 17 50 0 50Quebec Province, Can. 50 11 39 42 8 50 50 0 50
Countries
Overall(44 topics)
Chemistry(8 topics)(12 topics)
Percentage of TIMSS Science Topics Intended to be Taught Up to and Including Eighth Grade*
Life Science
Summary of TIMSS Science Topics in the Intended Curriculum
Background data provided by National Research Coordinators.
* Percentages may not add to 100 due to rounding.
See Exhibits 5.9 through 5.13 for data on individual topics.
SOU
RCE:
IEA
's T
rend
s in
Inte
rnat
iona
l Mat
hem
atic
s an
d Sc
ienc
e St
udy
(TIM
SS) 2
003
CHAPTER 5: THE SCIENCE CURRICULUM TIMSS2003
GradeSCIENCE
TIMSS & PIRLS INTERNATIONAL STUDY CENTER, LYNCH SCHOOL OF EDUCATION, BOSTON COLLEGE 205
Topics forAll or
Almost AllStudents
Topics forOnly the
More AbleStudents
(top track)
NotIncluded
in theCurriculum
ThroughGrade 8
Topics forAll or
Almost AllStudents
Topics forOnly the
More AbleStudents
(top track)
NotIncluded
in theCurriculum
ThroughGrade 8
Topics forAll or
Almost AllStudents
Topics forOnly the
More AbleStudents
(top track)
NotIncluded
in theCurriculum
ThroughGrade 8
Armenia 100 0 0 100 0 0 100 0 0Australia 60 0 40 55 0 45 33 0 67Bahrain 100 0 0 73 0 27 100 0 0Belgium (Flemish) 0 0 100 0 9 91 67 0 33Botswana 40 0 60 18 0 82 0 0 100Bulgaria 100 0 0 91 0 9 67 0 33Chile 50 0 50 36 0 64 67 0 33Chinese Taipei 70 0 30 45 0 55 0 0 100Cyprus 60 0 40 0 0 100 0 0 100Egypt 100 0 0 64 0 36 100 0 0England 100 0 0 64 0 36 67 0 33Estonia 100 0 0 100 0 0 100 0 0Ghana 90 0 10 100 0 0 100 0 0Hong Kong, SAR 60 20 20 82 0 18 100 0 0Hungary 90 0 10 91 0 9 33 0 67Indonesia 80 0 20 45 0 55 67 0 33Iran, Islamic Rep. of 100 0 0 36 0 64 0 0 100Israel 70 0 30 91 0 9 100 0 0Italy 100 0 0 100 0 0 67 0 33Japan 80 0 20 82 0 18 33 0 67Jordan 100 0 0 100 0 0 100 0 0Korea, Rep. of 100 0 0 27 0 73 0 0 100Latvia 100 0 0 73 0 27 100 0 0Lebanon 30 0 70 55 0 45 0 0 100Lithuania 100 0 0 100 0 0 100 0 0Macedonia, Rep. of 90 0 10 82 0 18 100 0 0Malaysia 70 0 30 18 0 82 100 0 0Moldova, Rep. of 100 0 0 100 0 0 100 0 0Morocco 70 0 30 0 0 100 0 100 0Netherlands 70 10 20 45 9 45 100 0 0New Zealand 60 20 20 73 18 9 0 67 33Norway 60 0 40 91 0 9 100 0 0Palestinian Nat'l Auth. 100 0 0 73 0 27 100 0 0Philippines 30 0 70 91 9 0 100 0 0Romania 90 0 10 64 0 36 33 0 67Russian Federation 90 0 10 91 0 9 100 0 0Saudi Arabia 80 0 20 64 0 36 100 0 0Scotland 60 30 10 82 9 9 33 33 33Serbia 100 0 0 100 0 0 100 0 0Singapore 90 0 10 73 0 27 100 0 0Slovak Republic 80 0 20 100 0 0 100 0 0Slovenia 80 0 20 91 0 9 100 0 0South Africa 20 30 50 0 9 91 33 67 0Sweden 80 10 10 64 9 27 100 0 0Syrian Arab Republic 30 0 70 73 0 27 100 0 0Tunisia 0 0 100 0 0 100 0 0 100United States 100 0 0 100 0 0 100 0 0International Avg. 75 3 22 66 2 32 69 6 26
Benchmarking ParticipantsBasque Country, Spain 30 40 30 55 36 9 100 0 0Indiana State, US 100 0 0 100 0 0 100 0 0Ontario Province, Can. 100 0 0 91 0 9 100 0 0Quebec Province, Can. 30 20 50 73 18 9 67 0 33
Countries
Physics(10 topics)
Environmental Science(3 topics)
Earth Science(11 topics)
Percentage of TIMSS Science Topics Intended to be Taught Up to and Including Eighth Grade*
Background data provided by National Research Coordinators.
* Percentages may not add to 100 due to rounding.
See Exhibits 5.9 through 5.13 for data on individual topics.
Exhibit 5.7: Summary of TIMSS Science Topics in the Intended Curriculum 88
SOU
RCE:
IEA
's T
rend
s in
Inte
rnat
iona
l Mat
hem
atic
s an
d Sc
ienc
e St
udy
(TIM
SS) 2
003
TIMSS & PIRLS INTERNATIONAL STUDY CENTER, LYNCH SCHOOL OF EDUCATION, BOSTON COLLEGE206
CHAPTER 5: THE SCIENCE CURRICULUM TIMSS2003
GradeSCIENCE
Topics forAll or
Almost AllStudents
Topics forOnly the
More AbleStudents
(top track)
NotIncluded
in theCurriculum
ThroughGrade 4
Topics forAll or
Almost AllStudents
Topics forOnly the
More AbleStudents
(top track)
NotIncluded
in theCurriculum
ThroughGrade 4
Topics forAll or
Almost AllStudents
Topics forOnly the
More AbleStudents
(top track)
NotIncluded
in theCurriculum
ThroughGrade 4
Armenia 78 16 6 100 0 0 77 15 8Australia 63 0 38 80 0 20 77 0 23Belgium (Flemish) 31 22 47 20 50 30 31 15 54Chinese Taipei 38 0 63 40 0 60 54 0 46Cyprus 63 6 31 60 20 20 77 0 23England 75 0 25 70 0 30 77 0 23Hong Kong, SAR 53 0 47 40 0 60 62 0 38Hungary 50 0 50 90 0 10 46 0 54Iran, Islamic Rep. of 59 0 41 50 0 50 62 0 38Italy 69 0 31 80 0 20 46 0 54Japan 50 0 50 40 0 60 69 0 31Latvia 41 0 59 50 0 50 15 0 85Lithuania 88 0 13 90 0 10 100 0 0Moldova, Rep. of 94 0 6 100 0 0 85 0 15Morocco 3 41 56 10 90 0 0 31 69Netherlands 69 0 31 100 0 0 46 0 54New Zealand 59 25 16 70 10 20 54 38 8Norway 78 0 22 100 0 0 62 0 38Philippines 59 0 41 50 0 50 62 0 38Russian Federation 56 0 44 40 0 60 46 0 54Scotland 50 6 44 50 10 40 62 8 31Singapore 38 0 63 30 0 70 62 0 38Slovenia 63 0 38 80 0 20 69 0 31Tunisia 0 0 100 0 0 100 0 0 100United States 78 0 22 80 0 20 77 0 23Yemen 59 0 41 50 0 50 69 0 31International Avg. 56 4 39 60 7 33 57 4 39
Benchmarking ParticipantsIndiana State, US 44 0 56 50 0 50 38 0 62Ontario Province, Can. 78 0 22 100 0 0 85 0 15Quebec Province, Can. 41 3 56 30 10 60 54 0 46
Countries
Overall(32 topics)
Physical Science(13 topics)
Life Science(10 topics)
Percentage of TIMSS Science Topics Intended to be Taught Up to and Including Fourth Grade*
Background data provided by National Research Coordinators.
* Percentages may not add to 100 due to rounding.
See Exhibits 5.14 through 5.16 for data on individual topics.
Summary of TIMSS Science Topics in the Intended Curriculum 44Exhibit 5.7:
SOU
RCE:
IEA
's T
rend
s in
Inte
rnat
iona
l Mat
hem
atic
s an
d Sc
ienc
e St
udy
(TIM
SS) 2
003
CHAPTER 5: THE SCIENCE CURRICULUM
TIMSS2003
GradeSCIENCE
TIMSS & PIRLS INTERNATIONAL STUDY CENTER, LYNCH SCHOOL OF EDUCATION, BOSTON COLLEGE 207
44Exhibit 5.7:
Topics forAll or
Almost AllStudents
Topics forOnly the
More AbleStudents
(top track)
NotIncluded
in theCurriculum
ThroughGrade 4
Armenia 56 33 11Australia 22 0 78Belgium (Flemish) 44 0 56Chinese Taipei 11 0 89Cyprus 44 0 56England 78 0 22Hong Kong, SAR 56 0 44Hungary 11 0 89Iran, Islamic Rep. of 67 0 33Italy 89 0 11Japan 33 0 67Latvia 67 0 33Lithuania 67 0 33Moldova, Rep. of 100 0 0Morocco 0 0 100Netherlands 67 0 33New Zealand 56 22 22Norway 78 0 22Philippines 67 0 33Russian Federation 89 0 11Scotland 33 0 67Singapore 11 0 89Slovenia 33 0 67Tunisia 0 0 100United States 78 0 22Yemen 56 0 44International Avg. 50 2 47
Benchmarking ParticipantsIndiana State, US 44 0 56Ontario Province, Can. 44 0 56Quebec Province, Can. 33 0 67
Countries
Earth Science(9 topics)
Percentage of TIMSS Science TopicsIntended to be Taught Up toand Including Fourth Grade*
Summary of TIMSS Science Topics in the Intended Curriculum
Background data provided by National Research Coordinators.
* Percentages may not add to 100 due to rounding.
See Exhibits 5.14 through 5.16 for data on individual topics.
TIMSS & PIRLS INTERNATIONAL STUDY CENTER, LYNCH SCHOOL OF EDUCATION, BOSTON COLLEGE208
CHAPTER 5: THE SCIENCE CURRICULUM
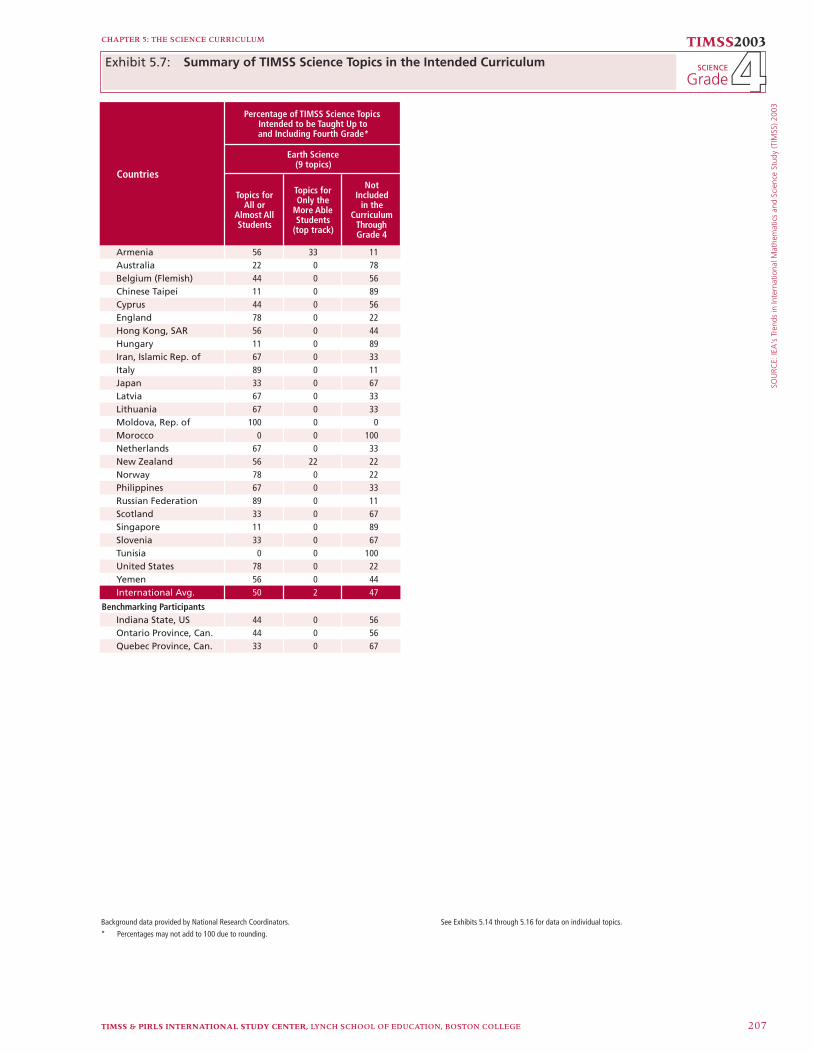
Earth science, with 9 topics, had the lowest level of inclusion in the intended fourth-grade curriculum (50% of topics for most students and 2% for the top track only). Only three countries, Italy, Moldova, and the Russian Federation, had as many as 8 of the 9 topics in their curricula for most students, and 13 participants had fewer than half of the topics included.
At the fourth grade, as at the eighth grade, the relationship between the coverage of the TIMSS science topics in participants’ intended curricula and student achievement in science is not straight-forward. Among the six top-performing countries, there was a range of topic coverage in the intended curriculum: two countries included about 40 percent of topics (Singapore and Chinese Taipei), two included about 50 percent of topics (Japan and Hong Kong, SAR), and two about 75 percent (England and the United States). Among the three lowest-performing countries, the Philippines included more than half the topics (59%) but Morocco included just one of the 32 science topics, and Tunisia none at all.
Are the TIMSS Science Topics Taught in School?
The previous section described the coverage of the TIMSS science topics in participating countries intended curricula at the eighth and fourth grades, with a focus on the percentage of topics that were included in countries’ intended curricula for all or almost all students. This section describes the coverage of the TIMSS topics in countries’ implemented curricula at the eighth and fourth grades, based on teachers’ reports of the percentage of students actually taught these topics.
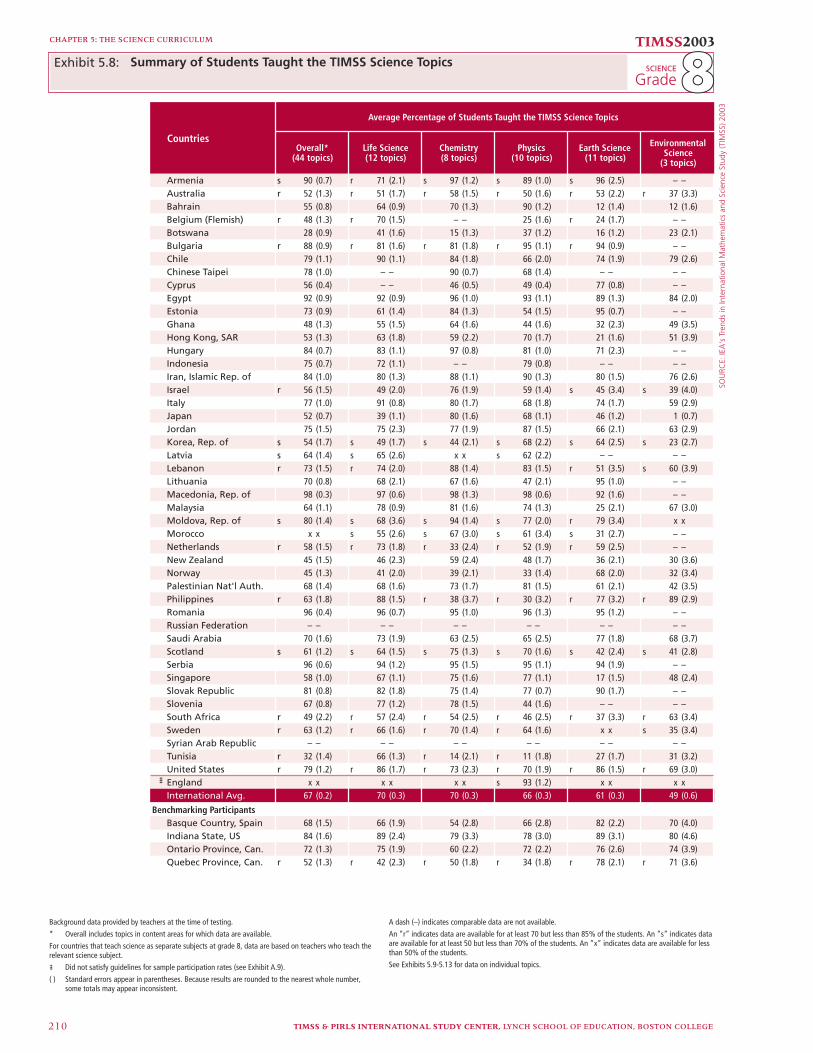
To gather information about science coverage in the imple-mented curricula of participating countries, the science teachers7 of the students assessed were asked to indicate whether each of the TIMSS 2003 science topics was “mostly taught before this year,” “mostly taught this year,” or “not yet taught or just introduced.” Exhibit 5.8 presents for eighth and fourth grade the percentage of students whose teachers reported that the students had been taught the TIMSS science topics
7 At fourth grade there was one teacher questionnaire that asked about both mathematics and science, and at eighth grade there were sepa-rate questionnaires for mathematics teachers and science teachers.
TIMSS & PIRLS INTERNATIONAL STUDY CENTER, LYNCH SCHOOL OF EDUCATION, BOSTON COLLEGE 209
CHAPTER 5: THE SCIENCE CURRICULUM
either prior to or during the year of the assessment. The exhibit shows for each TIMSS participant, averaged across science content areas, the percentage of students whose teachers reported that the students had been taught each topic. The topics were listed in a questionnaire com-pleted by the science teachers of the students who took the TIMSS 2003 test.8 Although generally, teacher participation was high, some-times teachers did not complete the questionnaire assigned to them, so most countries had some percentage of students for whom no teacher questionnaire information is available. The exhibits in this chapter have special notations on this point. For a country where teacher responses are available for at least 70 but less than 85 percent of the students, an “r” is included next to its data. Where teacher responses are avail-able for at least 50 but less than 70 percent of the students, an “s” is included. Where teacher responses are available for less than 50 percent, an “x” replaces the data.
Exhibit 5.8 shows that, according to their teachers, on average 67 percent of the eighth-grade students tested in TIMSS 2003 had been taught the TIMSS science topics. In fi ve countries, Armenia, Egypt, Macedonia, Romania, and Serbia, teachers reported that almost all stu-dents (90 percent or more) had been taught the topics, as had the major-ity of students in all participating entities except Belgium (Flemish), Botswana, New Zealand, Norway, South Africa and Tunisia.
Life science and chemistry were the content areas with the great-est coverage in the classroom, with 70 percent of students, on average, having been taught the TIMSS life science and chemistry topics by the eighth grade. Physics had the next greatest coverage (66%), fol-lowed by earth science (61%), and environmental science (49%). In life science, chemistry, physics, and earth science, teachers in 6-8 coun-tries reported that almost all students (90 percent or more) had been taught the topics. Environmental science (just three topics) appears to have received proportionally less attention in the classroom than the other science areas.
8 Further results from the teacher questionnaire are presented in Chapters 6 and 7.
SOU
RCE:
IEA
's T
rend
s in
Inte
rnat
iona
l Mat
hem
atic
s an
d Sc
ienc
e St
udy
(TIM
SS) 2
003
TIMSS & PIRLS INTERNATIONAL STUDY CENTER, LYNCH SCHOOL OF EDUCATION, BOSTON COLLEGE210
CHAPTER 5: THE SCIENCE CURRICULUM
TIMSS2003
Grade88SCIENCE Exhibit 5.8:
Armenia s 90 (0.7) r 71 (2.1) s 97 (1.2) s 89 (1.0) s 96 (2.5) – –Australia r 52 (1.3) r 51 (1.7) r 58 (1.5) r 50 (1.6) r 53 (2.2) r 37 (3.3)Bahrain 55 (0.8) 64 (0.9) 70 (1.3) 90 (1.2) 12 (1.4) 12 (1.6)Belgium (Flemish) r 48 (1.3) r 70 (1.5) – – 25 (1.6) r 24 (1.7) – –Botswana 28 (0.9) 41 (1.6) 15 (1.3) 37 (1.2) 16 (1.2) 23 (2.1)Bulgaria r 88 (0.9) r 81 (1.6) r 81 (1.8) r 95 (1.1) r 94 (0.9) – –Chile 79 (1.1) 90 (1.1) 84 (1.8) 66 (2.0) 74 (1.9) 79 (2.6)Chinese Taipei 78 (1.0) – – 90 (0.7) 68 (1.4) – – – –Cyprus 56 (0.4) – – 46 (0.5) 49 (0.4) 77 (0.8) – –Egypt 92 (0.9) 92 (0.9) 96 (1.0) 93 (1.1) 89 (1.3) 84 (2.0)Estonia 73 (0.9) 61 (1.4) 84 (1.3) 54 (1.5) 95 (0.7) – –Ghana 48 (1.3) 55 (1.5) 64 (1.6) 44 (1.6) 32 (2.3) 49 (3.5)Hong Kong, SAR 53 (1.3) 63 (1.8) 59 (2.2) 70 (1.7) 21 (1.6) 51 (3.9)Hungary 84 (0.7) 83 (1.1) 97 (0.8) 81 (1.0) 71 (2.3) – –Indonesia 75 (0.7) 72 (1.1) – – 79 (0.8) – – – –Iran, Islamic Rep. of 84 (1.0) 80 (1.3) 88 (1.1) 90 (1.3) 80 (1.5) 76 (2.6)Israel r 56 (1.5) 49 (2.0) 76 (1.9) 59 (1.4) s 45 (3.4) s 39 (4.0)Italy 77 (1.0) 91 (0.8) 80 (1.7) 68 (1.8) 74 (1.7) 59 (2.9)Japan 52 (0.7) 39 (1.1) 80 (1.6) 68 (1.1) 46 (1.2) 1 (0.7)Jordan 75 (1.5) 75 (2.3) 77 (1.9) 87 (1.5) 66 (2.1) 63 (2.9)Korea, Rep. of s 54 (1.7) s 49 (1.7) s 44 (2.1) s 68 (2.2) s 64 (2.5) s 23 (2.7)Latvia s 64 (1.4) s 65 (2.6) x x s 62 (2.2) – – – –Lebanon r 73 (1.5) r 74 (2.0) 88 (1.4) 83 (1.5) r 51 (3.5) s 60 (3.9)Lithuania 70 (0.8) 68 (2.1) 67 (1.6) 47 (2.1) 95 (1.0) – –Macedonia, Rep. of 98 (0.3) 97 (0.6) 98 (1.3) 98 (0.6) 92 (1.6) – –Malaysia 64 (1.1) 78 (0.9) 81 (1.6) 74 (1.3) 25 (2.1) 67 (3.0)Moldova, Rep. of s 80 (1.4) s 68 (3.6) s 94 (1.4) s 77 (2.0) r 79 (3.4) x xMorocco x x s 55 (2.6) s 67 (3.0) s 61 (3.4) s 31 (2.7) – –Netherlands r 58 (1.5) r 73 (1.8) r 33 (2.4) r 52 (1.9) r 59 (2.5) – –New Zealand 45 (1.5) 46 (2.3) 59 (2.4) 48 (1.7) 36 (2.1) 30 (3.6)Norway 45 (1.3) 41 (2.0) 39 (2.1) 33 (1.4) 68 (2.0) 32 (3.4)Palestinian Nat'l Auth. 68 (1.4) 68 (1.6) 73 (1.7) 81 (1.5) 61 (2.1) 42 (3.5)Philippines r 63 (1.8) 88 (1.5) r 38 (3.7) r 30 (3.2) r 77 (3.2) r 89 (2.9)Romania 96 (0.4) 96 (0.7) 95 (1.0) 96 (1.3) 95 (1.2) – –Russian Federation – – – – – – – – – – – –Saudi Arabia 70 (1.6) 73 (1.9) 63 (2.5) 65 (2.5) 77 (1.8) 68 (3.7)Scotland s 61 (1.2) s 64 (1.5) s 75 (1.3) s 70 (1.6) s 42 (2.4) s 41 (2.8)Serbia 96 (0.6) 94 (1.2) 95 (1.5) 95 (1.1) 94 (1.9) – –Singapore 58 (1.0) 67 (1.1) 75 (1.6) 77 (1.1) 17 (1.5) 48 (2.4)Slovak Republic 81 (0.8) 82 (1.8) 75 (1.4) 77 (0.7) 90 (1.7) – –Slovenia 67 (0.8) 77 (1.2) 78 (1.5) 44 (1.6) – – – –South Africa r 49 (2.2) r 57 (2.4) r 54 (2.5) r 46 (2.5) r 37 (3.3) r 63 (3.4)Sweden r 63 (1.2) r 66 (1.6) r 70 (1.4) r 64 (1.6) x x s 35 (3.4)Syrian Arab Republic – – – – – – – – – – – –Tunisia r 32 (1.4) 66 (1.3) r 14 (2.1) r 11 (1.8) 27 (1.7) 31 (3.2)United States r 79 (1.2) r 86 (1.7) r 73 (2.3) r 70 (1.9) r 86 (1.5) r 69 (3.0)
¶ England x x x x x x s 93 (1.2) x x x xInternational Avg. 67 (0.2) 70 (0.3) 70 (0.3) 66 (0.3) 61 (0.3) 49 (0.6)
Benchmarking ParticipantsBasque Country, Spain 68 (1.5) 66 (1.9) 54 (2.8) 66 (2.8) 82 (2.2) 70 (4.0)Indiana State, US 84 (1.6) 89 (2.4) 79 (3.3) 78 (3.0) 89 (3.1) 80 (4.6)Ontario Province, Can. 72 (1.3) 75 (1.9) 60 (2.2) 72 (2.2) 76 (2.6) 74 (3.9)Quebec Province, Can. r 52 (1.3) r 42 (2.3) r 50 (1.8) r 34 (1.8) r 78 (2.1) r 71 (3.6)
Countries
Average Percentage of Students Taught the TIMSS Science Topics
Overall*(44 topics) (12 topics)
Chemistry(8 topics)
Physics(10 topics)
Earth Science(11 topics)
EnvironmentalScience
(3 topics)
Life Science
Summary of Students Taught the TIMSS Science Topics
Background data provided by teachers at the time of testing.
* Overall includes topics in content areas for which data are available.
For countries that teach science as separate subjects at grade 8, data are based on teachers who teach the relevant science subject.
¶ Did not satisfy guidelines for sample participation rates (see Exhibit A.9).
( ) Standard errors appear in parentheses. Because results are rounded to the nearest whole number, some totals may appear inconsistent.
A dash (–) indicates comparable data are not available.
An “r” indicates data are available for at least 70 but less than 85% of the students. An “s” indicates data are available for at least 50 but less than 70% of the students. An “x” indicates data are available for less than 50% of the students.
See Exhibits 5.9-5.13 for data on individual topics.
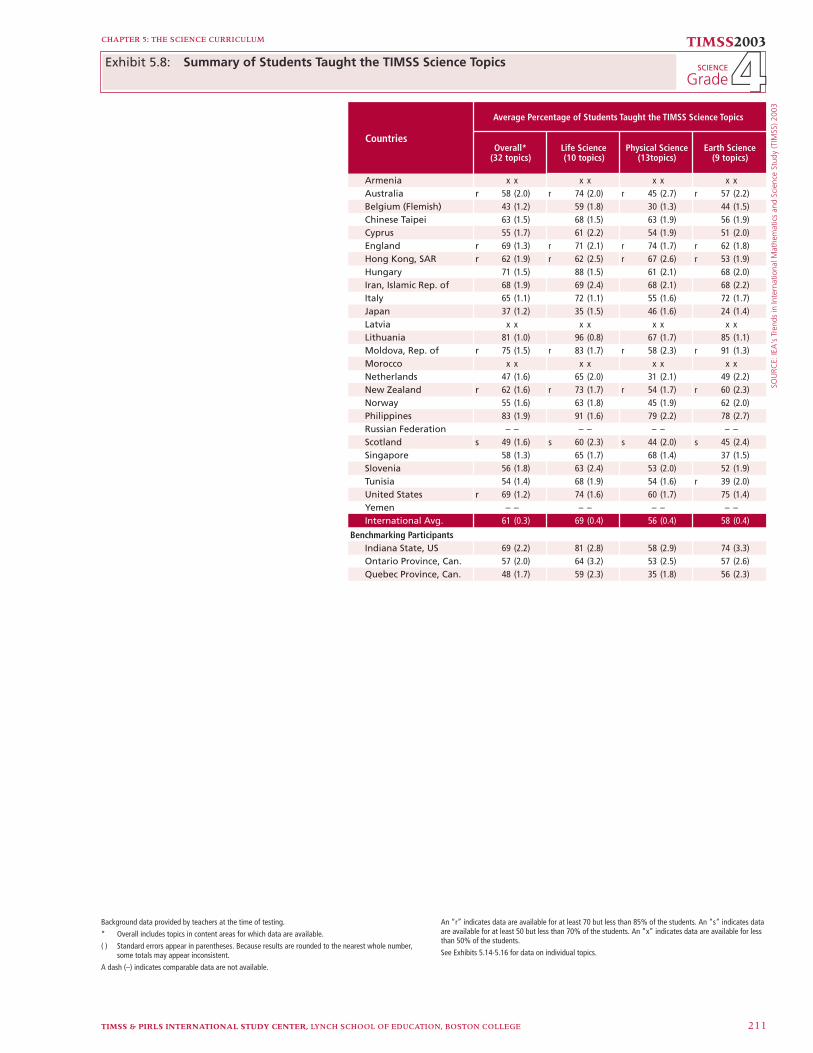
SOU
RCE:
IEA
's T
rend
s in
Inte
rnat
iona
l Mat
hem
atic
s an
d Sc
ienc
e St
udy
(TIM
SS) 2
003
CHAPTER 5: THE SCIENCE CURRICULUM
TIMSS2003
GradeSCIENCE
TIMSS & PIRLS INTERNATIONAL STUDY CENTER, LYNCH SCHOOL OF EDUCATION, BOSTON COLLEGE 211
44Exhibit 5.8:
Armenia x x x x x x x xAustralia r 58 (2.0) r 74 (2.0) r 45 (2.7) r 57 (2.2)Belgium (Flemish) 43 (1.2) 59 (1.8) 30 (1.3) 44 (1.5)Chinese Taipei 63 (1.5) 68 (1.5) 63 (1.9) 56 (1.9)Cyprus 55 (1.7) 61 (2.2) 54 (1.9) 51 (2.0)England r 69 (1.3) r 71 (2.1) r 74 (1.7) r 62 (1.8)Hong Kong, SAR r 62 (1.9) r 62 (2.5) r 67 (2.6) r 53 (1.9)Hungary 71 (1.5) 88 (1.5) 61 (2.1) 68 (2.0)Iran, Islamic Rep. of 68 (1.9) 69 (2.4) 68 (2.1) 68 (2.2)Italy 65 (1.1) 72 (1.1) 55 (1.6) 72 (1.7)Japan 37 (1.2) 35 (1.5) 46 (1.6) 24 (1.4)Latvia x x x x x x x xLithuania 81 (1.0) 96 (0.8) 67 (1.7) 85 (1.1)Moldova, Rep. of r 75 (1.5) r 83 (1.7) r 58 (2.3) r 91 (1.3)Morocco x x x x x x x xNetherlands 47 (1.6) 65 (2.0) 31 (2.1) 49 (2.2)New Zealand r 62 (1.6) r 73 (1.7) r 54 (1.7) r 60 (2.3)Norway 55 (1.6) 63 (1.8) 45 (1.9) 62 (2.0)Philippines 83 (1.9) 91 (1.6) 79 (2.2) 78 (2.7)Russian Federation – – – – – – – –Scotland s 49 (1.6) s 60 (2.3) s 44 (2.0) s 45 (2.4)Singapore 58 (1.3) 65 (1.7) 68 (1.4) 37 (1.5)Slovenia 56 (1.8) 63 (2.4) 53 (2.0) 52 (1.9)Tunisia 54 (1.4) 68 (1.9) 54 (1.6) r 39 (2.0)United States r 69 (1.2) 74 (1.6) 60 (1.7) 75 (1.4)Yemen – – – – – – – –International Avg. 61 (0.3) 69 (0.4) 56 (0.4) 58 (0.4)
Benchmarking ParticipantsIndiana State, US 69 (2.2) 81 (2.8) 58 (2.9) 74 (3.3)Ontario Province, Can. 57 (2.0) 64 (3.2) 53 (2.5) 57 (2.6)Quebec Province, Can. 48 (1.7) 59 (2.3) 35 (1.8) 56 (2.3)
CountriesOverall*
(32 topics)Life Science(10 topics)
Physical Science(13topics)
Earth Science(9 topics)
Average Percentage of Students Taught the TIMSS Science Topics
Summary of Students Taught the TIMSS Science Topics
Background data provided by teachers at the time of testing.
* Overall includes topics in content areas for which data are available.
( ) Standard errors appear in parentheses. Because results are rounded to the nearest whole number, some totals may appear inconsistent.
A dash (–) indicates comparable data are not available.
An “r” indicates data are available for at least 70 but less than 85% of the students. An “s” indicates data are available for at least 50 but less than 70% of the students. An “x” indicates data are available for less than 50% of the students.
See Exhibits 5.14-5.16 for data on individual topics.
TIMSS & PIRLS INTERNATIONAL STUDY CENTER, LYNCH SCHOOL OF EDUCATION, BOSTON COLLEGE212
CHAPTER 5: THE SCIENCE CURRICULUM
At the fourth grade, Exhibit 5.8 shows that internationally, on average, 61 percent of the students tested in TIMSS 2003 had been taught the TIMSS science topics, with the percentage ranging from 83 percent in Lithuania to 37 percent in Japan. The majority of students in every participating entity except Belgium (Flemish), Japan, the Neth-erlands, and Quebec had been taught the topics.
Consistent with the data reported on the intended science cur-riculum at the fourth grade (Exhibit 5.7), life science was the content area with the greatest percentage of students taught the topics, on average (69%). Percentages were greatest in Lithuania (96%) and the Philippines (91%) and least in Japan (35%). For physical science and earth science, the average percentages of fourth-grade students taught the TIMSS science topics were similar, 56 percent and 58 percent, respectively. The percentage of students taught physical science ranged from 79 percent in the Philippines to 30 and 31 percent in Belgium (Flemish) and the Netherlands, respectively. Although earth science topics did not fi gure prominently in the intended curriculum at the fourth grade, teachers’ reports indicated that students have to a con-siderable extent been taught the topics. According to teachers’ reports, the majority of students in 18 of the participating entities have been taught the earth science topics.
TIMSS & PIRLS INTERNATIONAL STUDY CENTER, LYNCH SCHOOL OF EDUCATION, BOSTON COLLEGE 213
CHAPTER 5: THE SCIENCE CURRICULUM
Which TIMSS Science Topics Are in the Intended and Implemented Curricula?
For fi rst the eighth grade and then the fourth grade, this section pres-ents information about the coverage of each individual science topic in each country’s intended and implemented curricula. For each topic, the exhibits indicate whether the topic was intended to be taught and if so, to all or only the more able students; the grade(s) at which the topic was primarily intended to be taught; and the percentage of students actually taught the topic. Exhibits 5.9 through 5.13 present these data for the science content areas at eighth grade, and Exhibits 5.14 through 5.16 for those at fourth grade.
Exhibit 5.9 presents information on the 12 life science topics at eighth grade. As shown in this exhibit, several of the TIMSS life science topics were included in the intended curriculum of most par-ticipants, and were taught to most students. These topics included “classifi cation of organisms” (in the curriculum of 47 participants for most students; taught to 84% of students, on average), “major organ systems in humans and other organisms” (in the curriculaof 44 par-ticipants for most students; taught to 82% of students, on average), and “the interaction of living organisms in an ecosystem” (in the cur-riculum of 42 participants for most students; taught to 69% of stu-dents, on average). In addition, there were several topics less widely intended or taught, but in the curriculum of more than 30 participants and taught to at least 70 percent of the students: “how systems func-tion to maintain stable bodily functions,” “cell structures and func-tions,” “photosynthesis and respiration,” “life cycles of organisms,” and “reproduction and heredity.” Exhibit 5.9 also shows that there was great variation among participants in the grade(s) at which the life science topics were primarily intended to be taught. Also, while some countries reported that topics were intended to be taught pri-marily at a single grade, many provided a range of grades in which they were taught.

SOU
RCE:
IEA
's T
rend
s in
Inte
rnat
iona
l Mat
hem
atic
s an
d Sc
ienc
e St
udy
(TIM
SS) 2
003
TIMSS & PIRLS INTERNATIONAL STUDY CENTER, LYNCH SCHOOL OF EDUCATION, BOSTON COLLEGE214
CHAPTER 5: THE SCIENCE CURRICULUM
TIMSS2003
Grade88SCIENCE Exhibit 5.9:
Countries
Armenia k -- s 95 (2.1) k -- r 99 (1.1) k -- s 91 (2.5) k -- r 77 (4.2)Australia k -- r 82 (3.0) k -- r 57 (4.0) k -- r 42 (3.4) k -- r 82 (2.8)Bahrain k 1-3,5-7 88 (3.2) k 4,5,8 97 (1.3) k 5,8 91 (2.3) k 7 95 (1.2)Belgium (Flemish) k -- r 61 (4.1) k -- r 97 (1.0) k -- r 95 (1.8) n -- r 80 (3.6)Botswana k 2 84 (3.8) k 2 69 (4.5) j 9 38 (4.7) k 8 98 (1.3)Bulgaria j 10 r 88 (2.9) k 8 r 100 (0.4) k 8 r 90 (3.4) j 9 r 93 (2.0)Chile k 3-6 98 (1.1) k 5,7,9,11 98 (1.0) k 7,11 93 (2.0) j 9 87 (2.5)Chinese Taipei k 7 – – k 7 – – k 7 – – k 7 – –Cyprus j 9 – – j 9 – – j -- – – k 7-9 – –Egypt k 4,9 81 (3.7) k 5 99 (1.0) k 5 96 (1.7) k 5,8 100 (0.0)
Estonia k 2,4,6-8 r 95 (1.9) k2,4,7-9,12 35 (5.0) k
4,7,9,11-12 32 (5.5) k 4,7,9,11 74 (5.2)
Ghana k 7 45 (4.8) k 8 58 (4.2) k 7 38 (5.0) k 7 88 (2.8)Hong Kong, SAR k 7 85 (3.3) k 4 72 (3.9) j 9 35 (3.8) n 10 84 (3.4)Hungary k 7 88 (2.7) k 8 95 (1.7) k 8 r 78 (3.6) k 8 90 (1.9)Indonesia k 7 97 (1.5) k 8 100 (0.0) k 8 91 (2.7) j 10 98 (1.5)Iran, Islamic Rep. of k 5-6 92 (2.0) k 5-8 98 (1.0) j -- 87 (2.7) k 7-8 97 (1.2)Israel k 1-6 52 (3.9) k -- 62 (3.4) j -- 52 (4.0) k 7-12 71 (4.1)Italy k 4-6 99 (0.8) k 4-7 100 (0.0) k 6-7 93 (1.9) k 6 100 (0.3)
Japan k 3-12 97 (1.6) k6,8,10-
12 99 (0.7) k 8,10-12 70 (3.6) j 9-12 17 (3.1)
Jordan k 1,6,8 98 (1.2) k 4-6,8 93 (2.3) k 5-6,8 80 (3.0) k 4,7 83 (2.9)
Korea, Rep. of k 6 s 38 (3.4) k 7 78 (3.1) k 8 s 77 (3.4) k 7 s 85 (2.2)Latvia k 6-9 s 86 (3.2) j 9 48 (6.3) j 9 s 62 (5.7) k 7-8 s 69 (5.9)Lebanon j 12 r 81 (3.7) j 10 r 79 (3.9) j 12 r 61 (4.4) j 11 r 70 (4.5)Lithuania k 5-8 91 (2.6) k 5-8 72 (4.4) k 7-8 63 (4.4) k 5-8 85 (3.5)Macedonia, Rep. of k 5-6 99 (0.8) k 5-8 99 (0.8) k 5-8 96 (1.9) k 5 99 (0.7)Malaysia k 4-7 99 (0.9) k 7-8 96 (1.7) k 7-8 88 (3.0) k 7 97 (1.6)Moldova, Rep. of k 6 s 71 (9.4) k 6 92 (5.3) k 6 s 91 (5.2) k 6 s 87 (5.7)Morocco k -- s 88 (4.6) k -- 78 (4.4) k -- s 62 (6.5) j -- s 47 (7.3)Netherlands k -- r 82 (4.2) k -- r 100 (0.0) k -- r 97 (1.5) k -- r 72 (5.1)New Zealand k 2-7 72 (5.2) k 2-9 39 (5.0) n 9-11 20 (3.6) j 10-12 69 (4.2)Norway k 4-7 34 (3.9) k 3,5 19 (3.5) k 2,4,5,9 10 (2.9) j -- 50 (4.7)
Palestinian Nat'l Auth. k 7,11 96 (1.6) k4,6-8,11-12 87 (2.9) k 3,7,11 75 (4.0) k 8,11-12 98 (1.3)
Philippines k 8 95 (1.9) k 8 90 (2.7) k 8 85 (2.9) k 8 100 (0.0)
Romania k 5-6,9 99 (1.1) k4-8,10-
11 99 (0.7) k 7,10-11 98 (1.2) j 9-11 98 (1.3)
Russian Federation k 7-8 – – k 6-9 – – j 9 – – k 6-8 – –Saudi Arabia k -- 95 (1.6) k 8 100 (0.0) k -- 97 (1.7) k -- 96 (1.5)Scotland k 7 s 94 (1.8) k 7 78 (3.0) k 7 s 47 (3.5) k 7 s 95 (1.5)Serbia k 5-6 89 (2.9) k 5-6,8 97 (1.5) k 6,8 96 (1.5) k 5,8 98 (1.1)Singapore k 8 76 (2.4) j 11 90 (1.5) j 9 63 (2.3) k 7 85 (2.2)Slovak Republic k 5-9 97 (1.5) k 6-7 99 (1.3) j 9 60 (5.3) k 5-7,9 96 (1.7)Slovenia k 8 76 (3.8) j 9 90 (2.3) j 9 89 (2.5) j 9 91 (2.2)South Africa k -- r 69 (3.8) k -- r 58 (3.9) j -- r 43 (4.7) j -- r 44 (3.6)Sweden k 7 r 81 (3.3) k 8 r 79 (3.6) k 8 r 64 (4.2) k 8 r 75 (3.4)Syrian Arab Republic k -- – – k -- – – n -- – – k -- – –Tunisia j 11 100 (0.0) j 11 75 (3.8) j 11 38 (4.1) j 11 89 (2.7)United States k -- r 87 (2.1) k -- r 89 (2.1) k -- r 88 (2.0) k -- r 92 (1.7)
¶ England k 1,3,5-6 s 96 (3.1) k K,4,6,8 x x k 4,7-8 x x k 6,8 s 99 (0.4)International Avg. 84 (0.5) 82 (0.5) 71 (0.6) 84 (0.5)
Benchmarking ParticipantsBasque Country, Spain k -- 84 (3.2) k -- 83 (4.4) k -- 63 (4.1) j 11 70 (4.7)Indiana State, US k -- 90 (3.5) k -- 88 (4.7) k -- 86 (4.8) k -- 93 (3.0)Ontario Province, Can. k 6 88 (3.2) k 5 82 (3.6) k 5,8 75 (3.8) k 8 81 (4.3)Quebec Province, Can. k -- r 50 (5.4) j 9 r 10 (3.1) j 9 r 5 (1.7) j 9 r 25 (4.7)
How the systems functionto maintain stablebodily conditions
Cell structures and functionsClassification of organisms The major organ systems inhumans and other organisms
Gra
de(s
) top
ic is
inte
nded
to b
eta
ught
Perc
ent o
f stu
dent
sta
ught
the
topi
c
Stud
ent p
opul
atio
nin
tend
ed to
topi
c th
roug
h8t
h gr
ade
be ta
ught
Gra
de(s
) top
ic is
inte
nded
to b
eta
ught
Perc
ent o
f stu
dent
sta
ught
the
topi
c
Stud
ent p
opul
atio
nin
tend
ed to
topi
c th
roug
h8t
h gr
ade
be ta
ught
Gra
de(s
) top
ic is
inte
nded
to b
eta
ught
Perc
ent o
f stu
dent
sta
ught
the
topi
c
Stud
ent p
opul
atio
nin
tend
ed to
topi
c th
roug
h8t
h gr
ade
be ta
ught
Gra
de(s
) top
ic is
inte
nded
to b
eta
ught
Perc
ent o
f stu
dent
sta
ught
the
topi
c
Stud
ent p
opul
atio
nin
tend
ed to
topi
c th
roug
h8t
h gr
ade
be ta
ught
k
n
j
Not
incl
uded
in t
he c
urric
ulum
thr
ough
eig
hth
grad
eA
ll or
alm
ost
all s
tude
nts
Onl
y th
e m
ore
able
stu
dent
s
Life Science
Intended and Taught TIMSS Life Science Topics
Background data on intended curriculum provided by National Research Coordinators, and on imple-mented curriculum by teachers at the time of testing.
For countries that teach science as separate subjects at grade 8, data are based on biology teachers only.
¶ Did not satisfy guidelines for sample participation rates (see Exhibit A.9).
( ) Standard errors appear in parentheses. Because results are rounded to the nearest whole number, some totals may appear inconsistent.
A dash (–) indicates comparable data are not available.
An “r” indicates data are available for at least 70 but less than 85% of the students. An “s” indicates data are available for at least 50 but less than 70% of the students. An “x” indicates data are available for less than 50% of the students.
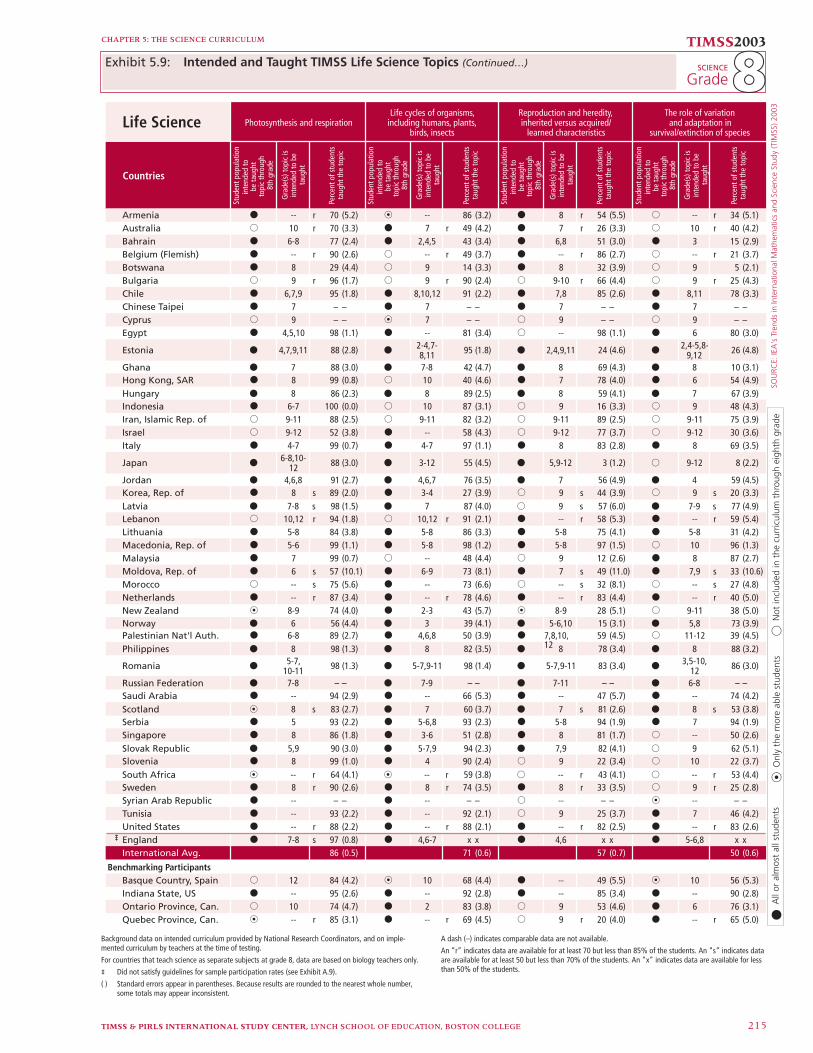
SOU
RCE:
IEA
's T
rend
s in
Inte
rnat
iona
l Mat
hem
atic
s an
d Sc
ienc
e St
udy
(TIM
SS) 2
003
CHAPTER 5: THE SCIENCE CURRICULUM TIMSS2003
GradeSCIENCE
TIMSS & PIRLS INTERNATIONAL STUDY CENTER, LYNCH SCHOOL OF EDUCATION, BOSTON COLLEGE 215
Countries
Armenia k -- r 70 (5.2) n -- 86 (3.2) k 8 r 54 (5.5) j -- r 34 (5.1)Australia j 10 r 70 (3.3) k 7 r 49 (4.2) k 7 r 26 (3.3) j 10 r 40 (4.2)Bahrain k 6-8 77 (2.4) k 2,4,5 43 (3.4) k 6,8 51 (3.0) k 3 15 (2.9)Belgium (Flemish) k -- r 90 (2.6) j -- r 49 (3.7) k -- r 86 (2.7) j -- r 21 (3.7)Botswana k 8 29 (4.4) j 9 14 (3.3) k 8 32 (3.9) j 9 5 (2.1)Bulgaria j 9 r 96 (1.7) j 9 r 90 (2.4) j 9-10 r 66 (4.4) j 9 r 25 (4.3)Chile k 6,7,9 95 (1.8) k 8,10,12 91 (2.2) k 7,8 85 (2.6) k 8,11 78 (3.3)Chinese Taipei k 7 – – k 7 – – k 7 – – k 7 – –Cyprus j 9 – – n 7 – – j 9 – – j 9 – –Egypt k 4,5,10 98 (1.1) k -- 81 (3.4) j -- 98 (1.1) k 6 80 (3.0)
Estonia k 4,7,9,11 88 (2.8) k2-4,7-8,11 95 (1.8) k 2,4,9,11 24 (4.6) k
2,4-5,8-9,12 26 (4.8)
Ghana k 7 88 (3.0) k 7-8 42 (4.7) k 8 69 (4.3) k 8 10 (3.1)Hong Kong, SAR k 8 99 (0.8) j 10 40 (4.6) k 7 78 (4.0) k 6 54 (4.9)Hungary k 8 86 (2.3) k 8 89 (2.5) k 8 59 (4.1) k 7 67 (3.9)Indonesia k 6-7 100 (0.0) j 10 87 (3.1) j 9 16 (3.3) j 9 48 (4.3)Iran, Islamic Rep. of j 9-11 88 (2.5) j 9-11 82 (3.2) j 9-11 89 (2.5) j 9-11 75 (3.9)Israel j 9-12 52 (3.8) k -- 58 (4.3) j 9-12 77 (3.7) j 9-12 30 (3.6)Italy k 4-7 99 (0.7) k 4-7 97 (1.1) k 8 83 (2.8) k 8 69 (3.5)
Japan k6-8,10-
12 88 (3.0) k 3-12 55 (4.5) k 5,9-12 3 (1.2) j 9-12 8 (2.2)
Jordan k 4,6,8 91 (2.7) k 4,6,7 76 (3.5) k 7 56 (4.9) k 4 59 (4.5)Korea, Rep. of k 8 s 89 (2.0) k 3-4 27 (3.9) j 9 s 44 (3.9) j 9 s 20 (3.3)Latvia k 7-8 s 98 (1.5) k 7 87 (4.0) j 9 s 57 (6.0) k 7-9 s 77 (4.9)Lebanon j 10,12 r 94 (1.8) j 10,12 r 91 (2.1) k -- r 58 (5.3) k -- r 59 (5.4)Lithuania k 5-8 84 (3.8) k 5-8 86 (3.3) k 5-8 75 (4.1) k 5-8 31 (4.2)Macedonia, Rep. of k 5-6 99 (1.1) k 5-8 98 (1.2) k 5-8 97 (1.5) j 10 96 (1.3)Malaysia k 7 99 (0.7) j -- 48 (4.4) j 9 12 (2.6) k 8 87 (2.7)Moldova, Rep. of k 6 s 57 (10.1) k 6-9 73 (8.1) k 7 s 49 (11.0) k 7,9 s 33 (10.6)Morocco j -- s 75 (5.6) k -- 73 (6.6) j -- s 32 (8.1) j -- s 27 (4.8)Netherlands k -- r 87 (3.4) k -- r 78 (4.6) k -- r 83 (4.4) k -- r 40 (5.0)New Zealand n 8-9 74 (4.0) k 2-3 43 (5.7) n 8-9 28 (5.1) j 9-11 38 (5.0)Norway k 6 56 (4.4) k 3 39 (4.1) k 5-6,10 15 (3.1) k 5,8 73 (3.9)Palestinian Nat'l Auth. k 6-8 89 (2.7) k 4,6,8 50 (3.9) k 7,8,10,
1259 (4.5) j 11-12 39 (4.5)
Philippines k 8 98 (1.3) k 8 82 (3.5) k 8 78 (3.4) k 8 88 (3.2)
Romania k5-7,
10-11 98 (1.3) k 5-7,9-11 98 (1.4) k 5-7,9-11 83 (3.4) k3,5-10,
12 86 (3.0)
Russian Federation k 7-8 – – k 7-9 – – k 7-11 – – k 6-8 – –Saudi Arabia k -- 94 (2.9) k -- 66 (5.3) k -- 47 (5.7) k -- 74 (4.2)Scotland n 8 s 83 (2.7) k 7 60 (3.7) k 7 s 81 (2.6) k 8 s 53 (3.8)Serbia k 5 93 (2.2) k 5-6,8 93 (2.3) k 5-8 94 (1.9) k 7 94 (1.9)Singapore k 8 86 (1.8) k 3-6 51 (2.8) k 8 81 (1.7) j -- 50 (2.6)Slovak Republic k 5,9 90 (3.0) k 5-7,9 94 (2.3) k 7,9 82 (4.1) j 9 62 (5.1)Slovenia k 8 99 (1.0) k 4 90 (2.4) j 9 22 (3.4) j 10 22 (3.7)South Africa n -- r 64 (4.1) n -- r 59 (3.8) j -- r 43 (4.1) j -- r 53 (4.4)Sweden k 8 r 90 (2.6) k 8 r 74 (3.5) k 8 r 33 (3.5) j 9 r 25 (2.8)Syrian Arab Republic k -- – – k -- – – j -- – – n -- – –Tunisia k -- 93 (2.2) k -- 92 (2.1) j 9 25 (3.7) k 7 46 (4.2)United States k -- r 88 (2.2) k -- r 88 (2.1) k -- r 82 (2.5) k -- r 83 (2.6)
¶ England k 7-8 s 97 (0.8) k 4,6-7 x x k 4,6 x x k 5-6,8 x xInternational Avg. 86 (0.5) 71 (0.6) 57 (0.7) 50 (0.6)
Benchmarking ParticipantsBasque Country, Spain j 12 84 (4.2) n 10 68 (4.4) k -- 49 (5.5) n 10 56 (5.3)Indiana State, US k -- 95 (2.6) k -- 92 (2.8) k -- 85 (3.4) k -- 90 (2.8)Ontario Province, Can. j 10 74 (4.7) k 2 83 (3.8) j 9 53 (4.6) k 6 76 (3.1)Quebec Province, Can. n -- r 85 (3.1) k -- r 69 (4.5) j 9 r 20 (4.0) k -- r 65 (5.0)
Reproduction and heredity,inherited versus acquired/
learned characteristics
The role of variationand adaptation in
survival/extinction of speciesPhotosynthesis and respiration
Life cycles of organisms,including humans, plants,
birds, insects
Gra
de(s
) top
ic is
inte
nded
to b
eta
ught
Perc
ent o
f stu
dent
sta
ught
the
topi
c
Stud
ent p
opul
atio
nin
tend
ed to
topi
c th
roug
h8t
h gr
ade
be ta
ught
Gra
de(s
) top
ic is
inte
nded
to b
eta
ught
Perc
ent o
f stu
dent
sta
ught
the
topi
c
Stud
ent p
opul
atio
nin
tend
ed to
topi
c th
roug
h8t
h gr
ade
be ta
ught
Gra
de(s
) top
ic is
inte
nded
to b
eta
ught
Perc
ent o
f stu
dent
sta
ught
the
topi
c
Stud
ent p
opul
atio
nin
tend
ed to
topi
c th
roug
h8t
h gr
ade
be ta
ught
Gra
de(s
) top
ic is
inte
nded
to b
eta
ught
Perc
ent o
f stu
dent
sta
ught
the
topi
c
Stud
ent p
opul
atio
nin
tend
ed to
topi
c th
roug
h8t
h gr
ade
be ta
ught
k
n
j
Not
incl
uded
in t
he c
urric
ulum
thr
ough
eig
hth
grad
eA
ll or
alm
ost
all s
tude
nts
Onl
y th
e m
ore
able
stu
dent
s
Life Science
Background data on intended curriculum provided by National Research Coordinators, and on imple-mented curriculum by teachers at the time of testing.
For countries that teach science as separate subjects at grade 8, data are based on biology teachers only.
¶ Did not satisfy guidelines for sample participation rates (see Exhibit A.9).
( ) Standard errors appear in parentheses. Because results are rounded to the nearest whole number, some totals may appear inconsistent.
A dash (–) indicates comparable data are not available.
An “r” indicates data are available for at least 70 but less than 85% of the students. An “s” indicates data are available for at least 50 but less than 70% of the students. An “x” indicates data are available for less than 50% of the students.
88Exhibit 5.9: Intended and Taught TIMSS Life Science Topics (Continued…)

SOU
RCE:
IEA
's T
rend
s in
Inte
rnat
iona
l Mat
hem
atic
s an
d Sc
ienc
e St
udy
(TIM
SS) 2
003
TIMSS & PIRLS INTERNATIONAL STUDY CENTER, LYNCH SCHOOL OF EDUCATION, BOSTON COLLEGE216
CHAPTER 5: THE SCIENCE CURRICULUM
TIMSS2003
Grade88SCIENCE
Life Science
Countries
Armenia k -- r 24 (4.2) k -- 40 (5.2) j -- r 96 (2.0) n -- r 96 (2.1)Australia k -- r 62 (3.7) j -- r 47 (4.2) j 11 r 18 (3.1) j -- r 35 (3.7)Bahrain k 3,6,8 51 (2.5) k 2,3,6,8 28 (2.6) k 3,6,8 85 (1.4) k 1-3,5,8 51 (2.8)Belgium (Flemish) k -- r 79 (3.1) k -- r 41 (4.4) n -- r 57 (3.7) k -- r 88 (2.5)Botswana j 9 6 (2.2) j 10 19 (3.5) j 9 33 (4.6) k 2 62 (3.9)Bulgaria j 9 r 63 (5.1) j 9 r 69 (4.9) k 8 r 96 (1.7) k 8 r 95 (2.0)
Chile k5,6,10,
12 94 (1.7) k 6,9 89 (2.1) k 7,12 87 (2.8) k 7,9-11 87 (2.8)
Chinese Taipei k 7 – – k 7 – – k 7 – – k 7 – –Cyprus j 9 – – j 9 – – j 9 – – j 9 – –Egypt k 6,9 95 (1.8) k 6 90 (2.2) k 7 100 (0.1) j -- 90 (2.5)
Estonia k3,6,8,11-12
77 (3.6) k12
52 (5.2) k2,4,8-
9,11-12 71 (5.4) k
1-2,4-7,9,10,
1263 (5.8)
Ghana k 8-9 23 (4.0) k 8-9 43 (5.1) k 8 77 (4.2) k 8-9 79 (4.2)Hong Kong, SAR k 8 86 (3.4) n 8 79 (3.4) k 5 16 (3.0) k 5 23 (3.8)Hungary k 7 91 (2.4) k 8 95 (1.9) k 8 72 (3.9) k 4 86 (3.0)Indonesia k 7 98 (1.4) j 12 87 (2.8) j 11 23 (3.5) k 4 17 (3.1)Iran, Islamic Rep. of j 9-11 86 (2.9) j 9-11 81 (3.4) k 5-6,8 44 (4.0) k 5-6,8 45 (3.8)Israel k 6-12 43 (4.4) k 6-12 47 (4.1) k 1-6 24 (3.5) k 1-9 24 (4.0)Italy k 5-8 83 (2.5) k 4-8 91 (2.0) k 5-8 89 (2.1) k 6-7 94 (1.8)Japan j 9-12 1 (0.0) k 6,9-12 12 (2.6) j -- 13 (2.6) j -- 8 (2.3)Jordan k 6 80 (3.5) k 7 77 (3.8) k 6 46 (4.3) k 1,4-6 59 (4.5)Korea, Rep. of k 6 s 20 (3.2) j 11-12 27 (3.5) j 11-12 s 30 (3.2) j 11-12 s 52 (3.6)Latvia k 6-7 s 76 (5.4) k 6-8 51 (5.9) j 9 s 30 (6.0) j 9 s 34 (5.4)Lebanon k -- r 85 (3.3) j 12 r 66 (4.4) k -- r 85 (3.7) j 11 r 60 (4.6)Lithuania k 5-8 78 (3.9) k 5-8 52 (5.3) k 5-8 47 (4.3) k 5-8 48 (4.6)Macedonia, Rep. of k 5,9 99 (1.0) k 5 99 (0.9) k 8 97 (1.5) j 9 92 (2.5)Malaysia k 8 98 (1.3) k 7-8 89 (2.7) j 10 37 (4.0) j 10 92 (2.0)Moldova, Rep. of k 6-8 s 31 (8.7) k 7 47 (10.8) k 7,9 s 90 (5.6) k 6-9 s 94 (3.9)Morocco k -- s 76 (5.4) k -- 24 (6.6) j -- s 10 (4.5) j -- s 67 (6.6)Netherlands k -- r 37 (5.8) k -- r 40 (5.5) j -- r 66 (5.5) k -- r 93 (2.9)New Zealand k 8-9 73 (3.9) k 8-9 58 (5.3) k K-12 11 (3.0) k K-12 24 (3.9)Norway k 6-7 42 (4.2) k 6-7 54 (4.0) k 2,4,8 58 (3.9) k 2,6,8 44 (4.5)Palestinian Nat'l Auth. k 7,10-12 60 (3.8) k 4,7-12 56 (4.0) k 6-7,9-12 55 (4.2) k 7-12 48 (4.3)Philippines k 8 97 (1.3) k 8 88 (2.5) k 8 78 (4.2) k 8 71 (4.0)Romania k 8,12 99 (0.6) k 8,12 99 (0.7) k 4-7,9-11 94 (2.0) k 4-7,11 97 (1.5)Russian Federation k 6-8,10 – – k 6-8 – – j 9 – – j 9 – –Saudi Arabia k -- 76 (4.3) k -- 70 (5.8) j 10-12 28 (3.7) k -- 32 (4.9)Scotland k 7 s 79 (3.4) k 7 53 (3.5) n 8 s 21 (3.1) k 8 s 26 (3.5)Serbia k 7 92 (2.6) k 7 92 (2.4) k 8 95 (1.9) k 8 93 (1.9)Singapore k 8 73 (2.2) k 8 69 (2.0) j 10 48 (2.1) j 10 35 (2.2)Slovak Republic j 9 50 (5.1) j 9 60 (4.9) k 7 96 (2.0) k 7 97 (1.6)Slovenia k 8 93 (2.0) k 8 94 (2.1) j 10 72 (3.7) k 5 89 (2.3)South Africa k -- r 79 (3.2) n -- r 66 (4.1) n -- r 55 (3.9) n -- r 50 (4.2)Sweden k 8 r 74 (3.8) k 8 r 82 (2.9) k 8 r 55 (4.0) k 8 r 65 (3.7)Syrian Arab Republic n -- – – k -- – – k -- – – k -- – –Tunisia j 11 94 (2.0) j 11 26 (3.7) j 12 65 (4.0) j -- 47 (4.3)United States k -- r 90 (2.0) k -- r 88 (2.3) k -- r 77 (2.9) k -- r 81 (2.5)
¶ England k 5-8 x x j 9 x x k 7 x x k 8 x xInternational Avg. 69 (0.6) 63 (0.6) 58 (0.6) 63 (0.6)
Benchmarking ParticipantsBasque Country, Spain j -- 62 (5.2) j -- 63 (4.6) k -- 45 (5.3) k -- 67 (5.4)Indiana State, US k -- 87 (4.3) k -- 85 (4.0) k -- 86 (4.4) k -- 90 (4.0)Ontario Province, Can. k 7 94 (1.9) k 7 90 (2.9) k 8 48 (5.2) k 5-8 61 (4.4)Quebec Province, Can. k -- r 82 (3.8) k -- r 74 (4.5) j 9 r 6 (2.3) j 9 r 12 (3.1)
Common infectious diseases Preventive medicine methodsThe interaction of livingorganisms in an ecosystem Cycling of materials in nature
Gra
de(s
) top
ic is
inte
nded
to b
eta
ught
Perc
ent o
f stu
dent
sta
ught
the
topi
c
Stud
ent p
opul
atio
nin
tend
ed to
topi
c th
roug
h8t
h gr
ade
be ta
ught
Gra
de(s
) top
ic is
inte
nded
to b
eta
ught
Perc
ent o
f stu
dent
sta
ught
the
topi
c
Stud
ent p
opul
atio
nin
tend
ed to
topi
c th
roug
h8t
h gr
ade
be ta
ught
Gra
de(s
) top
ic is
inte
nded
to b
eta
ught
Perc
ent o
f stu
dent
sta
ught
the
topi
c
Stud
ent p
opul
atio
nin
tend
ed to
topi
c th
roug
h8t
h gr
ade
be ta
ught
Gra
de(s
) top
ic is
inte
nded
to b
eta
ught
Perc
ent o
f stu
dent
sta
ught
the
topi
c
Stud
ent p
opul
atio
nin
tend
ed to
topi
c th
roug
h8t
h gr
ade
be ta
ught
k
n
j
Not
incl
uded
in t
he c
urric
ulum
thr
ough
eig
hth
grad
eA
ll or
alm
ost
all s
tude
nts
Onl
y th
e m
ore
able
stu
dent
s
2,5-6,11-
Exhibit 5.9: Intended and Taught TIMSS Life Science Topics (…Continued)
Background data on intended curriculum provided by National Research Coordinators, and on imple-mented curriculum by teachers at the time of testing.
For countries that teach science as separate subjects at grade 8, data are based on biology teachers only.
¶ Did not satisfy guidelines for sample participation rates (see Exhibit A.9).
( ) Standard errors appear in parentheses. Because results are rounded to the nearest whole number, some totals may appear inconsistent.
A dash (–) indicates comparable data are not available.
An “r” indicates data are available for at least 70 but less than 85% of the students. An “s” indicates data are available for at least 50 but less than 70% of the students. An “x” indicates data are available for less than 50% of the students.
TIMSS & PIRLS INTERNATIONAL STUDY CENTER, LYNCH SCHOOL OF EDUCATION, BOSTON COLLEGE 217
CHAPTER 5: THE SCIENCE CURRICULUM
Chemistry topics were also generally included in participants’ eighth-grade intended curricula and widely taught, as shown in Exhibit 5.10. The most frequently reported topic – “classifi cation and composi-tion of matter” – was included for all or almost all students in 43 of the participating entities and taught to 85 percent of students, on average. Of “properties of solutions,” “the particulate structure of matter,” and “properties and uses of water,” each was included in the curricula of at least 35 participants, and each was taught to 78 percent of students. In contrast, “classifi cation of familiar chemical transformations” was included in the intended curriculum of just 17 participants, and was taught to just 47 percent of students, on average. Most participants indicated that this topic would be taught in later grades.
The TIMSS physics topics were widely included in participants’ intended curricula at the eighth grade. Of the ten physics topics, three were in the curricula of at least 40 participants (“physical states and changes of matter,” “the processes of melting, freezing, evaporation, and condensation,” and “basic properties and behavior of light”), and the remaining seven in the curriculum of at least 34 participants (see Exhibit 5.11). Coverage in the classroom varied somewhat, however, from 85 percent of students, on average, having been taught “physical states and changes in matter” to just 51 percent having been taught “properties of permanent magnets and electromagnets.” The latter topic also was one of those in the curriculum of fewest participants (34).
As noted earlier, the 11 earth science topics were included in fewer curricula than the other eighth-grade science topics. As shown in Exhibit 5.12, only one topic, “Earth’s water cycle,” appeared in the curricula of as many as 40 participants. A further seven were included in the curricula of between 30 and 40 participants. The two topics with the least coverage – “geological processes occurring over billions of years” and “the physical features of Earth” – were reported in the cur-riculum of between 20 and 30 participants. The percentages of students taught the topics in the classroom were rather similar, ranging from
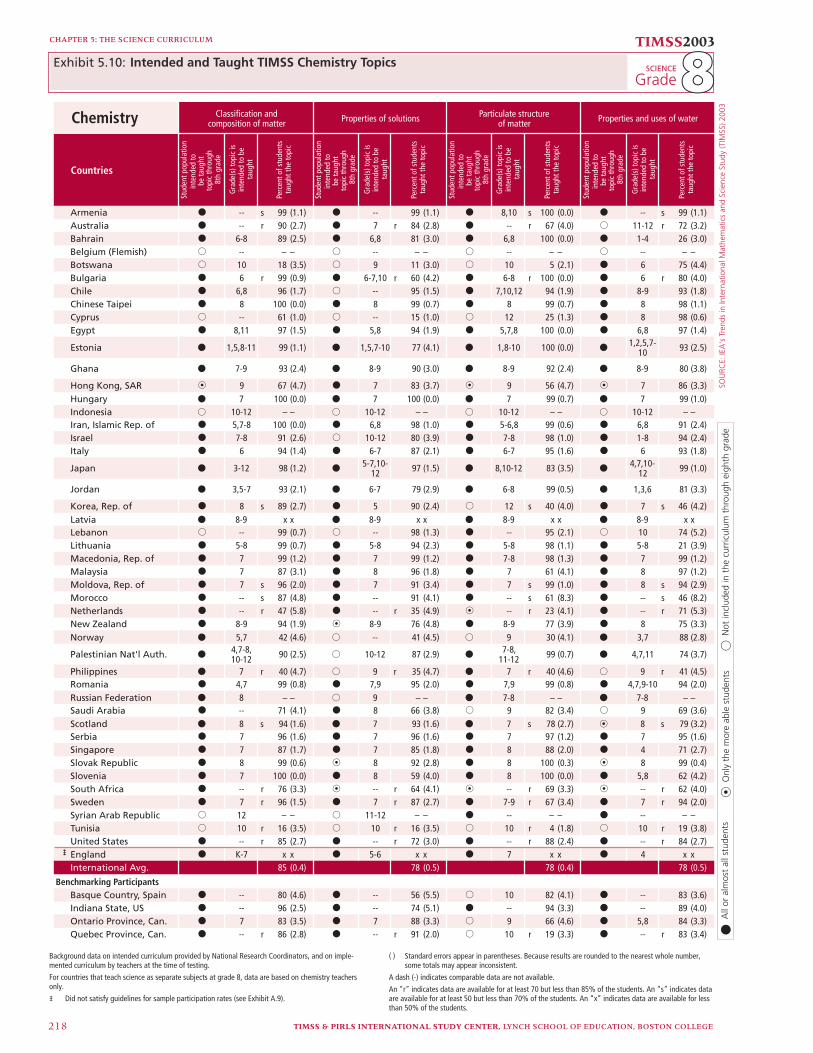
SOU
RCE:
IEA
's T
rend
s in
Inte
rnat
iona
l Mat
hem
atic
s an
d Sc
ienc
e St
udy
(TIM
SS) 2
003
TIMSS & PIRLS INTERNATIONAL STUDY CENTER, LYNCH SCHOOL OF EDUCATION, BOSTON COLLEGE218
CHAPTER 5: THE SCIENCE CURRICULUM
TIMSS2003
Grade88SCIENCE Exhibit 5.10:
Chemistry
Countries
Armenia k -- s 99 (1.1) k -- 99 (1.1) k 8,10 s 100 (0.0) k -- s 99 (1.1)Australia k -- r 90 (2.7) k 7 r 84 (2.8) k -- r 67 (4.0) j 11-12 r 72 (3.2)Bahrain k 6-8 89 (2.5) k 6,8 81 (3.0) k 6,8 100 (0.0) k 1-4 26 (3.0)Belgium (Flemish) j -- – – j -- – – j -- – – j -- – –Botswana j 10 18 (3.5) j 9 11 (3.0) j 10 5 (2.1) k 6 75 (4.4)Bulgaria k 6 r 99 (0.9) k 6-7,10 r 60 (4.2) k 6-8 r 100 (0.0) k 6 r 80 (4.0)Chile k 6,8 96 (1.7) j -- 95 (1.5) k 7,10,12 94 (1.9) k 8-9 93 (1.8)Chinese Taipei k 8 100 (0.0) k 8 99 (0.7) k 8 99 (0.7) k 8 98 (1.1)Cyprus j -- 61 (1.0) j -- 15 (1.0) j 12 25 (1.3) k 8 98 (0.6)Egypt k 8,11 97 (1.5) k 5,8 94 (1.9) k 5,7,8 100 (0.0) k 6,8 97 (1.4)
Estonia k 1,5,8-11 99 (1.1) k 1,5,7-10 77 (4.1) k 1,8-10 100 (0.0) k1,2,5,7-
10 93 (2.5)
Ghana k 7-9 93 (2.4) k 8-9 90 (3.0) k 8-9 92 (2.4) k 8-9 80 (3.8)
Hong Kong, SAR n 9 67 (4.7) k 7 83 (3.7) n 9 56 (4.7) n 7 86 (3.3)Hungary k 7 100 (0.0) k 7 100 (0.0) k 7 99 (0.7) k 7 99 (1.0)Indonesia j 10-12 – – j 10-12 – – j 10-12 – – j 10-12 – –Iran, Islamic Rep. of k 5,7-8 100 (0.0) k 6,8 98 (1.0) k 5-6,8 99 (0.6) k 6,8 91 (2.4)Israel k 7-8 91 (2.6) j 10-12 80 (3.9) k 7-8 98 (1.0) k 1-8 94 (2.4)Italy k 6 94 (1.4) k 6-7 87 (2.1) k 6-7 95 (1.6) k 6 93 (1.8)
Japan k 3-12 98 (1.2) k5-7,10-
12 97 (1.5) k 8,10-12 83 (3.5) k4,7,10-
12 99 (1.0)
Jordan k 3,5-7 93 (2.1) k 6-7 79 (2.9) k 6-8 99 (0.5) k 1,3,6 81 (3.3)
Korea, Rep. of k 8 s 89 (2.7) k 5 90 (2.4) j 12 s 40 (4.0) k 7 s 46 (4.2)Latvia k 8-9 x x k 8-9 x x k 8-9 x x k 8-9 x xLebanon j -- 99 (0.7) j -- 98 (1.3) k -- 95 (2.1) j 10 74 (5.2)Lithuania k 5-8 99 (0.7) k 5-8 94 (2.3) k 5-8 98 (1.1) k 5-8 21 (3.9)Macedonia, Rep. of k 7 99 (1.2) k 7 99 (1.2) k 7-8 98 (1.3) k 7 99 (1.2)Malaysia k 7 87 (3.1) k 8 96 (1.8) k 7 61 (4.1) k 8 97 (1.2)Moldova, Rep. of k 7 s 96 (2.0) k 7 91 (3.4) k 7 s 99 (1.0) k 8 s 94 (2.9)Morocco k -- s 87 (4.8) k -- 91 (4.1) k -- s 61 (8.3) k -- s 46 (8.2)Netherlands k -- r 47 (5.8) k -- r 35 (4.9) n -- r 23 (4.1) k -- r 71 (5.3)New Zealand k 8-9 94 (1.9) n 8-9 76 (4.8) k 8-9 77 (3.9) k 8 75 (3.3)Norway k 5,7 42 (4.6) j -- 41 (4.5) j 9 30 (4.1) k 3,7 88 (2.8)
Palestinian Nat'l Auth. k4,7-8,10-12 90 (2.5) j 10-12 87 (2.9) k
7-8,11-12 99 (0.7) k 4,7,11 74 (3.7)
Philippines k 7 r 40 (4.7) j 9 r 35 (4.7) k 7 r 40 (4.6) j 9 r 41 (4.5)Romania k 4,7 99 (0.8) k 7,9 95 (2.0) k 7,9 99 (0.8) k 4,7,9-10 94 (2.0)Russian Federation k 8 – – j 9 – – k 7-8 – – k 7-8 – –Saudi Arabia k -- 71 (4.1) k 8 66 (3.8) j 9 82 (3.4) j 9 69 (3.6)Scotland k 8 s 94 (1.6) k 7 93 (1.6) k 7 s 78 (2.7) n 8 s 79 (3.2)Serbia k 7 96 (1.6) k 7 96 (1.6) k 7 97 (1.2) k 7 95 (1.6)Singapore k 7 87 (1.7) k 7 85 (1.8) k 8 88 (2.0) k 4 71 (2.7)Slovak Republic k 8 99 (0.6) n 8 92 (2.8) k 8 100 (0.3) n 8 99 (0.4)Slovenia k 7 100 (0.0) k 8 59 (4.0) k 8 100 (0.0) k 5,8 62 (4.2)South Africa k -- r 76 (3.3) n -- r 64 (4.1) n -- r 69 (3.3) n -- r 62 (4.0)Sweden k 7 r 96 (1.5) k 7 r 87 (2.7) k 7-9 r 67 (3.4) k 7 r 94 (2.0)Syrian Arab Republic j 12 – – j 11-12 – – k -- – – k -- – –Tunisia j 10 r 16 (3.5) j 10 r 16 (3.5) j 10 r 4 (1.8) j 10 r 19 (3.8)United States k -- r 85 (2.7) k -- r 72 (3.0) k -- r 88 (2.4) k -- r 84 (2.7)
¶ England k K-7 x x k 5-6 x x k 7 x x k 4 x xInternational Avg. 85 (0.4) 78 (0.5) 78 (0.4) 78 (0.5)
Benchmarking ParticipantsBasque Country, Spain k -- 80 (4.6) k -- 56 (5.5) j 10 82 (4.1) k -- 83 (3.6)Indiana State, US k -- 96 (2.5) k -- 74 (5.1) k -- 94 (3.3) k -- 89 (4.0)Ontario Province, Can. k 7 83 (3.5) k 7 88 (3.3) j 9 66 (4.6) k 5,8 84 (3.3)Quebec Province, Can. k -- r 86 (2.8) k -- r 91 (2.0) j 10 r 19 (3.3) k -- r 83 (3.4)
Classification andcomposition of matter Properties of solutions Particulate structure
of matter Properties and uses of water
k
n
j
Not
incl
uded
in t
he c
urric
ulum
thr
ough
eig
hth
grad
eA
ll or
alm
ost
all s
tude
nts
Onl
y th
e m
ore
able
stu
dent
s
Gra
de(s
) top
ic is
inte
nded
to b
eta
ught
Perc
ent o
f stu
dent
sta
ught
the
topi
c
Stud
ent p
opul
atio
nin
tend
ed to
topi
c th
roug
h8t
h gr
ade
be ta
ught
Gra
de(s
) top
ic is
inte
nded
to b
eta
ught
Perc
ent o
f stu
dent
sta
ught
the
topi
c
Stud
ent p
opul
atio
nin
tend
ed to
topi
c th
roug
h8t
h gr
ade
be ta
ught
Gra
de(s
) top
ic is
inte
nded
to b
eta
ught
Perc
ent o
f stu
dent
sta
ught
the
topi
c
Stud
ent p
opul
atio
nin
tend
ed to
topi
c th
roug
h8t
h gr
ade
be ta
ught
Gra
de(s
) top
ic is
inte
nded
to b
eta
ught
Perc
ent o
f stu
dent
sta
ught
the
topi
c
Stud
ent p
opul
atio
nin
tend
ed to
topi
c th
roug
h8t
h gr
ade
be ta
ught
Intended and Taught TIMSS Chemistry Topics
Background data on intended curriculum provided by National Research Coordinators, and on imple-mented curriculum by teachers at the time of testing.
For countries that teach science as separate subjects at grade 8, data are based on chemistry teachers only.
¶ Did not satisfy guidelines for sample participation rates (see Exhibit A.9).
( ) Standard errors appear in parentheses. Because results are rounded to the nearest whole number, some totals may appear inconsistent.
A dash (-) indicates comparable data are not available.
An “r” indicates data are available for at least 70 but less than 85% of the students. An “s” indicates data are available for at least 50 but less than 70% of the students. An “x” indicates data are available for less than 50% of the students.

SOU
RCE:
IEA
's T
rend
s in
Inte
rnat
iona
l Mat
hem
atic
s an
d Sc
ienc
e St
udy
(TIM
SS) 2
003
CHAPTER 5: THE SCIENCE CURRICULUM TIMSS2003
GradeSCIENCE
TIMSS & PIRLS INTERNATIONAL STUDY CENTER, LYNCH SCHOOL OF EDUCATION, BOSTON COLLEGE 219
Chemistry
Countries
Armenia k -- s 100 (0.0) k 8,10 99 (1.1) k 8,10 s 96 (1.7) k 8,10 s 82 (3.7)Australia j 9-10 r 46 (4.2) k -- r 67 (3.2) j 10-11 r 23 (3.1) j 10 r 19 (2.4)Bahrain k 8 94 (2.0) k 6,8 74 (2.6) k 6-7 58 (3.3) j -- 33 (2.9)Belgium (Flemish) j -- – – j -- – – j -- – – j -- – –Botswana j 10 3 (1.6) j 10 4 (2.0) j 10 2 (1.2) j 11 3 (1.5)Bulgaria k 7-8 r 99 (0.8) k 6-8 r 84 (4.0) k 6,8 r 83 (3.9) j 9-10 r 43 (4.6)Chile j -- 70 (3.7) k 8,10-12 82 (3.1) k 8,11 67 (3.7) k 6,11-12 71 (3.4)Chinese Taipei j 9 35 (4.2) k 8 99 (0.9) k 8 97 (1.4) k 8 95 (1.9)Cyprus k 8 99 (0.4) k 8 31 (1.0) j -- 11 (1.0) j -- 28 (1.1)Egypt k 5,8 93 (2.1) k 4,8 95 (1.8) k 8 98 (1.3) k 8 96 (1.5)Estonia k 8-11 83 (3.9) k 7-11 91 (3.5) k 5,7-11 92 (2.9) k 7-10 38 (5.0)Ghana k 7-9 43 (4.4) k 7-8 59 (4.4) k 7-8 28 (4.2) j 9 26 (4.5)Hong Kong, SAR k 8 95 (2.0) j 10 22 (3.6) j 10 41 (4.5) j 10 25 (4.2)Hungary k 8 93 (2.1) k 7 96 (1.6) k 7 91 (2.3) k 7 94 (2.1)Indonesia j 10-12 – – j 10-12 – – j 10-12 – – j 10-12 – –Iran, Islamic Rep. of k 7-8 81 (3.0) k 5,7-8 92 (2.2) k 5,7-8 89 (2.6) k 8 57 (4.2)Israel k 7-8 49 (4.9) k 7-8 82 (3.2) k 7-8 81 (3.1) j 10-12 32 (4.3)Italy k 6-8 63 (3.5) k 6-8 62 (3.6) k 6-7 82 (2.8) k 6-8 61 (3.5)
Japan k6,7,
10-12 65 (4.0) k 5-12 91 (2.5) k 6,8-12 75 (3.7) j 9-12 30 (4.2)
Jordan k 6 64 (4.2) k 6 76 (3.6) k 8 91 (2.6) k 8 37 (4.6)Korea, Rep. of j 10 s 16 (3.0) j 9 28 (3.3) j 11 s 22 (3.6) j 12 s 21 (2.5)Latvia k 8-9 x x k 8-9 x x k 8-9 x x k 8-9 x xLebanon k -- 69 (4.6) k -- r 94 (2.9) k -- 88 (3.3) k -- 83 (3.6)Lithuania k -- 5 (2.3) k 7-8 84 (3.1) k 7-8 70 (4.1) j 9-10 63 (4.4)Macedonia, Rep. of k 8 99 (1.2) k 7 96 (1.9) k 7-8 97 (1.5) k 7-8 90 (2.9)Malaysia k 8 97 (1.6) j 10 55 (4.7) k 7 83 (3.2) j 10 72 (4.1)Moldova, Rep. of k 8 s 96 (2.0) k 8 96 (2.2) k 8 s 93 (2.2) j 9 s 88 (2.7)Morocco j -- s 23 (6.5) k -- 83 (5.4) k -- s 96 (3.0) j -- s 38 (7.1)Netherlands k -- r 20 (4.3) k -- r 11 (3.3) k -- r 47 (5.2) n -- r 11 (3.9)New Zealand k 8-9 32 (5.1) n 8-9 64 (4.5) n 8-9 28 (4.8) j 10 22 (4.4)
Norway k 8,10 – – k 3,5,9 19 (3.3) k 8-9 36 (4.7) j -- 15 (2.5)
Palestinian Nat'l Auth. k 8-9 90 (2.5) k 8-12 60 (4.6) k3,8,
10-12 64 (4.4) j 11-12 17 (3.2)
Philippines j 9 r 40 (4.6) k 7 r 36 (4.7) j 9 r 33 (4.6) n 9 r 34 (4.3)Romania k 8-10 98 (1.3) k 7-10 98 (1.3) k 7-8,10 95 (2.0) k 7,10 84 (3.2)Russian Federation k 8 – – k 8 – – k 8 – – k 8 – –Saudi Arabia j 9 41 (3.7) k -- 66 (4.3) k -- 87 (2.7) j 10-12 21 (5.3)Scotland k 8 s 90 (2.0) k 7 71 (3.2) k 7 s 59 (3.3) k 7 s 38 (3.5)Serbia k 7 96 (1.6) k 7 95 (1.8) k 7 97 (1.4) j -- 85 (3.2)Singapore k 7 81 (2.3) k 8 77 (2.5) k 8 55 (2.8) j 10 53 (2.7)Slovak Republic k 8-9 75 (4.5) k 8-9 79 (4.1) k 8 45 (4.8) k 8 11 (2.3)Slovenia j 9 43 (4.2) k 8 89 (2.8) k 8 78 (3.9) k 8 95 (1.7)South Africa j -- r 40 (4.3) j -- r 43 (4.0) j -- r 43 (4.0) j -- r 40 (3.5)Sweden k 8 r 83 (2.9) n 7-9 r 50 (3.7) n 8-9 r 61 (3.5) n 8-9 r 18 (2.5)Syrian Arab Republic j 9 – – j 12 – – k -- – – j 11-12 – –Tunisia j 11 r 19 (3.6) j 10 r 11 (3.1) j 10 r 13 (3.1) j 10 r 9 (2.7)United States k -- r 66 (3.3) k -- r 73 (3.0) n -- r 58 (3.4) j -- r 60 (3.1)
¶ England k 6 x x k 6,8 x x k 8 x x j -- x xInternational Avg. 65 (0.5) 68 (0.5) 65 (0.5) 47 (0.6)
Benchmarking ParticipantsBasque Country, Spain j 10 15 (4.1) n 11 44 (5.8) j 12 43 (5.2) n 10 26 (4.6)Indiana State, US k -- 61 (5.7) j 9-12 87 (4.7) j 9-12 67 (5.8) j 9-12 66 (6.1)Ontario Province, Can. j 10 38 (4.3) k 5 42 (4.5) j 10 32 (4.3) j 10 50 (4.5)Quebec Province, Can. j 10 r 16 (3.9) k -- r 13 (2.7) j 11 r 50 (5.2) j 11 r 42 (4.9)
The properties and commonuses of acids and bases Chemical change The need for oxygen
in common oxidation reactionsClassification of familiarchemical transformations
k
n
j
Not
incl
uded
in t
he c
urric
ulum
thr
ough
eig
hth
grad
eA
ll or
alm
ost
all s
tude
nts
Onl
y th
e m
ore
able
stu
dent
s
Gra
de(s
) top
ic is
inte
nded
to b
eta
ught
Perc
ent o
f stu
dent
sta
ught
the
topi
c
Stud
ent p
opul
atio
nin
tend
ed to
topi
c th
roug
h8t
h gr
ade
be ta
ught
Gra
de(s
) top
ic is
inte
nded
to b
eta
ught
Perc
ent o
f stu
dent
sta
ught
the
topi
c
Stud
ent p
opul
atio
nin
tend
ed to
topi
c th
roug
h8t
h gr
ade
be ta
ught
Gra
de(s
) top
ic is
inte
nded
to b
eta
ught
Perc
ent o
f stu
dent
sta
ught
the
topi
c
Stud
ent p
opul
atio
nin
tend
ed to
topi
c th
roug
h8t
h gr
ade
be ta
ught
Gra
de(s
) top
ic is
inte
nded
to b
eta
ught
Perc
ent o
f stu
dent
sta
ught
the
topi
c
Stud
ent p
opul
atio
nin
tend
ed to
topi
c th
roug
h8t
h gr
ade
be ta
ught
Background data on intended curriculum provided by National Research Coordinators, and on imple-mented curriculum by teachers at the time of testing.
For countries that teach science as separate subjects at grade 8, data are based on chemistry teachers only.
¶ Did not satisfy guidelines for sample participation rates (see Exhibit A.9).
( ) Standard errors appear in parentheses. Because results are rounded to the nearest whole number, some totals may appear inconsistent.
A dash (-) indicates comparable data are not available.
An “r” indicates data are available for at least 70 but less than 85% of the students. An “s” indicates data are available for at least 50 but less than 70% of the students. An “x” indicates data are available for less than 50% of the students.
88Intended and Taught TIMSS Chemistry TopicsExhibit 5.10:
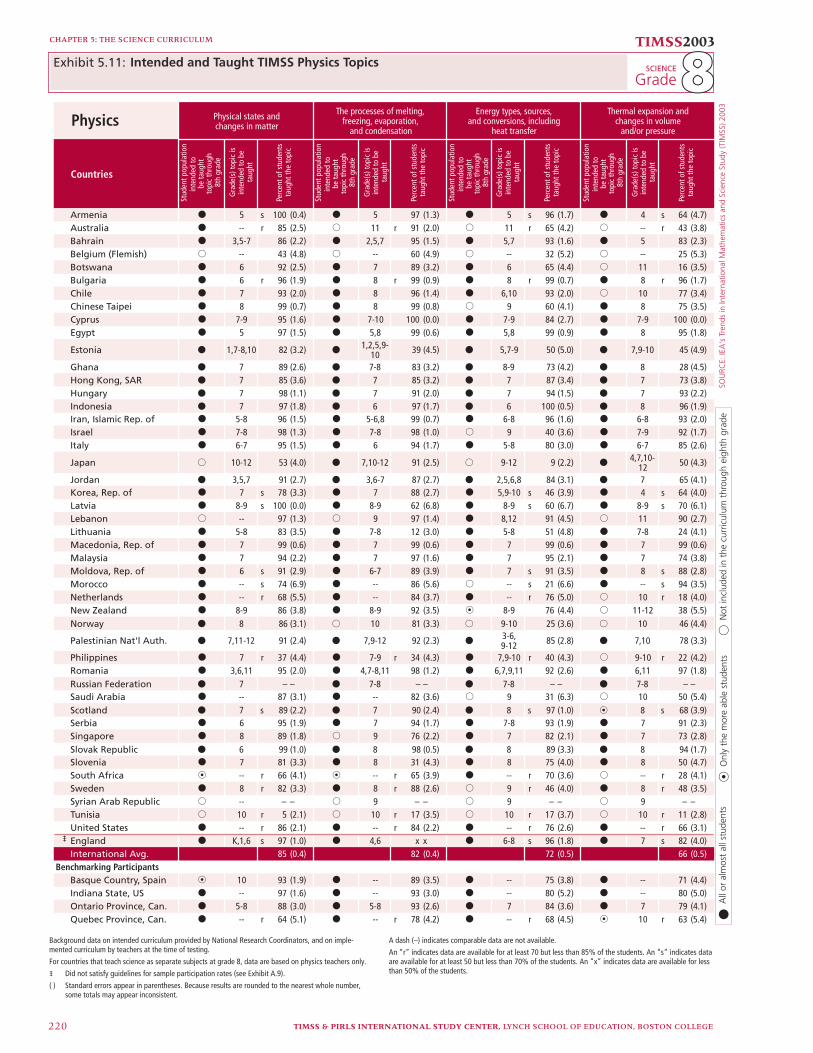
SOU
RCE:
IEA
's T
rend
s in
Inte
rnat
iona
l Mat
hem
atic
s an
d Sc
ienc
e St
udy
(TIM
SS) 2
003
TIMSS & PIRLS INTERNATIONAL STUDY CENTER, LYNCH SCHOOL OF EDUCATION, BOSTON COLLEGE220
CHAPTER 5: THE SCIENCE CURRICULUM
TIMSS2003
Grade88SCIENCE Exhibit 5.11:
Physics
Countries
Armenia k 5 s 100 (0.4) k 5 97 (1.3) k 5 s 96 (1.7) k 4 s 64 (4.7)Australia k -- r 85 (2.5) j 11 r 91 (2.0) j 11 r 65 (4.2) j -- r 43 (3.8)Bahrain k 3,5-7 86 (2.2) k 2,5,7 95 (1.5) k 5,7 93 (1.6) k 5 83 (2.3)Belgium (Flemish) j -- 43 (4.8) j -- 60 (4.9) j -- 32 (5.2) j -- 25 (5.3)Botswana k 6 92 (2.5) k 7 89 (3.2) k 6 65 (4.4) j 11 16 (3.5)Bulgaria k 6 r 96 (1.9) k 8 r 99 (0.9) k 8 r 99 (0.7) k 8 r 96 (1.7)Chile k 7 93 (2.0) k 8 96 (1.4) k 6,10 93 (2.0) j 10 77 (3.4)Chinese Taipei k 8 99 (0.7) k 8 99 (0.8) j 9 60 (4.1) k 8 75 (3.5)Cyprus k 7-9 95 (1.6) k 7-10 100 (0.0) k 7-9 84 (2.7) k 7-9 100 (0.0)Egypt k 5 97 (1.5) k 5,8 99 (0.6) k 5,8 99 (0.9) k 8 95 (1.8)
Estonia k 1,7-8,10 82 (3.2) k1,2,5,9-
10 39 (4.5) k 5,7-9 50 (5.0) k 7,9-10 45 (4.9)
Ghana k 7 89 (2.6) k 7-8 83 (3.2) k 8-9 73 (4.2) k 8 28 (4.5)Hong Kong, SAR k 7 85 (3.6) k 7 85 (3.2) k 7 87 (3.4) k 7 73 (3.8)Hungary k 7 98 (1.1) k 7 91 (2.0) k 7 94 (1.5) k 7 93 (2.2)Indonesia k 7 97 (1.8) k 6 97 (1.7) k 6 100 (0.5) k 8 96 (1.9)Iran, Islamic Rep. of k 5-8 96 (1.5) k 5-6,8 99 (0.7) k 6-8 96 (1.6) k 6-8 93 (2.0)Israel k 7-8 98 (1.3) k 7-8 98 (1.0) j 9 40 (3.6) k 7-9 92 (1.7)Italy k 6-7 95 (1.5) k 6 94 (1.7) k 5-8 80 (3.0) k 6-7 85 (2.6)
Japan j 10-12 53 (4.0) k 7,10-12 91 (2.5) j 9-12 9 (2.2) k4,7,10-
12 50 (4.3)
Jordan k 3,5,7 91 (2.7) k 3,6-7 87 (2.7) k 2,5,6,8 84 (3.1) k 7 65 (4.1)Korea, Rep. of k 7 s 78 (3.3) k 7 88 (2.7) k 5,9-10 s 46 (3.9) k 4 s 64 (4.0)Latvia k 8-9 s 100 (0.0) k 8-9 62 (6.8) k 8-9 s 60 (6.7) k 8-9 s 70 (6.1)Lebanon j -- 97 (1.3) j 9 97 (1.4) k 8,12 91 (4.5) j 11 90 (2.7)Lithuania k 5-8 83 (3.5) k 7-8 12 (3.0) k 5-8 51 (4.8) k 7-8 24 (4.1)Macedonia, Rep. of k 7 99 (0.6) k 7 99 (0.6) k 7 99 (0.6) k 7 99 (0.6)Malaysia k 7 94 (2.2) k 7 97 (1.6) k 7 95 (2.1) k 7 74 (3.8)Moldova, Rep. of k 6 s 91 (2.9) k 6-7 89 (3.9) k 7 s 91 (3.5) k 8 s 88 (2.8)Morocco k -- s 74 (6.9) k -- 86 (5.6) j -- s 21 (6.6) k -- s 94 (3.5)Netherlands k -- r 68 (5.5) k -- 84 (3.7) k -- r 76 (5.0) j 10 r 18 (4.0)New Zealand k 8-9 86 (3.8) k 8-9 92 (3.5) n 8-9 76 (4.4) j 11-12 38 (5.5)Norway k 8 86 (3.1) j 10 81 (3.3) j 9-10 25 (3.6) j 10 46 (4.4)
Palestinian Nat'l Auth. k 7,11-12 91 (2.4) k 7,9-12 92 (2.3) k3-6,9-12 85 (2.8) k 7,10 78 (3.3)
Philippines k 7 r 37 (4.4) k 7-9 r 34 (4.3) k 7,9-10 r 40 (4.3) j 9-10 r 22 (4.2)Romania k 3,6,11 95 (2.0) k 4,7-8,11 98 (1.2) k 6,7,9,11 92 (2.6) k 6,11 97 (1.8)Russian Federation k 7 – – k 7-8 – – k 7-8 – – k 7-8 – –Saudi Arabia k -- 87 (3.1) k -- 82 (3.6) j 9 31 (6.3) j 10 50 (5.4)Scotland k 7 s 89 (2.2) k 7 90 (2.4) k 8 s 97 (1.0) n 8 s 68 (3.9)Serbia k 6 95 (1.9) k 7 94 (1.7) k 7-8 93 (1.9) k 7 91 (2.3)Singapore k 8 89 (1.8) j 9 76 (2.2) k 7 82 (2.1) k 7 73 (2.8)Slovak Republic k 6 99 (1.0) k 8 98 (0.5) k 8 89 (3.3) k 8 94 (1.7)Slovenia k 7 81 (3.3) k 8 31 (4.3) k 8 75 (4.0) k 8 50 (4.7)South Africa n -- r 66 (4.1) n -- r 65 (3.9) k -- r 70 (3.6) j -- r 28 (4.1)Sweden k 8 r 82 (3.3) k 8 r 88 (2.6) j 9 r 46 (4.0) k 8 r 48 (3.5)Syrian Arab Republic j -- – – j 9 – – j 9 – – j 9 – –Tunisia j 10 r 5 (2.1) j 10 r 17 (3.5) j 10 r 17 (3.7) j 10 r 11 (2.8)United States k -- r 86 (2.1) k -- r 84 (2.2) k -- r 76 (2.6) k -- r 66 (3.1)
¶ England k K,1,6 s 97 (1.0) k 4,6 x x k 6-8 s 96 (1.8) k 7 s 82 (4.0)International Avg. 85 (0.4) 82 (0.4) 72 (0.5) 66 (0.5)
Benchmarking ParticipantsBasque Country, Spain n 10 93 (1.9) k -- 89 (3.5) k -- 75 (3.8) k -- 71 (4.4)Indiana State, US k -- 97 (1.6) k -- 93 (3.0) k -- 80 (5.2) k -- 80 (5.0)Ontario Province, Can. k 5-8 88 (3.0) k 5-8 93 (2.6) k 7 84 (3.6) k 7 79 (4.1)Quebec Province, Can. k -- r 64 (5.1) k -- r 78 (4.2) k -- r 68 (4.5) n 10 r 63 (5.4)
Physical states andchanges in matter
The processes of melting,freezing, evaporation,
and condensation
Energy types, sources,and conversions, including
heat transfer
Thermal expansion andchanges in volume
and/or pressure
k
n
j
Not
incl
uded
in t
he c
urric
ulum
thr
ough
eig
hth
grad
eA
ll or
alm
ost
all s
tude
nts
Onl
y th
e m
ore
able
stu
dent
s
Gra
de(s
) top
ic is
inte
nded
to b
eta
ught
Perc
ent o
f stu
dent
sta
ught
the
topi
c
Stud
ent p
opul
atio
nin
tend
ed to
topi
c th
roug
h8t
h gr
ade
be ta
ught
Gra
de(s
) top
ic is
inte
nded
to b
eta
ught
Perc
ent o
f stu
dent
sta
ught
the
topi
c
Stud
ent p
opul
atio
nin
tend
ed to
topi
c th
roug
h8t
h gr
ade
be ta
ught
Gra
de(s
) top
ic is
inte
nded
to b
eta
ught
Perc
ent o
f stu
dent
sta
ught
the
topi
c
Stud
ent p
opul
atio
nin
tend
ed to
topi
c th
roug
h8t
h gr
ade
be ta
ught
Gra
de(s
) top
ic is
inte
nded
to b
eta
ught
Perc
ent o
f stu
dent
sta
ught
the
topi
c
Stud
ent p
opul
atio
nin
tend
ed to
topi
c th
roug
h8t
h gr
ade
be ta
ught
Intended and Taught TIMSS Physics Topics
Background data on intended curriculum provided by National Research Coordinators, and on imple-mented curriculum by teachers at the time of testing.
For countries that teach science as separate subjects at grade 8, data are based on physics teachers only.
¶ Did not satisfy guidelines for sample participation rates (see Exhibit A.9).
( ) Standard errors appear in parentheses. Because results are rounded to the nearest whole number, some totals may appear inconsistent.
A dash (–) indicates comparable data are not available.
An “r” indicates data are available for at least 70 but less than 85% of the students. An “s” indicates data are available for at least 50 but less than 70% of the students. An “x” indicates data are available for less than 50% of the students.

SOU
RCE:
IEA
's T
rend
s in
Inte
rnat
iona
l Mat
hem
atic
s an
d Sc
ienc
e St
udy
(TIM
SS) 2
003
CHAPTER 5: THE SCIENCE CURRICULUM TIMSS2003
GradeSCIENCE
TIMSS & PIRLS INTERNATIONAL STUDY CENTER, LYNCH SCHOOL OF EDUCATION, BOSTON COLLEGE 221
Physics
Countries
Armenia k 8 s 92 (2.0) k 8 68 (3.8) k 7 s 98 (1.1) k 8 s 94 (2.0)Australia k -- r 19 (3.5) k -- r 28 (3.4) k -- r 43 (4.4) k -- r 58 (4.1)Bahrain k 2,5,8 96 (1.6) k 2,7 91 (2.4) k 3,5-7 91 (2.3) k 3,5,8 97 (1.5)Belgium (Flemish) j -- 20 (3.6) j -- 0 (0.0) j -- 34 (3.7) j -- 3 (1.2)Botswana j 9 3 (1.4) k 8 78 (3.7) j 10 2 (1.3) j 11 2 (1.1)Bulgaria k 7 r 95 (2.8) k 7 r 86 (4.1) k 7 r 96 (2.5) k 7 r 90 (2.6)Chile j 9 36 (4.0) j 9 27 (3.2) k 6,9 55 (4.2) j 9 41 (3.7)Chinese Taipei k 8 95 (1.9) k 8 95 (1.8) k 8 41 (3.9) j 9 15 (2.9)Cyprus k 8-9 80 (2.2) j -- 6 (0.6) j -- 1 (0.2) k -- 4 (0.2)Egypt k 8 95 (1.8) k 5,8 99 (0.9) k 8 100 (0.0) k 5 82 (3.3)Estonia k 8 97 (2.2) k 8,11 31 (4.3) k 3,9,11 6 (2.1) k 3,9 5 (1.9)Ghana k 8-9 24 (4.1) k 8-9 10 (2.8) k 8-9 15 (3.0) j 9 24 (3.9)Hong Kong, SAR j 9 12 (2.3) n 8 64 (4.3) k 8 98 (1.3) n 8 61 (4.1)Hungary k 8 33 (3.7) j 11 32 (3.8) k 8 98 (0.7) k 8 93 (1.6)Indonesia k 6,8 97 (1.5) k 7 100 (0.0) j 9 10 (2.9) j 9 13 (3.2)Iran, Islamic Rep. of k 5,7-8 97 (1.3) k 7-8 86 (2.9) k 8 80 (3.4) k 8 90 (2.5)Israel k 6-12 23 (3.3) k 6-12 16 (3.4) k 5-8 84 (3.0) k 5-8 r 61 (4.6)Italy k 6-8 38 (3.5) k 8 37 (3.6) k 8 54 (3.8) k 8 44 (3.7)
Japan k3,7,10-
12 99 (1.0) k3,7,10-
12 99 (1.0) k3,4,8,10-12 100 (0.0) k
3,6,8,10-12 89 (2.7)
Jordan k 2,4,8 95 (1.9) k 4,8 97 (1.5) k 4,6-7 97 (1.3) k 1,4 92 (2.3)
Korea, Rep. of k 7 s 67 (3.4) k 7 57 (3.7) k 8 s 87 (2.8) k 6 s 26 (3.8)Latvia k 8-9 s 100 (0.0) k 8-9 96 (2.1) k 8-9 s 11 (3.7) k 8-9 s 9 (3.5)Lebanon k 8 56 (4.5) k 8 68 (4.8) j 9-10,12 90 (2.6) j 11-12 74 (4.7)
Lithuania k 5-8 58 (4.3) k 5-8 51 (4.6) k 5-8 10 (2.2) k 5-8 6 (2.3)
Macedonia, Rep. of k 8 97 (1.5) j 10 93 (2.3) k 8 99 (0.9) k 8 97 (1.5)Malaysia k 8 97 (1.5) k 8 95 (1.9) j 9 8 (2.3) j 9 12 (2.8)Moldova, Rep. of k 6,8 s 58 (4.4) k 7 29 (4.3) k 8 s 65 (4.6) k 8 s 70 (4.3)Morocco k -- s 48 (8.1) j -- 10 (4.3) k -- s 94 (3.6) k -- s 83 (6.4)Netherlands k -- r 76 (4.8) k -- r 57 (5.2) k -- r 65 (5.0) k -- r 20 (4.4)New Zealand k 6-9 71 (5.0) k 6-7 26 (4.1) n 8-9 16 (3.6) k 6-9 14 (3.1)Norway k 1,6 3 (1.5) k 2,7 5 (1.9) k 7,9 8 (2.6) k 5,7 4 (1.5)
Palestinian Nat'l Auth. k3,8,
11-12 96 (1.7) k3,8,
11-12 98 (1.0) k 3-12 59 (4.0) k 3,7,12 88 (2.8)
Philippines j 10 r 29 (4.2) j 10 r 21 (3.9) j 10 r 22 (3.7) j 10 r 19 (3.5)
Romania k6-7,11-
12 99 (1.1) k 7,11 94 (2.3) k 6-8,10 99 (1.1) k 6,8,10 98 (1.3)
Russian Federation k 8 – – j 9 – – k 8 – – k 8 – –Saudi Arabia k -- 93 (2.4) k -- 94 (2.1) k -- 28 (4.6) k -- 49 (5.4)Scotland k 7 s 56 (4.4) k 7-8 58 (4.7) k 8 s 90 (2.5) n 8 s 53 (4.7)Serbia k 8 95 (1.1) k 7 96 (1.4) k 8 99 (0.7) k 8 98 (0.8)Singapore k 8 90 (2.0) k 8 85 (1.4) k 8 95 (1.0) k 3-9 52 (2.2)Slovak Republic j 9 6 (1.3) j 9 2 (1.0) k 8 97 (1.7) k 8 91 (2.1)Slovenia k 7 17 (3.0) k 7 10 (2.0) j 9 6 (2.0) j 9 8 (2.5)South Africa j -- r 20 (3.0) j -- r 20 (2.8) k -- r 70 (3.8) j -- r 38 (4.8)Sweden k 8-9 r 49 (3.7) k 8-9 r 51 (3.2) k 7 r 84 (3.0) k 8 r 65 (3.4)Syrian Arab Republic j 9,11-12 – – j 9 – – k -- – – j 12 – –Tunisia j 10 r 6 (2.2) j -- r 3 (1.6) j 10 r 22 (3.8) j 12 r 7 (2.4)
United States k -- r 63 (2.6) k -- r 58 (2.9) k -- r 55 (3.0) k -- r 57 (3.0)
¶ England k K,2,5-6 s 97 (1.1) k K,4,6 94 (2.2) k 1,3,5,6,8
x x k 2,5,7 s 96 (1.3)
International Avg. 62 (0.5) 56 (0.5) 59 (0.4) 51 (0.5)Benchmarking Participants
Basque Country, Spain n 10 52 (5.6) j 12 47 (5.8) n 10 61 (5.6) j 11 49 (5.7)Indiana State, US k -- 64 (5.4) k -- 57 (6.5) k -- 67 (6.7) k -- 64 (5.6)Ontario Province, Can. k 8 62 (5.2) k 4 46 (5.1) k 6 65 (4.3) k 6 71 (4.6)Quebec Province, Can. j 11 r 12 (2.8) j 11 r 8 (1.9) j 10 r 3 (1.6) j 10 r 5 (2.2)
Basic properties/behaviorof light Properties of sound Electric circuits and relationships
between voltage and currentProperties of permanent magnets
and electromagnets
k
n
j
Not
incl
uded
in t
he c
urric
ulum
thr
ough
eig
hth
grad
eA
ll or
alm
ost
all s
tude
nts
Onl
y th
e m
ore
able
stu
dent
s
Gra
de(s
) top
ic is
inte
nded
to b
eta
ught
Perc
ent o
f stu
dent
sta
ught
the
topi
c
Stud
ent p
opul
atio
nin
tend
ed to
topi
c th
roug
h8t
h gr
ade
be ta
ught
Gra
de(s
) top
ic is
inte
nded
to b
eta
ught
Perc
ent o
f stu
dent
sta
ught
the
topi
c
Stud
ent p
opul
atio
nin
tend
ed to
topi
c th
roug
h8t
h gr
ade
be ta
ught
Gra
de(s
) top
ic is
inte
nded
to b
eta
ught
Perc
ent o
f stu
dent
sta
ught
the
topi
c
Stud
ent p
opul
atio
nin
tend
ed to
topi
c th
roug
h8t
h gr
ade
be ta
ught
Gra
de(s
) top
ic is
inte
nded
to b
eta
ught
Perc
ent o
f stu
dent
sta
ught
the
topi
c
Stud
ent p
opul
atio
nin
tend
ed to
topi
c th
roug
h8t
h gr
ade
be ta
ught
Background data on intended curriculum provided by National Research Coordinators, and on imple-mented curriculum by teachers at the time of testing.
For countries that teach science as separate subjects at grade 8, data are based on physics teachers only.
¶ Did not satisfy guidelines for sample participation rates (see Exhibit A.9).
( ) Standard errors appear in parentheses. Because results are rounded to the nearest whole number, some totals may appear inconsistent.
A dash (–) indicates comparable data are not available.
An “r” indicates data are available for at least 70 but less than 85% of the students. An “s” indicates data are available for at least 50 but less than 70% of the students. An “x” indicates data are available for less than 50% of the students.
88Exhibit 5.11: Intended and Taught TIMSS Physics Topics (Continued…)
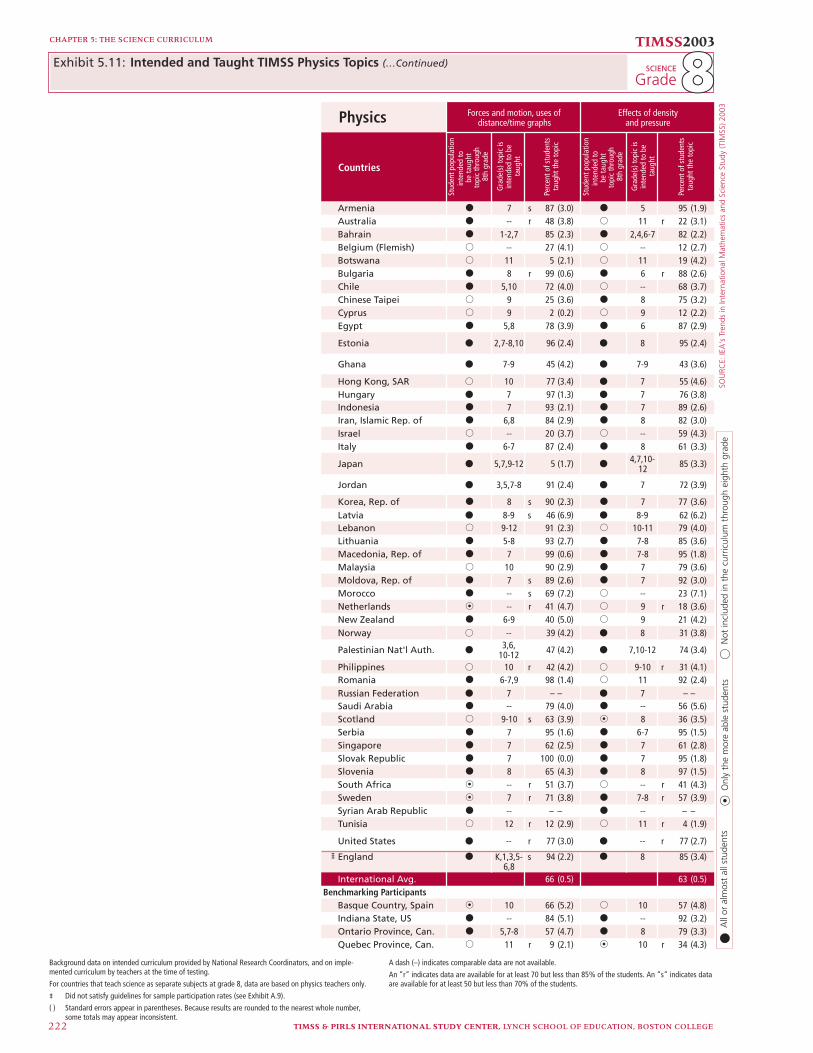
SOU
RCE:
IEA
's T
rend
s in
Inte
rnat
iona
l Mat
hem
atic
s an
d Sc
ienc
e St
udy
(TIM
SS) 2
003
TIMSS & PIRLS INTERNATIONAL STUDY CENTER, LYNCH SCHOOL OF EDUCATION, BOSTON COLLEGE222
CHAPTER 5: THE SCIENCE CURRICULUM
TIMSS2003
Grade88SCIENCE Exhibit 5.11:
Physics
Countries
Armenia k 7 s 87 (3.0) k 5 95 (1.9)Australia k -- r 48 (3.8) j 11 r 22 (3.1)Bahrain k 1-2,7 85 (2.3) k 2,4,6-7 82 (2.2)Belgium (Flemish) j -- 27 (4.1) j -- 12 (2.7)Botswana j 11 5 (2.1) j 11 19 (4.2)Bulgaria k 8 r 99 (0.6) k 6 r 88 (2.6)Chile k 5,10 72 (4.0) j -- 68 (3.7)Chinese Taipei j 9 25 (3.6) k 8 75 (3.2)Cyprus j 9 2 (0.2) j 9 12 (2.2)Egypt k 5,8 78 (3.9) k 6 87 (2.9)
Estonia k 2,7-8,10 96 (2.4) k 8 95 (2.4)
Ghana k 7-9 45 (4.2) k 7-9 43 (3.6)
Hong Kong, SAR j 10 77 (3.4) k 7 55 (4.6)Hungary k 7 97 (1.3) k 7 76 (3.8)Indonesia k 7 93 (2.1) k 7 89 (2.6)Iran, Islamic Rep. of k 6,8 84 (2.9) k 8 82 (3.0)Israel j -- 20 (3.7) j -- 59 (4.3)Italy k 6-7 87 (2.4) k 8 61 (3.3)
Japan k 5,7,9-12 5 (1.7) k4,7,10-
12 85 (3.3)
Jordan k 3,5,7-8 91 (2.4) k 7 72 (3.9)
Korea, Rep. of k 8 s 90 (2.3) k 7 77 (3.6)Latvia k 8-9 s 46 (6.9) k 8-9 62 (6.2)Lebanon j 9-12 91 (2.3) j 10-11 79 (4.0)Lithuania k 5-8 93 (2.7) k 7-8 85 (3.6)Macedonia, Rep. of k 7 99 (0.6) k 7-8 95 (1.8)Malaysia j 10 90 (2.9) k 7 79 (3.6)Moldova, Rep. of k 7 s 89 (2.6) k 7 92 (3.0)Morocco k -- s 69 (7.2) j -- 23 (7.1)Netherlands n -- r 41 (4.7) j 9 r 18 (3.6)New Zealand k 6-9 40 (5.0) j 9 21 (4.2)Norway j -- 39 (4.2) k 8 31 (3.8)
Palestinian Nat'l Auth. k3,6,
10-12 47 (4.2) k 7,10-12 74 (3.4)
Philippines j 10 r 42 (4.2) j 9-10 r 31 (4.1)Romania k 6-7,9 98 (1.4) j 11 92 (2.4)Russian Federation k 7 – – k 7 – –Saudi Arabia k -- 79 (4.0) k -- 56 (5.6)Scotland j 9-10 s 63 (3.9) n 8 36 (3.5)Serbia k 7 95 (1.6) k 6-7 95 (1.5)Singapore k 7 62 (2.5) k 7 61 (2.8)Slovak Republic k 7 100 (0.0) k 7 95 (1.8)Slovenia k 8 65 (4.3) k 8 97 (1.5)South Africa n -- r 51 (3.7) j -- r 41 (4.3)Sweden n 7 r 71 (3.8) k 7-8 r 57 (3.9)Syrian Arab Republic k -- – – k -- – –Tunisia j 12 r 12 (2.9) j 11 r 4 (1.9)
United States k -- r 77 (3.0) k -- r 77 (2.7)
¶ England k K,1,3,5-6,8
s 94 (2.2) k 8 85 (3.4)
International Avg. 66 (0.5) 63 (0.5)Benchmarking Participants
Basque Country, Spain n 10 66 (5.2) j 10 57 (4.8)Indiana State, US k -- 84 (5.1) k -- 92 (3.2)Ontario Province, Can. k 5,7-8 57 (4.7) k 8 79 (3.3)Quebec Province, Can. j 11 r 9 (2.1) n 10 r 34 (4.3)
Forces and motion, uses ofdistance/time graphs
Effects of densityand pressure
k
n
j
Not
incl
uded
in t
he c
urric
ulum
thr
ough
eig
hth
grad
eA
ll or
alm
ost
all s
tude
nts
Onl
y th
e m
ore
able
stu
dent
s
Gra
de(s
) top
ic is
inte
nded
to b
eta
ught
Perc
ent o
f stu
dent
sta
ught
the
topi
c
Stud
ent p
opul
atio
nin
tend
ed to
topi
c th
roug
h8t
h gr
ade
be ta
ught
Gra
de(s
) top
ic is
inte
nded
to b
eta
ught
Perc
ent o
f stu
dent
sta
ught
the
topi
c
Stud
ent p
opul
atio
nin
tend
ed to
topi
c th
roug
h8t
h gr
ade
be ta
ught
Intended and Taught TIMSS Physics Topics (…Continued)
Background data on intended curriculum provided by National Research Coordinators, and on imple-mented curriculum by teachers at the time of testing.
For countries that teach science as separate subjects at grade 8, data are based on physics teachers only.
¶ Did not satisfy guidelines for sample participation rates (see Exhibit A.9).
( ) Standard errors appear in parentheses. Because results are rounded to the nearest whole number, some totals may appear inconsistent.
A dash (–) indicates comparable data are not available.
An “r” indicates data are available for at least 70 but less than 85% of the students. An “s” indicates data are available for at least 50 but less than 70% of the students.
TIMSS & PIRLS INTERNATIONAL STUDY CENTER, LYNCH SCHOOL OF EDUCATION, BOSTON COLLEGE 223
CHAPTER 5: THE SCIENCE CURRICULUM
68 percent for the “Earth’s water cycle” to 54 percent for “weather data and maps, and changes in weather patterns.”
Environmental science had just three topics in the TIMSS eighth-grade science assessment; and, as noted earlier, did not receive as much emphasis as topics in other areas either in the intended or the implemented curriculum. As shown in detail in Exhibit 5.13, the three topics were included for most students in the intended curri-cula of between 30 and 39 participants. “Changes in environments” and “use and conservation of natural resources” were included in the curricula of 39 and 38 participants, respectively, and had the great-est percentages of students who were taught them – 53 percent and 56 percent, respectively. “Trends in human population and its effects on the environment” was included in 30 participants’ curricula and was taught to just 38 percent of students, on average.
At the fourth grade, 10 of the 32 TIMSS science topics were in life science. As shown in Exhibit 5.14, three of the topics – “types, char-acteristics, and classifi cation of living things,” “major body structures and their function in humans and other organisms,” and “the general steps in the life cycle of familiar organisms” – were included in two-thirds or more of participants’ intended curricula and were generally well-covered in the classroom. On average, 82 percent, 77 percent, and 78 percent of students, respectively, were taught these topics. The remaining life science topics were included in fewer participants’ curri-cula, from a maximum of 17 to a minimum of 13. The average percent-age of students taught these topics ranged from 80 percent for “ways of maintaining good health, including diet and exercise” to 53 percent for “plant and animal reproduction.”
As shown in Exhibit 5.15, the 13 TIMSS physical science topics vary considerably, both in terms of inclusion in the intended curricu-lum and in being taught in the classroom. Just three of the topics were included in the curricula of 20 or more participants – “classifi ca-tion of objects and materials based on physical properties,” "proper-ties and uses of water,” and “changes in state of water by heating and
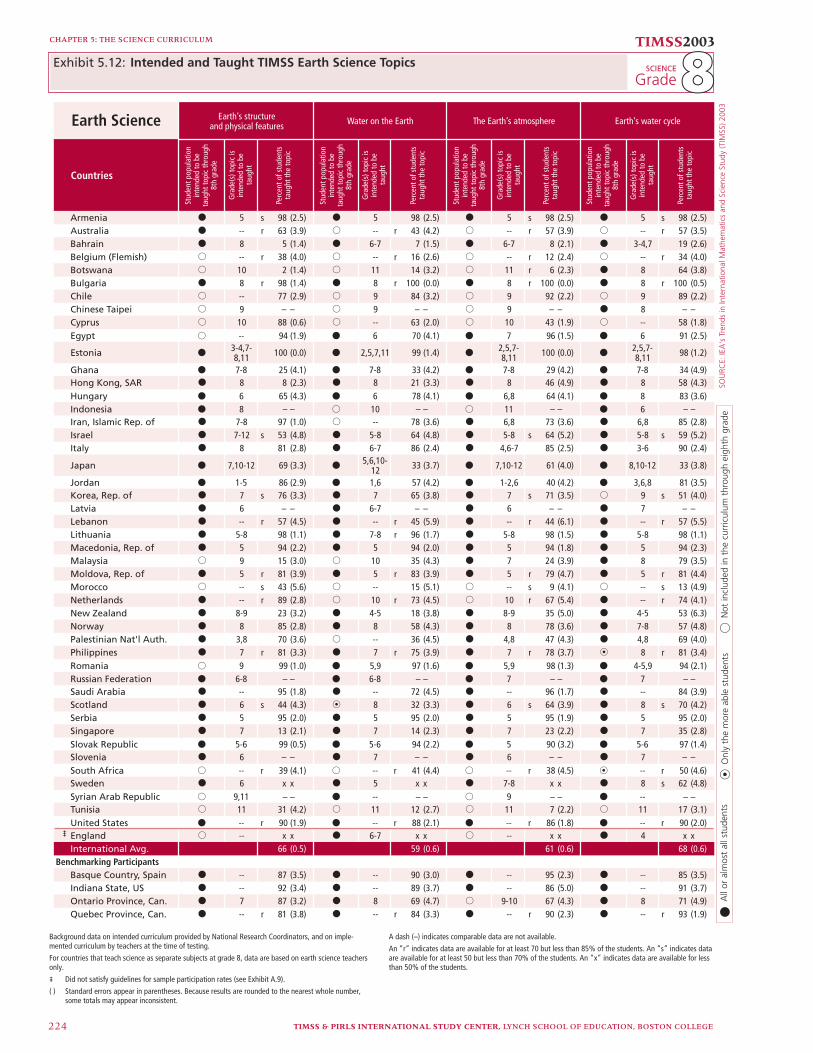
SOU
RCE:
IEA
's T
rend
s in
Inte
rnat
iona
l Mat
hem
atic
s an
d Sc
ienc
e St
udy
(TIM
SS) 2
003
TIMSS & PIRLS INTERNATIONAL STUDY CENTER, LYNCH SCHOOL OF EDUCATION, BOSTON COLLEGE224
CHAPTER 5: THE SCIENCE CURRICULUM
TIMSS2003
Grade88SCIENCE Exhibit 5.12:
Earth Science
Countries
Armenia k 5 s 98 (2.5) k 5 98 (2.5) k 5 s 98 (2.5) k 5 s 98 (2.5)Australia k -- r 63 (3.9) j -- r 43 (4.2) j -- r 57 (3.9) j -- r 57 (3.5)Bahrain k 8 5 (1.4) k 6-7 7 (1.5) k 6-7 8 (2.1) k 3-4,7 19 (2.6)Belgium (Flemish) j -- r 38 (4.0) j -- r 16 (2.6) j -- r 12 (2.4) j -- r 34 (4.0)Botswana j 10 2 (1.4) j 11 14 (3.2) j 11 r 6 (2.3) k 8 64 (3.8)Bulgaria k 8 r 98 (1.4) k 8 r 100 (0.0) k 8 r 100 (0.0) k 8 r 100 (0.5)Chile j -- 77 (2.9) j 9 84 (3.2) j 9 92 (2.2) j 9 89 (2.2)Chinese Taipei j 9 – – j 9 – – j 9 – – k 8 – –Cyprus j 10 88 (0.6) j -- 63 (2.0) j 10 43 (1.9) j -- 58 (1.8)Egypt j -- 94 (1.9) k 6 70 (4.1) k 7 96 (1.5) k 6 91 (2.5)
Estonia k3-4,7-8,11 100 (0.0) k 2,5,7,11 99 (1.4) k
2,5,7-8,11 100 (0.0) k
2,5,7-8,11 98 (1.2)
Ghana k 7-8 25 (4.1) k 7-8 33 (4.2) k 7-8 29 (4.2) k 7-8 34 (4.9)Hong Kong, SAR k 8 8 (2.3) k 8 21 (3.3) k 8 46 (4.9) k 8 58 (4.3)Hungary k 6 65 (4.3) k 6 78 (4.1) k 6,8 64 (4.1) k 8 83 (3.6)Indonesia k 8 – – j 10 – – j 11 – – k 6 – –Iran, Islamic Rep. of k 7-8 97 (1.0) j -- 78 (3.6) k 6,8 73 (3.6) k 6,8 85 (2.8)Israel k 7-12 s 53 (4.8) k 5-8 64 (4.8) k 5-8 s 64 (5.2) k 5-8 s 59 (5.2)Italy k 8 81 (2.8) k 6-7 86 (2.4) k 4,6-7 85 (2.5) k 3-6 90 (2.4)
Japan k 7,10-12 69 (3.3) k5,6,10-
12 33 (3.7) k 7,10-12 61 (4.0) k 8,10-12 33 (3.8)
Jordan k 1-5 86 (2.9) k 1,6 57 (4.2) k 1-2,6 40 (4.2) k 3,6,8 81 (3.5)Korea, Rep. of k 7 s 76 (3.3) k 7 65 (3.8) k 7 s 71 (3.5) j 9 s 51 (4.0)Latvia k 6 – – k 6-7 – – k 6 – – k 7 – –Lebanon k -- r 57 (4.5) k -- r 45 (5.9) k -- r 44 (6.1) k -- r 57 (5.5)Lithuania k 5-8 98 (1.1) k 7-8 r 96 (1.7) k 5-8 98 (1.5) k 5-8 98 (1.1)Macedonia, Rep. of k 5 94 (2.2) k 5 94 (2.0) k 5 94 (1.8) k 5 94 (2.3)Malaysia j 9 15 (3.0) j 10 35 (4.3) k 7 24 (3.9) k 8 79 (3.5)Moldova, Rep. of k 5 r 81 (3.9) k 5 r 83 (3.9) k 5 r 79 (4.7) k 5 r 81 (4.4)Morocco j -- s 43 (5.6) j -- 15 (5.1) j -- s 9 (4.1) j -- s 13 (4.9)Netherlands k -- r 89 (2.8) j 10 r 73 (4.5) j 10 r 67 (5.4) k -- r 74 (4.1)New Zealand k 8-9 23 (3.2) k 4-5 18 (3.8) k 8-9 35 (5.0) k 4-5 53 (6.3)Norway k 8 85 (2.8) k 8 58 (4.3) k 8 78 (3.6) k 7-8 57 (4.8)Palestinian Nat'l Auth. k 3,8 70 (3.6) j -- 36 (4.5) k 4,8 47 (4.3) k 4,8 69 (4.0)Philippines k 7 r 81 (3.3) k 7 r 75 (3.9) k 7 r 78 (3.7) n 8 r 81 (3.4)Romania j 9 99 (1.0) k 5,9 97 (1.6) k 5,9 98 (1.3) k 4-5,9 94 (2.1)Russian Federation k 6-8 – – k 6-8 – – k 7 – – k 7 – –Saudi Arabia k -- 95 (1.8) k -- 72 (4.5) k -- 96 (1.7) k -- 84 (3.9)Scotland k 6 s 44 (4.3) n 8 32 (3.3) k 6 s 64 (3.9) k 8 s 70 (4.2)Serbia k 5 95 (2.0) k 5 95 (2.0) k 5 95 (1.9) k 5 95 (2.0)Singapore k 7 13 (2.1) k 7 14 (2.3) k 7 23 (2.2) k 7 35 (2.8)Slovak Republic k 5-6 99 (0.5) k 5-6 94 (2.2) k 5 90 (3.2) k 5-6 97 (1.4)Slovenia k 6 – – k 7 – – k 6 – – k 7 – –South Africa j -- r 39 (4.1) j -- r 41 (4.4) j -- r 38 (4.5) n -- r 50 (4.6)Sweden k 6 x x k 5 x x k 7-8 x x k 8 s 62 (4.8)Syrian Arab Republic j 9,11 – – k -- – – j 9 – – k -- – –Tunisia j 11 31 (4.2) j 11 12 (2.7) j 11 7 (2.2) j 11 17 (3.1)United States k -- r 90 (1.9) k -- r 88 (2.1) k -- r 86 (1.8) k -- r 90 (2.0)
¶ England j -- x x k 6-7 x x j -- x x k 4 x xInternational Avg. 66 (0.5) 59 (0.6) 61 (0.6) 68 (0.6)
Benchmarking ParticipantsBasque Country, Spain k -- 87 (3.5) k -- 90 (3.0) k -- 95 (2.3) k -- 85 (3.5)Indiana State, US k -- 92 (3.4) k -- 89 (3.7) k -- 86 (5.0) k -- 91 (3.7)Ontario Province, Can. k 7 87 (3.2) k 8 69 (4.7) j 9-10 67 (4.3) k 8 71 (4.9)Quebec Province, Can. k -- r 81 (3.8) k -- r 84 (3.3) k -- r 90 (2.3) k -- r 93 (1.9)
Earth’s structureand physical features Water on the Earth The Earth’s atmosphere Earth’s water cycle
k
n
j
Not
incl
uded
in t
he c
urric
ulum
thr
ough
eig
hth
grad
eA
ll or
alm
ost
all s
tude
nts
Onl
y th
e m
ore
able
stu
dent
s
Stud
ent p
opul
atio
nin
tend
ed to
be
taug
ht to
pic
thro
ugh
8th
grad
e
Gra
de(s
) top
ic is
inte
nded
to b
eta
ught
Stud
ent p
opul
atio
nin
tend
ed to
be
taug
ht to
pic
thro
ugh
8th
grad
e
Gra
de(s
) top
ic is
inte
nded
to b
eta
ught
Stud
ent p
opul
atio
nin
tend
ed to
be
taug
ht to
pic
thro
ugh
8th
grad
e
Gra
de(s
) top
ic is
inte
nded
to b
eta
ught
Stud
ent p
opul
atio
nin
tend
ed to
be
taug
ht to
pic
thro
ugh
8th
grad
e
Gra
de(s
) top
ic is
inte
nded
to b
eta
ught
Perc
ent o
f stu
dent
sta
ught
the
topi
c
Perc
ent o
f stu
dent
sta
ught
the
topi
c
Perc
ent o
f stu
dent
sta
ught
the
topi
c
Perc
ent o
f stu
dent
sta
ught
the
topi
c
Intended and Taught TIMSS Earth Science Topics
Background data on intended curriculum provided by National Research Coordinators, and on imple-mented curriculum by teachers at the time of testing.
For countries that teach science as separate subjects at grade 8, data are based on earth science teachers only.
¶ Did not satisfy guidelines for sample participation rates (see Exhibit A.9).
( ) Standard errors appear in parentheses. Because results are rounded to the nearest whole number, some totals may appear inconsistent.
A dash (–) indicates comparable data are not available.
An “r” indicates data are available for at least 70 but less than 85% of the students. An “s” indicates data are available for at least 50 but less than 70% of the students. An “x” indicates data are available for less than 50% of the students.
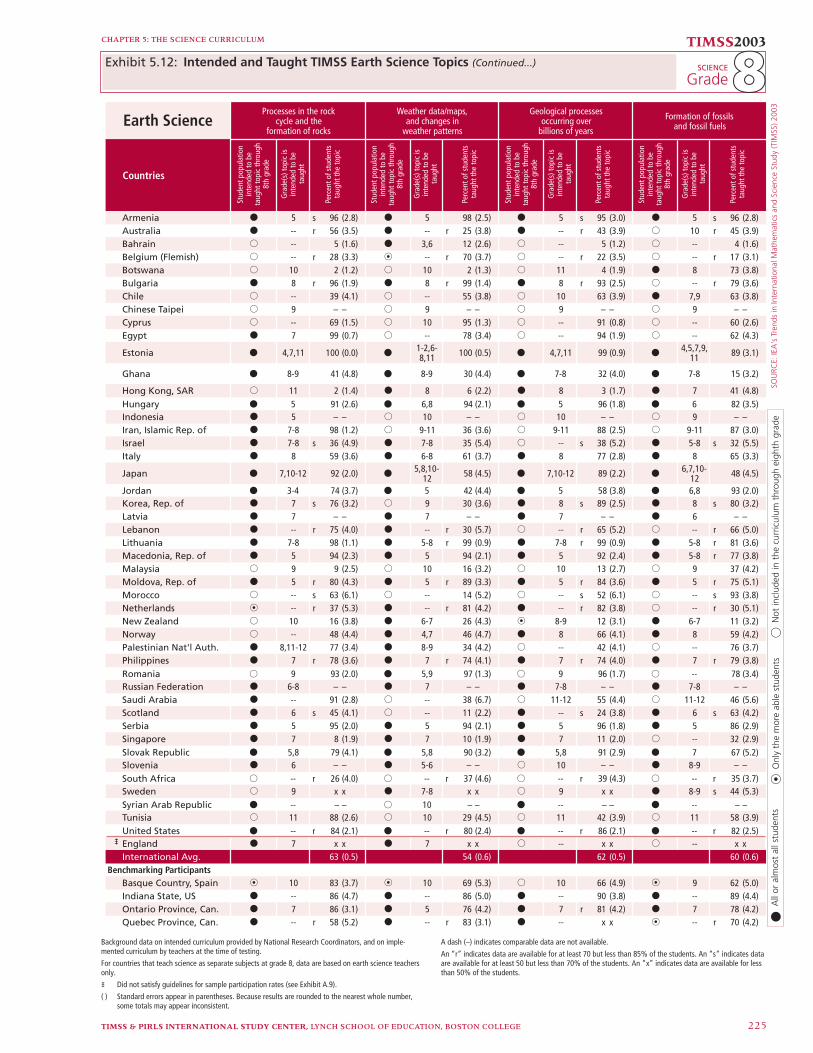
SOU
RCE:
IEA
's T
rend
s in
Inte
rnat
iona
l Mat
hem
atic
s an
d Sc
ienc
e St
udy
(TIM
SS) 2
003
CHAPTER 5: THE SCIENCE CURRICULUM TIMSS2003
GradeSCIENCE
TIMSS & PIRLS INTERNATIONAL STUDY CENTER, LYNCH SCHOOL OF EDUCATION, BOSTON COLLEGE 225
Earth Science
Countries
Armenia k 5 s 96 (2.8) k 5 98 (2.5) k 5 s 95 (3.0) k 5 s 96 (2.8)Australia k -- r 56 (3.5) k -- r 25 (3.8) k -- r 43 (3.9) j 10 r 45 (3.9)Bahrain j -- 5 (1.6) k 3,6 12 (2.6) j -- 5 (1.2) j -- 4 (1.6)Belgium (Flemish) j -- r 28 (3.3) n -- r 70 (3.7) j -- r 22 (3.5) j -- r 17 (3.1)Botswana j 10 2 (1.2) j 10 2 (1.3) j 11 4 (1.9) k 8 73 (3.8)Bulgaria k 8 r 96 (1.9) k 8 r 99 (1.4) k 8 r 93 (2.5) j -- r 79 (3.6)Chile j -- 39 (4.1) j -- 55 (3.8) j 10 63 (3.9) k 7,9 63 (3.8)Chinese Taipei j 9 – – j 9 – – j 9 – – j 9 – –Cyprus j -- 69 (1.5) j 10 95 (1.3) j -- 91 (0.8) j -- 60 (2.6)Egypt k 7 99 (0.7) j -- 78 (3.4) j -- 94 (1.9) j -- 62 (4.3)
Estonia k 4,7,11 100 (0.0) k1-2,6-8,11 100 (0.5) k 4,7,11 99 (0.9) k
4,5,7,9,11 89 (3.1)
Ghana k 8-9 41 (4.8) k 8-9 30 (4.4) k 7-8 32 (4.0) k 7-8 15 (3.2)
Hong Kong, SAR j 11 2 (1.4) k 8 6 (2.2) k 8 3 (1.7) k 7 41 (4.8)Hungary k 5 91 (2.6) k 6,8 94 (2.1) k 5 96 (1.8) k 6 82 (3.5)Indonesia k 5 – – j 10 – – j 10 – – j 9 – –Iran, Islamic Rep. of k 7-8 98 (1.2) j 9-11 36 (3.6) j 9-11 88 (2.5) j 9-11 87 (3.0)Israel k 7-8 s 36 (4.9) k 7-8 35 (5.4) j -- s 38 (5.2) k 5-8 s 32 (5.5)Italy k 8 59 (3.6) k 6-8 61 (3.7) k 8 77 (2.8) k 8 65 (3.3)
Japan k 7,10-12 92 (2.0) k5,8,10-
12 58 (4.5) k 7,10-12 89 (2.2) k6,7,10-
12 48 (4.5)
Jordan k 3-4 74 (3.7) k 5 42 (4.4) k 5 58 (3.8) k 6,8 93 (2.0)Korea, Rep. of k 7 s 76 (3.2) j 9 30 (3.6) k 8 s 89 (2.5) k 8 s 80 (3.2)Latvia k 7 – – k 7 – – k 7 – – k 6 – –Lebanon k -- r 75 (4.0) k -- r 30 (5.7) j -- r 65 (5.2) j -- r 66 (5.0)Lithuania k 7-8 98 (1.1) k 5-8 r 99 (0.9) k 7-8 r 99 (0.9) k 5-8 r 81 (3.6)Macedonia, Rep. of k 5 94 (2.3) k 5 94 (2.1) k 5 92 (2.4) k 5-8 r 77 (3.8)Malaysia j 9 9 (2.5) j 10 16 (3.2) j 10 13 (2.7) j 9 37 (4.2)Moldova, Rep. of k 5 r 80 (4.3) k 5 r 89 (3.3) k 5 r 84 (3.6) k 5 r 75 (5.1)Morocco j -- s 63 (6.1) j -- 14 (5.2) j -- s 52 (6.1) j -- s 93 (3.8)Netherlands n -- r 37 (5.3) k -- r 81 (4.2) k -- r 82 (3.8) j -- r 30 (5.1)New Zealand j 10 16 (3.8) k 6-7 26 (4.3) n 8-9 12 (3.1) k 6-7 11 (3.2)Norway j -- 48 (4.4) k 4,7 46 (4.7) k 8 66 (4.1) k 8 59 (4.2)Palestinian Nat'l Auth. k 8,11-12 77 (3.4) k 8-9 34 (4.2) j -- 42 (4.1) j -- 76 (3.7)Philippines k 7 r 78 (3.6) k 7 r 74 (4.1) k 7 r 74 (4.0) k 7 r 79 (3.8)Romania j 9 93 (2.0) k 5,9 97 (1.3) j 9 96 (1.7) j -- 78 (3.4)Russian Federation k 6-8 – – k 7 – – k 7-8 – – k 7-8 – –Saudi Arabia k -- 91 (2.8) j -- 38 (6.7) j 11-12 55 (4.4) j 11-12 46 (5.6)Scotland k 6 s 45 (4.1) j -- 11 (2.2) k -- s 24 (3.8) k 6 s 63 (4.2)Serbia k 5 95 (2.0) k 5 94 (2.1) k 5 96 (1.8) k 5 86 (2.9)Singapore k 7 8 (1.9) k 7 10 (1.9) k 7 11 (2.0) j -- 32 (2.9)Slovak Republic k 5,8 79 (4.1) k 5,8 90 (3.2) k 5,8 91 (2.9) k 7 67 (5.2)Slovenia k 6 – – k 5-6 – – j 10 – – k 8-9 – –South Africa j -- r 26 (4.0) j -- r 37 (4.6) j -- r 39 (4.3) j -- r 35 (3.7)Sweden j 9 x x k 7-8 x x j 9 x x k 8-9 s 44 (5.3)Syrian Arab Republic k -- – – j 10 – – k -- – – k -- – –Tunisia j 11 88 (2.6) j 10 29 (4.5) j 11 42 (3.9) j 11 58 (3.9)United States k -- r 84 (2.1) k -- r 80 (2.4) k -- r 86 (2.1) k -- r 82 (2.5)
¶ England k 7 x x k 7 x x j -- x x j -- x xInternational Avg. 63 (0.5) 54 (0.6) 62 (0.5) 60 (0.6)
Benchmarking ParticipantsBasque Country, Spain n 10 83 (3.7) n 10 69 (5.3) j 10 66 (4.9) n 9 62 (5.0)Indiana State, US k -- 86 (4.7) k -- 86 (5.0) k -- 90 (3.8) k -- 89 (4.4)Ontario Province, Can. k 7 86 (3.1) k 5 76 (4.2) k 7 r 81 (4.2) k 7 78 (4.2)Quebec Province, Can. k -- r 58 (5.2) k -- r 83 (3.1) k -- x x n -- r 70 (4.2)
Processes in the rockcycle and the
formation of rocks
Weather data/maps,and changes in
weather patterns
Geological processesoccurring over
billions of years
Formation of fossilsand fossil fuels
k
n
j
Not
incl
uded
in t
he c
urric
ulum
thr
ough
eig
hth
grad
eA
ll or
alm
ost
all s
tude
nts
Onl
y th
e m
ore
able
stu
dent
s
Stud
ent p
opul
atio
nin
tend
ed to
be
taug
ht to
pic
thro
ugh
8th
grad
e
Gra
de(s
) top
ic is
inte
nded
to b
eta
ught
Stud
ent p
opul
atio
nin
tend
ed to
be
taug
ht to
pic
thro
ugh
8th
grad
e
Gra
de(s
) top
ic is
inte
nded
to b
eta
ught
Stud
ent p
opul
atio
nin
tend
ed to
be
taug
ht to
pic
thro
ugh
8th
grad
e
Gra
de(s
) top
ic is
inte
nded
to b
eta
ught
Stud
ent p
opul
atio
nin
tend
ed to
be
taug
ht to
pic
thro
ugh
8th
grad
e
Gra
de(s
) top
ic is
inte
nded
to b
eta
ught
Perc
ent o
f stu
dent
sta
ught
the
topi
c
Perc
ent o
f stu
dent
sta
ught
the
topi
c
Perc
ent o
f stu
dent
sta
ught
the
topi
c
Perc
ent o
f stu
dent
sta
ught
the
topi
c
Background data on intended curriculum provided by National Research Coordinators, and on imple-mented curriculum by teachers at the time of testing.
For countries that teach science as separate subjects at grade 8, data are based on earth science teachers only.
¶ Did not satisfy guidelines for sample participation rates (see Exhibit A.9).
( ) Standard errors appear in parentheses. Because results are rounded to the nearest whole number, some totals may appear inconsistent.
A dash (–) indicates comparable data are not available.
An “r” indicates data are available for at least 70 but less than 85% of the students. An “s” indicates data are available for at least 50 but less than 70% of the students. An “x” indicates data are available for less than 50% of the students.
Intended and Taught TIMSS Earth Science Topics (Continued...)Exhibit 5.12: 88
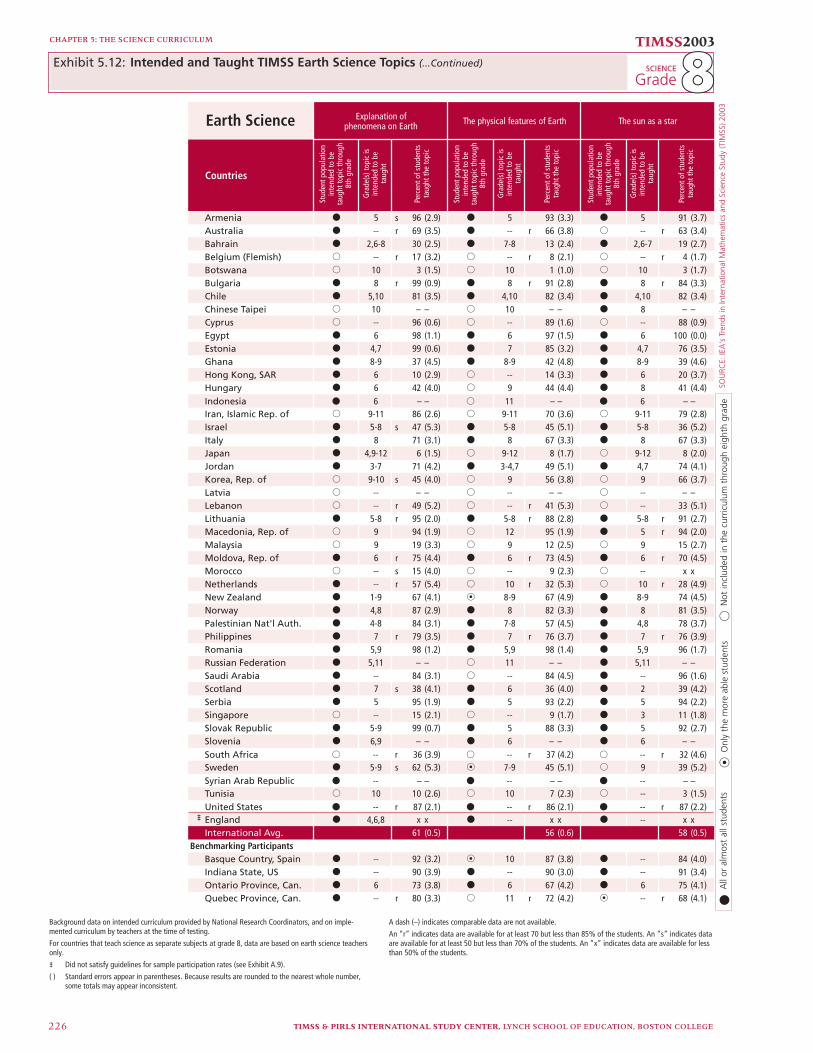
SOU
RCE:
IEA
's T
rend
s in
Inte
rnat
iona
l Mat
hem
atic
s an
d Sc
ienc
e St
udy
(TIM
SS) 2
003
TIMSS & PIRLS INTERNATIONAL STUDY CENTER, LYNCH SCHOOL OF EDUCATION, BOSTON COLLEGE226
CHAPTER 5: THE SCIENCE CURRICULUM
TIMSS2003
Grade88SCIENCE Exhibit 5.12:
Earth Science
Countries
Armenia k 5 s 96 (2.9) k 5 93 (3.3) k 5 91 (3.7)Australia k -- r 69 (3.5) k -- r 66 (3.8) j -- r 63 (3.4)Bahrain k 2,6-8 30 (2.5) k 7-8 13 (2.4) k 2,6-7 19 (2.7)Belgium (Flemish) j -- r 17 (3.2) j -- r 8 (2.1) j -- r 4 (1.7)Botswana j 10 3 (1.5) j 10 1 (1.0) j 10 3 (1.7)Bulgaria k 8 r 99 (0.9) k 8 r 91 (2.8) k 8 r 84 (3.3)Chile k 5,10 81 (3.5) k 4,10 82 (3.4) k 4,10 82 (3.4)Chinese Taipei j 10 – – j 10 – – k 8 – –Cyprus j -- 96 (0.6) j -- 89 (1.6) j -- 88 (0.9)Egypt k 6 98 (1.1) k 6 97 (1.5) k 6 100 (0.0)Estonia k 4,7 99 (0.6) k 7 85 (3.2) k 4,7 76 (3.5)Ghana k 8-9 37 (4.5) k 8-9 42 (4.8) k 8-9 39 (4.6)Hong Kong, SAR k 6 10 (2.9) j -- 14 (3.3) k 6 20 (3.7)Hungary k 6 42 (4.0) j 9 44 (4.4) k 8 41 (4.4)Indonesia k 6 – – j 11 – – k 6 – –Iran, Islamic Rep. of j 9-11 86 (2.6) j 9-11 70 (3.6) j 9-11 79 (2.8)Israel k 5-8 s 47 (5.3) k 5-8 45 (5.1) k 5-8 36 (5.2)Italy k 8 71 (3.1) k 8 67 (3.3) k 8 67 (3.3)Japan k 4,9-12 6 (1.5) j 9-12 8 (1.7) j 9-12 8 (2.0)Jordan k 3-7 71 (4.2) k 3-4,7 49 (5.1) k 4,7 74 (4.1)Korea, Rep. of j 9-10 s 45 (4.0) j 9 56 (3.8) j 9 66 (3.7)Latvia j -- – – j -- – – j -- – –Lebanon j -- r 49 (5.2) j -- r 41 (5.3) j -- 33 (5.1)Lithuania k 5-8 r 95 (2.0) k 5-8 r 88 (2.8) k 5-8 r 91 (2.7)Macedonia, Rep. of j 9 94 (1.9) j 12 95 (1.9) k 5 r 94 (2.0)Malaysia j 9 19 (3.3) j 9 12 (2.5) j 9 15 (2.7)Moldova, Rep. of k 6 r 75 (4.4) k 6 r 73 (4.5) k 6 r 70 (4.5)Morocco j -- s 15 (4.0) j -- 9 (2.3) j -- x xNetherlands k -- r 57 (5.4) j 10 r 32 (5.3) j 10 r 28 (4.9)New Zealand k 1-9 67 (4.1) n 8-9 67 (4.9) k 8-9 74 (4.5)Norway k 4,8 87 (2.9) k 8 82 (3.3) k 8 81 (3.5)Palestinian Nat'l Auth. k 4-8 84 (3.1) k 7-8 57 (4.5) k 4,8 78 (3.7)Philippines k 7 r 79 (3.5) k 7 r 76 (3.7) k 7 r 76 (3.9)Romania k 5,9 98 (1.2) k 5,9 98 (1.4) k 5,9 96 (1.7)Russian Federation k 5,11 – – j 11 – – k 5,11 – –Saudi Arabia k -- 84 (3.1) j -- 84 (4.5) k -- 96 (1.6)Scotland k 7 s 38 (4.1) k 6 36 (4.0) k 2 39 (4.2)Serbia k 5 95 (1.9) k 5 93 (2.2) k 5 94 (2.2)Singapore j -- 15 (2.1) j -- 9 (1.7) k 3 11 (1.8)Slovak Republic k 5-9 99 (0.7) k 5 88 (3.3) k 5 92 (2.7)Slovenia k 6,9 – – k 6 – – k 6 – –South Africa j -- r 36 (3.9) j -- r 37 (4.2) j -- r 32 (4.6)Sweden k 5-9 s 62 (5.3) n 7-9 45 (5.1) j 9 39 (5.2)Syrian Arab Republic k -- – – k -- – – k -- – –Tunisia j 10 10 (2.6) j 10 7 (2.3) j -- 3 (1.5)United States k -- r 87 (2.1) k -- r 86 (2.1) k -- r 87 (2.2)
¶ England k 4,6,8 x x k -- x x k -- x xInternational Avg. 61 (0.5) 56 (0.6) 58 (0.5)
Benchmarking ParticipantsBasque Country, Spain k -- 92 (3.2) n 10 87 (3.8) k -- 84 (4.0)Indiana State, US k -- 90 (3.9) k -- 90 (3.0) k -- 91 (3.4)Ontario Province, Can. k 6 73 (3.8) k 6 67 (4.2) k 6 75 (4.1)Quebec Province, Can. k -- r 80 (3.3) j 11 r 72 (4.2) n -- r 68 (4.1)
Explanation ofphenomena on Earth The physical features of Earth The sun as a star
k
n
j
Not
incl
uded
in t
he c
urric
ulum
thr
ough
eig
hth
grad
eA
ll or
alm
ost
all s
tude
nts
Onl
y th
e m
ore
able
stu
dent
s
Stud
ent p
opul
atio
nin
tend
ed to
be
taug
ht to
pic
thro
ugh
8th
grad
e
Gra
de(s
) top
ic is
inte
nded
to b
eta
ught
Stud
ent p
opul
atio
nin
tend
ed to
be
taug
ht to
pic
thro
ugh
8th
grad
e
Gra
de(s
) top
ic is
inte
nded
to b
eta
ught
Stud
ent p
opul
atio
nin
tend
ed to
be
taug
ht to
pic
thro
ugh
8th
grad
e
Gra
de(s
) top
ic is
inte
nded
to b
eta
ught
Perc
ent o
f stu
dent
sta
ught
the
topi
c
Perc
ent o
f stu
dent
sta
ught
the
topi
c
Perc
ent o
f stu
dent
sta
ught
the
topi
c
Intended and Taught TIMSS Earth Science Topics (...Continued)
Background data on intended curriculum provided by National Research Coordinators, and on imple-mented curriculum by teachers at the time of testing.
For countries that teach science as separate subjects at grade 8, data are based on earth science teachers only.
¶ Did not satisfy guidelines for sample participation rates (see Exhibit A.9).
( ) Standard errors appear in parentheses. Because results are rounded to the nearest whole number, some totals may appear inconsistent.
A dash (–) indicates comparable data are not available.
An “r” indicates data are available for at least 70 but less than 85% of the students. An “s” indicates data are available for at least 50 but less than 70% of the students. An “x” indicates data are available for less than 50% of the students.
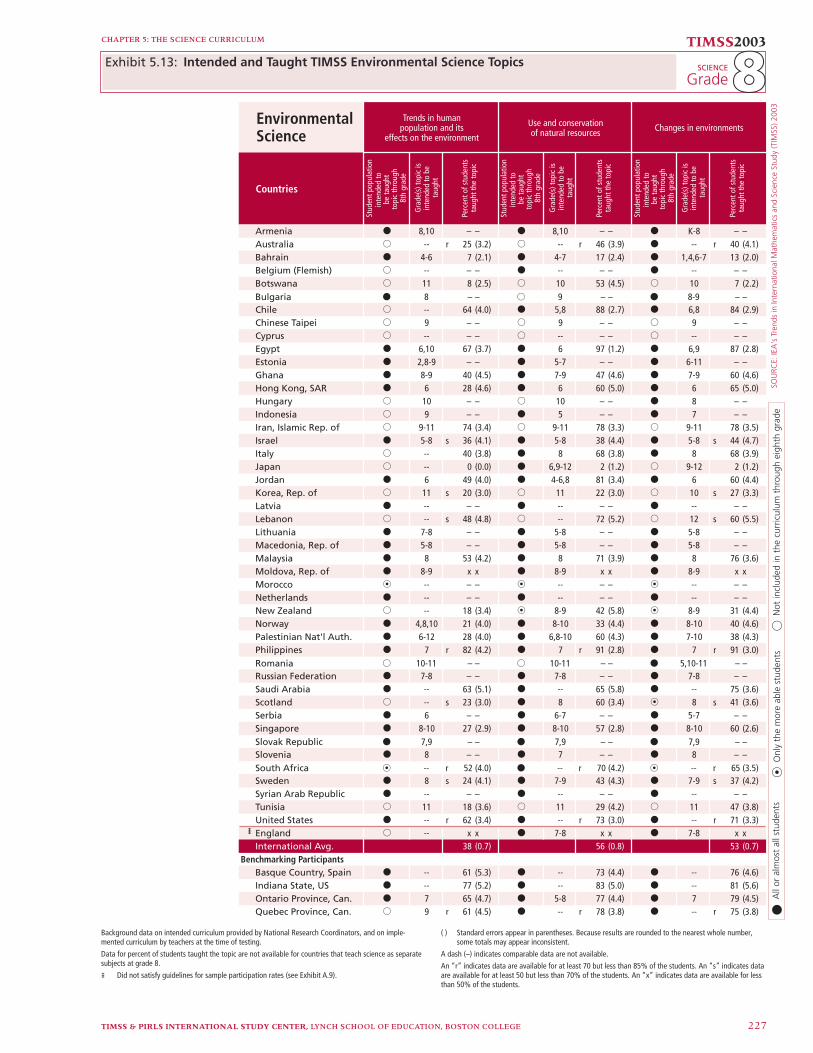
SOU
RCE:
IEA
's T
rend
s in
Inte
rnat
iona
l Mat
hem
atic
s an
d Sc
ienc
e St
udy
(TIM
SS) 2
003
CHAPTER 5: THE SCIENCE CURRICULUM TIMSS2003
GradeSCIENCE
TIMSS & PIRLS INTERNATIONAL STUDY CENTER, LYNCH SCHOOL OF EDUCATION, BOSTON COLLEGE 227
EnvironmentalScience
Countries
Armenia k 8,10 – – k 8,10 – – k K-8 – –Australia j -- r 25 (3.2) j -- r 46 (3.9) k -- r 40 (4.1)Bahrain k 4-6 7 (2.1) k 4-7 17 (2.4) k 1,4,6-7 13 (2.0)Belgium (Flemish) j -- – – k -- – – k -- – –Botswana j 11 8 (2.5) j 10 53 (4.5) j 10 7 (2.2)Bulgaria k 8 – – j 9 – – k 8-9 – –Chile j -- 64 (4.0) k 5,8 88 (2.7) k 6,8 84 (2.9)Chinese Taipei j 9 – – j 9 – – j 9 – –Cyprus j -- – – j -- – – j -- – –Egypt k 6,10 67 (3.7) k 6 97 (1.2) k 6,9 87 (2.8)Estonia k 2,8-9 – – k 5-7 – – k 6-11 – –Ghana k 8-9 40 (4.5) k 7-9 47 (4.6) k 7-9 60 (4.6)Hong Kong, SAR k 6 28 (4.6) k 6 60 (5.0) k 6 65 (5.0)Hungary j 10 – – j 10 – – k 8 – –Indonesia j 9 – – k 5 – – k 7 – –Iran, Islamic Rep. of j 9-11 74 (3.4) j 9-11 78 (3.3) j 9-11 78 (3.5)Israel k 5-8 s 36 (4.1) k 5-8 38 (4.4) k 5-8 s 44 (4.7)Italy j -- 40 (3.8) k 8 68 (3.8) k 8 68 (3.9)Japan j -- 0 (0.0) k 6,9-12 2 (1.2) j 9-12 2 (1.2)Jordan k 6 49 (4.0) k 4-6,8 81 (3.4) k 6 60 (4.4)Korea, Rep. of j 11 s 20 (3.0) j 11 22 (3.0) j 10 s 27 (3.3)Latvia k -- – – k -- – – k -- – –Lebanon j -- s 48 (4.8) j -- 72 (5.2) j 12 s 60 (5.5)Lithuania k 7-8 – – k 5-8 – – k 5-8 – –Macedonia, Rep. of k 5-8 – – k 5-8 – – k 5-8 – –Malaysia k 8 53 (4.2) k 8 71 (3.9) k 8 76 (3.6)Moldova, Rep. of k 8-9 x x k 8-9 x x k 8-9 x xMorocco n -- – – n -- – – n -- – –Netherlands k -- – – k -- – – k -- – –New Zealand j -- 18 (3.4) n 8-9 42 (5.8) n 8-9 31 (4.4)Norway k 4,8,10 21 (4.0) k 8-10 33 (4.4) k 8-10 40 (4.6)Palestinian Nat'l Auth. k 6-12 28 (4.0) k 6,8-10 60 (4.3) k 7-10 38 (4.3)Philippines k 7 r 82 (4.2) k 7 r 91 (2.8) k 7 r 91 (3.0)Romania j 10-11 – – j 10-11 – – k 5,10-11 – –Russian Federation k 7-8 – – k 7-8 – – k 7-8 – –Saudi Arabia k -- 63 (5.1) k -- 65 (5.8) k -- 75 (3.6)Scotland j -- s 23 (3.0) k 8 60 (3.4) n 8 s 41 (3.6)Serbia k 6 – – k 6-7 – – k 5-7 – –Singapore k 8-10 27 (2.9) k 8-10 57 (2.8) k 8-10 60 (2.6)Slovak Republic k 7,9 – – k 7,9 – – k 7,9 – –Slovenia k 8 – – k 7 – – k 8 – –South Africa n -- r 52 (4.0) k -- r 70 (4.2) n -- r 65 (3.5)Sweden k 8 s 24 (4.1) k 7-9 43 (4.3) k 7-9 s 37 (4.2)Syrian Arab Republic k -- – – k -- – – k -- – –Tunisia j 11 18 (3.6) j 11 29 (4.2) j 11 47 (3.8)United States k -- r 62 (3.4) k -- r 73 (3.0) k -- r 71 (3.3)
¶ England j -- x x k 7-8 x x k 7-8 x xInternational Avg. 38 (0.7) 56 (0.8) 53 (0.7)
Benchmarking ParticipantsBasque Country, Spain k -- 61 (5.3) k -- 73 (4.4) k -- 76 (4.6)Indiana State, US k -- 77 (5.2) k -- 83 (5.0) k -- 81 (5.6)Ontario Province, Can. k 7 65 (4.7) k 5-8 77 (4.4) k 7 79 (4.5)Quebec Province, Can. j 9 r 61 (4.5) k -- r 78 (3.8) k -- r 75 (3.8)
Changes in environmentsTrends in human
population and itseffects on the environment
Use and conservationof natural resources
k
n
j
Not
incl
uded
in t
he c
urric
ulum
thr
ough
eig
hth
grad
eA
ll or
alm
ost
all s
tude
nts
Onl
y th
e m
ore
able
stu
dent
s
Gra
de(s
) top
ic is
inte
nded
to b
eta
ught
Perc
ent o
f stu
dent
sta
ught
the
topi
c
Stud
ent p
opul
atio
nin
tend
ed to
topi
c th
roug
h8t
h gr
ade
be ta
ught
Gra
de(s
) top
ic is
inte
nded
to b
eta
ught
Perc
ent o
f stu
dent
sta
ught
the
topi
c
Stud
ent p
opul
atio
nin
tend
ed to
topi
c th
roug
h8t
h gr
ade
be ta
ught
Gra
de(s
) top
ic is
inte
nded
to b
eta
ught
Perc
ent o
f stu
dent
sta
ught
the
topi
c
Stud
ent p
opul
atio
nin
tend
ed to
topi
c th
roug
h8t
h gr
ade
be ta
ught
Background data on intended curriculum provided by National Research Coordinators, and on imple-mented curriculum by teachers at the time of testing.
Data for percent of students taught the topic are not available for countries that teach science as separate subjects at grade 8.
¶ Did not satisfy guidelines for sample participation rates (see Exhibit A.9).
( ) Standard errors appear in parentheses. Because results are rounded to the nearest whole number, some totals may appear inconsistent.
A dash (–) indicates comparable data are not available.
An “r” indicates data are available for at least 70 but less than 85% of the students. An “s” indicates data are available for at least 50 but less than 70% of the students. An “x” indicates data are available for less than 50% of the students.
Intended and Taught TIMSS Environmental Science TopicsExhibit 5.13: 88

SOU
RCE:
IEA
's T
rend
s in
Inte
rnat
iona
l Mat
hem
atic
s an
d Sc
ienc
e St
udy
(TIM
SS) 2
003
TIMSS & PIRLS INTERNATIONAL STUDY CENTER, LYNCH SCHOOL OF EDUCATION, BOSTON COLLEGE228
CHAPTER 5: THE SCIENCE CURRICULUM TIMSS2003
GradeSCIENCE
Life Science
Countries
Armenia k -- x x k -- x x k -- x x k -- x x
Australia k -- r 85 (3.0) k -- r 70 (4.2) k -- r 76 (3.2) k -- r 90 (2.9)
Belgium (Flemish) k -- 49 (3.9) n 5 40 (4.0) n 5 58 (4.2) j 6 70 (3.4)
Chinese Taipei k 3 91 (2.2) k 3-4 92 (2.3) k 3-4 69 (3.8) k 3-4 76 (3.3)
Cyprus k 4-5 96 (1.6) k 1-6 77 (3.5) j -- 50 (4.3) k 1-3 68 (3.7)
England k 1,3 r 84 (3.5) k K,4 r 85 (3.5) k 3-4 r 82 (3.7) k 4 r 85 (3.6)
Hong Kong, SAR k 2 r 74 (4.6) k 4 r 87 (3.4) j 6 r 87 (3.3) k 2 r 62 (4.6)
Hungary k 2 95 (1.9) k 2 89 (2.6) j 7 86 (2.7) k 4 89 (2.9)
Iran, Islamic Rep. of k 1-4 91 (2.6) k 2-4 94 (1.8) k 1-4 71 (3.9) j 5,6,8 76 (4.1)
Italy k 4-6 97 (1.2) k 4-7 71 (3.1) k 4-6 50 (3.3) k 4-7 93 (1.7)Japan k 3-12 53 (4.0) k 3-12 30 (3.8) k 4,6,8-12 24 (3.5) k 3-12 85 (2.8)
Latvia k -- x x k -- x x j -- x x j 6-9 x x
Lithuania k 1-4 93 (1.8) k 3-4 98 (1.2) j 5-6 98 (0.8) k 1-4 99 (0.8)
Moldova, Rep. of k -- r 81 (3.6) k -- r 95 (1.8) k -- r 87 (3.4) k -- r 85 (2.5)
Morocco n -- x x n -- x x k -- x x n -- x x
Netherlands k -- 71 (4.6) k -- 72 (4.0) k -- 72 (4.0) k -- 72 (4.1)
New Zealand k 1-4 r 87 (2.4) k 2-3 r 77 (3.4) k 2-3 r 63 (3.7) k 2-3 r 88 (2.0)
Norway k 1,4-5,8 60 (4.0) k 3-10 70 (3.6) k 2-10 63 (4.4) k 3-5 67 (4.2)
Philippines j 5,8 98 (1.4) k 3-4,8 96 (2.4) j 5,8 91 (3.2) k 4 98 (1.7)
Russian Federation k 3-4 – – j 6-9 – – j 6-9 – – j 6-9 – –
Scotland k -- s 83 (3.6) j -- s 73 (4.0) j -- s 69 (4.4) k -- s 74 (4.6)
Singapore k 3 97 (1.4) k 3-5 98 (1.3) j 6 83 (3.3) k 3 80 (3.5)
Slovenia k 4 65 (4.5) k 4 75 (4.1) j 10 77 (4.0) k 4 39 (4.5)
Tunisia j 9 r 93 (2.4) j 6 65 (4.1) j 5 59 (4.0) j 7 r 59 (4.6)
United States k -- r 83 (2.4) k -- 71 (2.8) j -- r 69 (2.7) k -- 80 (2.4)Yemen j -- – – k -- – – k 4 – – j -- – –International Avg. 82 (0.7) 77 (0.7) 71 (0.8) 78 (0.7)
Benchmarking ParticipantsIndiana State, US k -- 84 (4.1) j 5 77 (5.9) k -- 80 (4.9) j 5,6 81 (4.0)
Ontario Province, Can. k 1-2 72 (4.8) k 1-2 49 (4.9) k 3-4 60 (5.1) k 2 72 (4.6)
Quebec Province, Can. k 3-4 73 (3.7) k -- 61 (4.0) j 5-7 60 (4.9) j 5-7 64 (4.3)
Bodily actions inresponse to outside
conditions and exercise
The general stepsin the life cycle offamiliar organisms
Types, characteristics,and classificationof living things
Major body structuresand their function
in humans andother organisms
All or almost all studentsk Only the more able studentsn Not included in the curriculum through fourth gradej
Gra
de(s
) top
ic is
inte
nded
to b
eta
ught
Perc
ent o
f stu
dent
sta
ught
the
topi
c
Stud
ent p
opul
atio
nin
tend
ed to
topi
c th
roug
h4t
h gr
ade
be ta
ught
Gra
de(s
) top
ic is
inte
nded
to b
eta
ught
Perc
ent o
f stu
dent
sta
ught
the
topi
c
Stud
ent p
opul
atio
nin
tend
ed to
topi
c th
roug
h4t
h gr
ade
be ta
ught
Gra
de(s
) top
ic is
inte
nded
to b
eta
ught
Perc
ent o
f stu
dent
sta
ught
the
topi
c
Stud
ent p
opul
atio
nin
tend
ed to
topi
c th
roug
h4t
h gr
ade
be ta
ught
Gra
de(s
) top
ic is
inte
nded
to b
eta
ught
Perc
ent o
f stu
dent
sta
ught
the
topi
c
Stud
ent p
opul
atio
nin
tend
ed to
topi
c th
roug
h4t
h gr
ade
be ta
ught
Background data on intended curriculum provided by National Research Coordinators, and on imple-mented curriculum by teachers at the time of testing.
( ) Standard errors appear in parentheses. Because results are rounded to the nearest whole number, some totals may appear inconsistent.
A dash (–) indicates comparable data are not available.
An “r” indicates data are available for at least 70 but less than 85% of the students. An “s” indicates data are available for at least 50 but less than 70% of the students. An “x” indicates data are available for less than 50% of the students.
Intended and Taught TIMSS Life Science TopicsExhibit 5.14: 44
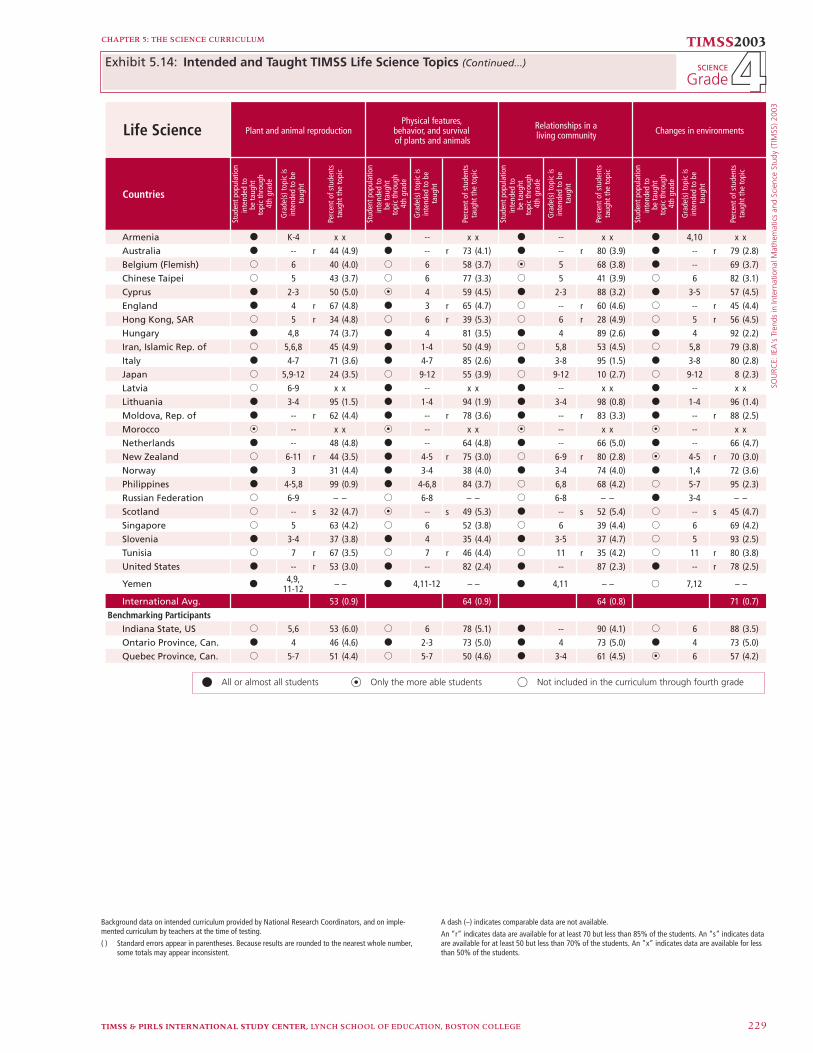
SOU
RCE:
IEA
's T
rend
s in
Inte
rnat
iona
l Mat
hem
atic
s an
d Sc
ienc
e St
udy
(TIM
SS) 2
003
CHAPTER 5: THE SCIENCE CURRICULUM
TIMSS2003
GradeSCIENCE
TIMSS & PIRLS INTERNATIONAL STUDY CENTER, LYNCH SCHOOL OF EDUCATION, BOSTON COLLEGE 229
44Exhibit 5.14:
Life Science
Countries
Armenia k K-4 x x k -- x x k -- x x k 4,10 x x
Australia k -- r 44 (4.9) k -- r 73 (4.1) k -- r 80 (3.9) k -- r 79 (2.8)
Belgium (Flemish) j 6 40 (4.0) j 6 58 (3.7) n 5 68 (3.8) k -- 69 (3.7)
Chinese Taipei j 5 43 (3.7) j 6 77 (3.3) j 5 41 (3.9) j 6 82 (3.1)
Cyprus k 2-3 50 (5.0) n 4 59 (4.5) k 2-3 88 (3.2) k 3-5 57 (4.5)
England k 4 r 67 (4.8) k 3 r 65 (4.7) j -- r 60 (4.6) j -- r 45 (4.4)
Hong Kong, SAR j 5 r 34 (4.8) j 6 r 39 (5.3) j 6 r 28 (4.9) j 5 r 56 (4.5)
Hungary k 4,8 74 (3.7) k 4 81 (3.5) k 4 89 (2.6) k 4 92 (2.2)
Iran, Islamic Rep. of j 5,6,8 45 (4.9) k 1-4 50 (4.9) j 5,8 53 (4.5) j 5,8 79 (3.8)
Italy k 4-7 71 (3.6) k 4-7 85 (2.6) k 3-8 95 (1.5) k 3-8 80 (2.8)
Japan j 5,9-12 24 (3.5) j 9-12 55 (3.9) j 9-12 10 (2.7) j 9-12 8 (2.3)
Latvia j 6-9 x x k -- x x k -- x x k -- x x
Lithuania k 3-4 95 (1.5) k 1-4 94 (1.9) k 3-4 98 (0.8) k 1-4 96 (1.4)
Moldova, Rep. of k -- r 62 (4.4) k -- r 78 (3.6) k -- r 83 (3.3) k -- r 88 (2.5)
Morocco n -- x x n -- x x n -- x x n -- x x
Netherlands k -- 48 (4.8) k -- 64 (4.8) k -- 66 (5.0) k -- 66 (4.7)
New Zealand j 6-11 r 44 (3.5) k 4-5 r 75 (3.0) j 6-9 r 80 (2.8) n 4-5 r 70 (3.0)
Norway k 3 31 (4.4) k 3-4 38 (4.0) k 3-4 74 (4.0) k 1,4 72 (3.6)
Philippines k 4-5,8 99 (0.9) k 4-6,8 84 (3.7) j 6,8 68 (4.2) j 5-7 95 (2.3)
Russian Federation j 6-9 – – j 6-8 – – j 6-8 – – k 3-4 – –
Scotland j -- s 32 (4.7) n -- s 49 (5.3) k -- s 52 (5.4) j -- s 45 (4.7)
Singapore j 5 63 (4.2) j 6 52 (3.8) j 6 39 (4.4) j 6 69 (4.2)
Slovenia k 3-4 37 (3.8) k 4 35 (4.4) k 3-5 37 (4.7) j 5 93 (2.5)
Tunisia j 7 r 67 (3.5) j 7 r 46 (4.4) j 11 r 35 (4.2) j 11 r 80 (3.8)
United States k -- r 53 (3.0) k -- 82 (2.4) k -- 87 (2.3) k -- r 78 (2.5)
Yemen k4,9,
11-12 – – k 4,11-12 – – k 4,11 – – j 7,12 – –
International Avg. 53 (0.9) 64 (0.9) 64 (0.8) 71 (0.7)
Benchmarking ParticipantsIndiana State, US j 5,6 53 (6.0) j 6 78 (5.1) k -- 90 (4.1) j 6 88 (3.5)
Ontario Province, Can. k 4 46 (4.6) k 2-3 73 (5.0) k 4 73 (5.0) k 4 73 (5.0)
Quebec Province, Can. j 5-7 51 (4.4) j 5-7 50 (4.6) k 3-4 61 (4.5) n 6 57 (4.2)
Relationships in aliving community Changes in environmentsPlant and animal reproduction
Physical features,behavior, and survivalof plants and animals
Gra
de(s
) top
ic is
inte
nded
to b
eta
ught
Perc
ent o
f stu
dent
sta
ught
the
topi
c
Stud
ent p
opul
atio
nin
tend
ed to
topi
c th
roug
h4t
h gr
ade
be ta
ught
Gra
de(s
) top
ic is
inte
nded
to b
eta
ught
Perc
ent o
f stu
dent
sta
ught
the
topi
c
Stud
ent p
opul
atio
nin
tend
ed to
topi
c th
roug
h4t
h gr
ade
be ta
ught
Gra
de(s
) top
ic is
inte
nded
to b
eta
ught
Perc
ent o
f stu
dent
sta
ught
the
topi
c
Stud
ent p
opul
atio
nin
tend
ed to
topi
c th
roug
h4t
h gr
ade
be ta
ught
Gra
de(s
) top
ic is
inte
nded
to b
eta
ught
Perc
ent o
f stu
dent
sta
ught
the
topi
c
Stud
ent p
opul
atio
nin
tend
ed to
topi
c th
roug
h4t
h gr
ade
be ta
ught
All or almost all studentsk Only the more able studentsn Not included in the curriculum through fourth gradej
Intended and Taught TIMSS Life Science Topics (Continued...)
Background data on intended curriculum provided by National Research Coordinators, and on imple-mented curriculum by teachers at the time of testing.
( ) Standard errors appear in parentheses. Because results are rounded to the nearest whole number, some totals may appear inconsistent.
A dash (–) indicates comparable data are not available.
An “r” indicates data are available for at least 70 but less than 85% of the students. An “s” indicates data are available for at least 50 but less than 70% of the students. An “x” indicates data are available for less than 50% of the students.
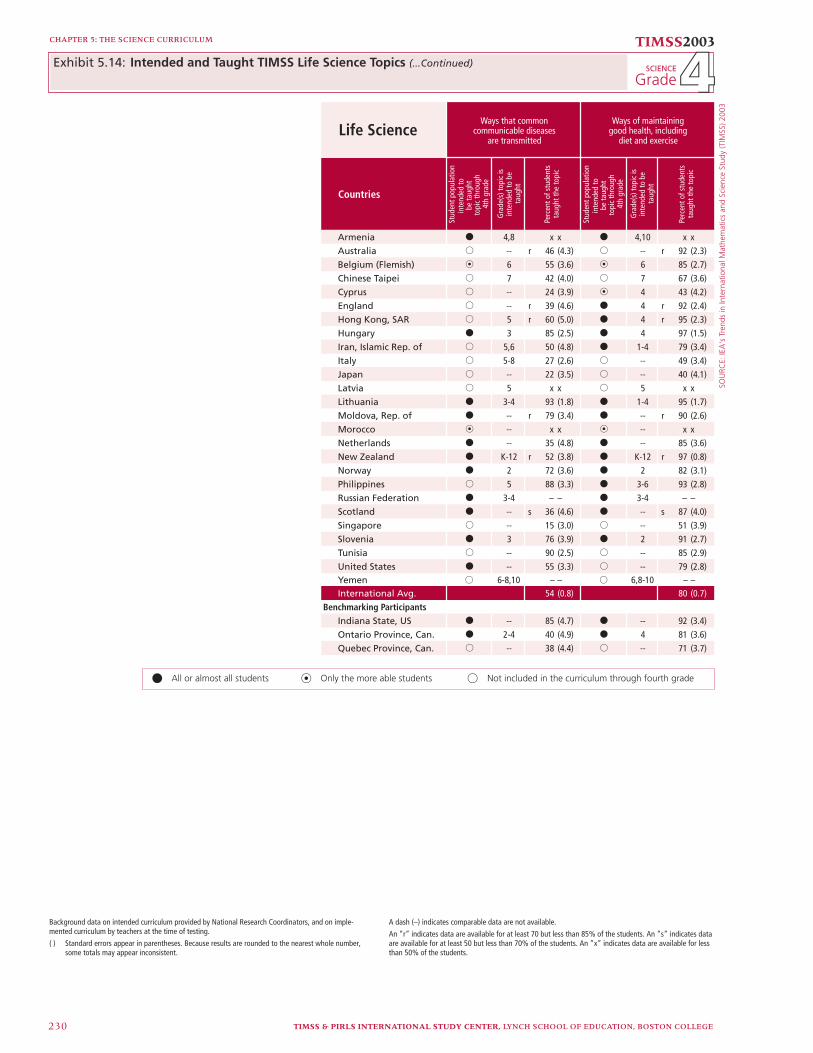
SOU
RCE:
IEA
's T
rend
s in
Inte
rnat
iona
l Mat
hem
atic
s an
d Sc
ienc
e St
udy
(TIM
SS) 2
003
TIMSS & PIRLS INTERNATIONAL STUDY CENTER, LYNCH SCHOOL OF EDUCATION, BOSTON COLLEGE230
CHAPTER 5: THE SCIENCE CURRICULUM TIMSS2003
GradeSCIENCE
Life Science
Countries
Armenia k 4,8 x x k 4,10 x x
Australia j -- r 46 (4.3) j -- r 92 (2.3)
Belgium (Flemish) n 6 55 (3.6) n 6 85 (2.7)
Chinese Taipei j 7 42 (4.0) j 7 67 (3.6)
Cyprus j -- 24 (3.9) n 4 43 (4.2)
England j -- r 39 (4.6) k 4 r 92 (2.4)
Hong Kong, SAR j 5 r 60 (5.0) k 4 r 95 (2.3)
Hungary k 3 85 (2.5) k 4 97 (1.5)
Iran, Islamic Rep. of j 5,6 50 (4.8) k 1-4 79 (3.4)
Italy j 5-8 27 (2.6) j -- 49 (3.4)
Japan j -- 22 (3.5) j -- 40 (4.1)
Latvia j 5 x x j 5 x x
Lithuania k 3-4 93 (1.8) k 1-4 95 (1.7)
Moldova, Rep. of k -- r 79 (3.4) k -- r 90 (2.6)
Morocco n -- x x n -- x x
Netherlands k -- 35 (4.8) k -- 85 (3.6)
New Zealand k K-12 r 52 (3.8) k K-12 r 97 (0.8)
Norway k 2 72 (3.6) k 2 82 (3.1)
Philippines j 5 88 (3.3) k 3-6 93 (2.8)
Russian Federation k 3-4 – – k 3-4 – –
Scotland k -- s 36 (4.6) k -- s 87 (4.0)
Singapore j -- 15 (3.0) j -- 51 (3.9)
Slovenia k 3 76 (3.9) k 2 91 (2.7)
Tunisia j -- 90 (2.5) j -- 85 (2.9)
United States k -- 55 (3.3) j -- 79 (2.8)Yemen j 6-8,10 – – j 6,8-10 – –International Avg. 54 (0.8) 80 (0.7)
Benchmarking ParticipantsIndiana State, US k -- 85 (4.7) k -- 92 (3.4)
Ontario Province, Can. k 2-4 40 (4.9) k 4 81 (3.6)
Quebec Province, Can. j -- 38 (4.4) j -- 71 (3.7)
Ways that commoncommunicable diseases
are transmitted
Ways of maintaininggood health, including
diet and exercise
Gra
de(s
) top
ic is
inte
nded
to b
eta
ught
Perc
ent o
f stu
dent
sta
ught
the
topi
c
Stud
ent p
opul
atio
nin
tend
ed to
topi
c th
roug
h4t
h gr
ade
be ta
ught
Gra
de(s
) top
ic is
inte
nded
to b
eta
ught
Perc
ent o
f stu
dent
sta
ught
the
topi
c
Stud
ent p
opul
atio
nin
tend
ed to
topi
c th
roug
h4t
h gr
ade
be ta
ught
All or almost all studentsk Only the more able studentsn Not included in the curriculum through fourth gradej
Background data on intended curriculum provided by National Research Coordinators, and on imple-mented curriculum by teachers at the time of testing.
( ) Standard errors appear in parentheses. Because results are rounded to the nearest whole number, some totals may appear inconsistent.
A dash (–) indicates comparable data are not available.
An “r” indicates data are available for at least 70 but less than 85% of the students. An “s” indicates data are available for at least 50 but less than 70% of the students. An “x” indicates data are available for less than 50% of the students.
44Intended and Taught TIMSS Life Science Topics (...Continued)Exhibit 5.14:
TIMSS & PIRLS INTERNATIONAL STUDY CENTER, LYNCH SCHOOL OF EDUCATION, BOSTON COLLEGE 231
CHAPTER 5: THE SCIENCE CURRICULUM
cooling.” These were taught, respectively, to 61 percent, 80 percent, and 83 percent of students, on average. The remaining topics were in the intended curricula of between 13 and 19 participants, with the percentage of students taught the topics ranging from 35 to 69 percent, on average. The topics taught to the least percentages of students were “properties and uses of metals” (38%) and “forming and separating mixtures” (35%).
As described before, earth science topics did not fi gure promi-nently in the intended fourth-grade science curricula of the participat-ing countries, and they were taught to fewer students than the other science content areas. As shown in Exhibit 5.16, “water on Earth” was the topic included in the curriculum of most participants (18). Other topics included in the curricula of about half the participants were: “rocks, minerals, sand, and soil,” “air,” “common features of the Earth’s landscape,” “Earth’s water cycle,” and “weather conditions from day to day or over the seasons.” The percentage of students taught these topics, on average, ranged from 41 percent (rocks, minerals, sand, and soil) to 81 percent (Earth’s water cycle). “Fossils of animals and plants” was included in the curriculum of the fewest participants and had the lowest percentage of students taught the topic (27%).
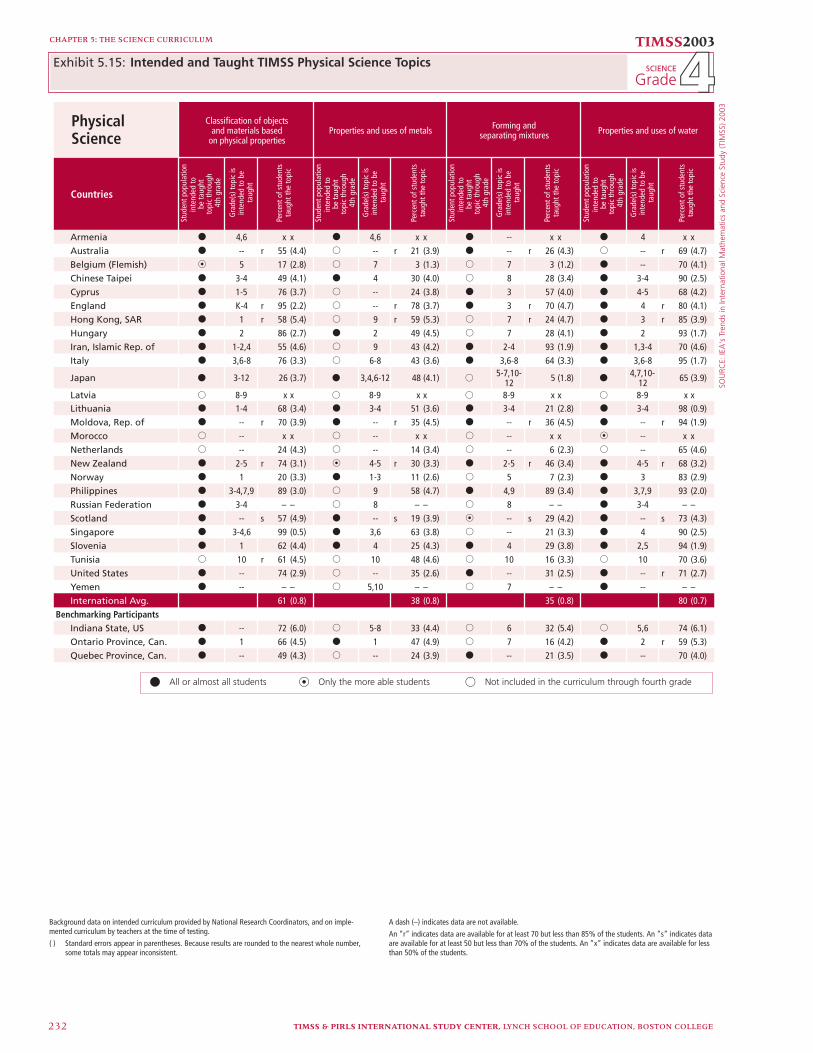
SOU
RCE:
IEA
's T
rend
s in
Inte
rnat
iona
l Mat
hem
atic
s an
d Sc
ienc
e St
udy
(TIM
SS) 2
003
TIMSS & PIRLS INTERNATIONAL STUDY CENTER, LYNCH SCHOOL OF EDUCATION, BOSTON COLLEGE232
CHAPTER 5: THE SCIENCE CURRICULUM TIMSS2003
GradeSCIENCE
PhysicalScience
Countries
Armenia k 4,6 x x k 4,6 x x k -- x x k 4 x x
Australia k -- r 55 (4.4) j -- r 21 (3.9) k -- r 26 (4.3) j -- r 69 (4.7)
Belgium (Flemish) n 5 17 (2.8) j 7 3 (1.3) j 7 3 (1.2) k -- 70 (4.1)
Chinese Taipei k 3-4 49 (4.1) k 4 30 (4.0) j 8 28 (3.4) k 3-4 90 (2.5)
Cyprus k 1-5 76 (3.7) j -- 24 (3.8) k 3 57 (4.0) k 4-5 68 (4.2)
England k K-4 r 95 (2.2) j -- r 78 (3.7) k 3 r 70 (4.7) k 4 r 80 (4.1)
Hong Kong, SAR k 1 r 58 (5.4) j 9 r 59 (5.3) j 7 r 24 (4.7) k 3 r 85 (3.9)
Hungary k 2 86 (2.7) k 2 49 (4.5) j 7 28 (4.1) k 2 93 (1.7)
Iran, Islamic Rep. of k 1-2,4 55 (4.6) j 9 43 (4.2) k 2-4 93 (1.9) k 1,3-4 70 (4.6)
Italy k 3,6-8 76 (3.3) j 6-8 43 (3.6) k 3,6-8 64 (3.3) k 3,6-8 95 (1.7)
Japan k 3-12 26 (3.7) k 3,4,6-12 48 (4.1) j5-7,10-
12 5 (1.8) k4,7,10-
12 65 (3.9)
Latvia j 8-9 x x j 8-9 x x j 8-9 x x j 8-9 x xLithuania k 1-4 68 (3.4) k 3-4 51 (3.6) k 3-4 21 (2.8) k 3-4 98 (0.9)
Moldova, Rep. of k -- r 70 (3.9) k -- r 35 (4.5) k -- r 36 (4.5) k -- r 94 (1.9)
Morocco j -- x x j -- x x j -- x x n -- x x
Netherlands j -- 24 (4.3) j -- 14 (3.4) j -- 6 (2.3) j -- 65 (4.6)
New Zealand k 2-5 r 74 (3.1) n 4-5 r 30 (3.3) k 2-5 r 46 (3.4) k 4-5 r 68 (3.2)
Norway k 1 20 (3.3) k 1-3 11 (2.6) j 5 7 (2.3) k 3 83 (2.9)
Philippines k 3-4,7,9 89 (3.0) j 9 58 (4.7) k 4,9 89 (3.4) k 3,7,9 93 (2.0)
Russian Federation k 3-4 – – j 8 – – j 8 – – k 3-4 – –
Scotland k -- s 57 (4.9) k -- s 19 (3.9) n -- s 29 (4.2) k -- s 73 (4.3)
Singapore k 3-4,6 99 (0.5) k 3,6 63 (3.8) j -- 21 (3.3) k 4 90 (2.5)
Slovenia k 1 62 (4.4) k 4 25 (4.3) k 4 29 (3.8) k 2,5 94 (1.9)
Tunisia j 10 r 61 (4.5) j 10 48 (4.6) j 10 16 (3.3) j 10 70 (3.6)
United States k -- 74 (2.9) j -- 35 (2.6) k -- 31 (2.5) k -- r 71 (2.7)
Yemen k -- – – j 5,10 – – j 7 – – k -- – –
International Avg. 61 (0.8) 38 (0.8) 35 (0.8) 80 (0.7)
Benchmarking ParticipantsIndiana State, US k -- 72 (6.0) j 5-8 33 (4.4) j 6 32 (5.4) j 5,6 74 (6.1)
Ontario Province, Can. k 1 66 (4.5) k 1 47 (4.9) j 7 16 (4.2) k 2 r 59 (5.3)
Quebec Province, Can. k -- 49 (4.3) j -- 24 (3.9) k -- 21 (3.5) k -- 70 (4.0)
Classification of objectsand materials based
on physical propertiesProperties and uses of metals Forming and
separating mixtures Properties and uses of water
Gra
de(s
) top
ic is
inte
nded
to b
eta
ught
Perc
ent o
f stu
dent
sta
ught
the
topi
c
Stud
ent p
opul
atio
nin
tend
ed to
topi
c th
roug
h4t
h gr
ade
be ta
ught
Gra
de(s
) top
ic is
inte
nded
to b
eta
ught
Perc
ent o
f stu
dent
sta
ught
the
topi
c
Stud
ent p
opul
atio
nin
tend
ed to
topi
c th
roug
h4t
h gr
ade
be ta
ught
Gra
de(s
) top
ic is
inte
nded
to b
eta
ught
Perc
ent o
f stu
dent
sta
ught
the
topi
c
Stud
ent p
opul
atio
nin
tend
ed to
topi
c th
roug
h4t
h gr
ade
be ta
ught
Gra
de(s
) top
ic is
inte
nded
to b
eta
ught
Perc
ent o
f stu
dent
sta
ught
the
topi
c
Stud
ent p
opul
atio
nin
tend
ed to
topi
c th
roug
h4t
h gr
ade
be ta
ught
All or almost all studentsk Only the more able studentsn Not included in the curriculum through fourth gradej
Background data on intended curriculum provided by National Research Coordinators, and on imple-mented curriculum by teachers at the time of testing.
( ) Standard errors appear in parentheses. Because results are rounded to the nearest whole number, some totals may appear inconsistent.
A dash (–) indicates data are not available.
An “r” indicates data are available for at least 70 but less than 85% of the students. An “s” indicates data are available for at least 50 but less than 70% of the students. An “x” indicates data are available for less than 50% of the students.
44Intended and Taught TIMSS Physical Science TopicsExhibit 5.15:
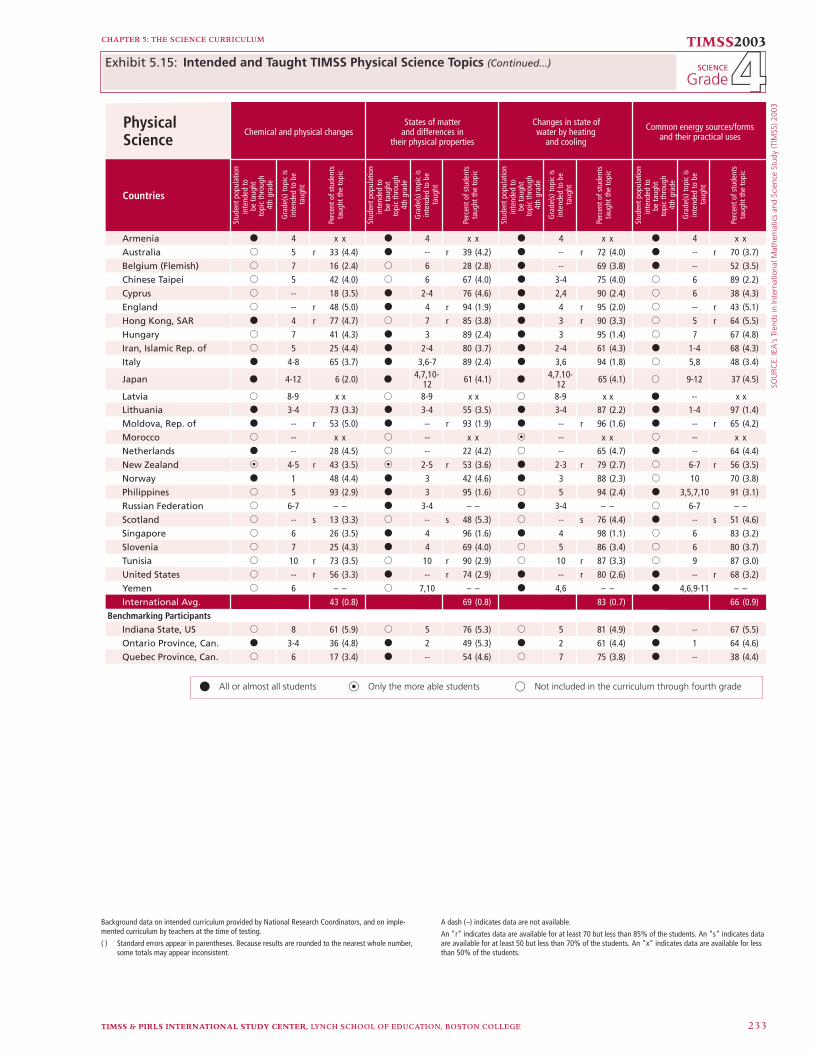
SOU
RCE:
IEA
's T
rend
s in
Inte
rnat
iona
l Mat
hem
atic
s an
d Sc
ienc
e St
udy
(TIM
SS) 2
003
CHAPTER 5: THE SCIENCE CURRICULUM
TIMSS2003
GradeSCIENCE
TIMSS & PIRLS INTERNATIONAL STUDY CENTER, LYNCH SCHOOL OF EDUCATION, BOSTON COLLEGE 233
44Exhibit 5.15:
PhysicalScience
Countries
Armenia k 4 x x k 4 x x k 4 x x k 4 x x
Australia j 5 r 33 (4.4) k -- r 39 (4.2) k -- r 72 (4.0) k -- r 70 (3.7)
Belgium (Flemish) j 7 16 (2.4) j 6 28 (2.8) k -- 69 (3.8) k -- 52 (3.5)
Chinese Taipei j 5 42 (4.0) j 6 67 (4.0) k 3-4 75 (4.0) j 6 89 (2.2)
Cyprus j -- 18 (3.5) k 2-4 76 (4.6) k 2,4 90 (2.4) j 6 38 (4.3)
England j -- r 48 (5.0) k 4 r 94 (1.9) k 4 r 95 (2.0) j -- r 43 (5.1)
Hong Kong, SAR k 4 r 77 (4.7) j 7 r 85 (3.8) k 3 r 90 (3.3) j 5 r 64 (5.5)
Hungary j 7 41 (4.3) k 3 89 (2.4) k 3 95 (1.4) j 7 67 (4.8)
Iran, Islamic Rep. of j 5 25 (4.4) k 2-4 80 (3.7) k 2-4 61 (4.3) k 1-4 68 (4.3)
Italy k 4-8 65 (3.7) k 3,6-7 89 (2.4) k 3,6 94 (1.8) j 5,8 48 (3.4)
Japan k 4-12 6 (2.0) k4,7,10-
12 61 (4.1) k4,7.10-
12 65 (4.1) j 9-12 37 (4.5)
Latvia j 8-9 x x j 8-9 x x j 8-9 x x k -- x xLithuania k 3-4 73 (3.3) k 3-4 55 (3.5) k 3-4 87 (2.2) k 1-4 97 (1.4)
Moldova, Rep. of k -- r 53 (5.0) k -- r 93 (1.9) k -- r 96 (1.6) k -- r 65 (4.2)
Morocco j -- x x j -- x x n -- x x j -- x x
Netherlands k -- 28 (4.5) j -- 22 (4.2) j -- 65 (4.7) k -- 64 (4.4)
New Zealand n 4-5 r 43 (3.5) n 2-5 r 53 (3.6) k 2-3 r 79 (2.7) j 6-7 r 56 (3.5)
Norway k 1 48 (4.4) k 3 42 (4.6) k 3 88 (2.3) j 10 70 (3.8)
Philippines j 5 93 (2.9) k 3 95 (1.6) j 5 94 (2.4) k 3,5,7,10 91 (3.1)
Russian Federation j 6-7 – – k 3-4 – – k 3-4 – – j 6-7 – –
Scotland j -- s 13 (3.3) j -- s 48 (5.3) j -- s 76 (4.4) k -- s 51 (4.6)
Singapore j 6 26 (3.5) k 4 96 (1.6) k 4 98 (1.1) j 6 83 (3.2)
Slovenia j 7 25 (4.3) k 4 69 (4.0) j 5 86 (3.4) j 6 80 (3.7)
Tunisia j 10 r 73 (3.5) j 10 r 90 (2.9) j 10 r 87 (3.3) j 9 87 (3.0)
United States j -- r 56 (3.3) k -- r 74 (2.9) k -- r 80 (2.6) k -- r 68 (3.2)
Yemen j 6 – – j 7,10 – – k 4,6 – – k 4,6,9-11 – –
International Avg. 43 (0.8) 69 (0.8) 83 (0.7) 66 (0.9)
Benchmarking ParticipantsIndiana State, US j 8 61 (5.9) j 5 76 (5.3) j 5 81 (4.9) k -- 67 (5.5)
Ontario Province, Can. k 3-4 36 (4.8) k 2 49 (5.3) k 2 61 (4.4) k 1 64 (4.6)
Quebec Province, Can. j 6 17 (3.4) k -- 54 (4.6) j 7 75 (3.8) k -- 38 (4.4)
Changes in state ofwater by heating
and cooling
Common energy sources/formsand their practical usesChemical and physical changes
States of matterand differences in
their physical properties
Gra
de(s
) top
ic is
inte
nded
to b
eta
ught
Perc
ent o
f stu
dent
sta
ught
the
topi
c
Stud
ent p
opul
atio
nin
tend
ed to
topi
c th
roug
h4t
h gr
ade
be ta
ught
Gra
de(s
) top
ic is
inte
nded
to b
eta
ught
Perc
ent o
f stu
dent
sta
ught
the
topi
c
Stud
ent p
opul
atio
nin
tend
ed to
topi
c th
roug
h4t
h gr
ade
be ta
ught
Gra
de(s
) top
ic is
inte
nded
to b
eta
ught
Perc
ent o
f stu
dent
sta
ught
the
topi
c
Stud
ent p
opul
atio
nin
tend
ed to
topi
c th
roug
h4t
h gr
ade
be ta
ught
Gra
de(s
) top
ic is
inte
nded
to b
eta
ught
Perc
ent o
f stu
dent
sta
ught
the
topi
c
Stud
ent p
opul
atio
nin
tend
ed to
topi
c th
roug
h4t
h gr
ade
be ta
ught
All or almost all studentsk Only the more able studentsn Not included in the curriculum through fourth gradej
Intended and Taught TIMSS Physical Science Topics (Continued...)
Background data on intended curriculum provided by National Research Coordinators, and on imple-mented curriculum by teachers at the time of testing.
( ) Standard errors appear in parentheses. Because results are rounded to the nearest whole number, some totals may appear inconsistent.
A dash (–) indicates data are not available.
An “r” indicates data are available for at least 70 but less than 85% of the students. An “s” indicates data are available for at least 50 but less than 70% of the students. An “x” indicates data are available for less than 50% of the students.
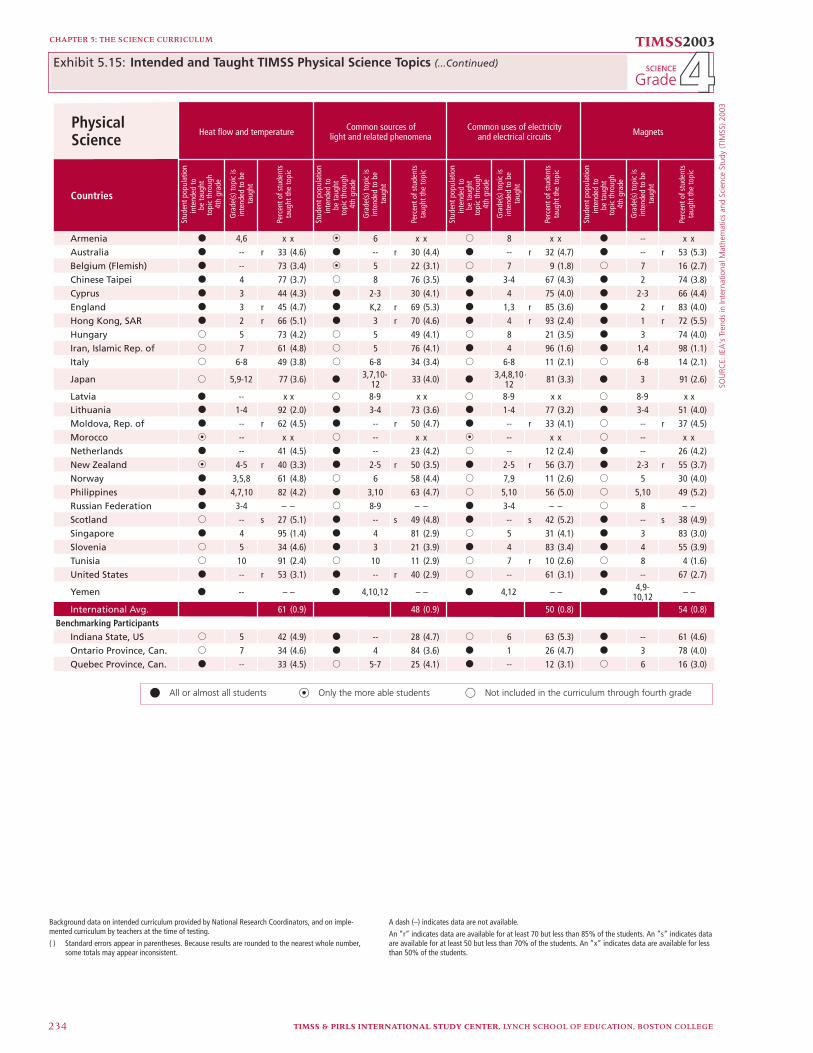
SOU
RCE:
IEA
's T
rend
s in
Inte
rnat
iona
l Mat
hem
atic
s an
d Sc
ienc
e St
udy
(TIM
SS) 2
003
TIMSS & PIRLS INTERNATIONAL STUDY CENTER, LYNCH SCHOOL OF EDUCATION, BOSTON COLLEGE234
CHAPTER 5: THE SCIENCE CURRICULUM TIMSS2003
GradeSCIENCE
PhysicalScience
Countries
Armenia k 4,6 x x n 6 x x j 8 x x k -- x x
Australia k -- r 33 (4.6) k -- r 30 (4.4) k -- r 32 (4.7) k -- r 53 (5.3)
Belgium (Flemish) k -- 73 (3.4) n 5 22 (3.1) j 7 9 (1.8) j 7 16 (2.7)
Chinese Taipei k 4 77 (3.7) j 8 76 (3.5) k 3-4 67 (4.3) k 2 74 (3.8)
Cyprus k 3 44 (4.3) k 2-3 30 (4.1) k 4 75 (4.0) k 2-3 66 (4.4)
England k 3 r 45 (4.7) k K,2 r 69 (5.3) k 1,3 r 85 (3.6) k 2 r 83 (4.0)
Hong Kong, SAR k 2 r 66 (5.1) k 3 r 70 (4.6) k 4 r 93 (2.4) k 1 r 72 (5.5)
Hungary j 5 73 (4.2) j 5 49 (4.1) j 8 21 (3.5) k 3 74 (4.0)
Iran, Islamic Rep. of j 7 61 (4.8) j 5 76 (4.1) k 4 96 (1.6) k 1,4 98 (1.1)
Italy j 6-8 49 (3.8) j 6-8 34 (3.4) j 6-8 11 (2.1) j 6-8 14 (2.1)
Japan j 5,9-12 77 (3.6) k3,7,10-
12 33 (4.0) k3,4,8,10-
12 81 (3.3) k 3 91 (2.6)
Latvia k -- x x j 8-9 x x j 8-9 x x j 8-9 x xLithuania k 1-4 92 (2.0) k 3-4 73 (3.6) k 1-4 77 (3.2) k 3-4 51 (4.0)
Moldova, Rep. of k -- r 62 (4.5) k -- r 50 (4.7) k -- r 33 (4.1) j -- r 37 (4.5)
Morocco n -- x x j -- x x n -- x x j -- x x
Netherlands k -- 41 (4.5) k -- 23 (4.2) j -- 12 (2.4) k -- 26 (4.2)
New Zealand n 4-5 r 40 (3.3) k 2-5 r 50 (3.5) k 2-5 r 56 (3.7) k 2-3 r 55 (3.7)
Norway k 3,5,8 61 (4.8) j 6 58 (4.4) j 7,9 11 (2.6) j 5 30 (4.0)
Philippines k 4,7,10 82 (4.2) k 3,10 63 (4.7) j 5,10 56 (5.0) j 5,10 49 (5.2)
Russian Federation k 3-4 – – j 8-9 – – k 3-4 – – j 8 – –
Scotland j -- s 27 (5.1) k -- s 49 (4.8) k -- s 42 (5.2) k -- s 38 (4.9)
Singapore k 4 95 (1.4) k 4 81 (2.9) j 5 31 (4.1) k 3 83 (3.0)
Slovenia j 5 34 (4.6) k 3 21 (3.9) k 4 83 (3.4) k 4 55 (3.9)
Tunisia j 10 91 (2.4) j 10 11 (2.9) j 7 r 10 (2.6) j 8 4 (1.6)
United States k -- r 53 (3.1) k -- r 40 (2.9) j -- 61 (3.1) k -- 67 (2.7)
Yemen k -- – – k 4,10,12 – – k 4,12 – – k4,9-
10,12 – –
International Avg. 61 (0.9) 48 (0.9) 50 (0.8) 54 (0.8)
Benchmarking ParticipantsIndiana State, US j 5 42 (4.9) k -- 28 (4.7) j 6 63 (5.3) k -- 61 (4.6)
Ontario Province, Can. j 7 34 (4.6) k 4 84 (3.6) k 1 26 (4.7) k 3 78 (4.0)
Quebec Province, Can. k -- 33 (4.5) j 5-7 25 (4.1) k -- 12 (3.1) j 6 16 (3.0)
Common uses of electricityand electrical circuits MagnetsHeat flow and temperature Common sources of
light and related phenomena
Gra
de(s
) top
ic is
inte
nded
to b
eta
ught
Perc
ent o
f stu
dent
sta
ught
the
topi
c
Stud
ent p
opul
atio
nin
tend
ed to
topi
c th
roug
h4t
h gr
ade
be ta
ught
Gra
de(s
) top
ic is
inte
nded
to b
eta
ught
Perc
ent o
f stu
dent
sta
ught
the
topi
c
Stud
ent p
opul
atio
nin
tend
ed to
topi
c th
roug
h4t
h gr
ade
be ta
ught
Gra
de(s
) top
ic is
inte
nded
to b
eta
ught
Perc
ent o
f stu
dent
sta
ught
the
topi
c
Stud
ent p
opul
atio
nin
tend
ed to
topi
c th
roug
h4t
h gr
ade
be ta
ught
Gra
de(s
) top
ic is
inte
nded
to b
eta
ught
Perc
ent o
f stu
dent
sta
ught
the
topi
c
Stud
ent p
opul
atio
nin
tend
ed to
topi
c th
roug
h4t
h gr
ade
be ta
ught
All or almost all studentsk Only the more able studentsn Not included in the curriculum through fourth gradej
Background data on intended curriculum provided by National Research Coordinators, and on imple-mented curriculum by teachers at the time of testing.
( ) Standard errors appear in parentheses. Because results are rounded to the nearest whole number, some totals may appear inconsistent.
A dash (–) indicates data are not available.
An “r” indicates data are available for at least 70 but less than 85% of the students. An “s” indicates data are available for at least 50 but less than 70% of the students. An “x” indicates data are available for less than 50% of the students.
44Intended and Taught TIMSS Physical Science Topics (...Continued)Exhibit 5.15:

SOU
RCE:
IEA
's T
rend
s in
Inte
rnat
iona
l Mat
hem
atic
s an
d Sc
ienc
e St
udy
(TIM
SS) 2
003
CHAPTER 5: THE SCIENCE CURRICULUM
TIMSS2003
GradeSCIENCE
TIMSS & PIRLS INTERNATIONAL STUDY CENTER, LYNCH SCHOOL OF EDUCATION, BOSTON COLLEGE 235
44Exhibit 5.15:
PhysicalScience
Countries
Armenia n -- x x
Australia k -- r 58 (5.0)
Belgium (Flemish) j 6 13 (2.2)
Chinese Taipei j 6 56 (4.1)
Cyprus k 3 41 (4.6)
England k K,1,3 r 77 (4.4)
Hong Kong, SAR j 6 r 27 (4.7)
Hungary j 7 26 (3.8)
Iran, Islamic Rep. of j 6 52 (4.8)
Italy j 6-8 30 (3.3)Japan j 5,7,9-12 5 (1.8)Latvia j 8-9 x xLithuania k 1-4 29 (3.2)
Moldova, Rep. of j -- r 34 (4.3)
Morocco j -- x x
Netherlands k -- 20 (3.9)
New Zealand n 2-3 r 51 (3.4)
Norway k 4 58 (4.5)
Philippines k 3,6-7,10 77 (4.5)
Russian Federation j 7 – –
Scotland k -- s 51 (5.1)
Singapore j 6 18 (3.4)
Slovenia k 3 22 (3.7)
Tunisia j 10 r 60 (3.4)
United States k -- 68 (3.0)
Yemen k 4,6 – –
International Avg. 42 (0.9)
Benchmarking ParticipantsIndiana State, US k -- 60 (4.7)
Ontario Province, Can. k 3 65 (4.6)
Quebec Province, Can. j 6 20 (3.8)
Forces that cause objects to move.
Gra
de(s
) top
ic is
inte
nded
to b
eta
ught
Perc
ent o
f stu
dent
sta
ught
the
topi
c
Stud
ent p
opul
atio
nin
tend
ed to
topi
c th
roug
h4t
h gr
ade
be ta
ught
All or almost all studentsk Only the more able studentsn Not included in the curriculum through fourth gradej
Intended and Taught TIMSS Physical Science Topics
Background data on intended curriculum provided by National Research Coordinators, and on imple-mented curriculum by teachers at the time of testing.
( ) Standard errors appear in parentheses. Because results are rounded to the nearest whole number, some totals may appear inconsistent.
A dash (–) indicates data are not available.
An “r” indicates data are available for at least 70 but less than 85% of the students. An “s” indicates data are available for at least 50 but less than 70% of the students. An “x” indicates data are available for less than 50% of the students.

SOU
RCE:
IEA
's T
rend
s in
Inte
rnat
iona
l Mat
hem
atic
s an
d Sc
ienc
e St
udy
(TIM
SS) 2
003
TIMSS & PIRLS INTERNATIONAL STUDY CENTER, LYNCH SCHOOL OF EDUCATION, BOSTON COLLEGE236
CHAPTER 5: THE SCIENCE CURRICULUM TIMSS2003
GradeSCIENCE
Earth Science
Countries
Armenia n -- x x k -- x x k -- x x n -- x x
Australia k -- r 36 (5.0) j -- r 57 (4.3) j -- r 43 (4.2) k -- r 66 (4.4)
Belgium (Flemish) j 6 8 (1.7) k -- 59 (3.6) k -- 30 (3.2) j 6 39 (3.6)
Chinese Taipei j 7 27 (3.5) j 9 71 (3.6) k 3 71 (3.8) j 9 43 (4.2)
Cyprus k 4 46 (4.4) j -- 37 (4.4) k 4 91 (2.1) j -- 51 (4.6)
England k 2 r 68 (4.4) k 4 r 64 (4.1) k 4 r 65 (4.6) k 1-4 r 42 (4.5)
Hong Kong, SAR j -- r 29 (4.2) k 3 r 38 (4.5) k 4 r 98 (1.2) k 4 67 (4.6)
Hungary j 5 53 (4.6) j 5 78 (3.6) j 5 65 (4.3) j 5 92 (2.4)
Iran, Islamic Rep. of k 1,4 95 (1.8) k 1,3 64 (4.7) k 2-4 57 (4.4) j 5-8 78 (4.3)
Italy k 3-8 68 (3.8) k 3-7 85 (2.8) k 4,6-7 87 (2.3) k 3-8 76 (3.0)
Japan j6,7,10-
12 5 (1.8) j5,8,10-
12 34 (4.0) k4,7,10-
12 27 (3.6) k4,7,10-
12 15 (3.0)
Latvia k 3-4 x x k 3-4 x x j -- x x k -- x xLithuania j 7-8 66 (3.4) k 3-4 96 (1.1) j 5-6 87 (2.8) k 3-4 90 (2.4)
Moldova, Rep. of k -- r 86 (3.1) k -- r 96 (1.8) k -- r 99 (0.9) k -- r 94 (2.2)
Morocco j -- x x j -- x x j -- x x j -- x x
Netherlands k -- 31 (4.6) k -- 59 (5.0) j -- 47 (4.6) k -- 71 (4.4)
New Zealand n 2-5 r 43 (3.6) k 4-5 r 65 (3.6) k 3-9 r 41 (3.8) n 2-3 r 64 (3.7)
Norway k 2 16 (3.0) k 4 62 (4.5) j 8 56 (4.2) k 3-4 62 (4.3)
Philippines k 3,5,7 72 (4.6) k 3-4,7 74 (4.4) k 3-4,7 73 (4.2) k 3,7 83 (3.7)
Russian Federation k 2-4 – – k 2-4 – – j 6 – – k 3-4 – –
Scotland j -- s 15 (3.5) k -- s 54 (5.4) j -- s 33 (4.2) j -- s 51 (4.6)
Singapore j -- 5 (1.6) j -- 45 (3.9) j -- 84 (2.7) j -- 7 (1.8)
Slovenia k 2 11 (2.6) j 5 77 (4.0) j 5 62 (4.4) k 3 66 (4.4)
Tunisia j 11 r 15 (3.0) j 11 r 27 (4.0) j 10 r 87 (2.5) j 10 r 46 (4.4)
United States k -- 76 (2.8) k -- 82 (2.2) j -- 62 (2.9) k -- 86 (2.0)
Yemen k 4,10-12 – – j 5,10,12 – – k -- – – k -- – –
International Avg. 41 (0.8) 63 (0.9) 65 (0.8) 61 (0.8)
Benchmarking ParticipantsIndiana State, US k -- 72 (5.1) k -- 80 (5.7) k -- 63 (6.5) j 6,7 86 (4.3)
Ontario Province, Can. k 4 62 (5.0) k 2 54 (4.8) j 6 48 (4.5) k 4 79 (4.0)
Quebec Province, Can. j 6 50 (5.0) j 6 44 (4.4) k -- 47 (4.5) j 6 71 (4.4)
AirCommon features ofthe Earth’s landscape
and relationship to human use
Rocks, minerals,sand, and soil Water on Earth
Gra
de(s
) top
ic is
inte
nded
to b
eta
ught
Perc
ent o
f stu
dent
sta
ught
the
topi
c
Stud
ent p
opul
atio
nin
tend
ed to
topi
c th
roug
h4t
h gr
ade
be ta
ught
Gra
de(s
) top
ic is
inte
nded
to b
eta
ught
Perc
ent o
f stu
dent
sta
ught
the
topi
c
Stud
ent p
opul
atio
nin
tend
ed to
topi
c th
roug
h4t
h gr
ade
be ta
ught
Gra
de(s
) top
ic is
inte
nded
to b
eta
ught
Perc
ent o
f stu
dent
sta
ught
the
topi
c
Stud
ent p
opul
atio
nin
tend
ed to
topi
c th
roug
h4t
h gr
ade
be ta
ught
Gra
de(s
) top
ic is
inte
nded
to b
eta
ught
Perc
ent o
f stu
dent
sta
ught
the
topi
c
Stud
ent p
opul
atio
nin
tend
ed to
topi
c th
roug
h4t
h gr
ade
be ta
ught
All or almost all studentsk Only the more able studentsn Not included in the curriculum through fourth gradej
Background data on intended curriculum provided by National Research Coordinators, and on implented curriculum by teachers at the time of testing.
( ) Standard errors appear in parentheses. Because results are rounded to the nearest whole number, some totals may appear inconsistent.
A dash (–) indicates comparable data are not available.
An “r” indicates data are available for at least 70 but less than 85% of the students. An “s” indicates data are available for at least 50 but less than 70% of the students. An “x” indicates data are available for less than 50% of the students.
44Intended and Taught TIMSS Earth Science TopicsExhibit 5.16:

SOU
RCE:
IEA
's T
rend
s in
Inte
rnat
iona
l Mat
hem
atic
s an
d Sc
ienc
e St
udy
(TIM
SS) 2
003
CHAPTER 5: THE SCIENCE CURRICULUM
TIMSS2003
GradeSCIENCE
TIMSS & PIRLS INTERNATIONAL STUDY CENTER, LYNCH SCHOOL OF EDUCATION, BOSTON COLLEGE 237
44Exhibit 5.16:
Earth Science
Countries
Armenia j 9 x x k -- x x k K-4 x x k -- x x
Australia j -- r 65 (4.0) j -- r 70 (4.8) j 5 r 78 (4.1) j -- r 30 (3.4)
Belgium (Flemish) j 6 30 (3.8) k -- 88 (2.4) k -- 93 (1.5) j 6 13 (2.8)
Chinese Taipei j 7 79 (2.9) j 7 77 (3.6) j 7 81 (3.4) j 8 11 (2.5)
Cyprus j 6 31 (4.8) k 2 92 (2.3) k 2 76 (3.7) j -- 16 (3.3)
England j -- r 37 (4.5) k 4 r 86 (3.1) k 2 r 79 (3.8) j -- r 30 (4.8)
Hong Kong, SAR j 5 r 56 (4.3) k 3 r 80 (3.8) k 2 84 (3.5) j 7 r 7 (2.9)
Hungary j 8 54 (4.3) j 5 94 (2.1) k 1 91 (2.4) j 8 17 (3.3)
Iran, Islamic Rep. of k 4 75 (4.1) k 3-4 70 (4.6) j 6 50 (4.1) j 5,8 18 (3.4)
Italy k 4,6-8 63 (3.4) k 3,6 95 (1.5) k 3,6 84 (2.5) k 4,8 62 (3.4)
Japan j 9-12 5 (1.7) j5,8,10-
12 41 (4.0) j5,8,10-
12 29 (3.8) j6,7,10-
12 1 (1.0)
Latvia k -- x x j -- x x k 3-4 x x j -- x xLithuania k 3-4 77 (3.1) k 3-4 96 (1.4) k 1-4 98 (1.1) j 5-6 64 (3.7)
Moldova, Rep. of k -- r 92 (2.7) k -- r 96 (1.7) k -- r 97 (1.5) k -- r 62 (4.7)
Morocco j -- x x j -- x x j -- x x j -- x x
Netherlands k -- 34 (4.8) j -- 79 (4.0) k -- 72 (4.4) j -- 26 (3.9)
New Zealand j 8-9 r 61 (3.9) k 4-5 r 70 (3.3) j 6-7 r 75 (3.0) k 2-3 r 41 (3.5)
Norway k 3-4 57 (4.5) k 3-4 79 (3.1) k 3 96 (1.6) j 8 30 (3.7)
Philippines k 3-5,7 84 (3.6) j 5,7 89 (3.2) k 3-5,7 92 (2.6) j -- 54 (5.2)
Russian Federation k 3-4 – – k 3-4 – – k 2-3 – – k 3-4 – –
Scotland j -- s 35 (4.4) k -- s 73 (4.5) k -- s 76 (4.5) j -- s 10 (2.8)
Singapore j 6 43 (4.2) k 4 87 (2.3) j -- 28 (3.7) j -- 4 (1.8)
Slovenia j 5 51 (4.5) j 5 88 (2.7) j 5 71 (3.8) j 8 4 (1.9)
Tunisia j -- r 40 (3.9) j 10 r 62 (4.6) j 10 r 61 (4.5) j 11 r 5 (1.8)
United States j -- 80 (2.3) k -- 80 (2.3) k -- 80 (2.5) k -- r 58 (2.9)
Yemen j 5 – – k 4,11 – – j 5 – – j 10,12 – –
International Avg. 55 (0.8) 81 (0.7) 76 (0.7) 27 (0.7)
Benchmarking ParticipantsIndiana State, US j 6 85 (3.8) j 6 75 (5.4) k 4 79 (4.7) j 7 63 (5.4)
Ontario Province, Can. j 5 68 (4.3) j 5 63 (5.1) j 5 61 (5.0) k 4 55 (5.1)
Quebec Province, Can. j 6 62 (3.8) k -- 81 (3.1) j 6 77 (3.7) k -- 32 (4.2)
Use and conservationof Earth’s natural resources Earth’s water cycle
Weather conditionsfrom day to day orover the seasons
Fossils of animals and plants
Gra
de(s
) top
ic is
inte
nded
to b
eta
ught
Perc
ent o
f stu
dent
sta
ught
the
topi
c
Stud
ent p
opul
atio
nin
tend
ed to
topi
c th
roug
h4t
h gr
ade
be ta
ught
Gra
de(s
) top
ic is
inte
nded
to b
eta
ught
Perc
ent o
f stu
dent
sta
ught
the
topi
c
Stud
ent p
opul
atio
nin
tend
ed to
topi
c th
roug
h4t
h gr
ade
be ta
ught
Gra
de(s
) top
ic is
inte
nded
to b
eta
ught
Perc
ent o
f stu
dent
sta
ught
the
topi
c
Stud
ent p
opul
atio
nin
tend
ed to
topi
c th
roug
h4t
h gr
ade
be ta
ught
Gra
de(s
) top
ic is
inte
nded
to b
eta
ught
Perc
ent o
f stu
dent
sta
ught
the
topi
c
Stud
ent p
opul
atio
nin
tend
ed to
topi
c th
roug
h4t
h gr
ade
be ta
ught
All or almost all studentsk Only the more able studentsn Not included in the curriculum through fourth gradej
Intended and Taught TIMSS Earth Science Topics (Continued...)
Background data on intended curriculum provided by National Research Coordinators, and on implented curriculum by teachers at the time of testing.
( ) Standard errors appear in parentheses. Because results are rounded to the nearest whole number, some totals may appear inconsistent.
A dash (–) indicates comparable data are not available.
An “r” indicates data are available for at least 70 but less than 85% of the students. An “s” indicates data are available for at least 50 but less than 70% of the students. An “x” indicates data are available for less than 50% of the students.
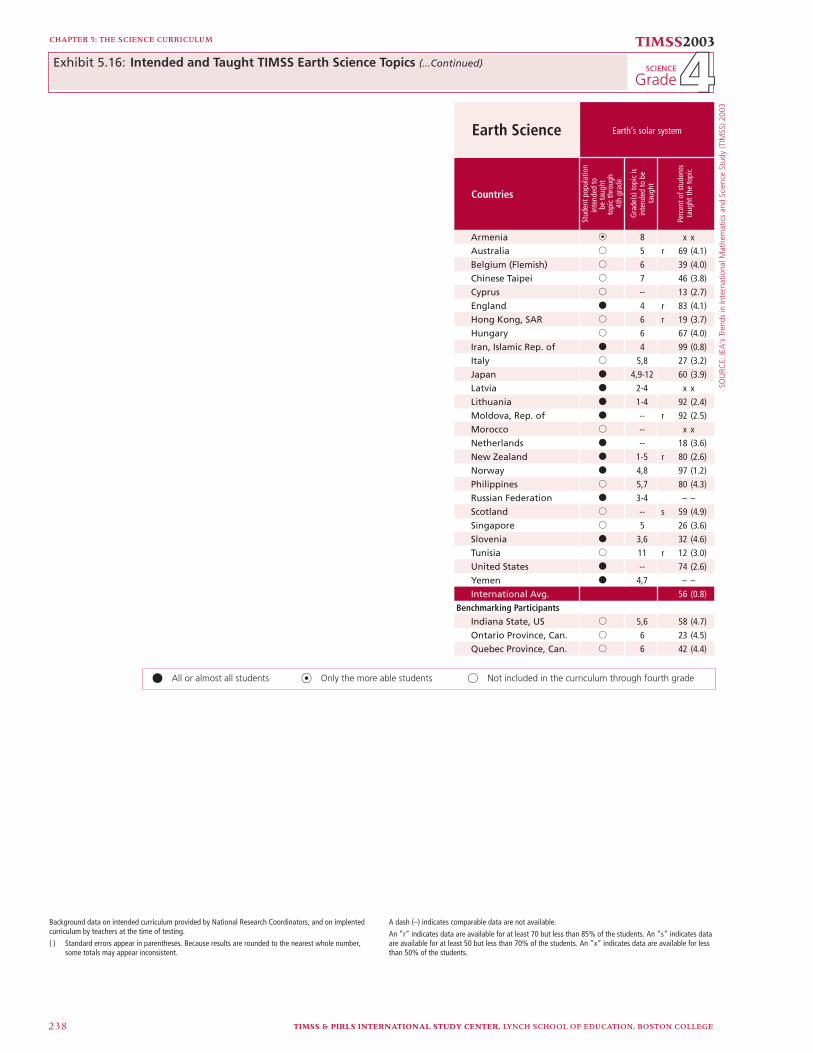
SOU
RCE:
IEA
's T
rend
s in
Inte
rnat
iona
l Mat
hem
atic
s an
d Sc
ienc
e St
udy
(TIM
SS) 2
003
TIMSS & PIRLS INTERNATIONAL STUDY CENTER, LYNCH SCHOOL OF EDUCATION, BOSTON COLLEGE238
CHAPTER 5: THE SCIENCE CURRICULUM TIMSS2003
GradeSCIENCE
Earth Science
Countries
Armenia n 8 x x
Australia j 5 r 69 (4.1)
Belgium (Flemish) j 6 39 (4.0)
Chinese Taipei j 7 46 (3.8)
Cyprus j -- 13 (2.7)
England k 4 r 83 (4.1)
Hong Kong, SAR j 6 r 19 (3.7)
Hungary j 6 67 (4.0)
Iran, Islamic Rep. of k 4 99 (0.8)
Italy j 5,8 27 (3.2)
Japan k 4,9-12 60 (3.9)
Latvia k 2-4 x x
Lithuania k 1-4 92 (2.4)
Moldova, Rep. of k -- r 92 (2.5)
Morocco j -- x x
Netherlands k -- 18 (3.6)
New Zealand k 1-5 r 80 (2.6)
Norway k 4,8 97 (1.2)
Philippines j 5,7 80 (4.3)
Russian Federation k 3-4 – –
Scotland j -- s 59 (4.9)
Singapore j 5 26 (3.6)
Slovenia k 3,6 32 (4.6)
Tunisia j 11 r 12 (3.0)
United States k -- 74 (2.6)
Yemen k 4,7 – –
International Avg. 56 (0.8)
Benchmarking ParticipantsIndiana State, US j 5,6 58 (4.7)
Ontario Province, Can. j 6 23 (4.5)
Quebec Province, Can. j 6 42 (4.4)
Earth’s solar system
Gra
de(s
) top
ic is
inte
nded
to b
eta
ught
Perc
ent o
f stu
dent
sta
ught
the
topi
c
Stud
ent p
opul
atio
nin
tend
ed to
topi
c th
roug
h4t
h gr
ade
be ta
ught
All or almost all studentsk Only the more able studentsn Not included in the curriculum through fourth gradej
Background data on intended curriculum provided by National Research Coordinators, and on implented curriculum by teachers at the time of testing.
( ) Standard errors appear in parentheses. Because results are rounded to the nearest whole number, some totals may appear inconsistent.
A dash (–) indicates comparable data are not available.
An “r” indicates data are available for at least 70 but less than 85% of the students. An “s” indicates data are available for at least 50 but less than 70% of the students. An “x” indicates data are available for less than 50% of the students.
44Intended and Taught TIMSS Earth Science Topics (...Continued)Exhibit 5.16:
TIMSS & PIRLS INTERNATIONAL STUDY CENTER, LYNCH SCHOOL OF EDUCATION, BOSTON COLLEGE 239
CHAPTER 5: THE SCIENCE CURRICULUM