Embed Size (px)
Citation preview

325
CHAPTER 4.1: MODELING OF DAMAGE IN FIBER AND PARTICLE REINFORCEDCOMPOSITES
Wolfgang Lutz, Ming Dong, Ke Zhu, and Siegfried Schmauder
CONTENTS
1 Introduction 325
2 Damage Phenomena in Short Fiber rein-forced Composites 326
3 Overview of Damage Modeling in Com-posites 327
4 Modeling 3294.1 Self-Consistent Model (SCM) . . . 3294.2 Combined Cell Model (CCM) . . . 3314.3 Statistical Combined Cell Models . 333
4.3.1 Static Loading Conditions . 3334.3.2 Quasi-Static Cyclic Load-
ing Conditions . . . . . . . 3344.4 Plastic-Damage Model . . . . . . . 335
4.4.1 Modifications of the Plastic-Damage Model . . . . . . . 335
5 Results and Application 3365.1 Metal Matrix Composites (MMC) . 336
5.1.1 Material . . . . . . . . . . . 3375.1.2 Results: Self-Consistent
Model . . . . . . . . . . . . 3375.1.3 Results: Combined Cell
Model . . . . . . . . . . . . 3395.1.4 Results: Statistical Com-
bined Cell Model . . . . . . 3415.1.5 Conclusions . . . . . . . . . 342
5.2 Polymer Matrix Composites (PMCs) 3435.2.1 Material . . . . . . . . . . . 3435.2.2 Results: Combined Cell
Model (CCM) . . . . . . . 3435.2.3 Results: Statistical Com-
bined Cell Model . . . . . . 3455.2.4 Conclusions . . . . . . . . . 349
5.3 Gypsum Fiber Composites . . . . . 3495.3.1 Material . . . . . . . . . . . 3495.3.2 Results: Plastic-Damage
Model . . . . . . . . . . . . 350
5.3.3 Conclusions . . . . . . . . . 355
6 Summary 355
1. INTRODUCTION
Composites such as Metal Matrix Composites(MMCs) and Polymer Matrix Composites (PMCs)are frequently reinforced with strong continuousor short fibers. In the case of short fiber rein-forced MMCs and PMCs, random arrangements offibers are observed. Their mechanical properties arehighly dependent on their composition, on the ma-trix properties as well as on the type and volumefraction of reinforcements. The complexity of suchaffecting parameters makes a complete theoreticaldescription of the behavior and the failure proper-ties of reinforced composite with ductile and brittlematrix difficult. In this respect, a micromechanicalanalysis of the local composite failure process opensa possibility to predict the failure properties of thesecomposites [1–3]. Micromechanical models shownin this Chapter can be applied to describe most tech-nical relevant composites varying from simple in-clusion type and interpenetrating microstructures tofunctionally graded materials.
In this Chapter, models to simulate damage infiber and particle reinforced composites with duc-tile (metal or polymer matrix) or brittle (gypsum)matrix are summarized on the basis of the worksof Dong et al. [4–6], Zhu et al. [7, 8], Kabir etal. [9], Lutz et al. [10] and Rahman et al. [11].They are the Self-consistent Model, the CombinedCell Model, the Statistical Combined Cell Modeland the plastic-damage model. The embedded cellof the self-consistent model represents a compositewhere, instead of using fixed or symmetric bound-ary conditions around the fiber-matrix or particle-matrix cell, the inclusion-matrix cell is embedded in

326 DAMAGE SIMULATION
an equivalent composite material with the mechan-ical behavior to be determined iteratively in a self-consistent manner. Using the Combined Cell Modelin conjunction with the finite element method, themechanical behavior of composites with a certainorientation of the fibers can be simulated numeri-cally by averaging results from different 2D and 3Dcell models representing a single fiber in three prin-cipal orthogonal planes in the composite. Apply-ing an appropriate integration of the results of allfiber orientations, stress-strain curves in tension andcompression of the global material can be simulatedincluding the effects of residual stresses. As an ad-vancement, the Statistical Combined Cell Model hasbeen developed to consider fiber-cracks and fiber-matrix debonding using a Weibull statistical ap-proach and the rule of mixture. The parameters ofthe Weibull damage law have been determined us-ing inverse modeling by comparing simulation andexperiment. The Statistical Combined Cell Modelwas applied to static and cyclic loading conditions.The plastic-damage model includes stiffness degra-dation due to damage in the plasticity part by twoindependent scalar damage parameters, for tensionand compression respectively. The effect of damageis introduced by replacing all stress definitions (truestress) by the reduced effective stress. Further on,the plastic-damage model is based on a stiffness re-covery scheme to simulate the effect of micro-crackopening and closing. After introducing the modelsand the methods to simulate damage evolution, thepresented models will be applied to different com-posites: MMCs, PMCs, and cellulose fiber rein-forced gypsum composites. There, investigated ma-terials will be explained. Moreover, an approach ispresented to apply the Combined Cell Model to re-alistic microstructures of an injection molded PMCsample.
2. DAMAGE PHENOMENA IN SHORTFIBER REINFORCED COMPOSITES
Failure of fiber or particle reinforced composites isgenerally preceded by an accumulation of differ-ent types of internal damages. During the damageprocess in composite materials, the following phe-nomena are known: formation and growth of micro-cracks or voids, clustering, coalescence, formationand growth of initial cracks, and propagation of oneof the cracks up to the failure of the specimen [12].These steps depend on the type of reinforcing fibersor particles (inclusion), and on the interface betweeninclusion and matrix. They vary with the type ofloading. For instance, in an early stage of load-ing debonding appears if there is a weak inclusion-
matrix interface. Stress transfer from the matrix tothe inclusion in a composite takes place by shearat the inclusion-matrix interface. An important as-pect is the loading direction relative to the orienta-tion of the inclusion. For example, in a PMC with aglass fiber, debonding occurs preferentially if load-ing is applied perpendicular to the fiber orientation.If loading is applied in fiber direction, fibers will failor will be pulled out after reaching a certain criti-cal load. Further on, in fiber reinforced materials,fibers can exhibit a stitching action on the micro-cracks preventing them from propagating. This in-tervention retards the creation of micro-cracks lead-ing to an overall improvement of the fracture resis-tance [13].
Strong interfaces result in high strength and stiff-ness, but low fracture toughness. On the other hand,weak interfaces promote deflection of matrix cracksalong the interface and lead to high fracture tough-ness, but low strength and stiffness of composites.The process of transfer of load between fibers andmatrix in the neighborhood of a fiber break or amatrix crack depends on the strength of the inter-face. Although fiber and matrix can be character-ized by conducting simple tests, interface proper-ties are most difficult to determine. Interfacial shearstrength is an important parameter that controls theinclusion-matrix debonding process [14].
Mechanical fatigue is the most common type of fail-ure of structures. It is defined as the failure ofa component under the repeated application of astress smaller than that required to cause failure ina single application. In fatigue, a crack is initiatedand slowly grows under the action of the fluctuat-ing stress until, eventually, failure occurs in a catas-trophic manner with no great distortion precedingthe event. To understand fatigue damage of fiber re-inforced composites, a simple unidirectional com-posite loaded in tension parallel to the fibers is dis-cussed in the following. If fiber breakage occurswhen the local stress exceeds the strength of theweakest fiber, this causes shear stresses concentra-tion at the fiber-matrix interface near the brokenfiber tip. The interface area acts as a stress con-centrator for the longitudinal tensile stress, whichmay exceed the fracture stress of the matrix, lead-ing to transverse cracks in the matrix. These crackscan be randomly distributed [15]. With the devel-opment of the fatigue process, the local strains ex-ceed a certain threshold, resulting eventually in fiberbreakage and propagation of matrix cracks. Duringmatrix crack propagation, the fiber-matrix interfacewill also fail due to severe shear stress at the cracktip. The final failure occurs when a sufficiently largecrack has developed. The lower strain limit for the

4.1 Modeling of Damage in Fiber and Particle Reinforced Composites 327
matrix is the threshold strain below which the ma-trix cracks remain arrested by the fibers. This strainis observed to be approximately the fatigue strainlimit of the unreinforced matrix material. The upperlimit is given by the strain to failure of the compos-ite, which is the strain to failure of the reinforcingfibers. The progressive damage mechanism is ma-trix cracking with associated interfacial shear failureand this governs the fatigue life. When fibers are ar-ranged perpendicular to the loading direction, dam-age mechanisms are slightly different (similar to thestatic case). Here, the lowest failure limit is given bytransverse fiber-matrix debonding which is stronglyconnected to the fiber orientation angle θ. This isreflected in the fatigue limit strain [16].
A study of the fatigue damage mechanisms givesindications of the weakest microstructural element,which is a useful information in the selection of ma-terials for improvement in service properties. Gen-erally, PMCs possess weak interfaces, and fatiguefailure occurs by distributed debonding or longitudi-nal matrix cracking followed by further fiber break-age. Macroscopically, the weak interface compos-ites show shorter fatigue lives and more rapid fa-tigue degradation. Fatigue damage can be studiedon a macroscopic and microscopic scale.
There are several differences between the fatigue be-havior of metals and of fiber reinforced composites.In metals, the stage of gradual and invisible dete-rioration spans nearly the complete lifetime duringservice conditions. No significant reduction of stiff-ness is observed during the fatigue process. Thefinal stage of the process starts with the formationof small cracks, which are the only form of macro-scopically observable damage. Gradual growth andcoalescence of these cracks quickly produce largecracks and final failure of the structural component.As the stiffness of a metal remains quasi unaffected,the linear relation between stress and strain remainsvalid, and the fatigue process can be simulated inmost common cases by a linear elastic analysis andlinear fracture mechanics. In a fiber reinforced com-posite, damage starts very early and the extent ofthe damage zones grows steadily, while the damagetype in these zones change (e.g., small matrix cracksleading to large size delaminations). The radial dete-rioration of a fiber reinforced composite with a lossof stiffness in the damaged zones leads to a contin-uous redistribution of stresses and to a reduction ofstress concentrations inside a structural component.As a consequence, an estimation of the actual stateor a prediction of the final state (when and where fi-nal failure is to be expected) requires the simulationof the complete path of successive damage states[16].
3. OVERVIEW OF DAMAGE MODELING INCOMPOSITES
Many of the established models only consider oneor two of the above mentioned damage mechanisms.Using finite element method (FEM) to model dam-age, requires specific approaches to solve the dis-crepancies between the quasi-continuum statementof a problem and the random and discontinuous na-ture of crack growth [12].
The unit cell approach is often used to simulate theinitiation of damage. Bao [17] uses a three phasedamage cell model taking into account the failure ofparticles and particle-matrix debonding to simulatestrength and creep resistance of metals such as Aland Ti reinforced with Al2O3. The deformation ofparticle and whisker reinforced MMCs was investi-gated by Llorca et al. applying cylindrical unit cellsto obtain the overall stress-strain behavior [18]. Ax-isymmetric unit cells were used by Walter to modeldamage initiation in fiber reinforced composites bycohesive elements [19]. The stress triaxiality and theshape of voids were taken into account by Brocks etal. to simulate effective stress vs. strain curves [20].Thereafter, the relevant parameters of the Gurson-Tvergaard-Needleman damage model were deter-mined. 3D hexagonal cells were used by Sun etal. to model the influence of micro-crack densitieson the creep behavior of ferritic steels [21]. Also,weak interfaces of polymer specimens were simu-lated by cylindric unit cells containing a rigid par-ticle [22, 23]. It is possible to include the effectof particle and fiber failure, the particle/fiber-matrixdebonding by unit cell models. One basic assump-tion of many (non self-consistent) unit cells is theuniform distribution of the inclusions and, therefore,of the damage [12].
After a general introduction of unit cell models, theSelf-consistent Model, the (Statistical) CombinedCell Model and the plastic-damage model will bepresented to simulate the mechanical behavior ofdifferent fiber and particle reinforced composites.
Initially, the mechanical behavior of a unidirec-tionally continuous fiber reinforced composite withfibers of circular cross-section was studied byAdams [24] adopting finite element cell modelsunder plane strain conditions: a simple geometri-cal cell composed of matrix and inclusion materialis repeated by appropriate boundary conditions torepresent a composite with a periodic microstruc-ture. The influence of different regular fiber ar-rangements on the strength of transversely loadedboron fiber reinforced Aluminum was analyzed in[25–27]. It was found that the square arrangement

328 DAMAGE SIMULATION
of fibers represents two extremes of the strengthen-ing: high strength levels are achieved if the com-posite is loaded in a 0◦ direction of nearest neigh-bors while the 45◦ loading direction is found to bevery weak for the same fiber arrangement. A regularhexagonal fiber arrangement lies between these lim-its [25–29]. The transverse mechanical behavior of arealistic fiber reinforced composite containing aboutthirty randomly arranged fibers was found to be bestdescribed but significantly underestimated by thehexagonal fiber model [26]. Dietrich [30] found atransversely isotropic square fiber reinforced Ag/Nicomposite material using fibers of different diame-ters. A systematic study in which the fiber volumefraction and the fiber arrangement effects have beeninvestigated, was founded into a simple model in[29].
The influence of fiber shape and clustering was nu-merically examined by Llorca et al. [18], Diet-rich [30], and Sautter [31]. It was observed thatfacetted fiber cross-sections lead to higher strengthscompared to circular cross-sections except for fiberswhich possess predominantly facets with an angle of45◦ with respect to the loading axis in close agree-ment with findings in particle reinforced MMCs[32]. Thus, hindering of shear band formationwithin the matrix was found to be responsible forstrengthening with respect to fiber arrangement andfiber shape [18]. In [29, 33–35] local distribu-tions of stresses and strains within the microstruc-ture have been identified to be also strongly influ-enced by the arrangement of fibers. However, noagreement was found between the mechanical be-havior of composites based on cell models with dif-ferently arranged fibers and experiments with ran-domly arranged fibers loaded in transverse direction.
The overall mechanical behavior of a particle rein-forced composites was studied with axisymmetric fi-nite element cell models by Bao et al. [36] to repre-sent a uniform particle distribution within an elastic-plastic matrix. Tvergaard [37] introduced a modi-fied cylindrical unit cell containing one half of a sin-gle fiber to model the axial performance of a peri-odic square arrangement of staggered short fibers.Hom [38] and Weissenbek [39] have used three-dimensional finite elements to model different regu-lar arrangements of short fibers and spherical as wellas cylindrical particles with relatively small volumefractions ( f < 0.2). It was generally found that thearrangement of fibers strongly influences the dif-ferent overall behavior of composites. When shortfibers are arranged in a side-by-side manner, theyconstrain the plastic flow in the matrix and the com-puted stress-strain response of the composite in thefiber direction is stiffer than that observed in exper-iments. If the fibers in the model are overlapping,
between neighboring fibers strong plastic shearingcan develop in the ligament and the predicted loadcarrying capacity of the composite is closer to theexperimental measurements.
The influence of thermal residual stresses in fiberreinforced MMCs under transverse tension is stud-ied in [27] and found to lead to significant strength-ening elevations in contrast to findings in partic-ulate reinforced MMCs where strength reductionswere calculated [40]. A limited study on the over-all limit flow stress for composites with randomlyoriented disk-like or needle-like particles arrangedin a packet-like morphology is reported by Bao et al.[36]. In [41, 42] a modified Oldroyd model has beenproposed to investigate analytically-numerically theoverall behavior of MMCs with randomly arrangedbrittle particles. Duva [43] has introduced an ana-lytical self-consistent model to represent a randomdistribution of non-interacting rigid spherical parti-cles perfectly bonded in a power law matrix in thedilute regime of volume fractions of f < 0.2.
Composites with randomly arranged inclusions canbe modeled by a self-consistent procedure with em-bedded cell models. This method of surroundinga simulation cell by additional ’equivalent compos-ite material’ was introduced in [30, 33] for struc-tures which are periodical in loading direction, andrecently extended to non-periodic two-dimensional[4, 44, 45] and three-dimensional composites [31,42]. One reason for the discrepancy between exper-iments and calculations based on simple cell mod-els is believed to be the unnatural constraint gov-erning the matrix material between inclusion andsimulation cell border [26, 34, 36–38, 46–48] re-sulting in an unrealistic strength increase. Embed-ded cell models are known to remove the unrealisticconstraints of the simple models described above.An initial comparison of two- and three-dimensionalembedded cell models in case of perfectly plasticmatrix material depicts elevated strength levels forthe three-dimensional case [42] as it happened forcomposites with regularly arranged fibers [29].
For aligned short fiber reinforced composites, someapproaches to determine the mechanical behaviorhave been introduced in [49, 50] by considering twogeometrical aspects: cross-section along fiber andcross-section in transverse plane, which lead to dif-ferent cell models for arrays of end-to-end alignedshort fibers, axially clustered short fibers, trans-versely clustered arrays of short fibers or misalignedshort fibers. In case of short fibers with small as-pect ratio, periodic cell models can be used [49, 50]to follow morphological effects, especially to de-scribe in-plane misaligned short ceramic fibers (SiC-whisker) with small misorientation angles in a single
4.1 Modeling of Damage in Fiber and Particle Reinforced Composites 329
cell model. A further analysis is presented in [51],where the Duva’s model is applied to calculate theoverall flow behavior of short fiber reinforced com-posites. The effects of fiber orientation, which influ-ences the mechanical deformation behavior and thefiber damage behavior, have also been discussed in[51]. Unit cell models have been applied in [52] toanalyze residual stress effects on uniaxial deforma-tion of whisker reinforced Metal Matrix Compos-ites, where models with different fiber aspect ratiosare employed to predict the overall flow behavior ofshort fiber reinforced MMCs. Comparisons betweenexperimental and numerical results on two compos-ites demonstrate that it is not possible to use a singleunit cell to predict the mechanical behavior of ran-domly oriented short fiber reinforced MMCs. A rep-resentative volume with different fiber orientationsis described in a two-dimensional model in [53] todetermine the mechanical behavior of compositeswith randomly oriented fibers, where the fibers areagain very short (aspect ratio 2/1). A microme-chanical model has been introduced in [54, 55] forshort fiber reinforced aluminum alloys. There, threeelementary microstructural mathematical processeswere taken into account to investigate the creep be-havior of these MMCs, without considering the mor-phological aspect of the fibers.
4. MODELING
In this section several models will be presented,to simulate the mechanical behavior of composites.The self-consistent and the (Statistical) CombinedCell Models are indicative of unit cell approaches.As a last example the plastic-damage model is intro-duced, which can describe the homogenized consti-tutive behavior of fiber reinforced quasi-brittle ma-terials. In Sec. 5, these four models will be thenapplied to fiber and particle reinforced compositeswith metal or polymer matrix and a cellulose fibergypsum composite. There, also the potential andlimitations of these models to simulate the specificmechanical behavior will be discussed.
4.1. Self-Consistent Model (SCM)
For composites reinforced with aligned continu-ous fibers or with spherical particles, simple unitcells with single inclusions can be taken from arepresentative cross-section in a transverse plane[4, 24, 26, 30, 34, 56] or from a cross-section alongthe loading axis [5, 36, 40]. In the present section,2D and 3D self-consistent embedded cell models
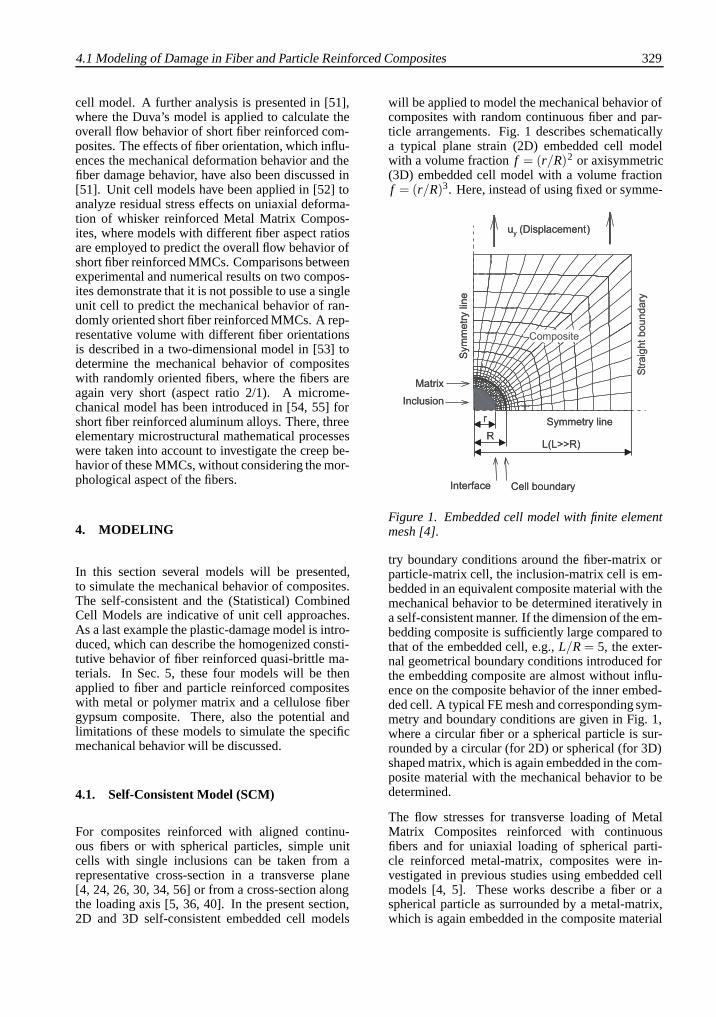
will be applied to model the mechanical behavior ofcomposites with random continuous fiber and par-ticle arrangements. Fig. 1 describes schematicallya typical plane strain (2D) embedded cell modelwith a volume fraction f = (r/R)2 or axisymmetric(3D) embedded cell model with a volume fractionf = (r/R)3. Here, instead of using fixed or symme-
Figure 1. Embedded cell model with finite elementmesh [4].
try boundary conditions around the fiber-matrix orparticle-matrix cell, the inclusion-matrix cell is em-bedded in an equivalent composite material with themechanical behavior to be determined iteratively ina self-consistent manner. If the dimension of the em-bedding composite is sufficiently large compared tothat of the embedded cell, e.g., L/R = 5, the exter-nal geometrical boundary conditions introduced forthe embedding composite are almost without influ-ence on the composite behavior of the inner embed-ded cell. A typical FE mesh and corresponding sym-metry and boundary conditions are given in Fig. 1,where a circular fiber or a spherical particle is sur-rounded by a circular (for 2D) or spherical (for 3D)shaped matrix, which is again embedded in the com-posite material with the mechanical behavior to bedetermined.
The flow stresses for transverse loading of MetalMatrix Composites reinforced with continuousfibers and for uniaxial loading of spherical parti-cle reinforced metal-matrix, composites were in-vestigated in previous studies using embedded cellmodels [4, 5]. These works describe a fiber or aspherical particle as surrounded by a metal-matrix,which is again embedded in the composite material

330 DAMAGE SIMULATION
with the mechanical behavior to be determined it-eratively in a self-consistent manner. It has beenverified in [4, 5] that such a self-consistent embed-ded cell method is appropriate to represent MetalMatrix Composites with randomly arranged parti-cles or aligned continuous fibers. The inclusion be-haves elastically and its stiffness is much higher thanthat of the matrix. In addition, the continuous fibersof circular cross-section and spherical particles areassumed to be well bonded to the matrix so thatdebonding or sliding at the inclusion-matrix inter-face is not permitted. The uniaxial matrix stress-strain behavior is described by a Ramberg-Osgoodtype of power law [5].
The global mechanical response of the compositeunder external loading is characterized by the over-all stress σ as a function of the overall strain ε.Moreover, to describe the results in a consistent way,the reference axial yield stress σ0 and yield strainε0 of the matrix (as defined in Eq. 1 for the 3Dcase) will be taken to normalize the overall stressand strain of the composite, respectively.
Following Bao et al. [36], the composite contain-ing hard inclusions will necessarily harden with thesame strain hardening exponent N, as the matrix forthe case of hard inclusions when strains are in theregime of fully developed plastic flow. At suffi-ciently large strains the composite behavior is thendescribed by
σ = σN
[εε0
]N
, (1)
where σN is the asymptotic reference stress of thecomposite, which can be determined by normalizingthe composite stress by the stress in the matrix at thesame overall strain ε, as indicated in Eq. 2 and Fig. 2:
σN = σ0
[σ(ε)σ(ε)
]for ε>>ε0. (2)
For a matrix of strain hardening capability N, thelimit value σN
/σ0 is defined as composite strength-
ening level, which is an important value to describethe mechanical behavior of composites. This valuedepends only on fiber and particle arrangement, in-clusion volume fraction and matrix strain-hardeningexponent. Under axial deformation at the externalboundary, the overall response of the inner embed-ded cell can be obtained by averaging the stressesand strains at the boundary between the embeddedcell and the surrounding volume.
The embedding method is a self-consistent proce-dure, which requires several iterations, as shown in
Figure 2. Composite strengthening [5].
Fig. 3. An initially assumed stress-strain curve (it-eration 0 in Fig. 3) is first assigned to the embed-ding composite, in order to perform the first iterationstep. An improved stress-strain curve of the com-posite (iteration 1) will be obtained by analyzingthe average mechanical response of the embeddedcell. This procedure is repeated until the calculatedstress-strain curve from the embedded cell is almostidentical to that of the previous iteration. The con-vergence of the iteration occurs typically at the fifthiteration step, as illustrated in Fig. 3. It has been
Figure 3. Iterative modeling procedure: stress-strain curves for different iteration steps[5].
found from systematic studies that convergence ofthe iteration to the final stress-strain curve of thecomposite is independent of the initial mechanicalbehavior of the embedding composite (iteration 0).
4.1 Modeling of Damage in Fiber and Particle Reinforced Composites 331
4.2. Combined Cell Model (CCM)
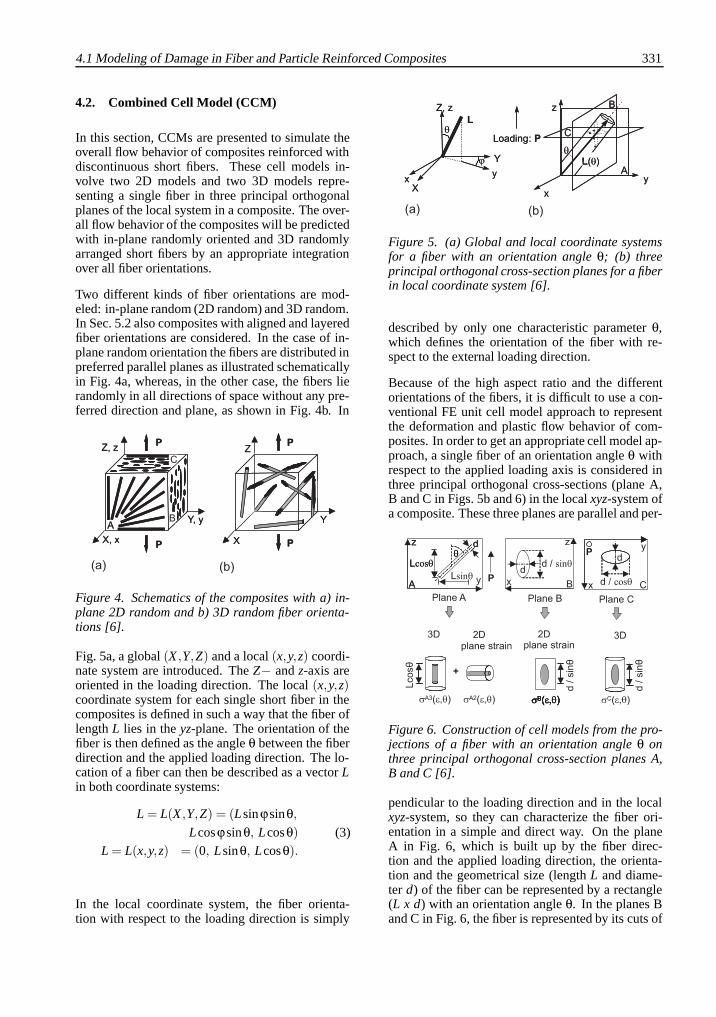
In this section, CCMs are presented to simulate theoverall flow behavior of composites reinforced withdiscontinuous short fibers. These cell models in-volve two 2D models and two 3D models repre-senting a single fiber in three principal orthogonalplanes of the local system in a composite. The over-all flow behavior of the composites will be predictedwith in-plane randomly oriented and 3D randomlyarranged short fibers by an appropriate integrationover all fiber orientations.
Two different kinds of fiber orientations are mod-eled: in-plane random (2D random) and 3D random.In Sec. 5.2 also composites with aligned and layeredfiber orientations are considered. In the case of in-plane random orientation the fibers are distributed inpreferred parallel planes as illustrated schematicallyin Fig. 4a, whereas, in the other case, the fibers lierandomly in all directions of space without any pre-ferred direction and plane, as shown in Fig. 4b. In
Figure 4. Schematics of the composites with a) in-plane 2D random and b) 3D random fiber orienta-tions [6].
Fig. 5a, a global (X ,Y,Z) and a local (x,y,z) coordi-nate system are introduced. The Z− and z-axis areoriented in the loading direction. The local (x,y,z)coordinate system for each single short fiber in thecomposites is defined in such a way that the fiber oflength L lies in the yz-plane. The orientation of thefiber is then defined as the angle θ between the fiberdirection and the applied loading direction. The lo-cation of a fiber can then be described as a vector Lin both coordinate systems:
L = L(X ,Y,Z) = (Lsinϕsinθ,
Lcosϕsinθ, Lcosθ) (3)L = L(x,y,z) = (0, Lsinθ, Lcosθ).
In the local coordinate system, the fiber orienta-tion with respect to the loading direction is simply
Figure 5. (a) Global and local coordinate systemsfor a fiber with an orientation angle θ; (b) threeprincipal orthogonal cross-section planes for a fiberin local coordinate system [6].
described by only one characteristic parameter θ,which defines the orientation of the fiber with re-spect to the external loading direction.
Because of the high aspect ratio and the differentorientations of the fibers, it is difficult to use a con-ventional FE unit cell model approach to representthe deformation and plastic flow behavior of com-posites. In order to get an appropriate cell model ap-proach, a single fiber of an orientation angle θ withrespect to the applied loading axis is considered inthree principal orthogonal cross-sections (plane A,B and C in Figs. 5b and 6) in the local xyz-system ofa composite. These three planes are parallel and per-
Figure 6. Construction of cell models from the pro-jections of a fiber with an orientation angle θ onthree principal orthogonal cross-section planes A,B and C [6].
pendicular to the loading direction and in the localxyz-system, so they can characterize the fiber ori-entation in a simple and direct way. On the planeA in Fig. 6, which is built up by the fiber direc-tion and the applied loading direction, the orienta-tion and the geometrical size (length L and diame-ter d) of the fiber can be represented by a rectangle(L x d) with an orientation angle θ. In the planes Band C in Fig. 6, the fiber is represented by its cuts of
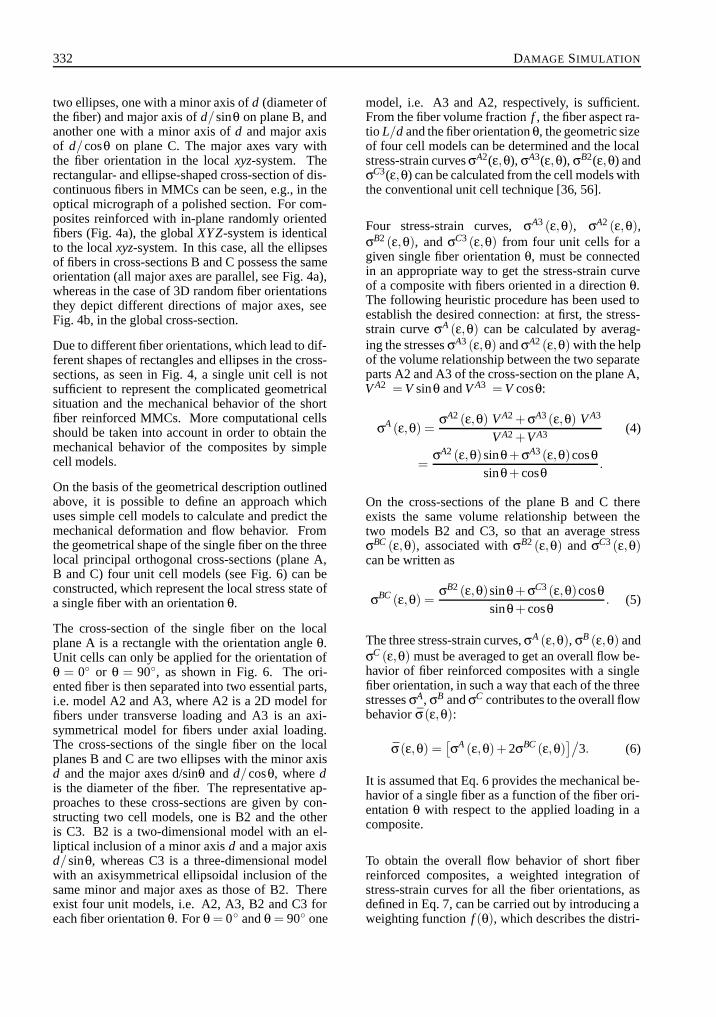
332 DAMAGE SIMULATION
two ellipses, one with a minor axis of d (diameter ofthe fiber) and major axis of d/sinθ on plane B, andanother one with a minor axis of d and major axisof d/cosθ on plane C. The major axes vary withthe fiber orientation in the local xyz-system. Therectangular- and ellipse-shaped cross-section of dis-continuous fibers in MMCs can be seen, e.g., in theoptical micrograph of a polished section. For com-posites reinforced with in-plane randomly orientedfibers (Fig. 4a), the global XYZ-system is identicalto the local xyz-system. In this case, all the ellipsesof fibers in cross-sections B and C possess the sameorientation (all major axes are parallel, see Fig. 4a),whereas in the case of 3D random fiber orientationsthey depict different directions of major axes, seeFig. 4b, in the global cross-section.
Due to different fiber orientations, which lead to dif-ferent shapes of rectangles and ellipses in the cross-sections, as seen in Fig. 4, a single unit cell is notsufficient to represent the complicated geometricalsituation and the mechanical behavior of the shortfiber reinforced MMCs. More computational cellsshould be taken into account in order to obtain themechanical behavior of the composites by simplecell models.
On the basis of the geometrical description outlinedabove, it is possible to define an approach whichuses simple cell models to calculate and predict themechanical deformation and flow behavior. Fromthe geometrical shape of the single fiber on the threelocal principal orthogonal cross-sections (plane A,B and C) four unit cell models (see Fig. 6) can beconstructed, which represent the local stress state ofa single fiber with an orientation θ.
The cross-section of the single fiber on the localplane A is a rectangle with the orientation angle θ.Unit cells can only be applied for the orientation ofθ = 0◦ or θ = 90◦, as shown in Fig. 6. The ori-ented fiber is then separated into two essential parts,i.e. model A2 and A3, where A2 is a 2D model forfibers under transverse loading and A3 is an axi-symmetrical model for fibers under axial loading.The cross-sections of the single fiber on the localplanes B and C are two ellipses with the minor axisd and the major axes d/sinθ and d/cosθ, where dis the diameter of the fiber. The representative ap-proaches to these cross-sections are given by con-structing two cell models, one is B2 and the otheris C3. B2 is a two-dimensional model with an el-liptical inclusion of a minor axis d and a major axisd/sinθ, whereas C3 is a three-dimensional modelwith an axisymmetrical ellipsoidal inclusion of thesame minor and major axes as those of B2. Thereexist four unit models, i.e. A2, A3, B2 and C3 foreach fiber orientation θ. For θ = 0◦ and θ = 90◦ one
model, i.e. A3 and A2, respectively, is sufficient.From the fiber volume fraction f , the fiber aspect ra-tio L/d and the fiber orientation θ, the geometric sizeof four cell models can be determined and the localstress-strain curves σA2(ε,θ), σA3(ε,θ), σB2(ε,θ) andσC3(ε,θ) can be calculated from the cell models withthe conventional unit cell technique [36, 56].
Four stress-strain curves, σA3 (ε,θ), σA2 (ε,θ),σB2 (ε,θ), and σC3 (ε,θ) from four unit cells for agiven single fiber orientation θ, must be connectedin an appropriate way to get the stress-strain curveof a composite with fibers oriented in a direction θ.The following heuristic procedure has been used toestablish the desired connection: at first, the stress-strain curve σA (ε,θ) can be calculated by averag-ing the stresses σA3 (ε,θ) and σA2 (ε,θ) with the helpof the volume relationship between the two separateparts A2 and A3 of the cross-section on the plane A,V A2 = V sinθ and V A3 = V cosθ:
σA (ε,θ) =σA2 (ε,θ) V A2 + σA3 (ε,θ) V A3
V A2 +VA3 (4)
=σA2 (ε,θ) sinθ+ σA3 (ε,θ)cosθ
sinθ+ cosθ.
On the cross-sections of the plane B and C thereexists the same volume relationship between thetwo models B2 and C3, so that an average stressσBC (ε,θ), associated with σB2 (ε,θ) and σC3 (ε,θ)can be written as
σBC (ε,θ) =σB2 (ε,θ)sinθ+ σC3 (ε,θ)cosθ
sinθ+ cosθ. (5)
The three stress-strain curves, σA (ε,θ), σB (ε,θ) andσC (ε,θ) must be averaged to get an overall flow be-havior of fiber reinforced composites with a singlefiber orientation, in such a way that each of the threestresses σA, σB and σC contributes to the overall flowbehavior σ(ε,θ):
σ(ε,θ) =[σA (ε,θ)+2σBC (ε,θ)
]/3. (6)
It is assumed that Eq. 6 provides the mechanical be-havior of a single fiber as a function of the fiber ori-entation θ with respect to the applied loading in acomposite.
To obtain the overall flow behavior of short fiberreinforced composites, a weighted integration ofstress-strain curves for all the fiber orientations, asdefined in Eq. 7, can be carried out by introducing aweighting function f (θ), which describes the distri-

4.1 Modeling of Damage in Fiber and Particle Reinforced Composites 333
bution density of short fibers in a composite:
σ(ε) =
π/2∫0
σ(ε,θ) f (θ)dθ
π/2∫0
f (θ)dθ. (7)
If the short fibers are randomly distributed in MMCsin a plane (2D random), they possess the same dis-tribution density in all directions of the plane, asschematically illustrated in Fig. 4a. In this case, theweighting function f (θ) has the constant value 1. Ifthe short fibers are distributed randomly in MMCsin all directions of space (3D random), the distri-bution density changes with the orientation anglein the same way as the change of the latitude in aspherical coordinate, which is considered by intro-ducing a weighting function f (θ) = sinθ. For com-posites with preferred fiber orientation the weight-ing function f (θ) must be determined in correspon-dence with the preferred fiber orientations.
4.3. Statistical Combined Cell Models
4.3.1. Static Loading Conditions
Statistical Combined Cell Models (SCCMs) forshort fiber reinforced composites with different fibervolume fractions have been developed on the basisof the Combined Cell Models of the previous section[6, 57, 58] and a Weibull statistical approach [59],originally developed for fiber fracture in composites.The SCCM takes into consideration fiber-cracks andfiber-matrix debonding. This allows to calculate thetwo types of unit cells separately, i.e. unit cells withunbroken and with broken fibers. Then, the globalmechanical behavior of composites reinforced withshort fibers is calculated on the basis of the rule ofmixture.
When loading is parallel to the fiber orientation or ifno debonding occurs between fiber and matrix, it isfound that fiber failure is the main source of damagein the composite (Fig. 7). The fracture probabilityof each fiber is a function of its volume and of themaximum principal stress σU
F in the fiber. Therefore,the Weibull law, from Eq. 8, can be written in termsof fiber failure as follows:
Pbrk(σF) = 1− exp
[−
(σU
F
σ0F
)mF ]. (8)
In this equation, Pbrk(σF) is the failure probabilityof fiber fracture and mF is the shape parameter of
Weibull’s law which corresponds to the scatter ofthe fiber breaking in the composite. σ0F is a scaleparameter and equivalent to the mean value of thefiber strength, which gives a cumulative breakingprobability of 63% and it corresponds to fraction ofbroken fibers for a given fiber reinforced composite.This parameter is strongly related to the reinforce-ment material. In this manner, we can obtain themechanical behavior of composites for the unit cellsA3, A2, B and C with Eqs. 4 and 5. The damagebehavior of composites can be calculated accordingto Eqs. 8 and 9:
σbrk (ε,θ) =[1−Pbrk (
σF)]σbrk
UD (ε,θ)
+Pbrk (σF)
σbrkFD (ε,θ). (9)
A further principal source of damage is the failure
Figure 7. Schematics of the Statistical CombinedCell Models (SCCM) with fracture of brittle fibersin short fiber strengthened composites.
of the fiber-matrix interface (Fig. 8). This failure isgoverned by a local criterion that is dominated by in-terfacial normal stress. Because the interfacial dam-age is distributed statistically as a function of thespatial distribution of the microstructure, the localinterface failure criterion must be written in a statis-tical form following Weibull’s law:
Pdeb(σL) = 1− (10)
exp
⎡⎣−
⎛⎝
√(σU
L
σ0L
)2
+(
τUL
τ0L
)2⎞⎠
mL⎤⎦ ,
where Pdeb(σL) denotes the fiber-matrix interfacialdebonding probability relative to a given interfacialstate σU
L , which is a function of the microscopicstress σL, σ0L denotes the interfacial stress, and mL

334 DAMAGE SIMULATION
is the statistical parameter. The parameter τUL de-
notes the interfacial shear stress and τ0L is the char-acteristic shear stress. If the fiber is perpendicularto the loading direction (90◦), there is no significantinfluence of shear stresses and the equation can bewritten as
Pdeb(σL) = 1− exp
[−
(σU
L
σ0L
)mL]. (11)
The stress state of a cell can be predicted by the mix-ing rule [7, 60] in which undebonding stresses anddebonding stresses are taken into account:
σ(ε) =[1−Pdeb(σL)
]σud(ε)+
Pdeb(σL)σdb(ε), (12)
where σud(ε) is the stress in an undamaged unit celland σdb(ε) is the stress in a damaged unit cell dueto fiber-matrix interfacial debonding. In this equa-tion, σ(ε) is the stress behavior of a composite cellwith fiber perpendicular to the loading direction thatincludes the debonding damage behavior. The firstterm on the right-hand side indicates the stress be-havior of the undamaged interface (ud) and the sec-ond term indicates the stress behavior of damagedinterface (db) in a composite. Thus, the arithmeticsum in Eq. 12 implies the stress behavior of a com-posite cell with debonding failure. The mechanical
Figure 8. Schematics of the Statistical CombinedCell Models with damage in the boundary layer be-tween fibers and matrix.
behavior derived from the unit cells A3, A2, B andC with consideration of the damage between fibersand matrix follows in an analogous manner.
For the numerical investigation with considerationof the fiber-matrix adhesion effect, fibers were ar-ranged in the tensile specimen perpendicularly to the
loading direction. In this case there was damage atthe boundary layer between fibers and matrix, butno fiber fractures took place. When using the CCM,we have in this case θ = 0◦, so that a descriptionof the model through the model part A3 is sufficient(Fig. 8). As a first application of the SCCM, the pa-rameters in Eqs. 11 and 11 can be calculated by acomparison between the computation and the exper-iment.
From the experiments it can be seen that in case ofparallel loading there is a combined effect of fiberbreaking and debonding on the composite failure.Both effects can be combined in a composite unitcell using the mixing rule [7, 60]
σ(ε) =[1−Pdeb(σL)−Pbrk(σL)
]σud(ε)+
Pdeb(σL)σdb(ε)+Pbrk(σL)σbrk(ε), (13)
where σbrk(ε) is the stress in a damaged unit cell dueto broken fibers.
The two Weibull parameters for interface failure andfiber failure are numerically identified by using thedata from micromechanical models and the calcu-lated finite element results to compare them with theexperimental curves.
4.3.2. Quasi-Static Cyclic Loading Conditions
The micromechanical fatigue damage model in thissection is based on a statistical microscopic damagelaw. Predictions of these types of failure have beenapplied to determine damages in each loading cycle.By comparing the simulation with the experimentalstress-strain curves for tension, the Weibull damageparameters are determined. Using these damage pa-rameters a mesoscopic model (Sec. 5.2.3) includingthe effect of fiber-clusters is developed and the dam-age during cyclic loading is predicted.
To study the behavior of fiber reinforced compos-ites, 3D unit cell models are used to analyze themicroscopic failure. The statistical analysis of fiberbreaking and fiber-matrix interfacial debonding willbe predicted by Weibull’s law [61, 62] as describedabove. It is based on the assumption that the com-posite fails as a result of accumulation of statisticallydistributed fiber flaws. The equations of Weibull’sdamage law for fiber failure [7, 63] were taken fromEqs. 8 and 13. The fiber failure can be supplementedby fiber-matrix interfacial debonding.
Evolution of damage in a composite under cyclicloading is calculated on the basis of the statistical

4.1 Modeling of Damage in Fiber and Particle Reinforced Composites 335
evolution of damage in the fiber-matrix interfacesand in the broken fibers. Debonding failure and fail-ure due to broken fibers are considered mutually de-pendent on each other. That means that, if debond-ing occurs around the fiber-matrix interface, fiberfailure will not occur. On the other hand, wherethe fibers break, there is a negligible influence ofdebonding failure. The damage stress for each cycleis calculated according to the total failure probabilitydue to fiber failure and interface debonding. The ef-fect of damage is embedded in the model by replac-ing the stress of the previous cycle (the true stress inthe first cycle) with the effective stress in the presentcycle. Any strain constitutive equation for the dam-aged material is derived in the same way as for thevirgin material, except that the true stress is replacedby the current effective stress [64]. Accordingly,material properties are changed during the cycle dueto fiber failure and interface debonding. Applyingthe mixing rule, the stress after the k-th loading cy-cle can be expressed as follows:
σk+1i j (εi j) = σk
i j(εi j)−Pbrk(σk
i j,unbr(εi j)−σki j,brk(εi j))−
Pdeb(σki j,unde(εi j)−σk
i j,deb(εi j)), (14)
where i is the Element index, and j is the loadingstep index in one cycle. Therefore, the new mate-rial properties of the composite are calculated foreach loading cycle, which is then included into theABAQUS input file [65] for the next loading cyclecalculation.
4.4. Plastic-Damage Model
In this section, the homogenized constitutive frac-ture behavior of materials will be described forstatic and quasi-static cyclic loading with a plastic-damage model proposed by Lubliner et al. [66] andLee and Fenves [67]. In this model, stiffness degra-dation due to damage is embedded in the plasticitypart of the model. Damage is represented by twoindependent scalar damage parameters, one for ten-sion (dt) and another one for compression (dc). Thisis necessary because many materials show differentdamage mechanisms in tension and compression.In tension, the damage is associated with cracking,while in compression, it is associated with crush-ing. The initial undamaged state and complete dam-aged state of the material under tension and com-pression are indicated by dt , dc = 0 and dt , dc = 1,respectively. Apart from this, a stiffness recoveryscheme is used for simulating the effect of micro-crack opening and closing. The effect of damage is
embedded in the plasticity theory and all stress defi-nitions (true stress) are reduced to the effective stress[64]. This enables the decoupling of the constitutiverelations for the elastic-plastic response from stiff-ness degradation (damage) response.
In the following equations, underlined symbols indi-cate vector or tensor quantities, overlined stress ex-pressions indicate effective stresses. Symbols with-out underline are to be understood as scalar quan-tities. All strain symbols with a tilde are equiva-lent strains. In Eq. 15 Macaulay brackets 〈〉 havebeen used, which are defined as 〈x〉 = x if x > 0,otherwise 〈x〉 = 0. For the plasticity part, a non-associated plasticity scheme is used. The yield sur-face proposed by Lubliner et al. [66] is based onmodifications of the classical Mohr-Coulomb plas-ticity (Eq. 15):
F(σ, εpl) =1
1−α(q−3αp+ β (εpl)
⟨ˆσmax
⟩−γ⟨− ˆσmax
⟩)− σc(εpl
c ), (15)
where σ corresponds to the stress tensor, σc is theuniaxial compressive stress, p corresponds to theeffective hydrostatic pressure, α and γ are materialconstants, q corresponds to the equivalent effectivedeviatoric stress, ˆσmax is the max. principal stress,and εpl corresponds to the equivalent plastic strain.
A separate flow potential is used to determine the di-rection of plastic flow in the principal stress space.The flow potential chosen for this model is theDrucker-Prager hyperbolic function G (Eq. 22 inSec. 5.3.2). At high confining pressure stress,the function asymptotically approaches the linearDrucker-Prager flow potential in the deviatoric planeand intersects the hydrostatic pressure axis at 90◦[68]. In Fig. 9 the yield surface and the flow po-tential function are illustrated in the 2D principalstress space. The material modeling has been per-formed based on an existing implementation of theplastic-damage model in ABAQUS. The details ofthe mathematical formulation of the model are givenin [66, 68–70].
4.4.1. Modifications of the Plastic-DamageModel
The simulation results of the static behavior ofthe material presented in Sec. 5.3.1, obtained byusing the implemented plastic-damage model inABAQUS, is close to that of the experiment (seeSec. 5.3.2). However, when applying the imple-mented model to cyclic loading, considerable modellimitations are observed. The implemented model

336 DAMAGE SIMULATION
Figure 9. Illustration of (a) yield surface, and flowpotentials, (b) dilation angle [11].
reaches up to the point where unloading starts. Be-yond this point the material behavior is complex,showing different stiffnesses at different stages ofunloading and reloading. It is not possible to han-dle the varying unloading and reloading stiffnesseswith the available stiffness recovery effects imple-mented in the plastic-damage model provided byABAQUS. Therefore, the plastic-damage model hasbeen re-implemented with the necessary modifica-tions in a user defined material subroutine UMATin ABAQUS to improve the simulation of the quasi-static cyclic experiments.
If the yield point in compression is not reached,compression damage is absent (dc = 0). Then, dam-age occurs only due to tensile loading, which isrepresented by the scalar tension damage parame-ter dt . The total damage parameter d in the modi-fied plastic-damage model is correlated with tension
damage parameter dt as
d = dt · s, (16)
s = 1−w, (17)
where s is the stiffness recovery factor and w isthe weight factor that controls the stiffness recov-ery. w = 1 means complete stiffness recovery cor-responding to d = 0, whereas w = 0 means no stiff-ness recovery corresponding to d = dt . On the yieldsurface, d is obtained from Eq. 16 and 17. The evo-lution of yield stress, tension damage, dt and weightfactor, w are functions of plastic strain in tension, εp
t .The material subroutine UMAT requires the evolu-tion information as strain softening, damage evolu-tion and stiffness recovery curves. During unload-ing and reloading in the elastic domain, d is rede-fined in the material subroutine UMAT based onrules derived by observing the unloading/reloadingslope (E) in the uniaxial quasi-static cyclic stress-strain curves. The corresponding damage parameterd is obtained from the varying slope (E) and the ini-tial stiffness (E0) as
d = 1− EE0
. (18)
The determination process of the rules controllingd in the elastic domain and strain softening, damageevolution and stiffness recovery curves are discussedin Sec. 5.3.2.
5. RESULTS AND APPLICATION
After introduction of the investigated materials, inthis section the above presented models will beapplied to different composites which are MMCs,PMCs, and cellulose fiber reinforced gypsum mate-rials. In the case of MMCs the self-consistent andthe (Statistical) Combined Cell Models are used.The PMCs are studied applying the Statistical andCombined Cell Model. Finally, the plastic-damagemodel suit especially for quasi-brittle materials suchas the investigated cellulose fiber reinforced gypsumcomposite.
5.1. Metal Matrix Composites (MMC)
As a first example the self-consistent and the (Sta-tistical) Combined Cell Model will be applied toMetal Matrix Composites. MMCs with strong in-clusions are a relatively new class of materials (com-pare Chapter 2.1.4). Due to high strength and lightweight, they are potentially valuable in aerospaceand transportation applications [71].

4.1 Modeling of Damage in Fiber and Particle Reinforced Composites 337
5.1.1. Material
The metal-matrix is an Al/12% vol. Si cast alloy(M124). The composite considered here has beenproduced by Mahle GmbH, Stuttgart, via pressureinfiltration of a fiber preform with randomly ori-ented short Al2O3-fibers (Saffil). These fibers be-have elastically (Young’s modulus E = 300 GPa,and Poisson’s Ratio ν = 0.23), the fiber content inthe composite is 15% vol., and the fiber aspect ra-tio is approximately 200µm/3µm. Fig. 10 shows anoptical micrograph of a polished section of the shortfiber reinforced composite [72].
As a further example an Al/46% vol. B compos-ite with random fiber packing taken from [26] hasbeen selected to verify the embedded cell model.This MMC is a 6061-O aluminum alloy reinforcedwith unidirectional cylindrical boron fiber of 46%volume fraction. The room temperature elasticproperties of the fibers are a Young’s modulusof E(B) = 410 GPa, and a Poisson’s Ratio ofν(B) = 0.2. The experimentally determined me-chanical properties of the 6061-O aluminum ma-trix are Young’s modulus, E (Al) = 69 GPa, Pois-son’s Ratio, ν(Al) = 0.33, 0.2% offset tensile yieldstrength, σ0 = 43 MPa, and strain-hardening expo-nent N = 1/n = 1/3.
Furthermore, the composite Ag/58% vol. Ni [42]with random particle arrangement (Young’s modu-lus, E(Ni) = 199.5 GPa, E (Ag) = 82.7 GPa, Pois-son’s Ratio, ν(Ni) = 0.312, ν(Ag) = 0.367, andyield strength σ(Ni)
0 = 193 MPa, σ(Ag)0 = 64 MPa)
has been investigated.
Figure 10. Optical micrograph of a polished sec-tion of the discontinuous short fiber Al alloy/15%vol. Al2O3 composite with 3D random fiber orienta-tion [6].
5.1.2. Results: Self-Consistent Model
In this section, self-consistent embedded cell mod-els, which are described in Sec. 4.1, are applied tosimulate the transverse behavior of MMCs contain-ing fibers in a regular square or hexagonal arrange-ment as well as the mechanical behavior of MMCscontaining particles in a regular arrangement. Twoaims are pursued: one is to investigate the me-chanical behavior of MMCs reinforced with regularor random arranged continuous fibers under trans-verse loading and particles under uniaxial loading.The other one is to systematically study compos-ite strengthening as a function of inclusion volumefraction and matrix hardening ability. The FiniteElement Method (FEM) is employed to carry outthe calculations. The overall response of MMCs iselastic-plastic. As regular fiber spacings are diffi-cult to achieve in practice, most of the present fiberreinforced MMCs contain aligned but randomly ar-ranged continuous fibers.
The LARSTRAN finite element program [73] wasemployed using 8 noded plane strain elements (for2D) as well as axisymmetric biquadrilateral ele-ments (for 3D) generated with the help of the pre-and post-processing program PATRAN [74].
Fig. 11a shows a comparison of the stress-straincurves of the composite Al/46% vol. B under trans-verse loading from simulations of a real microstruc-ture together with results from different cell mod-els. The stress-strain curve from the embedded cellmodel employed in this Chapter shows close agree-ment with the curve from the calculated randomfiber packing in the elastic and plastic regime, whichlies between the curves from square unit cell model-ing under 0◦ loading and hexagonal unit cell model-ing.
Furthermore, the stress-strain curve from anotherexperiment [42] on the composite Ag/ 58% vol. Niwith random particle arrangement has been com-pared with that from the self-consistent embeddedcell model (Fig. 11b). Close agreement in the regimeof plastic response is obtained, although the Ni-particles in the experiment were not perfectly spher-ical. These results indicate that the embedded cellmodel can be used to successfully simulate compos-ites with random inclusion arrangements and to pre-dict the elastic-plastic composite behavior. A com-parison of the stress-strain curves for the compositeAl/46% vol. B in Fig. 11a shows that the stress-strain curve from random fiber packing given in [26]lies also between the curves from square unit cellmodeling under 0◦ loading and hexagonal unit cellmodeling.

338 DAMAGE SIMULATION
Figure 11. Comparison of the mechanical behaviorof (a) an Al-46% vol. B fiber reinforced compos-ite (N=1/3, f=0.46) under transverse loading fromdifferent models, and (b) an Ag-58% vol. Ni partic-ulate composite from embedded cell model and ex-periment [5].
Geometrical shape of the embedded cellAs mentioned above, different shapes of cross-section of the embedded cell model with a circularshaped fiber, as shown in Fig. 12a, are also takeninto account to investigate the influence of the geo-metrical shape of the embedded cells on the overallbehavior of the composite. The stress-strain curvesof all embedded cell models with different geomet-rical shapes are plotted in Fig. 12b. With an ex-ception of square - 45◦ embedded cell model, thestress-strain curves are very close for all embeddedcell shapes, namely, square - 0◦ , circular, rectangu-lar - 0◦, rectangular - 90◦, elliptic - 0◦ and elliptic- 90◦. From the calculated results of the embedded
Figure 12. Embedded cell models: influence of (a)different matrix shapes on (b) stress-strain curvesfor an Al-46% vol. B (N=1/3, f=0.46) composite[5].
cell models, localized flows have been found aroundthe hard fiber with preferred yielding at 45◦. Be-cause of the special geometry of the square - 45◦ em-bedded cell model with the cell boundary parallel tothe preferred yielding at 45◦, the overall stresses ofthe composite with such a geometrical cell shape aretherefore reduced, such that a relative lower stress-strain curve has been obtained from the modeling.The almost identical responses of the other embed-ded cell models indicate that, besides of the specialshape of matrix with 45◦ cell boundaries, the pre-dicted mechanical behavior of fiber reinforced com-posites under transverse loading is independent ofthe modeling shape of the embedded composite cell.
Strengthening modelThe strength of MMCs reinforced by hard inclu-sions under external mechanical loading has beenshown to increase with inclusion volume fractionand strain-hardening ability of the matrix for all in-clusion arrangements investigated. From the pre-sented numerical predictions, a strengthening modelfor aligned continuous fiber reinforced MMCs withrandom, square (0◦) and hexagonal arrangements

4.1 Modeling of Damage in Fiber and Particle Reinforced Composites 339
as well as for spherical particle reinforced MMCswith random, primitive cubic and hexagonal ar-rangements can be derived as a function of the in-clusion volume fraction f , and the strain-hardeningexponent N, of the matrix:
σN = σ0 ·(
1− fc1 (2+N)
)−(c2N+c3)
−
σ0 · c4
(f +
N5
), (19)
where σ0 is the matrix yield stress, and c1, c2, c3and c4 are constants summarized in Tab. 1. Eq. 19
2D c1 c2 c3 c4SCM 0.361 1.59 0.29 0.1
SM (0◦) 0.405 2.35 0.65 0.22HM 0.305 1.3 0.05 0.03D
SCAM 0.45 2.19 0.84 0.53AM 0.38 2.5 0.7 0.66PCM 0.34 2.3 0.65 0.5
Table 1. Constants for strengthening models: self-consistent embedded cell model with random fiberarrangement (SCM), square unit cell model (SM),hexagonal unit cell model (HM), Self-consistentaxisymmetric embedded cell model (SCAM), axi-symmetric unit cell model (AM), primitive cubic unitcell model (PCM) [5].
represents the closest approximation to the calcu-lated composite strengthening values σN for matrixstrain-hardening exponents N in the limit of 0.0 <N < 0.5 for square 0◦, hexagonal and random fiberarrangements, (practical fiber volume fractions f inthe range of 0.0 < f < 0.7), respectively. A compar-ison of this strengthening model (Eq. 19) for randomfiber arrangements with the values calculated byusing self-consistent embedded cell models showsclose agreement with an average error of 1.25% andmaximum error of 6.95%. Eq. 19 is also availablefor matrix strain-hardening exponents N in the lim-its of 0.0 < N < 0.5 for self-consistent axisymmet-ric embedded cell models (particle volume fractionf in the range of 0.05 < f < 0.65 with an averageerror of 1.59% and a maximum error of 6.68% forthe extreme case f = 0.05, N = 0.5), axisymmet-ric unit cell models (particle volume fraction f inthe range of 0.05 < f < 0.55 with an average er-ror of 1.22% and a maximum error of 6.18% for theextreme case f = 0.55, N = 0.5) and for primitivecubic unit cell models (particle volume fraction f inthe range of 0.05 < f < 0.45 with an average errorof 1.43% and a maximum error of 6.38% for the ex-treme case f = 0.05, N = 0.5).
5.1.3. Results: Combined Cell Model
The purpose of the present section is to investigatethe mechanical and thermo-mechanical behavior ofMMCs (Al/15% vol. Al2O3 aluminum matrix com-posite (Fig. 10) reinforced with randomly orientedshort fibers by applying the Combined Cell Modeldescribed in Sec. 4.2. The fibers are well bonded tothe matrix so that debonding or sliding at the fiber-matrix interface is not permitted. The finite elementmethod (FEM) is employed within the framework ofcontinuum mechanics to carry out the calculations.
The uniaxial matrix elasto-plastic stress-strain be-havior measured from experiments at room temper-ature can be described by an exponential hardeninglaw:
σ = Eε ε ≤ ε0 , (20)
σ = σ0
[εε0
]N
ε>ε0 ,
where σ and ε are the uniaxial stress and strain of thematrix, respectively, σ0 is the flow stress, the ma-trix yield strain is given as ε0 = E/σ0, E is Young’smodulus, and N is the strain hardening exponent. J2flow theory of plasticity with isotropic hardening isemployed with a von Mises yield criterion to char-acterize the rateindependent matrix material. Theflow behavior is different in tension and compres-sion and can be described using the following pa-rameters: E = 76000 MPa, ν = 0.33, N = 0.2, andσtension
0.2 = 225 MPa, σcompression0.2 = 234 MPa.
Figs. 13a and 13b show the numerically obtainedstress-strain curves of the composite (M124/15%vol. Al2O3) in uniaxial compression (a) and ten-sion (b), respectively. The orientation angles consid-ered here are 0◦, 5◦, 10◦, 15◦, 30◦, 45◦, 60◦ and 90◦.The experimental stress-strain curves of elastic fiber(Al2O3) and elastic-plastic matrix (Al/12% vol. Si-alloy) are also shown in these figures. Composite-strengthening increases with decreasing the fiberorientation angle from 90◦ to 0◦. From 90◦ to 30◦the increase is very small, but it becomes larger andlarger from 30◦ to 0◦. After the integration by ap-plying Eq. 7 (Sec. 4.2) for both cases of 2D and3D random orientations with weighting functionsf (θ) = 1 and f (θ) = sinθ, respectively, we obtainthe two stress-strain curves (bold continuous anddashed lines in Fig. 13) for the overall flow behaviorof these composites. For all the cases analyzed, theaveraged stress-strain curves of composites with 2Drandom as well as 3D random fiber reinforcementslie in the neighboring of the stress-strain curve ofcomposites with 30◦ and 60◦ fiber orientation, re-spectively. The fact that the stress-strain curves of

340 DAMAGE SIMULATION
(a) compression
(b) tension
Figure 13. Numerical results of (a) compressionand (b) tension flow behavior of the M124/15% vol.Al2O3 (3D random fiber orientation, fiber aspect ra-tio: 200µm/3µm) with different fiber orientations θ[6].
in-plane randomly oriented fiber reinforced compos-ites coincides with those of approximately 30◦ ori-ented fiber reinforced composites, has been also re-ported in [51].
In Figs. 14a and 14b the numerical results obtainedfor 3D random fiber orientation are compared to theexperimental data obtained by uniaxial compressionand tension tests, respectively. In the case of com-pression loading close agreement exists between ex-periments and simulation in the elastic and plasticregimes. However, at strains above 1.5% the numer-ical simulation predicts higher strain hardening thanobserved in the experiments. In the case of tensileloading, close agreement between the experimen-tal measurement and the numerical prediction is ob-tained only for the elastic regime (see Fig. 14b). Theobserved deviations between experimental and nu-merical results can be attributed to the onset of mi-
(a) compression
(b) tension
Figure 14. Effects of residual stresses on the over-all flow behavior of the M124/ 15% vol. Al2O3(3D random fiber orientation, fiber aspect ratio:200mm/3mm) and comparison with experiments.[6]
crodamage such as fracture of the brittle constituentsof the composite. Such damaging processes havebeen observed both in metallographic studies and inacoustic emission measurements (see Chapter 3.1).The different deviation in tension and compressionmay be attributed to the fact that the damaging pro-cesses mentioned above are sensitive to the directionof loading [75].
These results indicate that the Combined Cell Modelused in this study can be applied successfully tocomposites with random fiber orientation as long aseffects from micro-damage can be neglected. In or-der to predict the macroscopic stress-strain curve ofshort fiber reinforced MMCs in tension, a more ac-curate model including microscopic damage eventsmust be developed (see Sec. 4.3).
In a second step, the effects of residual stresseshave been estimated using the model. The internalstresses and strains that form during cooling from400 ◦C to room temperature were calculated foreach cell under the simplifying assumptions that thethermal expansion coefficients of the constituents as

4.1 Modeling of Damage in Fiber and Particle Reinforced Composites 341
well as the flow behavior of the matrix alloy areidentical in the whole temperature range.
Figs. 14a and 14b show, besides the comparisonwith experiments, the comparisons between com-puter predictions of the overall flow behavior ofMMC randomly reinforced with short fibers, withand without considering the initial thermal stresses.Significant influences of residual stresses on theoverall mechanical behavior of short fiber reinforcedMMCs were found: in both tension and compres-sion the effective Young’s moduli are found to belower while the yield stresses are increased. Becauseof the plastic deformation in the local area near thefiber under thermal loading, in these areas the lo-cal stress states under mechanical loading are differ-ent compared to the case without thermal loading.Under mechanical loading, further flow in some lo-cal areas directly after thermal loading reduces theoverall stress response at the small strain state. Be-cause metal-matrix hardening takes place in somelocal areas under thermal loading and the harden-ing is isotropic, the material in this area is harderthan it would be without undergoing thermal load-ing. With increasing the overall strain, i.e. whenhigher flow stresses in the local area are reached,the overall yield stresses of the composites will behigher compared to the case when thermal stressesare absent. The composite strengthening includingthermal loading naturally depends on temperaturechange ΔT, difference of thermal expansion coeffi-cients of matrix and fiber Δα and on the value of theyield stress of the matrix. The composite strength-ening with thermal loading increases with increasingvalue of ΔT, Δα and the yield stress of the matrix.
5.1.4. Results: Statistical Combined Cell Model
The SCCM model is applied to MMC materialsin static and quasi-static cyclic loading conditions.These results are presented in the following twoparagraphs.
Static loadingIn [58, 59] it has been experimentally establishedthat prior to the failure of the composite, frac-ture of brittle fibers takes place in short fiber rein-forced metal matrix composite M124-Saffil undertensile stress. Fig. 15 shows calculated stress-straincurves of the fiber composite M124-Saffil (15% vol.Al2O3-Saffil fibers) under consideration of fiber fail-ure in dependence of global strain. In Fig. 15a, theWeibull modulus m was varied from 1 to 3, and inFig. 15b, the characteristic stress σ0 of fibers, from500 MPa to infinite. It can be observed that when
(a)
(b)
�
Figure 15. Comparison of stress-strain curves, fora) different Weibull moduli m with σ0 = 1000 MPa,and b) different characteristic stresses σ0 withWeibull modulus m = 1 for metal matrix compositewith 3D random short fibers [7].
the global strains are lower than 0.15%, the differ-ence among the numerical and experimental resultsare very small, because in this area there is hardlyany damage in fibers. Close agreement of the calcu-lated stress with the experimental result is found form = 1 and σ0 = 1000 MPa. The Weibull modulusm is usually found between 3 and 8 [58]. However,the calculated stress-strain curve for m = 1 deviatesfrom the experimental results. As reported in [58],strong fiber clusters exist in the analyzed fiber com-posite M124-Saffil (15% vol. Al2O3-Saffil fibers),but are not considered in the present model. To con-sider the influence of fiber clusters on the simulationresults, a mesoscopic concept has to be establishedwhich takes into account accidental changes of fibervolume content and which allows to calculate statis-tical fiber failure in different fiber cluster areas (seeSec. 5.2).
Quasi-static cycling loadingThe presented Statistical Combined Cell Model isbased on the reduction of the effective Young’s mod-
342 DAMAGE SIMULATION
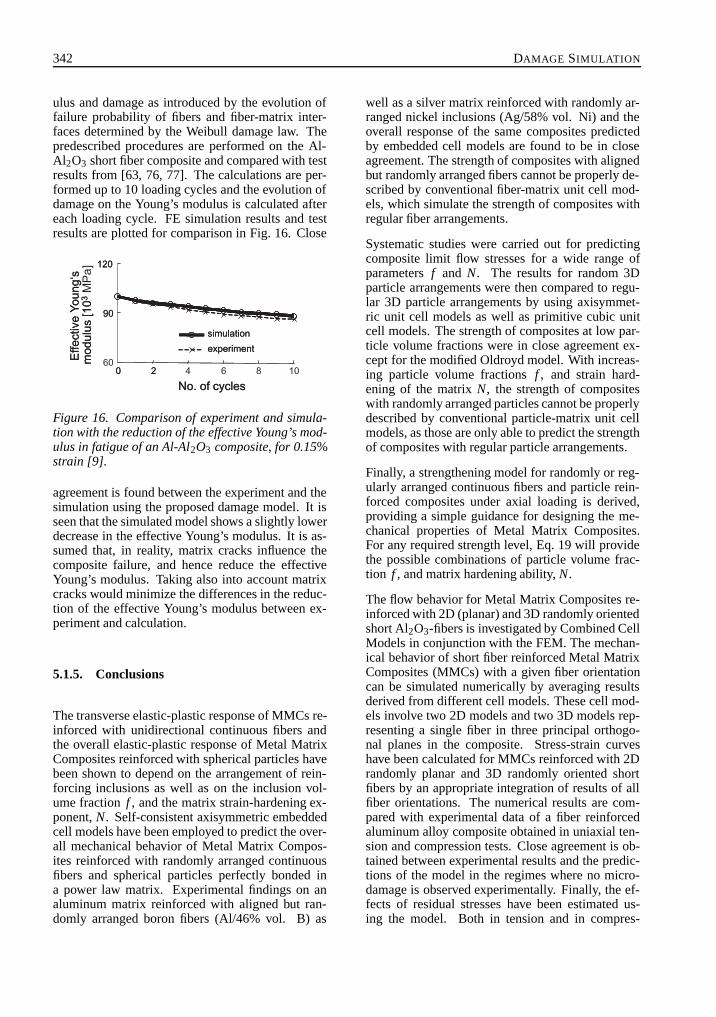
ulus and damage as introduced by the evolution offailure probability of fibers and fiber-matrix inter-faces determined by the Weibull damage law. Thepredescribed procedures are performed on the Al-Al2O3 short fiber composite and compared with testresults from [63, 76, 77]. The calculations are per-formed up to 10 loading cycles and the evolution ofdamage on the Young’s modulus is calculated aftereach loading cycle. FE simulation results and testresults are plotted for comparison in Fig. 16. Close
Figure 16. Comparison of experiment and simula-tion with the reduction of the effective Young’s mod-ulus in fatigue of an Al-Al2O3 composite, for 0.15%strain [9].
agreement is found between the experiment and thesimulation using the proposed damage model. It isseen that the simulated model shows a slightly lowerdecrease in the effective Young’s modulus. It is as-sumed that, in reality, matrix cracks influence thecomposite failure, and hence reduce the effectiveYoung’s modulus. Taking also into account matrixcracks would minimize the differences in the reduc-tion of the effective Young’s modulus between ex-periment and calculation.
5.1.5. Conclusions
The transverse elastic-plastic response of MMCs re-inforced with unidirectional continuous fibers andthe overall elastic-plastic response of Metal MatrixComposites reinforced with spherical particles havebeen shown to depend on the arrangement of rein-forcing inclusions as well as on the inclusion vol-ume fraction f , and the matrix strain-hardening ex-ponent, N. Self-consistent axisymmetric embeddedcell models have been employed to predict the over-all mechanical behavior of Metal Matrix Compos-ites reinforced with randomly arranged continuousfibers and spherical particles perfectly bonded ina power law matrix. Experimental findings on analuminum matrix reinforced with aligned but ran-domly arranged boron fibers (Al/46% vol. B) as
well as a silver matrix reinforced with randomly ar-ranged nickel inclusions (Ag/58% vol. Ni) and theoverall response of the same composites predictedby embedded cell models are found to be in closeagreement. The strength of composites with alignedbut randomly arranged fibers cannot be properly de-scribed by conventional fiber-matrix unit cell mod-els, which simulate the strength of composites withregular fiber arrangements.
Systematic studies were carried out for predictingcomposite limit flow stresses for a wide range ofparameters f and N. The results for random 3Dparticle arrangements were then compared to regu-lar 3D particle arrangements by using axisymmet-ric unit cell models as well as primitive cubic unitcell models. The strength of composites at low par-ticle volume fractions were in close agreement ex-cept for the modified Oldroyd model. With increas-ing particle volume fractions f , and strain hard-ening of the matrix N, the strength of compositeswith randomly arranged particles cannot be properlydescribed by conventional particle-matrix unit cellmodels, as those are only able to predict the strengthof composites with regular particle arrangements.
Finally, a strengthening model for randomly or reg-ularly arranged continuous fibers and particle rein-forced composites under axial loading is derived,providing a simple guidance for designing the me-chanical properties of Metal Matrix Composites.For any required strength level, Eq. 19 will providethe possible combinations of particle volume frac-tion f , and matrix hardening ability, N.
The flow behavior for Metal Matrix Composites re-inforced with 2D (planar) and 3D randomly orientedshort Al2O3-fibers is investigated by Combined CellModels in conjunction with the FEM. The mechan-ical behavior of short fiber reinforced Metal MatrixComposites (MMCs) with a given fiber orientationcan be simulated numerically by averaging resultsderived from different cell models. These cell mod-els involve two 2D models and two 3D models rep-resenting a single fiber in three principal orthogo-nal planes in the composite. Stress-strain curveshave been calculated for MMCs reinforced with 2Drandomly planar and 3D randomly oriented shortfibers by an appropriate integration of results of allfiber orientations. The numerical results are com-pared with experimental data of a fiber reinforcedaluminum alloy composite obtained in uniaxial ten-sion and compression tests. Close agreement is ob-tained between experimental results and the predic-tions of the model in the regimes where no micro-damage is observed experimentally. Finally, the ef-fects of residual stresses have been estimated us-ing the model. Both in tension and in compres-
4.1 Modeling of Damage in Fiber and Particle Reinforced Composites 343
sion Young’s modulus is found to be lower whilethe yield stresses are increased compared to the casewhen residual stresses are absent.
Applying the Statistical Combined Cell Model,which includes damage effects in form of a statis-tical Weibull approach, also the quasi-static cyclicbehavior of the MMC composite could be investi-gated.
5.2. Polymer Matrix Composites (PMCs)
5.2.1. Material
PMCs are frequently reinforced with strong contin-uous or short fibers (Chapter 2.1.3). In the case ofshort fiber reinforced PMCs, a specific orientationdistribution is observed. Their mechanical proper-ties are highly dependent on their structure. Thecomplexity of such affecting parameters impedes acomplete theoretical description of the behavior andthe failure properties of these composites. In this re-spect, a micromechanical analysis of the local fail-ure process opens a possibility to predict the macro-scopic failure property of composites [1–3].
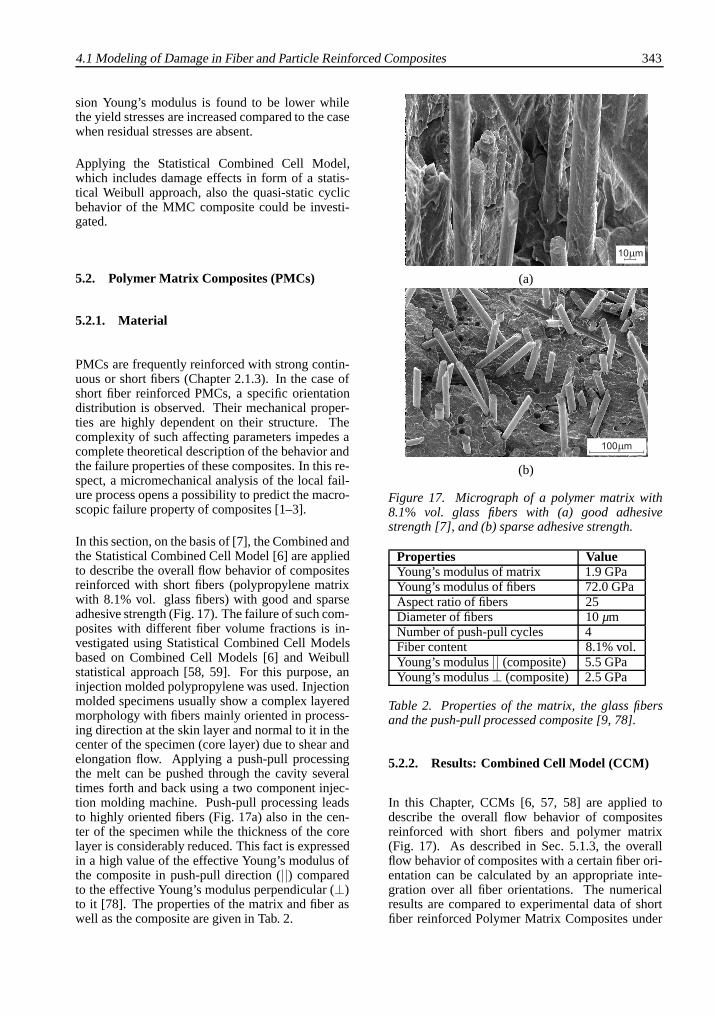
In this section, on the basis of [7], the Combined andthe Statistical Combined Cell Model [6] are appliedto describe the overall flow behavior of compositesreinforced with short fibers (polypropylene matrixwith 8.1% vol. glass fibers) with good and sparseadhesive strength (Fig. 17). The failure of such com-posites with different fiber volume fractions is in-vestigated using Statistical Combined Cell Modelsbased on Combined Cell Models [6] and Weibullstatistical approach [58, 59]. For this purpose, aninjection molded polypropylene was used. Injectionmolded specimens usually show a complex layeredmorphology with fibers mainly oriented in process-ing direction at the skin layer and normal to it in thecenter of the specimen (core layer) due to shear andelongation flow. Applying a push-pull processingthe melt can be pushed through the cavity severaltimes forth and back using a two component injec-tion molding machine. Push-pull processing leadsto highly oriented fibers (Fig. 17a) also in the cen-ter of the specimen while the thickness of the corelayer is considerably reduced. This fact is expressedin a high value of the effective Young’s modulus ofthe composite in push-pull direction (||) comparedto the effective Young’s modulus perpendicular (⊥)to it [78]. The properties of the matrix and fiber aswell as the composite are given in Tab. 2.
(a)
(b)
Figure 17. Micrograph of a polymer matrix with8.1% vol. glass fibers with (a) good adhesivestrength [7], and (b) sparse adhesive strength.
Properties ValueYoung’s modulus of matrix 1.9 GPaYoung’s modulus of fibers 72.0 GPaAspect ratio of fibers 25Diameter of fibers 10 µmNumber of push-pull cycles 4Fiber content 8.1% vol.Young’s modulus || (composite) 5.5 GPaYoung’s modulus ⊥ (composite) 2.5 GPa
Table 2. Properties of the matrix, the glass fibersand the push-pull processed composite [9, 78].
5.2.2. Results: Combined Cell Model (CCM)
In this Chapter, CCMs [6, 57, 58] are applied todescribe the overall flow behavior of compositesreinforced with short fibers and polymer matrix(Fig. 17). As described in Sec. 5.1.3, the overallflow behavior of composites with a certain fiber ori-entation can be calculated by an appropriate inte-gration over all fiber orientations. The numericalresults are compared to experimental data of shortfiber reinforced Polymer Matrix Composites under

344 DAMAGE SIMULATION
tension. Close agreement has been obtained at smallstrains between experiments and numerical predic-tions by using these models. The larger the strain,the stronger the deviation between experiments andnumerical predictions (Fig. 18). In order to predict
Figure 18. Comparison of experiments and FE pre-dictions for polypropylene matrix composite withplanar random short fibers [7].
the flow behavior of short fiber reinforced compos-ites in tension to a higher accuracy, fiber crackingand fiber-matrix debonding can be taken into ac-count [58], which is done in Sec. 5.2.3.
Consideration of complex fiber orientationsThe injection molding process leads to a complexarrangement of the fibers in the cavity due to shearflow and elongational flow. The different orienta-tions of the fibers result in anisotropy of the com-ponent properties. Using inserts to fabricate platescontaining a hole, leads to the splitting of the meltfront and finally to the formation of a weldline as aresult of the joining of the two melt fronts (Fig. 19).Weldlines are known to be mechanically weak re-gions of the component (compare Chapter 2.1.3). In
Figure 19. Successive patterns of filltime of the melt(polyamide 6 reinforced with 30 weight-% glass-fibers - PA6GF30) at different stages of the process:0.25 s, 0.96 s, 1.02 s and 1.17 s (end of filling).
this region, the fiber orientations show great varia-tions (Fig. 20). The fiber orientation distribution de-
Figure 20. Averaged fiber orientation over thicknessof a PA6GF30-specimen (simulation).
termined via microwave anisotropy measurements(details of the method can be found in Chapter 1.2.3)has been measured in the region near the hole withina measurement field of 60 x 45 mm2 and a raster of1,25 x 1,25 mm2. The experimental results are dis-
Figure 21. Experimental microwave orientation of aPA6GF30-specimen (see Chapter 2.1.3).
played in Fig. 21 and compared to the simulation re-sult in Fig. 20. Horizontal orientation in the left partof the microwave orientation image, the flow aroundthe hole and the coalescence to the weldline witha horizontal orientation of the fibers can be identi-fied. Since the measurement field is larger than theraster distance, artefacts appear near the free edges(here: hole). The comparison of the simulated fiberorientation (Fig. 20) with experimental results ofmicrowave anisotropy investigations shows a goodcorrelation (Fig. 21). The fiber orientation wassimulated for several layers (Fig. 22) in each ele-ment with the use of an injection molding simula-tion software (Moldflow Plastic Insight). The linear-elastic results were transferred (Fig. 23) to a strengthanalysis FE code (ABAQUS). The simulation pro-cedure is shown in Fig. 23. As a result, the effectof fiber orientations on the local mechanical behav-ior as well as the macroscopic properties of a modelplate containing a hole and a weldline were investi-gated by applying the CCM and compared to the re-sults of the Tandon-Weng model [79]. Fig. 24 showsthe result of the linear-elastic simulation. According
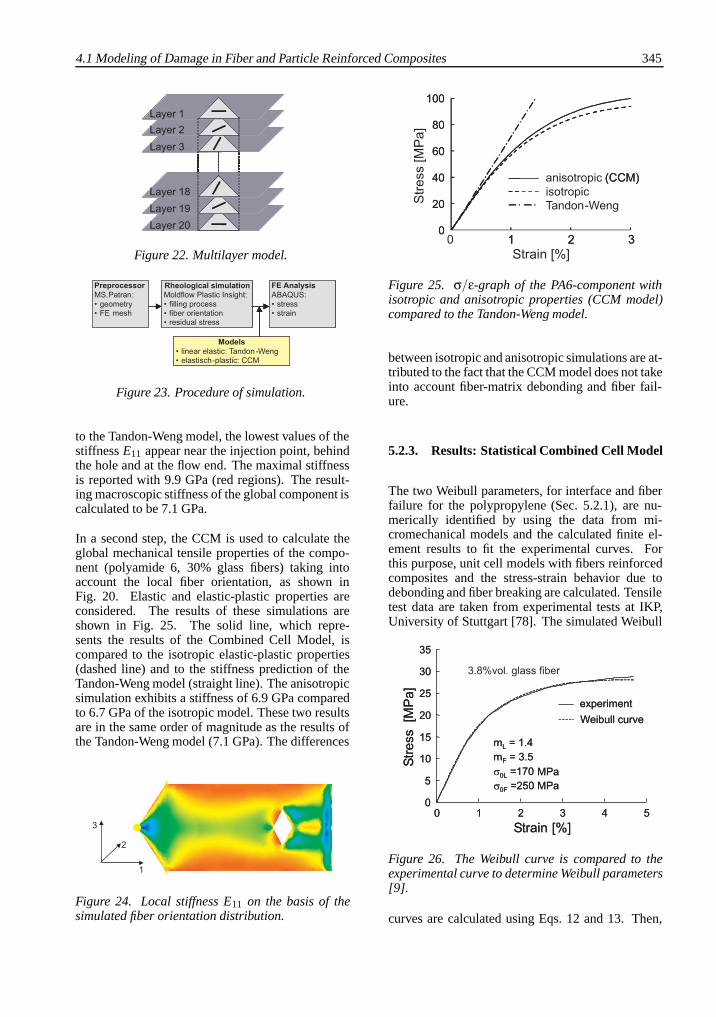
4.1 Modeling of Damage in Fiber and Particle Reinforced Composites 345
Figure 22. Multilayer model.
Figure 23. Procedure of simulation.
to the Tandon-Weng model, the lowest values of thestiffness E11 appear near the injection point, behindthe hole and at the flow end. The maximal stiffnessis reported with 9.9 GPa (red regions). The result-ing macroscopic stiffness of the global component iscalculated to be 7.1 GPa.
In a second step, the CCM is used to calculate theglobal mechanical tensile properties of the compo-nent (polyamide 6, 30% glass fibers) taking intoaccount the local fiber orientation, as shown inFig. 20. Elastic and elastic-plastic properties areconsidered. The results of these simulations areshown in Fig. 25. The solid line, which repre-sents the results of the Combined Cell Model, iscompared to the isotropic elastic-plastic properties(dashed line) and to the stiffness prediction of theTandon-Weng model (straight line). The anisotropicsimulation exhibits a stiffness of 6.9 GPa comparedto 6.7 GPa of the isotropic model. These two resultsare in the same order of magnitude as the results ofthe Tandon-Weng model (7.1 GPa). The differences
Figure 24. Local stiffness E11 on the basis of thesimulated fiber orientation distribution.
Figure 25. σ/ε-graph of the PA6-component withisotropic and anisotropic properties (CCM model)compared to the Tandon-Weng model.
between isotropic and anisotropic simulations are at-tributed to the fact that the CCM model does not takeinto account fiber-matrix debonding and fiber fail-ure.
5.2.3. Results: Statistical Combined Cell Model
The two Weibull parameters, for interface and fiberfailure for the polypropylene (Sec. 5.2.1), are nu-merically identified by using the data from mi-cromechanical models and the calculated finite el-ement results to fit the experimental curves. Forthis purpose, unit cell models with fibers reinforcedcomposites and the stress-strain behavior due todebonding and fiber breaking are calculated. Tensiletest data are taken from experimental tests at IKP,University of Stuttgart [78]. The simulated Weibull
Figure 26. The Weibull curve is compared to theexperimental curve to determine Weibull parameters[9].
curves are calculated using Eqs. 12 and 13. Then,
346 DAMAGE SIMULATION
the values of m and σ are determined. In this exam-ple the Weibull parameters for interface failure aremL = 1.4 and σ0L = 170 MPa and the Weibull pa-rameters for fiber failure are determined as mF = 3.5and σ0F = 250 MPa (Fig. 26).
Consideration of fiber fracturesIn [58, 59] it has been experimentally establishedthat prior to the failure of the composite, fractureof brittle fibers takes place in short fiber reinforcedPMCs with glass fibers under tensile stress. Figs. 27and 28 show the stress-strain curves using the Statis-tical Combined Cell Model. In Fig. 27 the Weibullmodulus m was varied from 8 to infinite for σ0 =450 MPa and in Fig. 28 the characteristic stress σ0of fibers was varied from 500 MPa to infinite form = 12 (8.1% vol. fibers). It was found that anincrease in fiber volume fraction from 8.1% vol. to13.1% vol. results in an increase of the stress-straincurve [7]. With decreasing Weibull modulus and de-creasing characteristic stress σ0 of fibers, the stress-strain curve of the composite decreases. The curvefor m = ∞ (Fig. 27) and σ0 = ∞ shows that there ishardly any damage in the fibers. The same result canbe obtained by applying the CCM (Fig. 18). The de-viation between numerical and experimental resultswith the SCCM is smaller than with the CCM. Close
Figure 27. Comparison of stress-strain curves fordifferent Weibull modules m and σ0 = 450 MPa forpolymer matrix composite (8.1% vol. fibers) withplanar random short fibers [7].
agreement is found when m = 12 and σ0 = 450 MPafor the polymer matrix composite with 8.1% vol.short glass fibers. The probabilities of fiber frac-ture for PMCs depending on total strain are shown inFig. 29. The characteristic stress σ0 of the fibers wasvaried from 400 MPa to 500 MPa. It can be seen thatthe fracture probability of the fibers increases withdecreasing characteristic stress σ0. The zero areaof the fracture probability of fibers is extended withincreasing characteristic stress σ0. This means that
Figure 28. Comparison of stress-strain diagramsfor different characteristic stresses σ0 with a differ-ent Weibull modulus m = 12 (8.1% vol. fibers) forpolymer matrix composite with planar random shortfibers [7].
Figure 29. Fracture probabilities for different char-acteristic stresses σ0 for polymer matrix compositewith planar random short fibers (8.1% vol.) [7].
the stronger the fiber in the composite, the smallerthe probability for the fiber to break.
Consideration of the adhesion effect betweenfibers and matrixThe Weibull moduli and the characteristic stresses(Eq. 8) are varied and the results are depicted inFig. 30. Here, it can be recognized that at differentcharacteristic stresses and at different Weibull mod-uli the global stress at strains under 0.5% followsthe experimental curve. Increasing Weibull modu-lus (Fig. 30a) and characteristic stresses (Fig. 30b),the global stress increases. Through a compari-son between the simulation and the experiment, theWeibull modulus and the characteristic stress werederived as mG = 5 and σG
0 = 450 MPa.
Consideration of fiber fractures and fiber-matrixdebonding

4.1 Modeling of Damage in Fiber and Particle Reinforced Composites 347
(a)
(b)
Figure 30. Comparison of the stress-strain curveswith the experimental results: a) with differentWeibull moduli at σG
0 = 450 MPa, and b) with differ-ent characteristic stresses σG
0 and a Weibull modulusof mG = 5.
The parameters of Weibull’s law for short fiber re-inforced thermoplastics with different fiber volumefractions, gathered from the simulation, are recapit-ulated in Tab. 3. Through the insertion of the param-eters of Weibull’s law in Eq. 14, and in Eqs. 4, 5and 7, the stress-strain curve of short fiber rein-forced thermoplastics with sparse fiber-matrix adhe-sion can be described. The calculated stress-strain
Parameters 8.1% vol.σG
0 (MPa) 450mF 12
σG0 (MPa) 450
mG 5
Table 3. Parameters of Weibull’s law for fiber rein-forced PMCs.
curve of the PMCs with different fiber-matrix ad-hesion and consideration of the fiber fractions and
fiber-matrix debonding are compared to the experi-mental results in Fig. 31. The simulation reproduces
Figure 31. Comparison of the calculated stress-strain curves of fiber reinforced composites (8.1%vol. fibers) with good or sparse fiber-matrix ad-hesion with the experimental results under tensileloading.
well the curves obtained experimentally when theglobal strain is smaller than 1.5%. At strains largerthan 1.5%, the simulation results deviate from theexperimental ones. This deviation permits to guessthat crack propagation in this area plays an impor-tant role.
Cyclic simulationsA simple mesoscopic model of randomly distributed8.1% vol. fiber reinforced polypropylene matrixcomposite with 3D continuum cubic elements issimulated. Each element of the model is character-ized by the properties of unit cells of different fibervolume fractions. In this model fibers are assumedto be scattered randomly throughout the compositeand to be aligned parallel to the loading direction(Fig. 17a). A Gaussian distribution is used to de-scribe the random distribution of fibers in the com-posite. In conjunction with the available test data,the hypothesis is made that the fiber volume frac-tions vary between 1.8%, 3.8%, 8.1% and 13.1%throughout the whole composite (Figs. 32, 33). Inorder to introduce different damage conditions in theabove composite, different loading conditions withdifferent fiber volume fractions are studied and dam-age behaviors are introduced into each element ofthe mesoscopic model. In strain-controlled simu-lations strain is kept constant at 3%. Following thealgorithm and the described methodology of the Sta-tistical Combined Cell Model for the cyclic simu-lations, the cyclic loading process is continued fortwo heterogeneous mesoscopic models of differentfiber arrangements (model 1 and model 2). It is
348 DAMAGE SIMULATION
Figure 32. Random distribution of fiber volume frac-tions in a mesoscopic composite model [9].
Figure 33. Gaussian distribution of fiber volumefractions of the elements of a mesomodel [9].
seen from the stress-strain curve that after 8-9 cy-cles, stabilized cycles are found in the case of 3%strain (Fig. 34). Results correspond to the predic-tion of material behavior of the polypropylene ma-trix composite under cyclic loading including dam-age effects and plasticity. As Fig. 34 shows, model2 has a stronger damage effect than model 1. Inthe elastic region there is no significant change ofmaterial property for either model. However, in theplastic region only model 2 shows decreased elasto-plastic behavior in comparison with the model 1 dueto significant damage in the composite. Since theevolution of damage depends on the heterogeneousarrangements of fibers, model 1 shows higher stiff-ness than model 2 and good fatigue behavior undercyclic loading.
Influence of damage on the effective Young’smodulusThe effect of damage due to debonding and fiberfailure can be seen in the reduction of total stiff-ness. The effective Young’s modulus is reduced con-siderably due to damage after each cycle (Fig. 35).Mechanisms of fatigue damage in composites re-sult in cracks of various orientation, size and ge-ometry as described above. These cracks are orig-
%
Figure 34. a) Two different heterogeneous models,and b) cyclic stress-strain behavior of PMC underdamage for 8.1% vol. Polypropylene/glass fiber [9].
Figure 35. Effect of damage (fiber failure and fiber-matrix debonding) under cyclic loading on the re-duction of the effective Young’s modulus withoutconsideration of the overall failure [9].
inated from different microscopic damage mecha-nisms, which leads to the degradation of the overallmaterial properties, including stiffness and strengthin various directions.
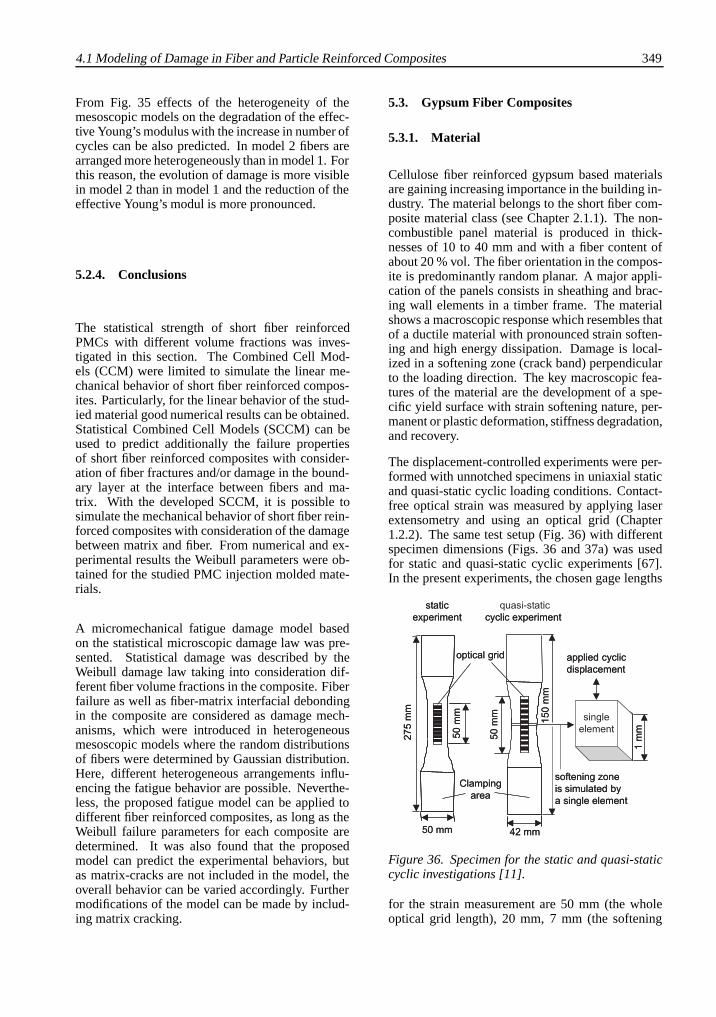
4.1 Modeling of Damage in Fiber and Particle Reinforced Composites 349
From Fig. 35 effects of the heterogeneity of themesoscopic models on the degradation of the effec-tive Young’s modulus with the increase in number ofcycles can be also predicted. In model 2 fibers arearranged more heterogeneously than in model 1. Forthis reason, the evolution of damage is more visiblein model 2 than in model 1 and the reduction of theeffective Young’s modul is more pronounced.
5.2.4. Conclusions
The statistical strength of short fiber reinforcedPMCs with different volume fractions was inves-tigated in this section. The Combined Cell Mod-els (CCM) were limited to simulate the linear me-chanical behavior of short fiber reinforced compos-ites. Particularly, for the linear behavior of the stud-ied material good numerical results can be obtained.Statistical Combined Cell Models (SCCM) can beused to predict additionally the failure propertiesof short fiber reinforced composites with consider-ation of fiber fractures and/or damage in the bound-ary layer at the interface between fibers and ma-trix. With the developed SCCM, it is possible tosimulate the mechanical behavior of short fiber rein-forced composites with consideration of the damagebetween matrix and fiber. From numerical and ex-perimental results the Weibull parameters were ob-tained for the studied PMC injection molded mate-rials.
A micromechanical fatigue damage model basedon the statistical microscopic damage law was pre-sented. Statistical damage was described by theWeibull damage law taking into consideration dif-ferent fiber volume fractions in the composite. Fiberfailure as well as fiber-matrix interfacial debondingin the composite are considered as damage mech-anisms, which were introduced in heterogeneousmesoscopic models where the random distributionsof fibers were determined by Gaussian distribution.Here, different heterogeneous arrangements influ-encing the fatigue behavior are possible. Neverthe-less, the proposed fatigue model can be applied todifferent fiber reinforced composites, as long as theWeibull failure parameters for each composite aredetermined. It was also found that the proposedmodel can predict the experimental behaviors, butas matrix-cracks are not included in the model, theoverall behavior can be varied accordingly. Furthermodifications of the model can be made by includ-ing matrix cracking.
5.3. Gypsum Fiber Composites
5.3.1. Material
Cellulose fiber reinforced gypsum based materialsare gaining increasing importance in the building in-dustry. The material belongs to the short fiber com-posite material class (see Chapter 2.1.1). The non-combustible panel material is produced in thick-nesses of 10 to 40 mm and with a fiber content ofabout 20 % vol. The fiber orientation in the compos-ite is predominantly random planar. A major appli-cation of the panels consists in sheathing and brac-ing wall elements in a timber frame. The materialshows a macroscopic response which resembles thatof a ductile material with pronounced strain soften-ing and high energy dissipation. Damage is local-ized in a softening zone (crack band) perpendicularto the loading direction. The key macroscopic fea-tures of the material are the development of a spe-cific yield surface with strain softening nature, per-manent or plastic deformation, stiffness degradation,and recovery.
The displacement-controlled experiments were per-formed with unnotched specimens in uniaxial staticand quasi-static cyclic loading conditions. Contact-free optical strain was measured by applying laserextensometry and using an optical grid (Chapter1.2.2). The same test setup (Fig. 36) with differentspecimen dimensions (Figs. 36 and 37a) was usedfor static and quasi-static cyclic experiments [67].In the present experiments, the chosen gage lengths
Figure 36. Specimen for the static and quasi-staticcyclic investigations [11].
for the strain measurement are 50 mm (the wholeoptical grid length), 20 mm, 7 mm (the softening

350 DAMAGE SIMULATION
zone itself) and 2 mm (the minimum gage length).The static experiments were monotonic uniaxial ten-
Figure 37. Load scheme for (a) the tension thresholdtest, and (b) for the tension-compression test [11].
sion tests with a displacement rate of 0.2 mm/min.The quasi-static cyclic tests were performed withtwo different load schemes. In the first experiment,called tension threshold test (Fig. 37a), the applieddisplacement was varied between zero and a cer-tain positive value. In the second experiment, calledalternating tension compression test (Fig. 37b), theapplied displacement was varied between the samemagnitude of positive and negative within the indi-vidual displacement levels.
The displacement amplitudes of the quasi-staticcyclic tests were determined as multiples of the ulti-mate force (Fu) which was investigated in the staticexperiments. The yield point was evaluated withthe 0.1 0.4 0.9 Fu method [80]. In both quasi-static cyclic experiments the applied displacementlevels were 0.025, 0.050, 0.075, 0.100, 0.125, 0.150,0.175, 0.200 and 0.250 mm. The displacement lev-els comprised three cycles each, except for the firsttwo, which levels comprised one cycle each.
5.3.2. Results: Plastic-Damage Model
For a successful use of this material in building in-dustry, a fundamental understanding and numerical
investigations of the material behavior are neces-sary. The main focus of this section is the model-ing of this specific material behavior based on av-eraged material properties obtained from uniaxialloading experiments. Simulations are carried out forstatic and quasi-static cyclic loading conditions asexpected in regular and earthquake situations. Thedetermination process of material parameters fromthe experiments is also discussed. The modeling ofthe material behavior has been performed with thefinite element software ABAQUS [68]. The sim-ulation of the material behavior under static load-ing has been successfully carried out using the ’im-plemented model’. The simulation of the hystere-sis loops occurring under quasi-static cyclic loadinghas been achieved with modifications of the imple-mented model concerning the varying elastic stiff-ness degradation and recovery inside the elastic do-main.
Static loading conditionsIn this section, the original plastic-damage model,which is available in ABAQUS, is used. The elastic-ity parameters Young’s modulus E = 3870 MPa andPoisson’s Ratio ν = 0.19 have been used as obtainedfrom the static experiments. For plasticity and dam-age, strain softening and damage evolution curvesare required. Apart from these parameters, a furthermaterial constant called dilation angle ψ is neces-sary. In the following, the determination process ofthe above mentioned curves and the dilation angle ψare discussed.
The strain softening curve is basically given as yieldstress vs. inelastic strain relation. In order to avoidmesh sensitivity effects, this curve is further con-verted to a yield stress vs. displacement relation (ac-cording to [68]). The inelastic strain is identifiedby subtracting the elastic strain from total strain, asgiven in Eq. 21:
εin = ε− εel ⇒ εin = ε− σE
. (21)
Therefore, using Eq. 21, the inelastic strain ε in canbe computed from the experimental stress straincurve. The stress-strain curve in the softeningzone of the specimen is used for this purpose.Furthermore, the inelastic strain εin is converted todisplacement by multiplying with the length of thesoftening zone. In this way, the yield stress vs. dis-placement relation shown in Fig. 38a is determined.
The evolution of damage has been assumed as it ap-pears in quasi-brittle materials such as concrete. Thedamage evolution curve is given as damage vs. dis-placement relation (Fig. 38b). From this curve pro-nounced damage increase is found at the beginning,
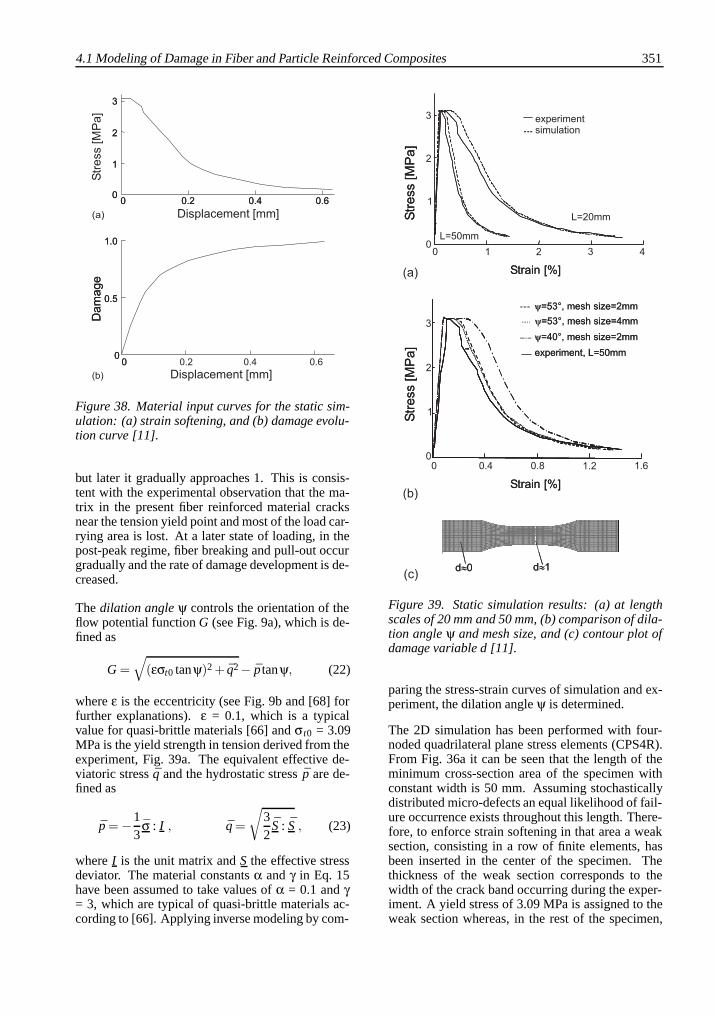
4.1 Modeling of Damage in Fiber and Particle Reinforced Composites 351
Figure 38. Material input curves for the static sim-ulation: (a) strain softening, and (b) damage evolu-tion curve [11].
but later it gradually approaches 1. This is consis-tent with the experimental observation that the ma-trix in the present fiber reinforced material cracksnear the tension yield point and most of the load car-rying area is lost. At a later state of loading, in thepost-peak regime, fiber breaking and pull-out occurgradually and the rate of damage development is de-creased.
The dilation angle ψ controls the orientation of theflow potential function G (see Fig. 9a), which is de-fined as
G =√
(εσt0 tanψ)2 + q2− p tanψ, (22)
where ε is the eccentricity (see Fig. 9b and [68] forfurther explanations). ε = 0.1, which is a typicalvalue for quasi-brittle materials [66] and σ t0 = 3.09MPa is the yield strength in tension derived from theexperiment, Fig. 39a. The equivalent effective de-viatoric stress q and the hydrostatic stress p are de-fined as
p = −13
σ : I , q =
√32
S : S , (23)
where I is the unit matrix and S the effective stressdeviator. The material constants α and γ in Eq. 15have been assumed to take values of α = 0.1 and γ= 3, which are typical of quasi-brittle materials ac-cording to [66]. Applying inverse modeling by com-
0 1 2 3 40
1
2
3 experimentsimulation
L=20mm
L=50mm
0
1
2
3
0 0.4 0.8 1.2 1.6
Figure 39. Static simulation results: (a) at lengthscales of 20 mm and 50 mm, (b) comparison of dila-tion angle ψ and mesh size, and (c) contour plot ofdamage variable d [11].
paring the stress-strain curves of simulation and ex-periment, the dilation angle ψ is determined.
The 2D simulation has been performed with four-noded quadrilateral plane stress elements (CPS4R).From Fig. 36a it can be seen that the length of theminimum cross-section area of the specimen withconstant width is 50 mm. Assuming stochasticallydistributed micro-defects an equal likelihood of fail-ure occurrence exists throughout this length. There-fore, to enforce strain softening in that area a weaksection, consisting in a row of finite elements, hasbeen inserted in the center of the specimen. Thethickness of the weak section corresponds to thewidth of the crack band occurring during the exper-iment. A yield stress of 3.09 MPa is assigned to theweak section whereas, in the rest of the specimen,
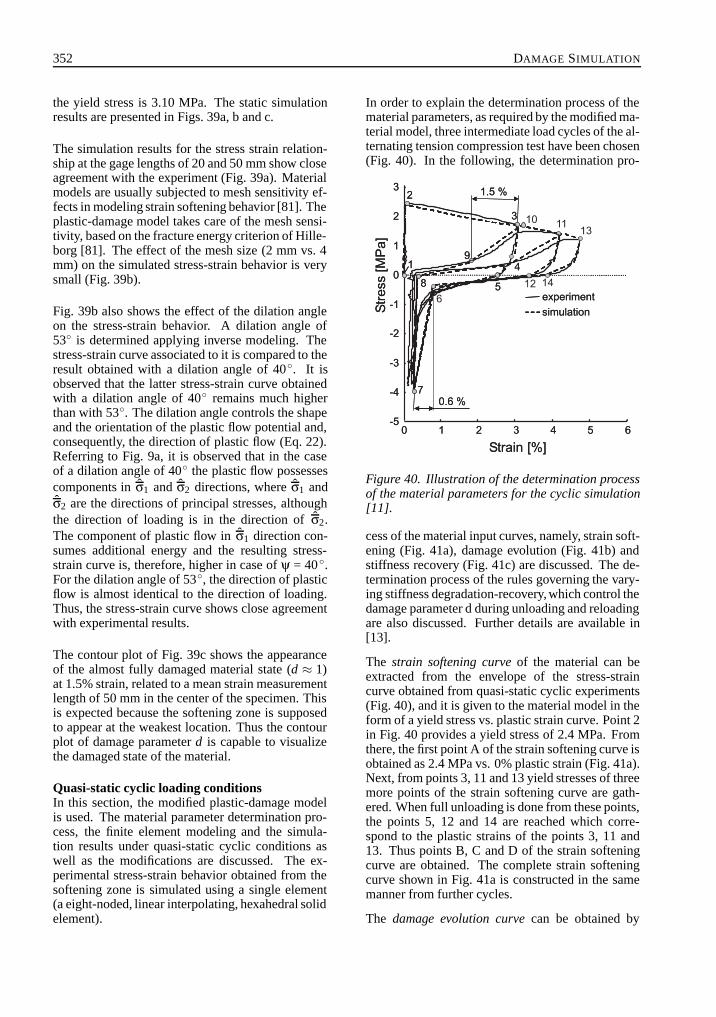
352 DAMAGE SIMULATION
the yield stress is 3.10 MPa. The static simulationresults are presented in Figs. 39a, b and c.
The simulation results for the stress strain relation-ship at the gage lengths of 20 and 50 mm show closeagreement with the experiment (Fig. 39a). Materialmodels are usually subjected to mesh sensitivity ef-fects in modeling strain softening behavior [81]. Theplastic-damage model takes care of the mesh sensi-tivity, based on the fracture energy criterion of Hille-borg [81]. The effect of the mesh size (2 mm vs. 4mm) on the simulated stress-strain behavior is verysmall (Fig. 39b).
Fig. 39b also shows the effect of the dilation angleon the stress-strain behavior. A dilation angle of53◦ is determined applying inverse modeling. Thestress-strain curve associated to it is compared to theresult obtained with a dilation angle of 40◦. It isobserved that the latter stress-strain curve obtainedwith a dilation angle of 40◦ remains much higherthan with 53◦. The dilation angle controls the shapeand the orientation of the plastic flow potential and,consequently, the direction of plastic flow (Eq. 22).Referring to Fig. 9a, it is observed that in the caseof a dilation angle of 40◦ the plastic flow possessescomponents in σ1 and σ2 directions, where σ1 andσ2 are the directions of principal stresses, althoughthe direction of loading is in the direction of σ2.The component of plastic flow in σ1 direction con-sumes additional energy and the resulting stress-strain curve is, therefore, higher in case of ψ = 40◦.For the dilation angle of 53◦, the direction of plasticflow is almost identical to the direction of loading.Thus, the stress-strain curve shows close agreementwith experimental results.
The contour plot of Fig. 39c shows the appearanceof the almost fully damaged material state (d ≈ 1)at 1.5% strain, related to a mean strain measurementlength of 50 mm in the center of the specimen. Thisis expected because the softening zone is supposedto appear at the weakest location. Thus the contourplot of damage parameter d is capable to visualizethe damaged state of the material.
Quasi-static cyclic loading conditionsIn this section, the modified plastic-damage modelis used. The material parameter determination pro-cess, the finite element modeling and the simula-tion results under quasi-static cyclic conditions aswell as the modifications are discussed. The ex-perimental stress-strain behavior obtained from thesoftening zone is simulated using a single element(a eight-noded, linear interpolating, hexahedral solidelement).
In order to explain the determination process of thematerial parameters, as required by the modified ma-terial model, three intermediate load cycles of the al-ternating tension compression test have been chosen(Fig. 40). In the following, the determination pro-
Figure 40. Illustration of the determination processof the material parameters for the cyclic simulation[11].
cess of the material input curves, namely, strain soft-ening (Fig. 41a), damage evolution (Fig. 41b) andstiffness recovery (Fig. 41c) are discussed. The de-termination process of the rules governing the vary-ing stiffness degradation-recovery,which control thedamage parameter d during unloading and reloadingare also discussed. Further details are available in[13].
The strain softening curve of the material can beextracted from the envelope of the stress-straincurve obtained from quasi-static cyclic experiments(Fig. 40), and it is given to the material model in theform of a yield stress vs. plastic strain curve. Point 2in Fig. 40 provides a yield stress of 2.4 MPa. Fromthere, the first point A of the strain softening curve isobtained as 2.4 MPa vs. 0% plastic strain (Fig. 41a).Next, from points 3, 11 and 13 yield stresses of threemore points of the strain softening curve are gath-ered. When full unloading is done from these points,the points 5, 12 and 14 are reached which corre-spond to the plastic strains of the points 3, 11 and13. Thus points B, C and D of the strain softeningcurve are obtained. The complete strain softeningcurve shown in Fig. 41a is constructed in the samemanner from further cycles.
The damage evolution curve can be obtained by
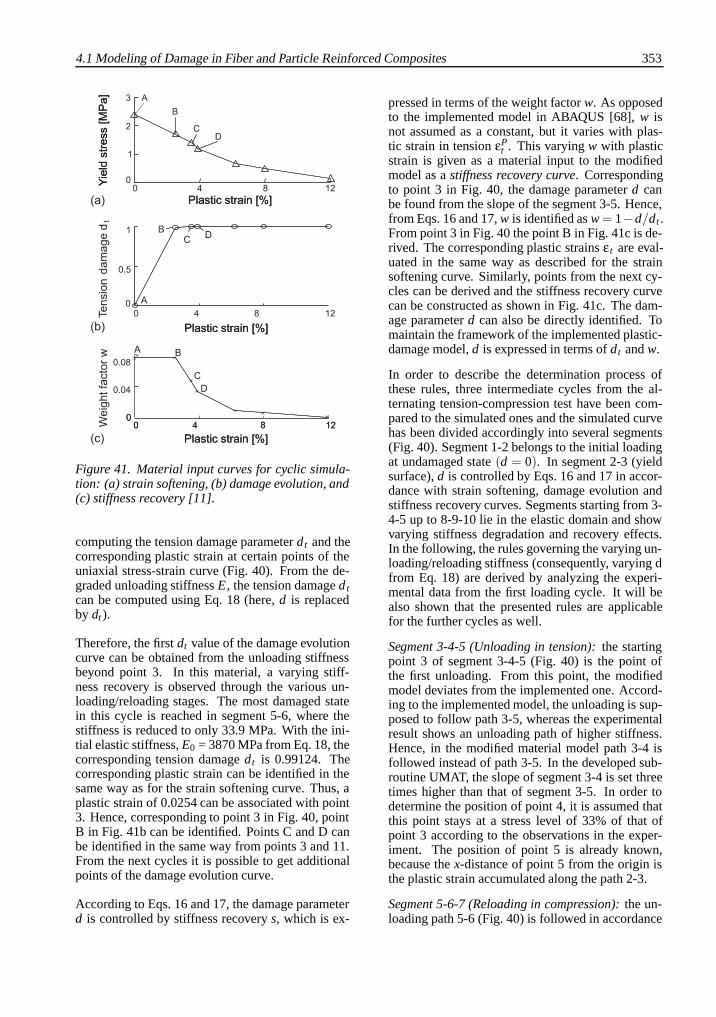
4.1 Modeling of Damage in Fiber and Particle Reinforced Composites 353
Figure 41. Material input curves for cyclic simula-tion: (a) strain softening, (b) damage evolution, and(c) stiffness recovery [11].
computing the tension damage parameter dt and thecorresponding plastic strain at certain points of theuniaxial stress-strain curve (Fig. 40). From the de-graded unloading stiffness E, the tension damage dtcan be computed using Eq. 18 (here, d is replacedby dt ).
Therefore, the first dt value of the damage evolutioncurve can be obtained from the unloading stiffnessbeyond point 3. In this material, a varying stiff-ness recovery is observed through the various un-loading/reloading stages. The most damaged statein this cycle is reached in segment 5-6, where thestiffness is reduced to only 33.9 MPa. With the ini-tial elastic stiffness, E0 = 3870 MPa from Eq. 18, thecorresponding tension damage dt is 0.99124. Thecorresponding plastic strain can be identified in thesame way as for the strain softening curve. Thus, aplastic strain of 0.0254 can be associated with point3. Hence, corresponding to point 3 in Fig. 40, pointB in Fig. 41b can be identified. Points C and D canbe identified in the same way from points 3 and 11.From the next cycles it is possible to get additionalpoints of the damage evolution curve.
According to Eqs. 16 and 17, the damage parameterd is controlled by stiffness recovery s, which is ex-
pressed in terms of the weight factor w. As opposedto the implemented model in ABAQUS [68], w isnot assumed as a constant, but it varies with plas-tic strain in tension εP
t . This varying w with plasticstrain is given as a material input to the modifiedmodel as a stiffness recovery curve. Correspondingto point 3 in Fig. 40, the damage parameter d canbe found from the slope of the segment 3-5. Hence,from Eqs. 16 and 17, w is identified as w = 1−d/dt .From point 3 in Fig. 40 the point B in Fig. 41c is de-rived. The corresponding plastic strains εt are eval-uated in the same way as described for the strainsoftening curve. Similarly, points from the next cy-cles can be derived and the stiffness recovery curvecan be constructed as shown in Fig. 41c. The dam-age parameter d can also be directly identified. Tomaintain the framework of the implemented plastic-damage model, d is expressed in terms of dt and w.
In order to describe the determination process ofthese rules, three intermediate cycles from the al-ternating tension-compression test have been com-pared to the simulated ones and the simulated curvehas been divided accordingly into several segments(Fig. 40). Segment 1-2 belongs to the initial loadingat undamaged state (d = 0). In segment 2-3 (yieldsurface), d is controlled by Eqs. 16 and 17 in accor-dance with strain softening, damage evolution andstiffness recovery curves. Segments starting from 3-4-5 up to 8-9-10 lie in the elastic domain and showvarying stiffness degradation and recovery effects.In the following, the rules governing the varying un-loading/reloading stiffness (consequently, varying dfrom Eq. 18) are derived by analyzing the experi-mental data from the first loading cycle. It will bealso shown that the presented rules are applicablefor the further cycles as well.
Segment 3-4-5 (Unloading in tension): the startingpoint 3 of segment 3-4-5 (Fig. 40) is the point ofthe first unloading. From this point, the modifiedmodel deviates from the implemented one. Accord-ing to the implemented model, the unloading is sup-posed to follow path 3-5, whereas the experimentalresult shows an unloading path of higher stiffness.Hence, in the modified material model path 3-4 isfollowed instead of path 3-5. In the developed sub-routine UMAT, the slope of segment 3-4 is set threetimes higher than that of segment 3-5. In order todetermine the position of point 4, it is assumed thatthis point stays at a stress level of 33% of that ofpoint 3 according to the observations in the exper-iment. The position of point 5 is already known,because the x-distance of point 5 from the origin isthe plastic strain accumulated along the path 2-3.
Segment 5-6-7 (Reloading in compression): the un-loading path 5-6 (Fig. 40) is followed in accordance
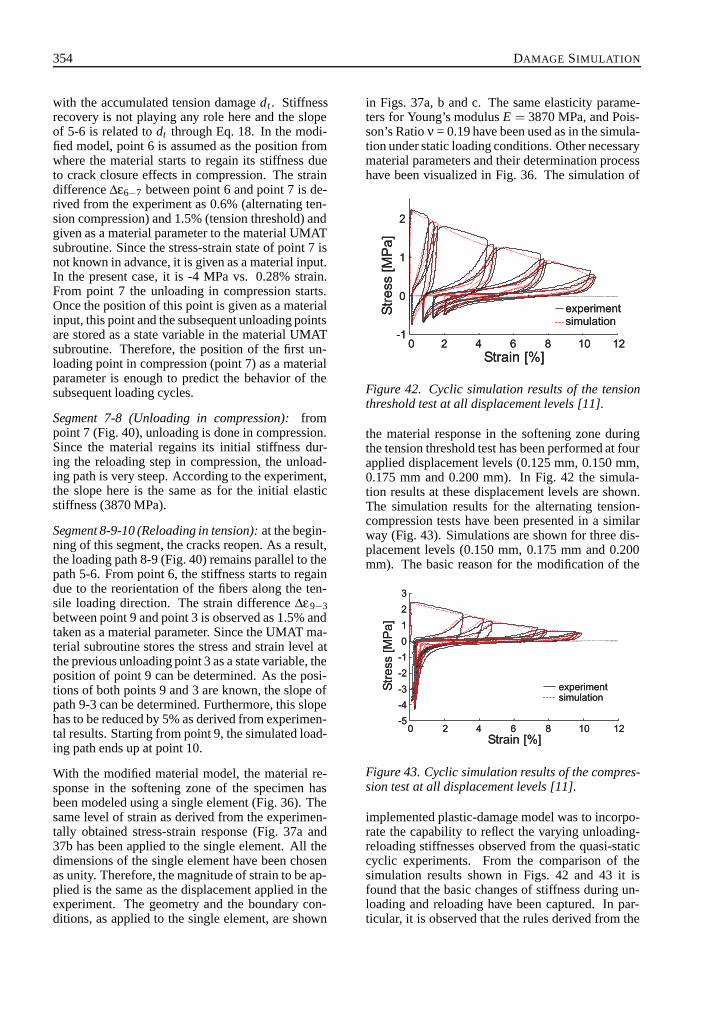
354 DAMAGE SIMULATION
with the accumulated tension damage dt . Stiffnessrecovery is not playing any role here and the slopeof 5-6 is related to dt through Eq. 18. In the modi-fied model, point 6 is assumed as the position fromwhere the material starts to regain its stiffness dueto crack closure effects in compression. The straindifference Δε6−7 between point 6 and point 7 is de-rived from the experiment as 0.6% (alternating ten-sion compression) and 1.5% (tension threshold) andgiven as a material parameter to the material UMATsubroutine. Since the stress-strain state of point 7 isnot known in advance, it is given as a material input.In the present case, it is -4 MPa vs. 0.28% strain.From point 7 the unloading in compression starts.Once the position of this point is given as a materialinput, this point and the subsequent unloading pointsare stored as a state variable in the material UMATsubroutine. Therefore, the position of the first un-loading point in compression (point 7) as a materialparameter is enough to predict the behavior of thesubsequent loading cycles.
Segment 7-8 (Unloading in compression): frompoint 7 (Fig. 40), unloading is done in compression.Since the material regains its initial stiffness dur-ing the reloading step in compression, the unload-ing path is very steep. According to the experiment,the slope here is the same as for the initial elasticstiffness (3870 MPa).
Segment 8-9-10 (Reloading in tension): at the begin-ning of this segment, the cracks reopen. As a result,the loading path 8-9 (Fig. 40) remains parallel to thepath 5-6. From point 6, the stiffness starts to regaindue to the reorientation of the fibers along the ten-sile loading direction. The strain difference Δε9−3between point 9 and point 3 is observed as 1.5% andtaken as a material parameter. Since the UMAT ma-terial subroutine stores the stress and strain level atthe previous unloading point 3 as a state variable, theposition of point 9 can be determined. As the posi-tions of both points 9 and 3 are known, the slope ofpath 9-3 can be determined. Furthermore, this slopehas to be reduced by 5% as derived from experimen-tal results. Starting from point 9, the simulated load-ing path ends up at point 10.
With the modified material model, the material re-sponse in the softening zone of the specimen hasbeen modeled using a single element (Fig. 36). Thesame level of strain as derived from the experimen-tally obtained stress-strain response (Fig. 37a and37b has been applied to the single element. All thedimensions of the single element have been chosenas unity. Therefore, the magnitude of strain to be ap-plied is the same as the displacement applied in theexperiment. The geometry and the boundary con-ditions, as applied to the single element, are shown
in Figs. 37a, b and c. The same elasticity parame-ters for Young’s modulus E = 3870 MPa, and Pois-son’s Ratio ν = 0.19 have been used as in the simula-tion under static loading conditions. Other necessarymaterial parameters and their determination processhave been visualized in Fig. 36. The simulation of
Figure 42. Cyclic simulation results of the tensionthreshold test at all displacement levels [11].
the material response in the softening zone duringthe tension threshold test has been performed at fourapplied displacement levels (0.125 mm, 0.150 mm,0.175 mm and 0.200 mm). In Fig. 42 the simula-tion results at these displacement levels are shown.The simulation results for the alternating tension-compression tests have been presented in a similarway (Fig. 43). Simulations are shown for three dis-placement levels (0.150 mm, 0.175 mm and 0.200mm). The basic reason for the modification of the
Figure 43. Cyclic simulation results of the compres-sion test at all displacement levels [11].
implemented plastic-damage model was to incorpo-rate the capability to reflect the varying unloading-reloading stiffnesses observed from the quasi-staticcyclic experiments. From the comparison of thesimulation results shown in Figs. 42 and 43 it isfound that the basic changes of stiffness during un-loading and reloading have been captured. In par-ticular, it is observed that the rules derived from the

4.1 Modeling of Damage in Fiber and Particle Reinforced Composites 355
first load cycle governing the stiffness degradationand recovery in the elastic domain can be maintainedfor the subsequent load cycles.
The non-linear stress-strain response with contin-uously varying unloading-reloading stiffnesses hasbeen approximated by a multi-linear stress-strain re-sponse. In the modified model, emphasis has beenput on the close representation of the dissipatedenergy inside the hysteresis loops. For instance,the energy dissipation of the mid-cycle for the ten-sion threshold test (displacement level of 0.150 mm,Fig. 42) is 0.0216 MJ/m3 (experiment) and 0.0180MJ/m3 (simulation), respectively. In the case ofalternating tension-compression test (displacementlevel of 0.175 mm, Fig. 43) the mid-cycle energydissipations are found to be 0.0477 MJ/m3 (exper-iment) and 0.0455 MJ/m3 (simulation). Therefore,for these cycles, approximately 16% deviation isobserved regarding dissipated energy in the tensionthreshold test while it is only 5% for the alternatingtension-compression test.
5.3.3. Conclusions
This section has described the finite element analy-sis of the material behavior of a cellulose fiber rein-forced gypsum matrix composite. For the simulationof the material behavior the plastic-damage modelof Lubliner et al. [66] and Lee and Fenves [69] hasbeen used for this specific material.
The simulations have been performed for static ten-sile and quasi-static cycling loading of necked spec-imens of a cellulose fiber reinforced gypsum com-posite. The introduction of a slightly pre-weakenedsection in the center of the tensile bar, which re-flects the heterogeneities of the material, has led toa close representation of the material behavior ofthe static experiment for different gage length withnearly mesh independences and a unique set of pa-rameters. The representation of the damage parame-ter d as a contour plot reflects well the damaged stateof the material.
Additionally, the dilation angle ψ, which controlsthe direction of the plastic flow as a parameter ofthe plastic-damage model, has been determined to ψ= 53◦ using inverse modeling. Due to the complexbehavior of the material in the unloading-reloadingregime during quasi-static cyclic loading, the modelimplemented in ABAQUS has been basically mod-ified within the elastic domain. A material rou-tine UMAT has been developed, which describes theloading cycles in close agreement to the experiment.
In particular, the approximation of the energy dis-sipation was improved considerably. On the basisof these achievements, further studies can be per-formed to adapt the so far developed material modelto the structural level. A further goal of future inves-tigations will be the simulation of a macromechani-cal seismically loaded component which is fixed ona timber frame by dowelled joints.
6. SUMMARY
In this Chapter an overview of damage modelingin composites was given. Many approaches weredeveloped on the basis of simple unit cell models,which, however, exhibit limitations which can beovercome by applying modified models. As ex-amples, the Self-consistent Model and the (Statis-tical) Combined Cell, as well as the plastic-damagemodel were described. These models have been ap-plied to relevant technical materials such as MetalMatrix Composites, Polymer Matrix Compositesand cellulose fiber reinforced composites. It hasbeen possible to simulate the static and quasi-staticcyclic mechanical behavior of fiber and particle re-inforced composites as well as the damage process.Depending on the specific material, certain mod-els show advances to represent the particular be-havior. The unit cell models presented here inte-grate micromechanical damage phenomena, such asinclusion-matrix debonding and inclusion cracks. Infuture works macromechanical features (e.g., matrixcracks) could be included to extend the applicabilityof the simulations to large plastic deformations.
ACKNOWLEDGEMENTS
The authors gratefully acknowledge support fromENSAM, Paris, for supplying test data of Al/Al2O3,as well as DAAD under contract no. D/0205761for financial supporting the co-operation with EN-SAM. Additionally, the authors thank the Institutefor Polymer Testing and Polymer Science (IKP) forproviding the mechanical data and the SEM mi-crographs. The following scientists contributed tothis Chapter (in alphabetical order): S. Aicher, O.Bullinger, G. Busse, R. Finn, H. Gerhard, G. Lasko,W. Lutz, T. Rahman, S. Schmauder, R. Stoßel andK. Zhu. Further thanks go to A. Wanner, S. Predakand R. Finn for the experiments and A. Jackel forimage editing.

356 DAMAGE SIMULATION
REFERENCES
[1] J. Bohse, K. Kroh: Micromechanics and acous-tic emission analysis of the failure process ofthermoplastic composites, in Journal of Mate-rials Science 27 (1992), p. 298-306.
[2] K. Guo-Zheng, Q. Gao: Tensile properties ofrandomly oriented short Al2O3 fiber reinforcedaluminium alloy composites, in II. Finite ele-ment analysis for stress transfer, elastic modu-lus and stress-strain curve, in Composites A 33(2002), p. 657-667.
[3] K. Derrien, D. Baptiste, D. Guedra-Degeorges,J. Foulquier: Multiscale modeling of the dam-aged plastic behavior and failure of Al/SiCpcomposites, in International Journal of Plastic-ity 15 (1999), p. 667-685.
[4] M. Dong, S. Schmauder: Transverse mechan-ical behavior of fiber reinforced composites -FE Modeling with embedded cell models, inComp. Mat. Sci. 5 (1996), p. 53-66.
[5] Reprint from Acta Materialia, 44, M. Dong,S. Schmauder: Modeling of metal matrixcomposites by a self-consistent embedded cellmodel, p. 2465-2478, Copyright (1996), withpermission from Elsevier.
[6] Reprint from Computational Materials Science9, M. Dong, S. Schmauder, T. Bidlingmaier, A.Wanner: Prediction of the mechanical behaviorof short fiber reinforced MMCs by CombinedCell Models, p. 121-133, Copyright (1997),with permission from Elsevier.
[7] Reprint from Computational Materials Science28, K. Zhu, S. Schmauder: Prediction of thefailure properties of short fiber reinforced com-posites with metal and polymer matrix, p. 743-748, Copyright (2003), with permission fromElsevier.
[8] K. Zhu, S. Schmauder, R. Stoßel, S. Predak,G. Busse, W. Lutz: The failure properties ofshort fiber reinforced composites with polymermatrix with consideration of the fiber/matrix-debonding, ICPNS 2004, Shanghai (2004).
[9] Reprint from Computational Materials Sci-ence 36, M.R. Kabir, W. Lutz, K. Zhu, S.Schmauder: Fatigue modeling of short fiber re-inforced composites with ductile matrix undercyclic loading, p. 361-366, Copyright (2006),with permission from Elsevier.
[10] W. Lutz, G. Lasko, S. Schmauder, S. Predak,O. Bullinger, H. Gerhard, G. Busse: Injec-tion molding simulation of a glass fiber rein-forced component with a weldline to calcu-late fiber orientation and resulting mechanical
properties, in 19. Stuttgarter Kunststoffkollo-quium 4V5 (2005).
[11] Reprint from Computational Materials Science(in press), T. Rahman, W. Lutz, R. Finn, S.Schmauder, S. Aicher: Simulation of the me-chanical behavior and damage in componentsmade of strain softening cellulose fiber rein-forced gypsum materials, Copyright (2006),with permission from Elsevier.
[12] L. Mishnaevsky: Numerical Experiments inthe Mesomechanics of Materials - Virtual Test-ing of Microstructures as a Basis for the Opti-mization of Materials, in Habilitation, Univer-sity of Dortmund (2005).
[13] T. Rahman: Simulation of the damage devel-opment in components made of cellulose fiberreinforced gypsum material, in Master Thesis,University of Stuttgart (2005).
[14] E. Mader, H.J. Jakobasch, G. Grundke, T. Gi-etzelt: Influence of an optimised interphaseon the properties of polypropylene/glass fibrecomposites, in Composites A 27, (1996), p.907-912
[15] W. Brostow, R.D. Corneliussen: Failure ofplastics, Munchen, Wien, New York, Hanser(1986).
[16] R. Kabir: Fatigue modeling of short fiber re-inforced composites with ductile matrix undercyclic loading, in Master Thesis, University ofStuttgart (2003).
[17] G. Bao: A Micromechanical model for Dam-age in Metal Matrix Composites, in AMD142/MD-34 Damage Mechanics and Localiza-tion, Ed. J.H.Ju, ASME 1992, p. 1-12.
[18] J. Llorca, A. Needleman, S. Suresh: An Anal-ysis of The Effects of Matrix Void Growthon Deformation and Ductility of Metal-Ceramic Composites, in Acta Metall. Mater. 39(10/1991), p. 2317-2335.
[19] M.E. Walter, G. Ravichandran, M. Ortiz:Computational modeling of damage evolutionin unidirectional fiber reinforced ceramic ma-trix composites, in Comput. Mech. 20 (1997),p. 192-198.
[20] W. Brocks, S. Hao, D. Steiglich: Microme-chanical modeling of the Damage and Tough-ness Behaviour of Nodular Cast Iron Materials,in Proceedings of EUROMECH-MECAMATConference ”Local Approaches to Fracture 86-96”, Fontainebleau (1996).
[21] D.Z. Sun, M. Sester, W. Schmitt: Developmentand Application of Micromechanical Materialmodels for the Characterization of Materials,

4.1 Modeling of Damage in Fiber and Particle Reinforced Composites 357
in Proceedings of EUROMECH-MECAMATConference ”Local Approaches to Fracture 86-96”, Fontainebleau (1996).
[22] V.V. Mozhev, L.L. Kozhevnikova: UnitCell Evolution in Structurally DamageableParticulate-Filled Elastomeric Composites un-der Simple Extension, in J. Adhesion 55(1996), p. 209-219.
[23] V.V. Mozhev, L.L. Kozhevnikova: Highly Pre-dictive Structural Cell for Particulate Poly-meric Composites, in J. Adhesion 62 (1997),p. 169-186.
[24] D. Adams: Inelastic Analysis of a Unidirec-tional Composite Subjected to Transverse Nor-mal Loading, in J. Compos. Mater. 4 (1970),p. 310.
[25] J.R. Brockenbrough, S. Suresh: Plastic defor-mation of continuous fiber-reinforced metal-matrix composites: effects of fiber shapeand distribution, in Scripta Metall. Mater. 24(1990), p. 325-330.
[26] J.R. Brockenbrough, S. Suresh, H.A. Wie-necke: Deformation of metal-matrix compos-ites with continuous fibers: geometrical effectsof fiber distribution and shape, in Acta Metall.Mater. 39 (1991), p. 735-752.
[27] T. Nakamura, S. Suresh: Effects of thermalresidual stresses and fiber packing on deforma-tion of metal-matrix composites, in Acta Met-all. Mater. 41 (1993), p. 1665-1681.
[28] S. Jansson: Homogenized nonlinear constitu-tive properties and local stress concentrationsfor composites with periodic internal structure,in Int. J. Solids Structures 29 (1992), p. 2181-2200.
[29] D.B. Zahl, S. Schmauder, R.M. McMeeking:Transverse strength of metal matrix compos-ites reinforced with strongly bonded contin-uous fibers in regular arrangements, in ActaMetall. Mater. 42 (1994), p. 2983-2997.
[30] C. Dietrich: Mechanisches Verhalten vonZweiphasengefugen: Numerische und exper-imentelle Untersuchungen zum Einfluss derGefugegeometrie, in VDI-Fortschrittsberichte18 (128), VDI-Verlag, Dusseldorf (1993).
[31] M. Sautter: Modellierung des Verfor-mungsverhaltens mehrphasiger Werkstoffe mitder Methode der Finiten Elemente, in PhD.thesis, University of Stuttgart (1995).
[32] G.L. Povirk, M.G. Stout, M. Bourke, J.A.Goldstone, A.C. Lawson, M. Lovato, S.R.Macewen, S.R. Nutt, A. Needleman: Ther-mally and mechanically induced residual
strains in Al-SiC composites, in Acta Metall.Mater. 40 (1992), p. 2391-2412.
[33] C. Dietrich, M.H. Poech, S. Schmauder,H.F. Fischmeister: Numerische Model-lierung des mechanischen Verhaltens vonFaserverbundwerkstoffen unter transver-saler Belastung, in Verbundwerkstoffe undWerkstoffverbunde, Eds. G. Leonhardt etal., DGM-Informationsgesellschaft mbH,Oberursel (1993), p. 611-618.
[34] H. Bohm, F.G. Rammerstorfer, E. Weissenbek:Some simple models for micromechanical in-vestigations of fiber arrangement effects inMMCs, in Comput. Mater. Sci. 1 (1993),p. 177-194.
[35] H.J. Bohm, F.G. Rammerstorfer, F.D. Fischer,T. Siegmund: Microscale arrangement effectson the thermomechanical behavior of advancedtwo-phse materials, in ASME J. Engng. Mater.Technol. 116 (1994), p.268-273.
[36] G. Bao, J.W. Hutchinson, R.M. McMeek-ing: Particle reinforcement of ductile matricesagainst plastic flow and creep, in Acta Metall.Mater. 39 (1991), p. 1871-1882.
[37] V. Tvergaard: Analysis of tensile properties fora whisker-reinforced metal-matrix composite,in Acta Metall. Mater. 38 (1990), p. 185-194.
[38] C.L. Hom: Three-dimensional finite elementanalysis of plastic deformation in a whisker-reinforced metal matrix composite, in J. Mech.Phys. Solids 40 (1992), p. 991-1008.
[39] E. Weissenbek: Finite Element modeling ofthe discontinuously reinforced metal matrixcomposites, in PhD. thesis, Technical Univer-sity of Vienna (1993).
[40] D.B. Zahl, R.M. McMeeking: The influence ofresidual stress on the yielding of metal matrixcomposites, in Acta Metall. Mater. 39 (1991),p. 1171-1122.
[41] M.H. Poech: Deformation of two-phase mate-rials: application of analytical elastic solutionsto plasticity Microstructure and flow stress ofcell forming metals, in Scripta Metall. Mater.27 (1992), p. 1027-1031.
[42] L. Farrissey, S. Schmauder, M. Dong, E.Soppa, M.H. Poech, P. McHugh: Investigationof the strengthening of particulate reinforcedcomposites using different analytical and finiteelement models, in Computational MaterialsScience 15 (1999), p. 1-10.
[43] J.M. Duva, A self-consistent analysis of thestiffening effect of rigid inclusions on a powerlaw material, in ASME J. Engng. Mater. Tech-nol. 106 (1984), p. 317-321.

358 DAMAGE SIMULATION
[44] M. Sautter, C. Dietrich, M.H. Poech, S.Schmauder, H.F. Fischmeister: Finite elementmodeling of a transverse-loaded fibre compos-ite. Effects of section size and net density, inComput. Mater. Sci. 1 (1993), p. 225-233.
[45] D.B. Zahl, S. Schmauder: Transverse strengthof continuous fiber metal matrix composites, inComput. Mater. Sci. 3 (1994), p. 293-299.
[46] T. Christman, A. Needleman, S. Suresh: Anexperimental and numerical study of deforma-tion in metalceramic composites, in Acta Met-all. Mater. 37 (1989), p. 3029-3050.
[47] P.M. Suquet: MECAMAT 93, Int. Seminar onMicromechan. Mater., Editions Eyrolles, Paris,France (1993), p. 361.
[48] F. Thebaud: PhD. Dissertation, Universite deParis Sud (1993).
[49] N.J. Sfrensen: A planar model study of creepin Metal Matrix Composites with misalignedshort fibers, in Acta Metall. Mater. 41 (1993),p. 2973-2983.
[50] N.J. Sfrensen, N. Hansen, Y.L. Liu: On theinelastic behavior of Metal Matrix Compos-ites, in Numerical predictions of deformationprocesses and the behavior of real materials,Eds.: S.I. Andersen et al., Roskilde, Denmark(1994), p. 149-168.
[51] Y.L. Klipfel, M.Y. He, R.M. McMeeking, A.G.Evans, R. Mehrabian: The processing and me-chanical behavior of an aluminun matrix com-posite reinforced with short fibers, in Acta Met-all. Mater. 38 (1990), p. 1063-1074.
[52] I. Dutta, J.D. Sims, D.M. Seigenthaler: An an-alytical study of residual stress effects on uni-axial deformation of whisker reinforced metal-matrix composites, in Acta Metall. Mater. 41(1993), p. 885-908.
[53] W.M.G. Courage, P.J.G. Schreurs: Effectivematerial parameters for composites with ran-domly oriented short fibers, in Computers &Structures 44 (1992), p. 1179-1185.
[54] A. Dlouhy, N. Merk, G. Eggeler: A microme-chanical study of creep in short fiber reinforcedaluminium alloys, in Acta Metall. Mater. 41(1993), p. 3245-3256.
[55] A. Dlouhy, G. Eggeler, N. Merk: A mi-cromechanical model for creep in short fiberreinforced aluminium alloys, in Acta Metall.Mater. 43 (1995), p. 535-550.
[56] D.B. Zahl, S. Schmauder: Transverse strengthof Metal Matrix Composites reinforced withstrongly bonded continuous fibers in regular ar-rangements, in Acta Metall. Mater. 42 (1994),p. 2983-2997.
[57] H. Dietzhausen, M. Dong, S. Schmauder: Nu-merical simulation of acoustic emission in fiberreinforced polymers, in Computational Materi-als Science 9 (1997), p. 121-133.
[58] M. Dong, Characterization of failure prop-agation in fiber reinforced materials usingnon-destructive methods, Cooperated ResearchCenter, Report 1994-1997 University Stuttgart(1997).
[59] K. Zhu, M. Dong, K. Turan, N. Nguyen, Char-acterization of failure propagation in fiber re-inforced materials using non-destructive meth-ods, Cooperated Research Center, Report1997-1999 University Stuttgart (1999)
[60] K. Zhu, S. Schmauder: Modelierung desSchadigungsverlaufs in Faserverbundwerkstof-fen mit duktiler Matrix, SFB381, Ergebnis-bericht (2000-2002).
[61] M.L. Dunn, H. Ledbetter: Elastic-Plastic be-havior of textured Short Fiber composites, inActa Metall. Mater. 45 (8/1997), p. 3327-3340.
[62] J. Llorca: A numerical analysis of the damagemechanisms in metal-matrix composites undercyclic deformation, in Computational Materi-als Science 7 (1996), p. 118-122.
[63] K. Derrien, J. Fitoussi, G. Guo, D. Baptiste:Prediction of the effective damage propertiesand failure properties of nonlinear anisotropicdiscontinuous reinforced composites, in Re-port, Laboratory LM3, ENSAM, CNRS URA1219, Paris, France.
[64] J. Lemaitre: A course on damage mechanics,Second Ed., Springer, Paris (1996).
[65] ABAQUS Version 5.8, Hibbit, Karlsson &Sorensen.
[66] J. Lubliner, J. Oliver, S. Oller, E. Onate: Aplastic-damage model for concrete, in Int. J.Solids and Structures 25 (3/1989), p. 229-326.
[67] S. Aicher, R. Finn: Fracture characterizationof cellulose fiber gypsum composite subject toin-plane tension loading, in Otto-Graf-Journal15 (2004), p. 91-102.
[68] N. N., ABAQUS Theory manual, version 6.4,3, Chapter 4.5.2 (2003), p. 1-13.
[69] J. Lee, G.L. Fenves: plastic-damage model forcyclic loading of concrete structures, in J. Eng.Mech. 124 (8/1998), p. 892-900.
[70] W. Lutz, T. Rahman, S. Schmauder, R. Finn,S. Aicher: Simulation cellulosefaserverstarkterGips-Verbundwerkstoffe, 6. Leipziger Fachta-gung ”Innovationen im Bauwesen - Faserver-bundwerkstoffe”, Leipzig, 1. - 2.12. (2005).

4.1 Modeling of Damage in Fiber and Particle Reinforced Composites 359
[71] W.C., Jr. Harrington: Mech. Properties Metall.Compos., S. Ochiai, ed., Marcel Dekker Inc.,NY, USA, 759(1993).
[72] T. Bidlingmaier, D. Vogt, A. Wanner:Schadigungsentwicklung bei der Kriechver-formung einer kurzfaserverstarkten Alu-miniumlegierung, in Verbundwerkstoffe undWerkstoffverbunde, Ed.: G. Ziegler, DGMInformationsgesellschaft Verlag (1995),p. 245-248.
[73] LASSO Engineering Association, Markoman-nenstr. 11, 70771 Leinfelden-Echterdingen,Germany.
[74] PDA Engineering, 2975 Redhill Avenue, CostaMesa, California 92626, USA.
[75] T. Bidlingmaier, A. Wanner, E. Arzt: unpub-lished results.
[76] E. Le Pen, D. Baptiste, G. Hug: Multi scalefatigue behavior modeling of Al-Al2O3 shortfiber composites, in Int. J. of Fatigue 24 (2002),p. 205-214.
[77] K. Derrien, D. Baptiste, D. Guedra-Degeorges,J. Foulquier: Multiscale modeling of the dam-aged plastic behavior and failure of Al/SiCpcomposites, in Int. J. of Plasticity 15 (1999),p. 667-685.
[78] G. Rub, N.C. Davidson, B. Moginger, P. Ey-erer: Mechanical property simulation of par-tially oriented composites using the Elemen-tary Volume Concept, Conf. Proc. Polym.Proc. Soc. Ann. Meet. (PPS 17), May 21-24,Montreal/Canada (2001).
[79] G.P. Tandon, G.T. Weng: The effect of aspectratio of inclusions on the elastic properties ofunidirectionally aligned composites, in Polym.Comp. (1984), p. 327-333.
[80] B. Dujic, R. Zarnic: Comparison of hystere-sis responses of different sheathing to framingjoints, in Int. Council for Research and Inno-vation in Building and Construction. WorkingCommission W18. Proceedings Meeting 36,Colorado, (2003) paper CIB W18/36 7 5.
[81] A. Hilleborg, M. Modeer, P. E. Petersson:Analysis of crack formation and crack growthin concrete by means of fracture mechanicsand finite elements, in Cement and concrete re-search 6 (1976) p. 773-782.