Embed Size (px)
Citation preview

Implied Volatility Structure and Forecasting Efficiency: Evidence from Indian Option Market
~ Chapter 4 ~ 88
CHAPTER IV
THE VOLATILITY STRUCTURE IMPLIED BY NIFTY INDEX AND SELECTED STOCK OPTIONS
4.1 INTRODUCTION
The “Smile Effect” is a result of an empirical observation of the
options’ implied volatility with same expiration date, across different exercise
prices. It typically describes a U-shape from showing higher implied volatility
for in-the-money and out-of-the-money options than its corresponding implied
volatility figures for at-the-money options.
The Black-Scholas (1975) option pricing model is widely used to value
options written on a large variety of underlying assets. Despite this widespread
acceptance among practitioners and academics, the discrepancies between
market and Black-Scholes prices are obvious and systematic. If the market
were to price options according to the Black-Scholas model, all options on one
stock would have the same implied volatility. However, it is well-known that,
at any moment of time implied volatility obtained by the Black-Scholes model
varies across time to maturity as well as strike prices. The pattern of implied
volatility for different time to maturity is known as the term structure of
implied volatility, and the pattern across strike prices is known as the
volatility smile or the volatility sneer. A term of volatility structure is used
generally to refer to the pattern across both strike prices and time to maturity.

Implied Volatility Structure and Forecasting Efficiency: Evidence from Indian Option Market
~ Chapter 4 ~ 89
Many early studies have documented a U-shape smile pattern for
implied volatility in many options markets prior to the 1987 stock market
crash. For example, Macbeth and Mervilli (1979) found in-the-money stock
option with a short remaining time to expiration tend to have higher implied
volatilities than corresponding options with a longer time to expiration.
Rubinstein (1985) concluded that systematic deviation from the Black-Scholas
model appears to exist, but the pattern of deviations varies over time. Shastri
and Wethyavivorn (1987) found that implied volatilities from foreign currency
options traded on the Philadelphia Stock Exchange (PHLX) in 1983 and 1984
are a U-shaped function of the exchange rate divided by the strike price. Sheikh
(1991) argued that a U-shaped pattern occurred for the S&P 100 options during
various sub-periods between 1983 and 1985. Fung and Hsieh (1991) discuss
informally some empirical smile effect for foreign currency options traded on
the Chicago Mercantile Exchange (CME). Heyen (1993) has shown that U-
Shaped functions can describe the pattern of implied volatility from nine
months’ transaction prices of European Options Exchange (EOE) stock index
options, which are European style options on an index of 25 active stocks on
the Amsterdam stock Exchange. Taylor and Xu (1994) fit U-shaped functions
to implied volatilities from foreign currency options traded on the PHLX over a
longer period from November 1984 to January 1992. They also found that the
magnitude of smile effect is a decreasing function of time to maturity. Duque
and Paxson (1994) provided evidence of smile pattern in equity call options on
Implied Volatility Structure and Forecasting Efficiency: Evidence from Indian Option Market
~ Chapter 4 ~ 90
LIFFE and relatively high implied volatility for in-the-money options. Bakshi,
et al. (1997) exhibit a clear U-shaped pattern across moneyness, with the most
distinguished smile evident for options near expiration. Brown and Taylor
(1997) used Asay Model on the SPI futures option and found that the model
tends to overprice call options and under-price put options. Pena, et al. (1999)
found smile pattern in Spanish IBEX-35 index.
In contrast to the above theoretical and empirical results showing a
symmetric pattern for implied volatility against strike price, Rubinstein (1994)
develops a new method for inferring risk-neutral probabilities from the
simultaneously observed prices of S&P 500 index option for the post-crash of
1987 and found smile pattern in the implied volatilities during pre-crash
changed into a “sneer” in the post-crash period.
Dumas, Fleming and whaley (1998) also illustrate that the volatility
structure for S&P 500 index options has changed from the symmetric smile
pattern to more a sneer since the stock market crash of 1987. In other terms,
implied call (put) volatilities decrease monotonically as the call (put) option
goes deeper out-of-the-money (in-the-money).
Brown (1999) extends Dumas, Fleming and Whaley’s (1998) results to
the SPI 200 futures options on the Sydney Futures Exchange (SFE), covering
the period from June 1993 to June 1994. In-the-money call (put) options are
generally trading at higher (lower) implied volatilities than out-of-the-money
call (put) options. Duque and Lopes (2003) empirical support for the notion is

Implied Volatility Structure and Forecasting Efficiency: Evidence from Indian Option Market
~ Chapter 4 ~ 91
that options tend to die smiling in call option quotes on nine heavily traded
stock on the London International Financial Futures and Options Exchange
(LIFFE) between August 1990 and December 1991. However, the changes in
the smile pattern are asymmetric. The “wry grin” found for longer-term options
is converted into a “reverse grin” for options near expiration. For medium term
options, the smile is more symmetric.
Malin Engstrom (2002) shows U-shaped smile pattern from 27
individual stock options traded in the Stockholm Stock Exchange (StSE) during
the period from July 1, 1995 to February 1, 1996. Bollen and Whaley (2004)
show a sneer pattern for S&P 500 index options and U-shaped smile pattern
from 20 individual stock options traded in the Chicago Board Options
Exchange (CBOE) over the period from June 1995 to December 2000.
In contrast, limited research on this subject is available for India due to
the nascent nature of its derivatives market. The previous work provides
evidence for existence of volatility smile in the Indian options market. Varma
(2002) observes mispricing in the Indian index options market and estimates
the volatility smile for call & put options and found that is different across
option types. Misra. D, et al. (2006) found that deeply in-the- money and
deeply out-of-the-money options have higher implied volatility than at the
money options, as well as it is higher for far the month option contracts than for
near the month option contracts. Malabika, Devanadhen and Srinivasan (2008)
found out U-shaped smile pattern for 26 individual stock call options traded in

Implied Volatility Structure and Forecasting Efficiency: Evidence from Indian Option Market
~ Chapter 4 ~ 92
the National Stock Exchange (NSE) covering the period from January to
December 2006. The implied volatility structure of call option is similar to
Duque and Lopes (2003). The Indian studies fail to provide any strong
evidence on volatility structure in accordance with time left to maturity,
because of small sample size and short study periods, and immaturity of market
structure in the initial phase. The study attempts to fill this research gap for the
Indian option market literature. The study specifically examines whether
asymmetry volatility structure implied by Indian option market is in accordance
with time left to maturity.
The rest of Chapter 4 is organized as follows. Section 4.2 provides the
data and methodology applied in chapter 4. Section 4.3 presents the two
dimensional pattern of implied volatility structure against moneyness. Section
4.4 presents three dimensional pattern of implied volatility structure against
moneyness and time left to maturity. Section 4.5 provides summary and the
conclusion for chapter 4.

Implied Volatility Structure and Forecasting Efficiency: Evidence from Indian Option Market
~ Chapter 4 ~ 93
4.2 DATA AND METHODOLOGY
4.2.1 Data
4.2.1.1 Data description
This empirical analysis focuses on S&P CNX Nifty option and selected
five stock options for the period from January 1, 2002 to June 30, 2010. S&P
CNX Nifty option is European style and expires on the last Thursday of
the expiry month or the preceding trading day, if the last Thursday is a trading
holiday. Individual stock options are American style and expire on the last
Thursday of the expiry month or before.
The corresponding future contract of underlying Nifty index and
selected individual stocks were taken during the sample period. The future
contract has exactly the same contract specification as the S&P CNX Nifty
index and selected five individual stock options.
Estimating implied volatilities requires estimates of the time to
maturity and risk-free interest rate. Time to maturity is measured as the number
of calendar days between the trade date and the expiration date. Mumbai Inter
Bank Offer Rate (MIBOR) was used as proxy for risk-free interest rate. 14
days, one month and three month interest rate were taken and converted into
continuous rate. One of these three interest rates will be employed depending
upon the time to maturity mentioned below:

Implied Volatility Structure and Forecasting Efficiency: Evidence from Indian Option Market
~ Chapter 4 ~ 94
Time to Maturity Interest rate
< 30 days 14 days
31 - 60 days 1 month
> 61 days 3 month
4.2.1.2 Sampling Procedure
Nifty option and selected individual stock option constitute 5,94,589
observations for call and put option each. To obtain a relatively accurate
measurement of implied volatility, the option must be chosen carefully.
Options devoid of informative contents are excluded from the sample based on
the following criteria:
1. Option whose time to maturity is lower than 7 days and higher than
90 days. The shorter term options have relatively small time
premium, hence the estimation of volatility is extremely sensitive
to any possible measurement errors, particularly if the option is not
at-the-money. Hentschel (2000) shows other liquidity biases
arising due to the rolling over attitude of fund managers. The long
term options, on the other hand, are simply not traded. (similar
exclusionary criteria are applied among other by Bakshi, et al.
(1997) or by Dumas, et al. (1998)).
2. Options which are not traded
Implied Volatility Structure and Forecasting Efficiency: Evidence from Indian Option Market
~ Chapter 4 ~ 95
3. The option price violates the arbitrage condition i.e. the price of the
call or put is smaller than Black-Scholas-Merton price in the limit
of zero volatility.
Options dropped from the sample because they meet at least one of
these conditions amount to 1,70,812 for call and 82,949 for put. Only 18.13%
of call sample and 13.95% of put sample were taken for the study. Table 4.1
reports the number and percentage of the quotation cleared off the database
according to each exclusion criterion.

Implied Volatility Structure and Forecasting Efficiency: Evidence from Indian Option Market
~ Chapter 4 ~ 96
TABLE 4.1
Number of Observations and Percentage of the Contracts Filtered
This table presents the number of observations of S&P CNX Nifty index and five selected stock options over the period from January 2002 to June 2010. The individual as well as total number of observations and percentage of the quotations cleared off the database according to following criterion. (1) Option whose time to Maturity (TTM) is lower than 7 days and higher than 90 days. (2) Options which are not traded. (3) Option price violates the arbitrage condition. Panel A contains number of observations and percentage of the contracts filtered of the call option sample according to each exclusion criterion. Panel B contains number of observations and percentage of the contracts filtered of the put option sample according to each exclusion criterion.
Panel A: Call Option Particular S&P CNX
NIFTY INFOSYS ITC RANBAXY RELIANCE SBI Total %
Total 225042 87200 62085 72470 72950 74842 594589 100.00 TTM < 7 days 19130 8954 5985 7240 7397 7481 56187 9.45 TTM > 90 days 49215 275 249 254 256 268 50517 8.50 No option traded 110297 59728 47047 54312 47284 52946 371614 62.50 Violation of Arbitrage 5448 542 286 331 1037 815 8459 1.42 Final sample 40952 17701 8518 10333 16976 13332 107812 18.13
Panel B: Put Option Particular S&P CNX
NIFTY INFOSYS ITC RANBAXY RELIANCE SBI Total %
Total 225042 87200 62085 72470 72950 74842 594589 100.00 TTM < 7 days 19130 8954 5985 7240 7397 7481 56187 9.45 TTM > 90 days 49215 275 249 254 256 268 50517 8.50 No option traded 115363 65143 51565 60221 52346 57116 401754 67.57 Violation of Arbitrage 2092 273 103 164 311 239 3182 0.54 Final sample 39242 12555 4183 4591 12640 9738 82949 13.95

Implied Volatility Structure and Forecasting Efficiency: Evidence from Indian Option Market
~ Chapter 4 ~ 97
4.2.2 Methodology
Implied volatility is the volatility implied by an option price observed in the
market based on an option pricing model. Thus, this study is dependent on option
pricing model. In this subsection, the original Black-Scholas model (BS) and its
limitations are briefly discussed. Then a dividend-adjusted BS model is presented in
detail and used as the option pricing model in this study.
4.2.2.1 The Option Pricing Model
4.2.2.1.1 Black-Scholes (1973) Model
The assumptions underlying the original Black-Scholas option pricing
model are as follows:
1. The stock price follows a lognormal distribution with a constant volatility.
2. The short selling of securities with full use of proceeds is permitted.
3. There are no transactions cost or taxes. All securities are perfectly divisible.
4. There are no dividends during the life of the derivative.
5. There are no riskless arbitrage opportunities.
6. Securities trading are continuous.
7. The risk-free rate of interest is constant and is the same for all maturities.
Based on the assumption above, the Black-Scholas option pricing formulae
for call and Put option can be written as

Implied Volatility Structure and Forecasting Efficiency: Evidence from Indian Option Market
~ Chapter 4 ~ 98
--------------- (4-1)
and
--------------- (4-2)
Respectively, where
Where
C = the call option price
P = the put option price
S = the current stock price
X = the exercise price of the option
T = the time remaining until expiration of the option
r = the continuously compounded annualized risk-free rate of interest for the
period of T
= the annualized volatility of the stock return
N (•) = the cumulative normal density function of (•)
One of the assumptions employed by Black-Scholas (1973) is that the stock
pays no dividend (Assumption 4). However, dividends on some stock may be
substantial and can have a significant effect on the valuation of option. Therefore a
dividend adjustment must be allowed in the option pricing formulae.

Implied Volatility Structure and Forecasting Efficiency: Evidence from Indian Option Market
~ Chapter 4 ~ 99
4.2.2.1.2 Merton (1973) Model
Merton model generalizes the Black and Scholas (1973) model by relaxing
the assumption of no dividend. Merton (1973) allows for a constant continuous
dividend yield on the stock and/or stock index.
Let denote the volatility implied by an option price and denote the
annualized continuously compounded dividend yield during the remaining life of the
option, then the Merton (1973) formulae for call and put options can be expressed as
------------- (4-3)
------------- (4-4)
respectively, where
Hence, an estimate of the dividend yield is needed. For the purpose of this
study, future contracts are utilized, which have exactly the same expiry cycle, expiry
date and underlying asset with the option contract. The cost-of-carry model (see, e.g.
Hull, 2003) gives

Implied Volatility Structure and Forecasting Efficiency: Evidence from Indian Option Market
~ Chapter 4 ~ 100
----------------- (4-5)
Combining (2.5) with (2.3) and (2.4) yields
------------------ (4-6)
and
------------------- (4-7)
where,
By solving (4-6) and (4-7) numerically, the implied volatility series for call
and put options can be constructed.
Inverting an option model like that of Black-Scholas is a difficult task,
therefore generally implied volatility is extracted from the option prices by using
some numerical methods viz., Newton-Rapshson Method; by equating the difference
between observed price of the option and the theoretical price of the option to zero

Implied Volatility Structure and Forecasting Efficiency: Evidence from Indian Option Market
~ Chapter 4 ~ 101
and solving for volatility. (See Appendix for Newton-Raphson algorithm
implementation in Visual basic)
Then two dimensional graphs are plotted to examine the effect of volatility
smile or sneer, i.e. how implied volatilities vary across different group of moneyness
in the data set. Within the each group moneyness, the average implied volatility is
calculated. It is necessary to mention that there is an implicit assumption when
taking average in each group, as suggested by Brown (1999), that the trends in
implied volatility will influence implied volatilities from options with different
strike prices and different maturities equally.
Furthermore, to examine how volatility smile or sneer is affected by time to
maturity, three dimensional graphs of implied volatility against moneyness and
maturity of the option are plotted. This is done by assigning all the options records
under investigation into groups according to moneyness and time to maturity, and
then taking an average for implied volatilities in each group.
4.2.2.2 Moneyness
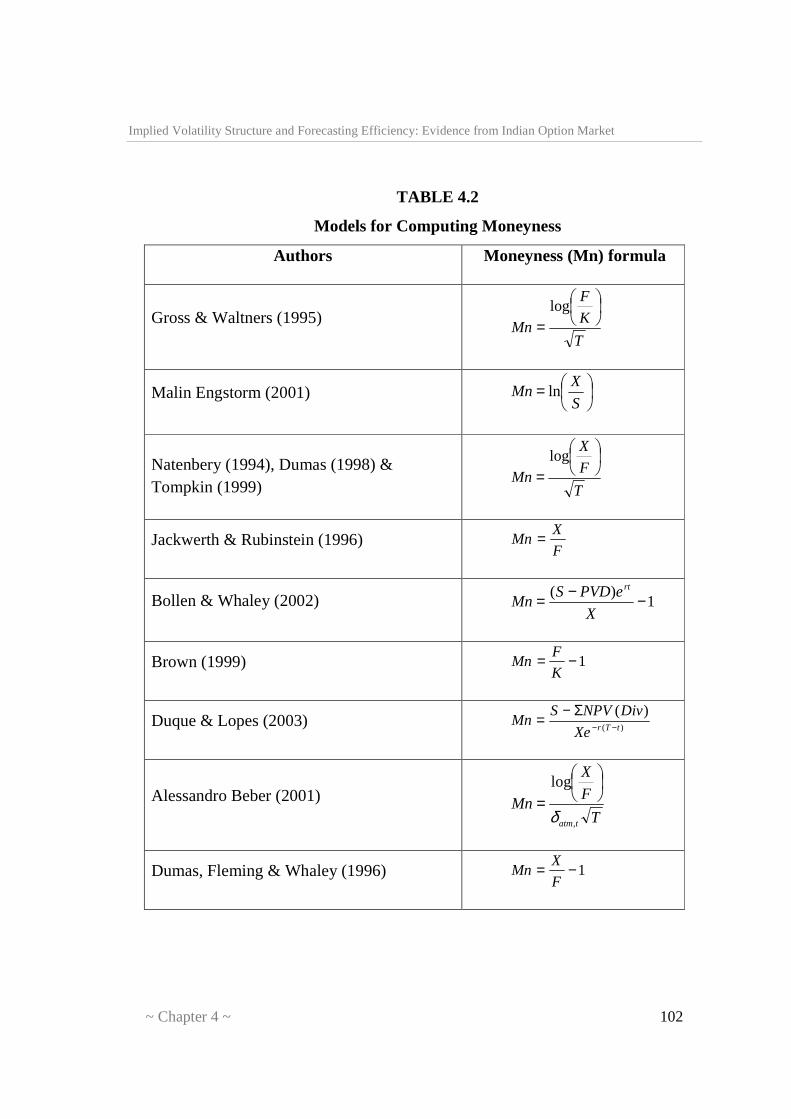
The term ‘Moneyness’ is defined by various authors in different models.
Models prescribed by various authors in literature are given in Table 4.2.
Implied Volatility Structure and Forecasting Efficiency: Evidence from Indian Option Market
~ Chapter 4 ~ 102
TABLE 4.2
Models for Computing Moneyness
Authors Moneyness (Mn) formula
Gross & Waltners (1995) T
K
F
Mn
=log
Malin Engstorm (2001)
=S
XMn ln
Natenbery (1994), Dumas (1998) & Tompkin (1999) T
F
X
Mn
=log
Jackwerth & Rubinstein (1996) F
XMn =
Bollen & Whaley (2002) 1)( −−=
X
ePVDSMn
rt
Brown (1999) 1−=K
FMn
Duque & Lopes (2003) )(
)(tTrXe
DivNPVSMn −−
Σ−=
Alessandro Beber (2001) T
F
X
Mntatm,
log
δ
=
Dumas, Fleming & Whaley (1996) 1−=F
XMn

Implied Volatility Structure and Forecasting Efficiency: Evidence from Indian Option Market
~ Chapter 4 ~ 103
Moneyness is defined as the ratio of the exercise price to the future price. The
options are divided into five subgroups according to Moneyness. The upper and
lower bounds of the moneyness categories are listed in Table 4.3. Options are
classified as follows:
4.2.2.2.1 Deep in-the-money (Deep ITM)
A Deep in-the-money (Deep ITM) option is an option that would lead to a
high positive cash flow to the holder if it were exercised. An option on the index or
individual stock option is said to be Deep in-the-money when Moneyness [Exercise
price (X)/Future price (F)] is less than or equal to 0.90 i.e. ≤ 0.90. If the moneyness
is less than or equal to .90, the call is said to be Deep ITM. In the case of a put, the
put is Deep OTM (Deep out-of-the-money).
4.2.2.2.2 In-the-money (ITM)
An In-the-money (ITM) option is an option that would lead to a positive cash
flow to the holder if it were exercised. An option on the index or individual stock
option is said to be In-the-money when moneyness [Exercise price (X)/Future price
(F)] is between 0.90 and 0.98 (0.90 – 0.98). If the moneyness is between 0.90 and
0.98, the call is said to be ITM. In the case of a put, the put is OTM (Out-of-the-
money).
Implied Volatility Structure and Forecasting Efficiency: Evidence from Indian Option Market
~ Chapter 4 ~ 104
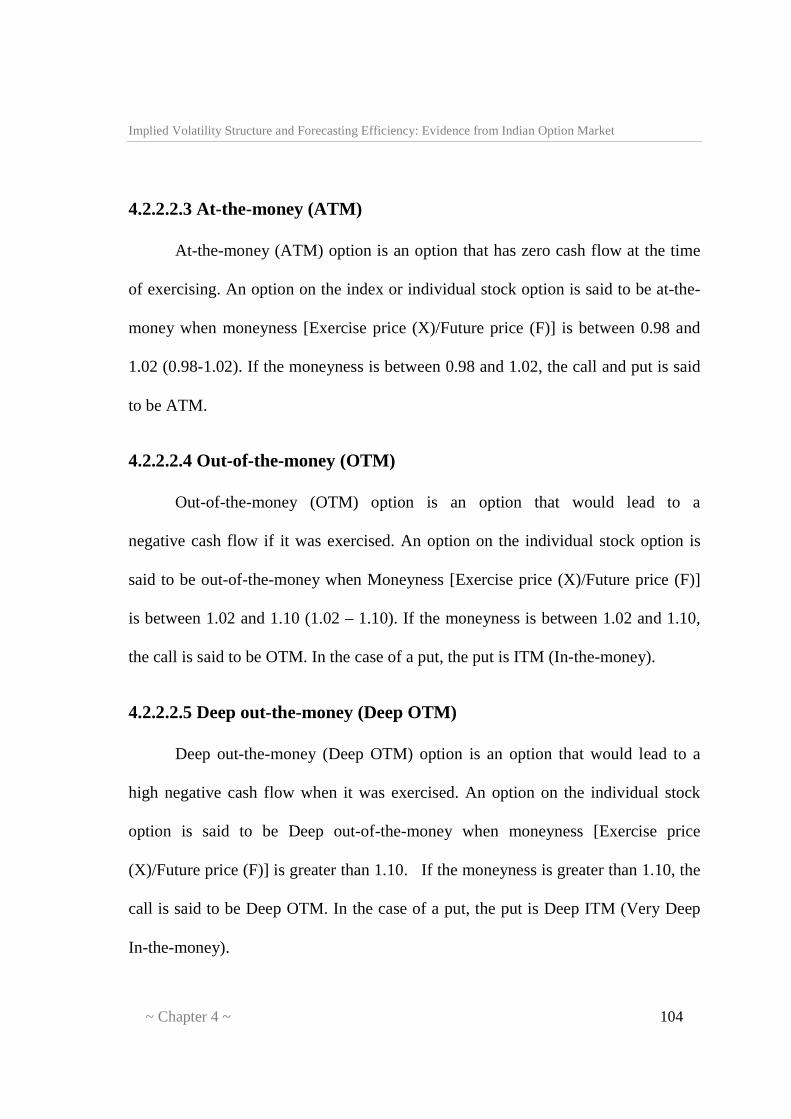
4.2.2.2.3 At-the-money (ATM)
At-the-money (ATM) option is an option that has zero cash flow at the time
of exercising. An option on the index or individual stock option is said to be at-the-
money when moneyness [Exercise price (X)/Future price (F)] is between 0.98 and
1.02 (0.98-1.02). If the moneyness is between 0.98 and 1.02, the call and put is said
to be ATM.
4.2.2.2.4 Out-of-the-money (OTM)
Out-of-the-money (OTM) option is an option that would lead to a
negative cash flow if it was exercised. An option on the individual stock option is
said to be out-of-the-money when Moneyness [Exercise price (X)/Future price (F)]
is between 1.02 and 1.10 (1.02 – 1.10). If the moneyness is between 1.02 and 1.10,
the call is said to be OTM. In the case of a put, the put is ITM (In-the-money).
4.2.2.2.5 Deep out-the-money (Deep OTM)
Deep out-the-money (Deep OTM) option is an option that would lead to a
high negative cash flow when it was exercised. An option on the individual stock
option is said to be Deep out-of-the-money when moneyness [Exercise price
(X)/Future price (F)] is greater than 1.10. If the moneyness is greater than 1.10, the
call is said to be Deep OTM. In the case of a put, the put is Deep ITM (Very Deep
In-the-money).

Implied Volatility Structure and Forecasting Efficiency: Evidence from Indian Option Market
~ Chapter 4 ~ 105

Implied Volatility Structure and Forecasting Efficiency: Evidence from Indian Option Market
~ Chapter 4 ~ 106
TABLE 4.3 Moneyness Category Definitions
This table displays category number, labels and Corresponding moneyness (Mn) and ranges of option in the sample
Category Label Range
1 Deep in-the-money (DITM) call Deep out-of-the-money (DOTM) put Mn ≤ .90
2 In-the-money (DITM) call Out-of-the-money (DOTM) put
.90 < Mn ≤ .98
3 At-the-money (ATM) call At-the-money (ATM) put
.98 < Mn ≤ 1.02
4 Out-of-the-money (DOTM) call In-the-money (DITM) put
1.02 < Mn ≤ 1.10
5 Deep out-of-the-money (DOTM) call Deep in-the-money (DITM) put
Mn > 1.10
In particular, the 40,952 index call option and 39,242 index put option
contracts in the data set are assigned to five groups according to moneyness and nine
groups according to the number of days left to expiration, i.e. 45 groups. Time to
maturity is measured as the number of calendar days between the trade date and the
expiration date. Similarly, the 66,860 stock call option and 43,707 stock put option
contracts are placed into five groups according to moneyness and six groups
according to the number of days left to expiration, i.e. 30 groups. Since stock
options with time to maturity larger than 50 days are not traded as frequently as
other stock options with shorter life. These stock options are assigned to one
expiration interval. Within each group the average implied volatility is calculated. It

Implied Volatility Structure and Forecasting Efficiency: Evidence from Indian Option Market
~ Chapter 4 ~ 107
is necessary to mention that there is an implicit assumption when taking average in
each group, as suggested by Brown (1999), that the trends in implied volatility will
influence implied volatilities from options with different strike prices and different
maturities equally.
4.3 PATTERN IN IMPLIED VOLATILITY
In Table 4.4, the implied volatility of both index call and put options is
average over the moneyness groups. For index call options, the result indicates a
clear U-shaped smile pattern, with the lowest average implied volatility found for at-
the-money options. In the call option sample, the average implied volatility of the
category 1 option (DITM calls) is 52.29%, more than 7% higher than the average
implied volatility of category 5 options (DOTM calls), 48.76%.
For the put option, the average implied volatility of the category 5 option
(DITM puts) is 73%, more than 68% higher than the average implied volatility of
category 1 options (DOTM puts), 43.54%. The implied volatility of the ATM
options generally being lowest and symmetrically increasing with movement in
either direction. For the call options, the average implied volatility of the category 1
options (DITM calls) is 141% higher than average implied volatility of ATM
options. On the other end of the spectrum, the average implied volatility of category
5 options (DOTM calls) is 125% higher than the average implied volatility of ATM
options. For put option, the average implied volatility of the category 1 options
Implied Volatility Structure and Forecasting Efficiency: Evidence from Indian Option Market
~ Chapter 4 ~ 108
(DOTM puts) is 62% higher than the average implied volatility of ATM option
(category 3 options). On the other hand, the average implied volatility of category 5
options (DITM puts) is 172% higher than the average implied volatility of ATM
option (category 3 options). Index put option exhibits a skew shaped pattern. While
comparing to index call option, higher average implied volatility can be viewed in
index put option except DITM options.

Implied Volatility Structure and Forecasting Efficiency: Evidence from Indian Option Market
~ Chapter 4 ~ 109
TABLE 4.4
Average Implied Volatility of Index Option against Moneyness
This table displays implied volatilities, option premium, contract and number of observations of S&P CNX Nifty index option over the period from January 2002 to June 2010. Implied volatilities as well as premium are average into one of 5 groups of moneyness category. Moneyness category is defined as category 1 options for DITM call & DOTM put, category 2 options for ITM call & OTM put, category 3 options for ATM call & put, category 4 options for OTM call & ITM put and category 5 options for DOTM call & DITM put.
Category 1 2 3 4 5 Call Implied Volatility 0.5229 0.2496 0.2172 0.2700 0.4876 Option premium 581.03 183.49 77.08 50.06 22.05 Contract 247489 11573535 38641328 35290417 10075870 No. of Observation 1217 9884 13704 10361 5786 Put Implied Volatility 0.4354 0.2968 0.2687 0.3568 0.7300 Option premium 23.71 47.73 89.69 231.14 825.71 Contract 8019804 43548311 31043246 7487664 758719 No. of Observation 4945 15906 10944 5058 2389

Implied Volatility Structure and Forecasting Efficiency: Evidence from Indian Option Market
~ Chapter 4 ~ 110
CHART 4.1
Graphs of Index Option Average Implied Volatility against Moneyness
This figure illustrates the volatility structure implied by the S&P CNX Nifty index option over the period from January 2002 to June 2010. The 40,952 call option and 39,242 put option contracts in the data set are assigned to one of 5 groups of moneyness category. Average implied volatility is calculated for each group. Moneyness category is defined as category 1 options for DITM call & DOTM put, category 2 options for ITM call & OTM put, category 3 options for ATM call & put, category 4 options for OTM call & ITM put and category 5 options for DOTM call & DITM put.
Moneyness
0 1 2 3 4 5
Impl
ied
vola
tility
0.1
0.2
0.3
0.4
0.5
0.6
0.7
0.8
Call Put

Implied Volatility Structure and Forecasting Efficiency: Evidence from Indian Option Market
~ Chapter 4 ~ 111
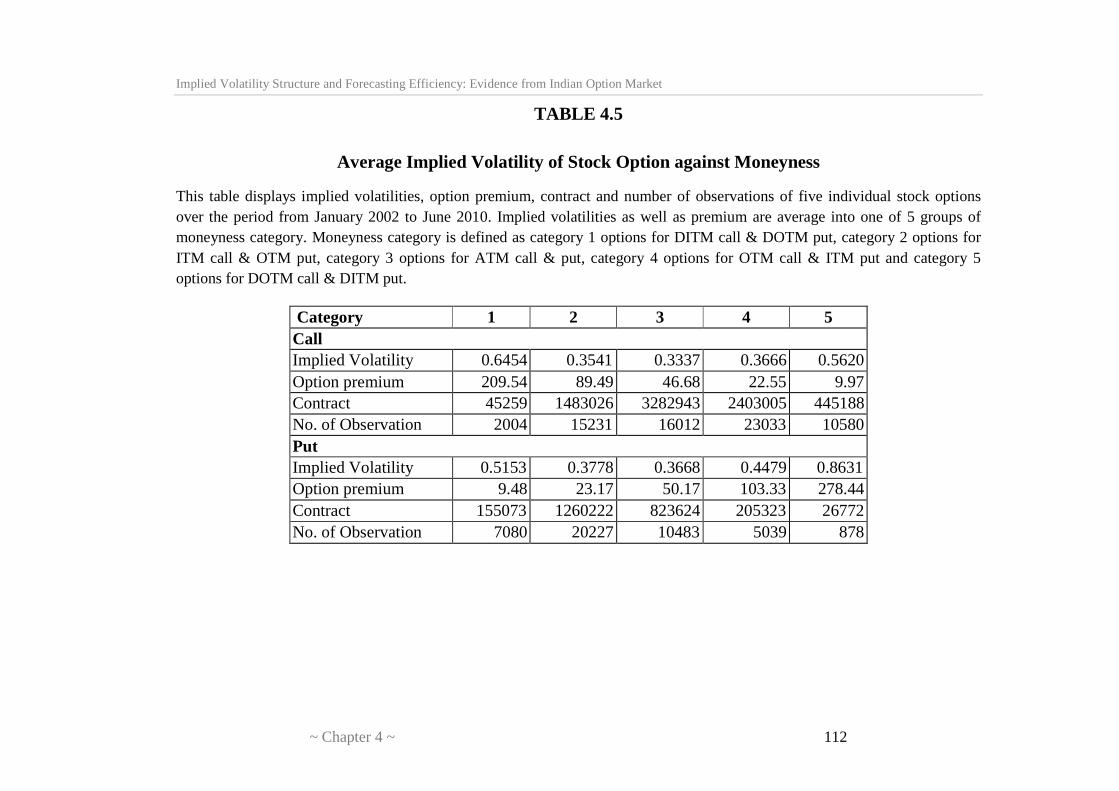
Table 4.5 contains the average implied volatilities of 5 individual stocks in
the sample. As the results in the table show, the implied volatilities of stock call and
put option exhibit U-shape and skew shape respectively. In stock call option, the
average implied volatility of the category 1 options (DITM calls) is 64.54%, more
than 15% higher than the average implied volatility of category 5 options (DOTM
calls), 56.20%. For the stock put option, the average implied volatility of the
category 5 options (DITM puts) is 86.31%, more than 68% higher than the average
implied volatility of category 1 options (DOTM puts), 51.53%.
For stock call options, the average implied volatility of the category 1 options
(DITM calls) is 93% higher than the average implied volatility of ATM options
(category 3 options). On the other end, the average implied volatility of category 5
options is 68% higher than the implied volatility of ATM options (category 3
options). In case of stock put options, the average implied volatility of category 1
options (DOTM puts) is 41% higher than the average implied volatility of the ATM
options (category 3 options). On the other side, the average implied volatility of
category 5 options (DITM puts) is 135% higher than the average implied volatility
of ATM options (category 3 options).
Implied Volatility Structure and Forecasting Efficiency: Evidence from Indian Option Market
~ Chapter 4 ~ 112
TABLE 4.5
Average Implied Volatility of Stock Option against Moneyness
This table displays implied volatilities, option premium, contract and number of observations of five individual stock options over the period from January 2002 to June 2010. Implied volatilities as well as premium are average into one of 5 groups of moneyness category. Moneyness category is defined as category 1 options for DITM call & DOTM put, category 2 options for ITM call & OTM put, category 3 options for ATM call & put, category 4 options for OTM call & ITM put and category 5 options for DOTM call & DITM put.
Category 1 2 3 4 5 Call Implied Volatility 0.6454 0.3541 0.3337 0.3666 0.5620 Option premium 209.54 89.49 46.68 22.55 9.97 Contract 45259 1483026 3282943 2403005 445188 No. of Observation 2004 15231 16012 23033 10580 Put Implied Volatility 0.5153 0.3778 0.3668 0.4479 0.8631 Option premium 9.48 23.17 50.17 103.33 278.44 Contract 155073 1260222 823624 205323 26772 No. of Observation 7080 20227 10483 5039 878

Implied Volatility Structure and Forecasting Efficiency: Evidence from Indian Option Market
~ Chapter 4 ~ 113
CHART 4.2
Graphs of Stock Option Average Implied Volatility against Moneyness
This figure illustrates the volatility structure implied by the five selected individual stock options over the period from January 2002 to June 2010. The 66,860 stock call option and 43,707 stock put option contracts in the data set are assigned to one of 5 groups of moneyness category. Average implied volatility is calculated for each group. Moneyness category is defined as category 1 options for DITM call & DOTM put, category 2 options for ITM call & OTM put, category 3 options for ATM call & put, category 4 options for OTM call & ITM put and category 5 options for DOTM call & DITM put.
Moneyness
0 1 2 3 4 5
Impl
ied
vola
tility
0.3
0.4
0.5
0.6
0.7
0.8
0.9
Call Put

Implied Volatility Structure and Forecasting Efficiency: Evidence from Indian Option Market
~ Chapter 4 ~ 114
4.4 THREE DIMENSIONAL VIEW OF VOLATILITY STRUCTURE
To investigate the volatility structure further, three dimensional graphs of
implied volatilities against moneyness and time to maturity of the option are plotted
in Chart 4.3 and Chart 4.4 for index call and put options, respectively. This is done
by assigning all the options records under investigation to groups according to
moneyness and time to maturity, and then taking an average for implied volatilities
in each group. Tables 4.6 and 4.7 report the average implied volatility within each
group for index call and put options respectively.
The average implied volatilities differ for the different time to maturity
groups. For index call options, the longer the time left to maturity, the lower the
implied volatility tends to be each moneyness group. In addition, the shorter the time
left to maturity, the more pronounced the U-shape of the smile appears to be. This
pattern is something referred to as the options are dying smiling.
When time to maturity is greater than 30 days and less than 80 days, it is
expected deep out-of-the-money call options on average trade at higher implied
volatilities than deep in-the-money call options. But for short time period, implied
volatilities of deep in-the-money are higher than deep out-of-the-money implied
volatilities. This finding is similar to Duque & Lopes (2003) that the change in smile
shape as time to maturity dies out. This may be seen as in support of the expected
“wry grin” for long term options. But the “reverse grin” is deeply unexpected for
short-term options. In fact, the maturity approach changes the options smile
asymmetry, converting a “wry grin” typical for longer term series into a “reverse
Implied Volatility Structure and Forecasting Efficiency: Evidence from Indian Option Market
~ Chapter 4 ~ 115
grin” for nearly expiring options, with a more or less symmetric smile in a three
dimensional domain.
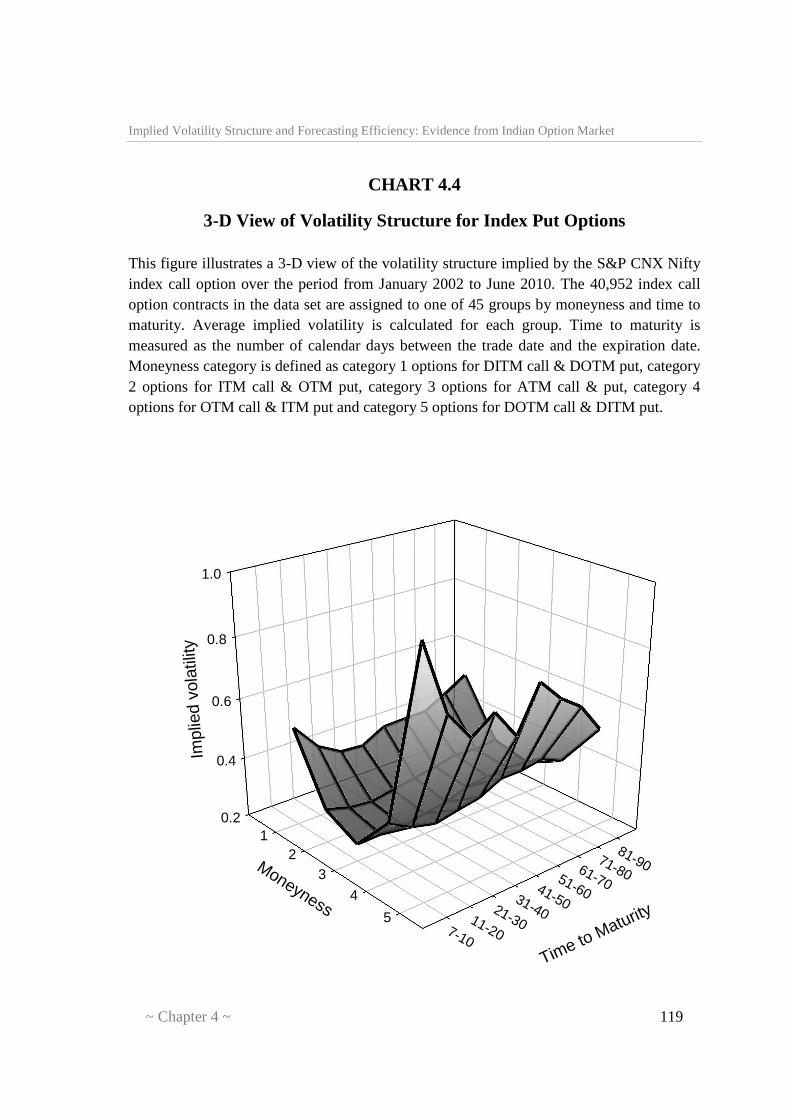
For the index put options, the shorter the time left to maturity, the more
pronounced U-shape of the smile appear to be. The deep in-the-money options on
average trade are higher implied volatilities than deep out-of-the-money options.
Longer the time left to maturity, the lower the implied volatilities tend to be in deep
in-the-money put options and more or less constant implied volatilities tend to be in
deep out-of-the-money.

Implied Volatility Structure and Forecasting Efficiency: Evidence from Indian Option Market
~ Chapter 4 ~ 116
TABLE 4.6
Group Average of Index Call Option Implied Volatilities with Respect of Moneyness and Time to Maturity
The table presents implied volatilities of S&P CNX Nifty index call option over the period from January 2002 to June 2010. The 40,952 index call option contracts in the data set are assigned to five groups according to moneyness and nine groups according to the number of days left to expiration, i.e. 45 groups. Average implied volatility is calculated for each group. Time to maturity is measured as the number of calendar days between the trade date and the expiration date. In parentheses the number of observations is given according to the moneyness and time to maturity of call options. Moneyness category is defined as category 1 options for DITM call & DOTM put, category 2 options for ITM call & OTM put, category 3 options for ATM call & put, category 4 options for OTM call & ITM put and category 5 options for DOTM call & DITM put.
Moneyness Category
Time to Maturity (days)
7-10 11-20 21-30 31-40 41-50 51-60 61-70 71-80 81-90 Total
1 0.7171 0.5554 0.4963 0.3731 0.4146 0.4035 0.3379 0.3568 0.3743 0.5229 (230) (323) (301) (146) (148) (50) (10) (5) (4) (1217)
2 0.3017 0.2569 0.2375 0.235 0.2401 0.2300 0.2277 0.2168 0.1992 0.2496 (1422) (2255) (2707) (1299) (1030) (608) (294) (180) (89) (9884)
3 0.2284 0.2217 0.2143 0.2146 0.2101 0.2112 0.2157 0.2188 0.2024 0.2172 (1912) (2871) (3432) (1864) (1526) (861) (515) (461) (262) (13704)
4 0.3092 0.2722 0.2580 0.2603 0.2627 0.2719 0.2689 0.2501 0.2512 0.2700 (1511) (2010) (2431) (1537) (1229) (584) (482) (402) (175) (10361)
5 0.6343 0.5078 0.4510 0.4776 0.4331 0.4429 0.4534 0.3896 0.3485 0.4876 (898) (1068) (1268) (879) (669) (417) (299) (175) (113) (5786)
Total 0.3461 0.2914 0.2690 0.2759 0.2698 0.2719 0.2791 0.2538 0.2420 0.2857
(5973) (8527) (10139) (5725) (4602) (2520) (1600) (1223) (643) (40952)

Implied Volatility Structure and Forecasting Efficiency: Evidence from Indian Option Market
~ Chapter 4 ~ 117
CHART 4.3
3-D view of Volatility Structure for Index Call Options This figure illustrates a 3-D view of the volatility structure implied by the S&P CNX Nifty index call option over the period from January 2002 to June 2010. The 40,952 index call option contracts in the data set are assigned to one of 45 groups by moneyness and time to maturity. Average implied volatility is calculated for each group. Time to maturity is measured as the number of calendar days between the trade date and the expiration date. Moneyness category is defined as category 1 options for DITM call & DOTM put, category 2 options for ITM call & OTM put, category 3 options for ATM call & put, category 4 options for OTM call & ITM put and category 5 options for DOTM call & DITM put.
0.0
0.2
0.4
0.6
0.8
12
34
57-10
11-2021-30
31-4041-50
51-6061-70
71-8081-90
Impl
ied
vola
tility
Moneyness
Time to Maturity

Implied Volatility Structure and Forecasting Efficiency: Evidence from Indian Option Market
~ Chapter 4 ~ 118
TABLE 4.7
Group Average of Index Put Option Implied Volatilities with Respect of Moneyness and Time to Maturity
This table presents implied volatilities of S&P CNX Nifty index put option over the period from January 2002 to June2010. The 39,242 put option contracts in the data set are assigned to five groups according to moneyness and nine groups according to the number of days left to expiration, i.e. 45 groups. Average implied volatility is calculated for each group. Time to maturity is measured as the number of calendar days between the trade date and the expiration date. In parentheses the number of observations is given according to the moneyness and time to maturity of call options. Moneyness category is defined as category 1 options for DITM call & DOTM put, category 2 options for ITM call & OTM put, category 3 options for ATM call & put, category 4 options for OTM call & ITM put and category 5 options for DOTM call & DITM put.
Moneyness Category
Time to Maturity (days)
7-10 11-20 21-30 31-40 41-50 51-60 61-70 71-80 81-90 Total
1 0.5299 0.4408 0.3965 0.3909 0.4317 0.4347 0.4360 0.4755 0.5200 0.4354
(802) (1129) (1414) (654) (493) (263) (111) (54) (25) (4945)
2 0.3111 0.2881 0.2796 0.2920 0.3054 0.3168 0.3335 0.3271 0.3347 0.2968
(2236) (3503) (4198) (1981) (1646) (1064) (610) (433) (235) (15906)
3 0.2581 0.2601 0.2579 0.2689 0.2799 0.3029 0.3126 0.3160 0.3097 0.2687
(1644) (2438) (2886) (1450) (1125) (598) (344) (294) (165) (10944)
4 0.3923 0.3503 0.3305 0.3453 0.3577 0.3933 0.3936 0.4058 0.3724 0.3568
(797) (1111) (1241) (776) (85) (247) (150) (97) (54) (5058)
5 0.9869 0.7558 0.6594 0.7117 0.6132 0.7556 0.6812 0.6313 0.5343 0.7300
(344) (397) (554) (373) (256) (181) (132) (90) (62) (2389)
Total 0.3773 0.3299 0.3161 0.3358 0.3402 0.3683 0.3774 0.3682 0.3623 0.3405
(5823) (8578) (10293) (5234) (4105) (2353) (1347) (968) (541) (39242)
Implied Volatility Structure and Forecasting Efficiency: Evidence from Indian Option Market
~ Chapter 4 ~ 119
CHART 4.4
3-D View of Volatility Structure for Index Put Options This figure illustrates a 3-D view of the volatility structure implied by the S&P CNX Nifty index call option over the period from January 2002 to June 2010. The 40,952 index call option contracts in the data set are assigned to one of 45 groups by moneyness and time to maturity. Average implied volatility is calculated for each group. Time to maturity is measured as the number of calendar days between the trade date and the expiration date. Moneyness category is defined as category 1 options for DITM call & DOTM put, category 2 options for ITM call & OTM put, category 3 options for ATM call & put, category 4 options for OTM call & ITM put and category 5 options for DOTM call & DITM put.
0.2
0.4
0.6
0.8
1.0
12
3
4
57-10
11-20
21-30
31-40
41-50
51-60
61-70
71-80
81-90
Impl
ied
vola
tility
Moneyness
Time to Maturity

Implied Volatility Structure and Forecasting Efficiency: Evidence from Indian Option Market
~ Chapter 4 ~ 120
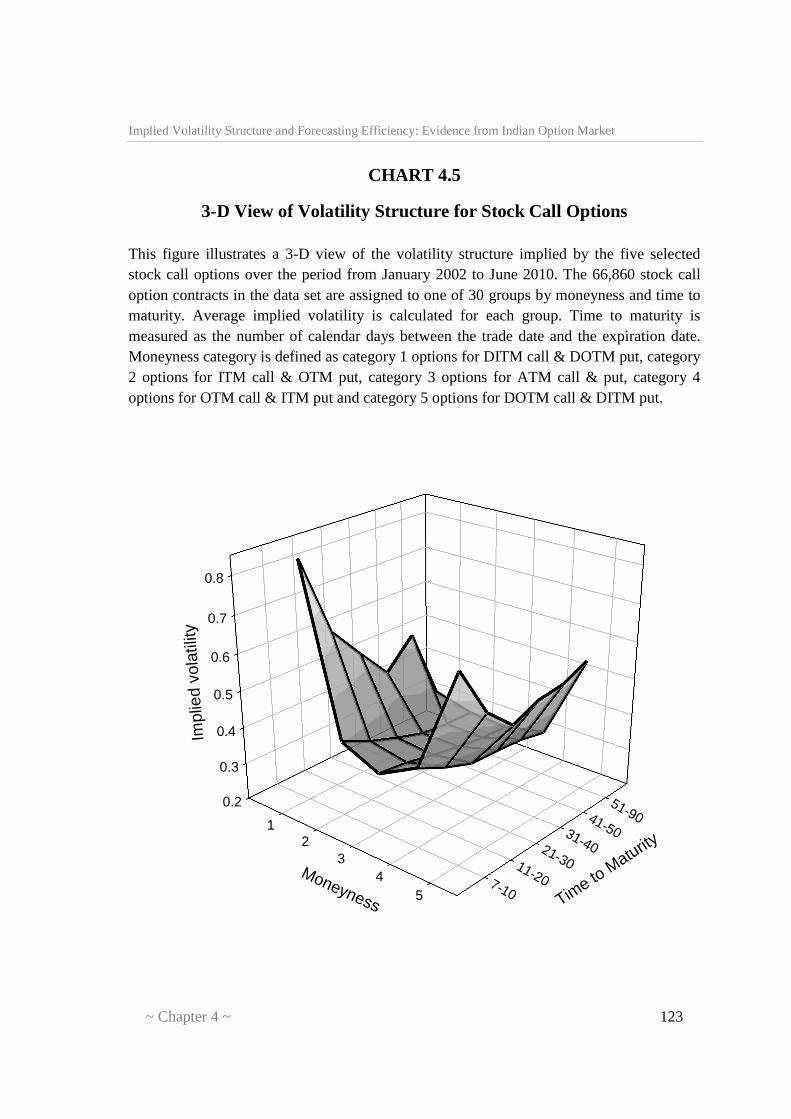
In Table 4.8, the implied volatilities for five selected stock call options are
averaged over the five groups of moneyness and six groups of time to maturity i.e.
30 groups. Since stock options with time to maturity larger than 50 days are not
traded as frequently as other stock options with shorter life. These stock options are
assigned into one maturity interval. Within each group the average implied volatility
is calculated. The results indicate a clear U-shape smile pattern, with lowest average
implied volatility found for the at-the-money in all the groups. When time to
maturity is greater than 30 days, it is expected deep out-of-the-money stock call
options on average trade at higher implied volatilities than deep in-the-money stock
call options. But for short time period, implied volatilities of deep in-the-money are
higher than deep out-of-the-money implied volatilities. The volatility term structure
of stock call option is similar to that of index call option. That is, the term structure
is similar to Duque & Lopes (2003) that the change in smile shape as time to
maturity dies out. This may be seen as in support of the expected “wry grin” for long
term options. But the “reverse grin” is deeply unexpected for short-term options. In
fact, the maturity approach changes the options smile asymmetry, converting a “wry
grin” typical for longer term series into a “reverse grin” for nearly expiring options,
with a more or less symmetric smile in a three- dimensional domain (Chart 4.5).
For the stock put option, the Table 4.9 and Chart 5.6 show, the shorter the
time left to maturity, the more pronounced U-shape of the smile appears to be. The
deep in-the-money options on average trade are higher implied volatilities than deep
out-of-the-money options. Longer the time left to maturity, the lower the implied

Implied Volatility Structure and Forecasting Efficiency: Evidence from Indian Option Market
~ Chapter 4 ~ 121
volatilities tend to be in deep in-the-money stock put options and more or less
constant implied volatilities tend to be in deep out-of-the-money. The volatility term
structure of stock put option is similar to that of index put option. That is, the term
structure is close to be flat for at-the-money stock put options, and tends to be
fluctuant for deep in-the-money option.

Implied Volatility Structure and Forecasting Efficiency: Evidence from Indian Option Market
~ Chapter 4 ~ 122
TABLE 4.8
Group Average of Stock Call Option Implied Volatilities with Respect of Moneyness and Time to Maturity
This table presents implied volatilities of five selected stock call option over the period from January 2002 to June 2010. The 66,860 stock call option contracts in the data set are assigned into five groups according to moneyness and six groups according to the number of days left to expiration, i.e. 30 groups. Average implied volatility is calculated for each group. Time to maturity is measured as the number of calendar days between the trade date and the expiration date. In parentheses the number of observations is given according to the moneyness and time to maturity of stock call options. Moneyness category is defined as category 1 options for DITM call & DOTM put, category 2 options for ITM call & OTM put, category 3 options for ATM call & put, category 4 options for OTM call & ITM put and category 5 options for DOTM call & DITM put.
Moneyness Category
Time to Maturity (days)
7-10 11-20 21-30 31-40 41-50 51-90 Total
1 0.8435 0.6293 0.5393 0.4533 0.5297 0.3307 0.6454
(536) (682) (626) (113) (39) (8) (2004)
2 0.4035 0.3669 0.3386 0.3146 0.3048 0.304 0.3541
(2783) (4542) (5202) (1847) (665) (192) (15231)
3 0.3578 0.3478 0.3296 0.3152 0.3035 0.2982 0.3337
(2610) (4002) (5139) (2701) (1278) (282) (16012)
4 0.4157 0.3784 0.3498 0.3456 0.3395 0.323 0.3666
(3921) (5952) (7475) (3722) (1630) (333) (23033)
5 0.6954 0.56 0.491 0.5214 0.5293 0.5595 0.562
(2328) (2922) (3244) (1393) (531) (162) (10580)
Total 0.4728 0.4075 0.3689 0.3576 0.349 0.3514 0.3951
(12178) (18100) (21686) (9776) (4143) (977) (66860)
Implied Volatility Structure and Forecasting Efficiency: Evidence from Indian Option Market
~ Chapter 4 ~ 123
CHART 4.5
3-D View of Volatility Structure for Stock Call Options This figure illustrates a 3-D view of the volatility structure implied by the five selected stock call options over the period from January 2002 to June 2010. The 66,860 stock call option contracts in the data set are assigned to one of 30 groups by moneyness and time to maturity. Average implied volatility is calculated for each group. Time to maturity is measured as the number of calendar days between the trade date and the expiration date. Moneyness category is defined as category 1 options for DITM call & DOTM put, category 2 options for ITM call & OTM put, category 3 options for ATM call & put, category 4 options for OTM call & ITM put and category 5 options for DOTM call & DITM put.
0.2
0.3
0.4
0.5
0.6
0.7
0.8
12
34
57-10
11-20
21-30
31-40
41-50
51-90
Impl
ied
vola
tility
Moneyness Time to M
aturity

Implied Volatility Structure and Forecasting Efficiency: Evidence from Indian Option Market
~ Chapter 4 ~ 124
TABLE 4.9
Group Average of Stock Put Option Implied Volatilities with Respect of Moneyness and Time to Maturity
This table presents implied volatilities of five selected stock put option over the period from January 2002 to June 2010. The 43,707 stock put option contracts in the data set are assigned to five groups according to moneyness and six groups according to the number of days left to expiration, i.e. 30 groups. Average implied volatility is calculated for each group. Time to maturity is measured as the number of calendar days between the trade date and the expiration date. In parentheses the number of observations is given according to the moneyness and time to maturity of stock put options. Moneyness category is defined as category 1 options for DITM call & DOTM put, category 2 options for ITM call & OTM put, category 3 options for ATM call & put, category 4 options for OTM call & ITM put and category 5 options for DOTM call & DITM put.
Moneyness category
Time to Maturity (days)
7-10 11-20 21-30 31-40 41-50 51-90 Total
1 0.6122 0.5257 0.4735 0.4454 0.4561 0.4250 0.5153
(1471) (2214) (2538) (667) (152) (38) (7080)
2 0.4056 0.3849 0.3686 0.3525 0.3582 0.3494 0.3778
(3771) (5931) (7173) (2529) (735) (88) (20227)
3 0.3784 0.3740 0.3639 0.3476 0.3361 0.3224 0.3668
(2120) (3097) (3588) (1302) (346) (30) (10483)
4 0.4847 0.4504 0.4271 0.4082 0.3887 0.3952 0.4479
(1331) (1684) (1522) (413) (81) (8) (5039)
5 1.0955 0.8530 0.6628 0.6627 0.7256 0.5918 0.8631
(277) (292) (223) (68) (13) (5) (878)
Total 0.4661 0.4246 0.3955 0.3725 0.3691 0.3710 0.4153
(8970) (13218) (15044) (4979) (1327) (169) (43707)

Implied Volatility Structure and Forecasting Efficiency: Evidence from Indian Option Market
~ Chapter 4 ~ 125
CHART 4.6
3-D View of Volatility Structure for Stock Put Options This figure illustrates a 3-D view of the volatility structure implied by the five selected stock put options over the period from January 2002 to June 2010. The 43,707 stock put option contracts in the data set are assigned to one of 30 groups by moneyness and time to maturity. Average implied volatility is calculated for each group. Time to maturity is measured as the number of calendar days between the trade date and the expiration date. Moneyness category is defined as category 1 options for DITM call & DOTM put, category 2 options for ITM call & OTM put, category 3 options for ATM call & put, category 4 options for OTM call & ITM put and category 5 options for DOTM call & DITM put.
0.2
0.4
0.6
0.8
1.0
1.2
12
34
5 7-10
11-20
21-30
31-40
41-50
51-90
Impl
ied
vola
tility
Moneyness
Time to Maturity
Implied Volatility Structure and Forecasting Efficiency: Evidence from Indian Option Market
~ Chapter 4 ~ 126
4.5 CONCLUSION
In this chapter, the volatility structure implied by S&P CNX Nifty option
and selected five individual stock options are illustrated by two dimensional
graphs of implied volatility against moneyness and three dimensional graphs of
implied volatility against both moneyness and time to maturity. It is found that
the ‘U’ pattern is more pronounced for the call and put options implied
volatilities. For both call and put option, deep in-the-money is higher than deep
out-of-the-money implied volatilities.
In accordance with time left to maturity, the implied volatility of deep in-
the-money call options is higher than deep out-of-the-money for shorter time left
to maturity. Implied volatility of deep out-of-the money call options is higher
than deep in-the-money for longer time left to maturity. In case of put options,
the shorter the time left to maturity, deep in-the-money options are higher than
deep out-of-the-money. Longer the time left to maturity, the deep in-the-money
options implied volatilities tend to decrease monotonically. The term structure
of implied volatility is nearly flat of at-the-money call and put options, both more
fluctuant for deep in-the-money and deep out-of-the-money options.

Implied Volatility Structure and Forecasting Efficiency: Evidence from Indian Option Market
~ Chapter 4 ~ 127
In general, these results indicate that the Black-Scholes-Merton model
applied in this study tends to overprice in-the-money call options and out-of-the-
money put options and underprice in-the-money put option and out-of-the-money
call options. At-the-money options are often most actively traded and hence they
are less likely to be mispriced.