Embed Size (px)
Citation preview

J B GUPTA CLASSES 98184931932, [email protected],
www.jbguptaclasses.com
Copyright: Dr JB Gupta
Chapter 4Chapter 4Chapter 4Chapter 4
RISK AND RETURN RISK AND RETURN RISK AND RETURN RISK AND RETURN
Chapter IndexChapter IndexChapter IndexChapter Index
� Systematic and Unsystematic Risk
� Capital Asset Pricing Model
� Portfolio Theory
(a) Reducing the Risk of a Portfolio
(b) Enhancing the Risk of a Portfolio
(c) Hedging the Portfolio
(d) Modern Portfolio Theory
� Some More Aspects Of “Risk And Return
(a) EFFICIENT MARKET HYPOTHESIS
(b) Alpha
(c) Characteristic Line
(d) Security Market Line (SML)
(e) Capital Market Line (CML)
(f) Market Model
(g) Matrix Approach In Investment Decisions
� General Problems
� INTERNATIONAL INVESTING
� ARBITRAGE PRICING THEORY (APT)
� SHARPE INDEX MODEL (Including Optimal Portfolio)
� Extra Practice (Must Do)
� Extra Practice (Optional)
� Theoretical Aspects
(a) Systematic and Unsystematic Risk
(b) Capital Asset Pricing Model
(c) Portfolio Management
(d) Equity Style Management
(e) Arbitration Operation

2
� Appendix A : SD And Variance
� Appendix B : Derivation For Minimum Variance Formula
The value of investment is determined by risk and return, i.e., value of an investment
is a function of the expected size and riskiness of return from it. Investors prefer
larger returns to smaller returns, hence risk remaining the same, larger the expected
return higher the investment value and vice-versa. They dislike risk. This dislike for
risk is termed as risk-aversion. The degree of risk-aversion differs among investors
and from time to time. The relation between degree of risk-aversion and investment
value is negative, i.e. as the degree of risk-aversion increases, the value of
investment decreases and vice versa.
Return comprises the income, which is in the form of dividends or interest, and the
capital gain (loss). Return is calculated with the help of wealth ratio
[Income from the investment during a period + value of
the investment at the end of the period]
Wealth Ratio = --------------------------------------------
Net Amount Invested in the beginning of period.
Q. No.1(a): Q. No.1(a): Q. No.1(a): Q. No.1(a): On 1.1.2003, Madhavji purchased an equity share of Mathura Ltd. at a
Cum Dividend price of Rs.107 per share. The company paid a dividend of Rs.5 Per
share for the year 2002. In October, 2003, the company paid an interim dividend of
Rs.10 per share . On 31st December, 2003, the market price per share was Rs.120
(cum – dividend price including final dividend of Rs5 per share). Find the return on
investment for the year 2003.
Answer : Answer : Answer : Answer :
10 + 120
Wealth ratio : -------------- = 1.2745
107 –5
Return = 0.2745 i.e. 27.45%
Q.No.1 (b): Q.No.1 (b): Q.No.1 (b): Q.No.1 (b): On 1.1.2004, Keshavji purchased an equity share of Dwarka Ltd at a
cum-dividend price of Rs.120 per share. The paid a dividend of Rs.5 per share for
the year 2003. The company paid an interim dividend of Rs.5 per share in August,
2004 and another interim dividend of Rs.4per share on 10th October, 2004. On 31st
December, 2004, the market price per share was Rs.140 (cum – dividend price
including final dividend of Rs6 per share). Find the return on investment for the
year 2004.
AnswerAnswerAnswerAnswer
5 + 4 +140

3
Wealth ratio : -------------- = 1.2957
120 –5
Return = 0.2957 i.e. 29.57%
Q. No.1 (c): Q. No.1 (c): Q. No.1 (c): Q. No.1 (c): Continuing with example (b), the company paid an interim dividend of
Rs.6 per share in August, 2005 and another interim dividend of Rs.5 per share on
10th November, 2005. On 31st December, 2005, the market price per share was
Rs.140 (cum – dividend price including final dividend of Rs7 per share). Find the
return on investment for year 2005.
Answer :Answer :Answer :Answer :
6 + 5 +140
Wealth ratio : -------------- = 1.1269
140 –6
Return = 0.1269 i.e. 12.69 %
Risk refers to the possibility that the expected return may not materialize. There
may be loss of capital, i.e. investment has to be sold for an amount less than paid for
it. There may be no income from investment or the income may be less than the
expected. The natural query is “Why the investors go for risky investment”? The
answer is that the desire for higher return entices them to go for risky investments.
Investment decision should be taken after considering both return and risk. How to
measure the risk? Standard deviation of various possible rates of return is used to
measure the risk? Larger the standard deviation, greater the risk, and vice versa.
How to take investment decisions when various opportunities are there? Here two
sets of 3 total rules provide help to us. These rules are:
SET A : (i) If expected returns from various securities are different but their standard
deviations are same: Decision should be taken on the basis of expected
returns. Security with higher expected return is preferred.
(ii) If expected returns from various securities are same but their standard
deviations are different: Decision should be taken on the basis of standard
deviations. Security with lower standard deviation should be preferred.
SET B :
(iii) If expected returns as well as standard deviations from various securities
are different, decision should be taken on the basis of coefficient of
4
variation. Coefficient of variation is obtained by dividing standard deviation
by expected return. Coefficient of variation defines risk as standard
deviation per rupee of expected return. Security with lower coefficient of
variation is preferred.
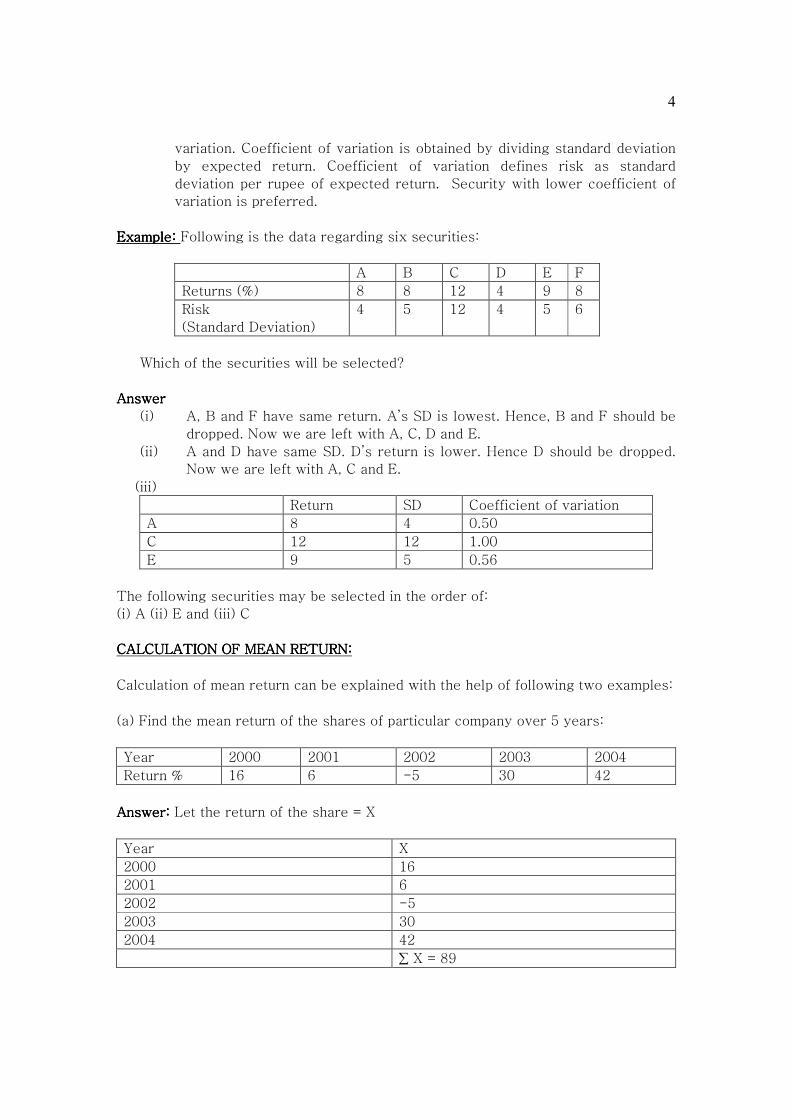
Example:Example:Example:Example: Following is the data regarding six securities:
A B C D E F
Returns (%) 8 8 12 4 9 8
Risk
(Standard Deviation)
4 5 12 4 5 6
Which of the securities will be selected?
Answer Answer Answer Answer
(i) A, B and F have same return. A’s SD is lowest. Hence, B and F should be
dropped. Now we are left with A, C, D and E.
(ii) A and D have same SD. D’s return is lower. Hence D should be dropped.
Now we are left with A, C and E.
(iii)
Return SD Coefficient of variation
A 8 4 0.50
C 12 12 1.00
E 9 5 0.56
The following securities may be selected in the order of:
(i) A (ii) E and (iii) C
CALCULATION OF MEAN RETURN:CALCULATION OF MEAN RETURN:CALCULATION OF MEAN RETURN:CALCULATION OF MEAN RETURN:
Calculation of mean return can be explained with the help of following two examples:
(a) Find the mean return of the shares of particular company over 5 years:
Year 2000 2001 2002 2003 2004
Return % 16 6 -5 30 42
Answer: Answer: Answer: Answer: Let the return of the share = X
Year X
2000 16
2001 6
2002 -5
2003 30
2004 42
∑ X = 89

5
Mean = ∑X/n = 89/ 5 = 17.80
(b) Find the mean return of the shares of a company:
Return % 16 6 -5 30 42
Probability 0.10 0.20 0.40 0.20 0.10
Teaching noteTeaching noteTeaching noteTeaching note:::: (the mean return calculated in this case, i.e. when probabilities
are given, is also known as expected return. In fact, expected return, calculated
on the basis of probabilities, is weighted average mean return, weights being
probabilities.)
Answer: Answer: Answer: Answer: Let the return of the share = X
X Probability ( p) pX
16 0.10 1.60
6 0.20 1.20
-5 0.40 -2.0
30 0.20 6.00
42 0.10 4.20
∑p = 1 ∑ pX =11
Mean return = ∑pX/ ∑p = 11 / 1 = 11
CALCULATION OF STANDARD DEVIATIONCALCULATION OF STANDARD DEVIATIONCALCULATION OF STANDARD DEVIATIONCALCULATION OF STANDARD DEVIATION
SD measures the variation in the values of the variable. In financial management, it is
used as the measurement of the risk. The absolute values of the SDs do not convey
any meaning. (For example, if the SD of returns of a particularly investment over 5
year is 20, it do not convey any meaning). If we are given SDs of two or more
investments; from their comparison we can rank them of the basis of the risk
involved. (Suppose, there are three investment opportunities- A, B and C with SDs
being 10, 15 and 12 respectively. From this information, we can conclude that B has
maximum risk, A has minimum risk; C’s risk is more than that of A and less than that
of B).
Variance is also a measurement of risk. Variance is (SD)2. The absolute values of
the Variances do not convey any meaning. When used for comparison purpose,
variances give the same result as is given by SDs.
(Suppose, there are three investment opportunities- A, B and C with SDs being 10,
15 and 12 respectively. From this information, we can conclude that B has
maximum risk, A has minimum risk; C’s risk is more than that of A and less than

6
that of B. If we calculate the variances for A, B and C, the values would be 100,
225 and 144 respectively. If rank the three investments on the basis of risk, our
conclusion is same and that is : A has minimum risk; B has maximum risk, and C’s
risk is more than that of A and less than that of B).
Calculation of Standard deviations can be explained with the help of following two
examples:
Example (a)Example (a)Example (a)Example (a) Find the SD of the rate of returns on the shares of particular company
over five years :
Year 2000 2001 2002 2003 2004
Rate of return (%) 10 20 -5 12 13
AnswerAnswerAnswerAnswer
Let the rate of return (%) = X
X x x
2
2000 10 0 0
2001 20 10 100
2002 -5 -15 225
2003 12 2 4
2004 13 3 9
∑X = 50 338
Mean = = = = ∑X / n = 50 / 5 = 10
SD = √(∑ x2/n) = √(338/5) = √(67.20) = 8.22
Example Example Example Example (b)(b)(b)(b) Find the SD of the rate of returns on the shares of particular co.:
Rate of Return(
%)
10 20 30 20 10
Prob. 0.10 0.20 0.40 0.20 0.10
Answer: Answer: Answer: Answer: Let the rate of return (%) = X
X P Px x x2 px2
10 .10 1 -12 144 14.40
20 .20 4 -2 4 0.80
30 .40 12 8 64 25.6
20 .20 4 -2 4 0.80
10 .10 1 -12 144 14.40
∑pX =22 ∑ x2 = 360 ∑px2 =56
Mean = ∑pX/ ∑p = 22/1 =22 SD = √(∑px2/∑p) = √(56/1) = 7.48

7
COEFFICIENT OF VARIATIONCOEFFICIENT OF VARIATIONCOEFFICIENT OF VARIATIONCOEFFICIENT OF VARIATION
= (SD/mean) x 100. It refers to the risk per rupee of return. For example, if the
coefficient of variation is 20%, it means for earning an income of rupee one, the
investor has to take the risk of loss of Re.0.20. Moderate investors1 take decisions
on the basis of coefficient of variation. Lower coefficient of variation is preferred by
such investors.
Q. No.2Q. No.2Q. No.2Q. No.2: Shares A and B have the following probability distributions of possible
future returns.
Probability A(%) B (%)
0.1 16 -20
0.2 06 10
0.4 -5 20
0.2 30 30
0.1 42 50
Calculate the expected rate of return for each share and standard deviation for each
share. Calculate coefficient of variation for each share. Which share would you
prefer?
AnswerAnswerAnswerAnswer
(Company A)
Let return is denoted by X:
X p pX x px2
16 0.10 1.60 5 2.50
06 0.20 1.20 -5 5.00
-5 0.40 -2.0 -16 102.40
30 0.20 6.00 19 72.20
42 0.10 4.20 31 96.10
∑p = 1 ∑pX = 11 ∑px2 =278.20
Mean = ∑pX/ ∑p =11/1=11 SD = √(∑px2/∑p) = √(278.20/1) = 16.68
Coefficient of variation = 16.68/11 = 1.52
Similar calculations for B reveals: (Mean 19; S.D. 17; C. of V 0.89.)
Share B may be preferred because of lower amount of Coefficient of variation.
Q. No. 3: Q. No. 3: Q. No. 3: Q. No. 3: Following information is available in respect of dividend, Market price and
market condition after one year:
Market condition Probability Market price Dividend per share
1 Moderate investors take the investment decisions after considering both risk and return. Such
investors neither go for wild investment opportunities (i.e. investment opportunities which are
likely to offer very high returns and also involving very high risk) nor do they go for investment
opportunities with very low risk witch offer very low return.

8
Good 0.25 115 9
Normal 0.50 107 5
Bad 0.25 97 3
The existing market price of an equity share is Rs.106 ( FV Re.1) which is cum 10%
bonus debenture of Rs.6 per share. M/s X Finance Company Ltd has offered the buy
back of debenture at face value. Find out the expected return and variability of
returns of the equity shares. And also advise : whether to accept buy back offer?
(NOV. 2005)(NOV. 2005)(NOV. 2005)(NOV. 2005)
AnswerAnswerAnswerAnswer
Market
condition
Wealth ratio r % (X) p pX px2
Good (115+9)/100 24 .25 6 36
Normal (107+5)/100 12 .50 6 0
Bad (97+3)/100 0 .25 0 36
12 72
Expected Return = 12 Variability of returns i.e. SD = √(72) = 8.49
If If If If the coupon rate of the debenture exceeds current market interest rate, MV of the
debenture will be more than the face value. In this scenario, the buy back offer
should not accepted. Either the investor may hold the debenture and earn interest at
a rate higher than the market, or he may sell in the open market where he/she will
get more value than the face value.
IfIfIfIf the coupon rate of the debenture is less than the current market interest rate, MV
of the debenture will be lower than the face value. In this scenario, the buy back
offer should be accepted.
SYSTEMATIC AND UNSYSTEMATIC RISKSYSTEMATIC AND UNSYSTEMATIC RISKSYSTEMATIC AND UNSYSTEMATIC RISKSYSTEMATIC AND UNSYSTEMATIC RISK
Systematic risk refers to variability in return on investment due to market factors
that affect all investments in a similar fashion. Examples of such factors are: Level
of economic activities (recession or boom), variation in interest rates, inflation,
political developments, etc. Unsystematic risk arises from such factors which are
concerned with the firm. This risk is unique to a particular security. Examples are:
strike, change in management, special export order, etc. (Unsystematic risk is also
referred as firm-specific risk, it is denoted by ei) Unsystematic risk is called as
diversifiable risk as it can be reduced with the help of diversification, i.e. instead of
investing in the shares of one company, one may invest in the shares of various
companies. Systematic risk is non-diversifiable; it cannot be reduced through
diversification. All equity investors have to bear this risk.
The total risk, both systematic and unsystematic risk, of a security or portfolio is
measured by the standard deviation.

9
Teaching noteTeaching noteTeaching noteTeaching note :::: Market portfolio (a portfolio of all the securities quoted in the
stock exchange) has to bear only systematic risk. Market portfolio is a very well
diversified portfolio. The unsystematic risk of the investment in the market
portfolio is eliminated through diversification.
• Total risk of market portfolio = Systematic risk of market portfolio
• Unsystematic risk of market portfolio = 0
BETABETABETABETA
Beta is an indicator of an investment’s systematic risk. It represents systematic risk
associated with an investment in relation to total risk associated with market
portfolio. (If the Beta of a security is 1.50, it does not mean that the systematic risk
of the security is 1.50; it simply means that the security is 1.50 times riskier as
compared to the market as a whole). Suppose the beta value of a particular security
is 1.20, it means that if return of market portfolio varies by one per cent, the return
from that security is likely to vary by 1.20 per cent. Therefore, this security is
riskier than the market because we expect its return to fluctuate more than the
market on a percentage basis. This beta measures the riskiness of individual security
relative to market portfolio. It is a ratio of “its covariance with the market” to “the
variance of market as a whole”. A security with beta greater than one is called as
aggressive security; with beta less than one is called as defensive security and with
beta equal to one is called as neutral security.
Covariance between returns from market
Portfolio and those from particular security
Beta = -------------------------------------
Variance of market portfolio
Beta of market portfolio is taken as 1.
Covariance Covariance Covariance Covariance : It is a statistical measurement that measures the combined variation
(co-vary) between two variables; (that is, more or less when one of them is above
its mean value, then the other variable tends to be above its mean value too, then
the covariance between the two variables will be positive. On the other hand, if
one of them is above its mean value and the other variable tends to be below its
mean value, then the covariance between the two variables will be negative). In
the Financial Management, it is used to measure the co-movements between
return from ‘market’ and that from a particular security or portfolio. The range of
covariance values is unrestricted (unlike the coefficient of correlation which is
restricted to ± 1.)
10
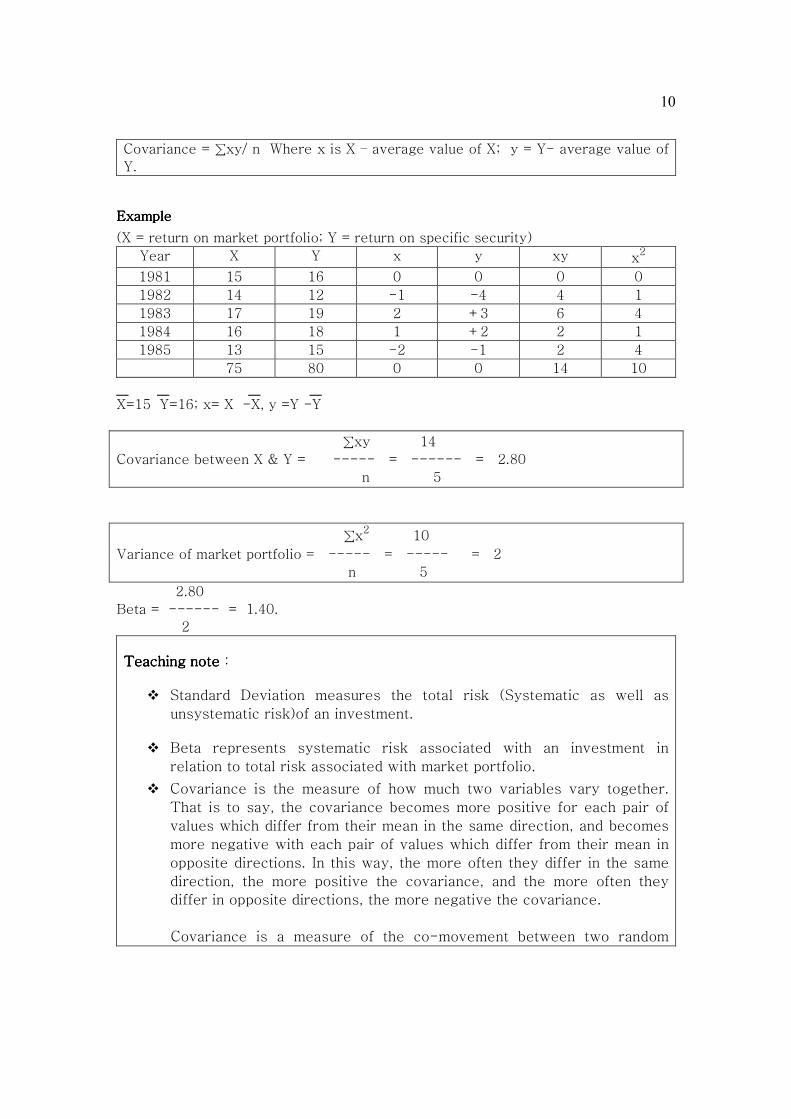
Covariance = ∑xy/ n Where x is X – average value of X; y = Y- average value of
Y.
ExampleExampleExampleExample
(X = return on market portfolio; Y = return on specific security)
Year X Y x y xy x2
1981 15 16 0 0 0 0
1982 14 12 -1 -4 4 1
1983 17 19 2 +3 6 4
1984 16 18 1 +2 2 1
1985 13 15 -2 -1 2 4
75 80 0 0 14 10
X=15 Y=16; x= X -X, y =Y -Y
∑xy 14
Covariance between X & Y = ----- = ------ = 2.80
n 5
∑x2 10
Variance of market portfolio = ----- = ----- = 2
n 5
2.80
Beta = ------ = 1.40.
2
Teaching noteTeaching noteTeaching noteTeaching note :
� Standard Deviation measures the total risk (Systematic as well as
unsystematic risk)of an investment.
� Beta represents systematic risk associated with an investment in
relation to total risk associated with market portfolio.
� Covariance is the measure of how much two variables vary together.
That is to say, the covariance becomes more positive for each pair of
values which differ from their mean in the same direction, and becomes
more negative with each pair of values which differ from their mean in
opposite directions. In this way, the more often they differ in the same
direction, the more positive the covariance, and the more often they
differ in opposite directions, the more negative the covariance.
Covariance is a measure of the co-movement between two random

11
variables.
A negative covariance means that variables move in different directions.
A positive covariance means they move in the same direction.
Covariance can range from negative infinity to positive infinity. Covariance is
an absolute measure. Covariances cannot be compared with one another.
� Coefficient of correlation = [Covariance) / (SDx....SDy)]
Coefficient of Correlation ( r ) states relationship between two variables; the
two variables may be return from two securities, or return from market
portfolio and return from a security, rainfall and agriculture output, inflation
and interest rate etc. r is always between -1 to + 1.
If r = +1, it means that both the series are moving I n the same direction and
with the same percentage. For example, if one increases by 10%, the other
also increases by 10%.
If decreases by 10%, the other also decreases by 10%; and so on.
If r = -1, it means both the series move with same percentage but in the
reverse direction. For example, if one increase by 10%, the other decreases by
10%.
The other positive values of r indicate that more or less both the series move
in the same direction (if one increased, the other also increases; if one
decreases the other also decreases) but the rates of changes are different. For
example, if increases by 5%, the other may increase by 2%.
The other negative values of r indicate that more or less both the series move
in the reverse direction (if one increases, the other decreases; if one
decreases the other increases) and the rates of changes are different. For
example, if increases by 5%, the other may decrease by 2%.
Q..No.4. Q..No.4. Q..No.4. Q..No.4. Using the following data regarding two securities C and D, find which of the
two securities is more risky? Why?
C D
Average return 15% 18%
Standard deviation of returns of past 0.20 0.15
Correlation coefficient with market 0.50 0.80
Beta 0.65 0.78
Find market portfolio variance.
Answer: Answer: Answer: Answer: Security C is more risky as its SD (which is a measurement of total risk) is
greater than that of D

12
Correlation = [(covariance)]/ [(market SD) (0.20)]
0.50 =[( covariance ) ]/ [(market SD) (0.20)]
0.10 = covariance / market SD …………(1)
Beta = covariance / (Market SD)2
0.65 = covariance / (Market SD)2 ………(2)
Solving the two equations, Market SD = 0.1538
Market variance :0.023669
TOTAL RISK OF AN INVESTMENT TOTAL RISK OF AN INVESTMENT TOTAL RISK OF AN INVESTMENT TOTAL RISK OF AN INVESTMENT
Total risk of an investment, which is variance (or standard deviation) of its return,
can be divided into two parts:
Total risk = Systematic risk + unsystematic risk
Systematic risk can be measured with the help of Beta (Beta indicates the riskiness
of an investment, it relation to market portfolio.)
(i) Systematic Risk of an investment =
Beta of that investment x Market Standard Deviation
Suppose the market SD is 5. It means the total risk of the market portfolio is 5
(Remember that total risk of the market portfolio is only systematic risk. Market
portfolio is a very well diversified portfolio. The unsystematic risk of the
investment in the market portfolio is eliminated through diversification.). Suppose
there is security having Beta of 1.20. It means systematic risk of the security is
1.20 times the systematic risk of the market portfolio; in other words, the
systematic risk of the security is 6.
(ii) Unsystematic Risk of an investment =
Total risk (SD of that investment)-Systematic Risk( calculated as above)
ALTERNATIVE APPROACH:
(i) Systematic Risk of an Investment =
Beta2 2 2 2 x Market Variance
(ii) Unsystematic Risk of an investment =
Total risk (Variance of the investment)-Systematic Risk(calculated above)
Unsystematic risk is also referred as Residual risk, also firm specific risk, also risk
not related to market Index. It is denoted by ei.
Q. No.5:Q. No.5:Q. No.5:Q. No.5: The following are the estimates for two stocks:
Stock Expected Return Beta Residual SD
A 13% 0.80 30%
B 18% 1.20 40%
Market SD is 20%. What are the SDs of A and B?

13
Answer Answer Answer Answer
Systematic risk of A: Beta of A x Market Standard Deviation
= 0.80 x 20% = 16%
Total Risk of A (SD of A) = 16 + 30 = 46%
Systematic risk of B: Beta of B x Market Standard Deviation
= 1.20 x 20% = 24.00%
Total Risk of B (SD of B) = 24+ 40 = 64%
CAPITAL ASSET PRCAPITAL ASSET PRCAPITAL ASSET PRCAPITAL ASSET PRICING MODELICING MODELICING MODELICING MODEL
CAPM explains the required return (i.e. the minimum rate of return which induces
the investors to select a particular investment) in the form of the following equation:
K = RF + RP
K = Required rate of return
RF = Risk free rate of return
RP = Risk premium
Risk premium is additional return expected by the investor for bearing the additional
risk associated with a particular investment. It is calculated as Beta X (RM-RF)
where RM is expected return on market portfolio.
Suppose beta of a security is 1.21
RF = 7 per cent, RM = 13 per cent
K = 7 + 1.21 (13 - 7) = 14.26 per cent
Investor will require a return of 14.26 per cent return from this investment. He can
get 7 per cent return without taking any risk. Market portfolio offers him extra 6 per
cent return where risk is lesser as compared to risk from this security. Risk from
this security is 1.21 times as compared to risk from market portfolio. Hence
premium is 6 x 1.21 = 7.26 per cent. Thus required rate of return is equal to risk
free return + risk premium.
Growth Stocks Market Average E(R) Corporate Bonds RF Government Bonds
O 1 β DIAGRAM 1

14
Q. No. 6 : Q. No. 6 : Q. No. 6 : Q. No. 6 : Beta 1.08, RF 10 per cent, RM 15 per cent, dividend per share expected at
the year-end Rs.2.00. Dividend is likely to grow at 11 per cent p.a. for years to
come. Market price of share?
Answer:Answer:Answer:Answer:
Ke = RF + β(RM-RF) = 10 + 1.08(15-10) = 15.40
D1 2
P = ------------ = --------------- = 45.45
Ke – g 0.1540 - 0.11
Q. No 7Q. No 7Q. No 7Q. No 7: Covariance of returns between market and equity shares of XYZ Ltd is 10%.
Market SD is 40%. RM = 20%. RF is 12%. Calculate Ke of XYZ Ltd.
AnswerAnswerAnswerAnswer:
SD = 0.40 Variance=0.40 x 0.40=0.16 Variance (%) = 0.16 x 100 = 16
Covariance 10%
Beta = ------------ = ----------- = 0.625
Market variance 16%
ALTERNATIVE WAY:
Covariance 0.10
Beta = -------------- = --------------- = 0.625
Market variance (0.40)2222
Ke = RF + Beta(RM-RF) = 12 + .625(20-12) = 17
Q. No. 8 : Q. No. 8 : Q. No. 8 : Q. No. 8 : Security S.D.= 3% Market S.D. = 2.20%
Coefficient of correlation for security with market = 0.80
Return from market portfolio= 9.80%. Risk Free rate of return = 5.20%
Find the required return from the security. (May, 1998)(May, 1998)(May, 1998)(May, 1998)
Answer: Answer: Answer: Answer:
Covariance
Coefficient of correlation = -------------------
(SDsecuirty).(SDmarket)
Covariance
0.80 = -------------------
(0.03)....(0.022)
Covariance = 0.000528
Beta = Covariance /(Market variance)

15
= 0.000528 /(0.0220)2222
= 1.091
Required return from the security = RF + Beta (RM-RF)
= 5.20 + 1.091(9.80 – 5.20) = 10.22%
Q. No. 9: Q. No. 9: Q. No. 9: Q. No. 9: The market price of the equity share of Nandnandan Ltd is Rs.50. Ke =
14%. RF = 5%. Risk premium of market portfolio = 10%. It is expected that the
company shall be paying constant dividend year after year. What shall be the market
price of share if, r between the return from this security and that from market
portfolio is halved (the values of SDs remain unchanged)?
AnswerAnswerAnswerAnswer
14 = 5 + Beta (10)
Beta = 0.90
Ke = Dividend per share / P
0.14 = D / 50
D = 7
If r is halved, Beta would be equal to 0.45.
Ke = 5 + 0.45(10) = 9.50%
Ke = D / P
0.095 = 7 /P P = 73.68
Q. No. 10: Q. No. 10: Q. No. 10: Q. No. 10: The expected rate of return on market portfolio is 20%. The Beta of a
security is 1.00. Dividend yield (Dividend per share / market price per share) is 5%.
What is the expected rate of the price appreciation on price of that security?
AnswerAnswerAnswerAnswer
Total required rate of return from the security = 20%
Dividend yield = 5%
Price appreciation = 15%
Overall BetaOverall BetaOverall BetaOverall Beta
The discussion contained in the above paragraph relates to a particular security.
Beta may also be calculated for the firm as a whole. This Beta is referred as Firm
Beta or Overall Beta or Assets Beta. Overall Beta indicates expected change in
return from the firm as a whole when the return from market portfolio varies by 1
percent. Overall Beta is weighted average of Equity Beta & Debt Beta. (If debt Beta
is not given in question, it is assumed to be zero).
D E
Overall Beta : Debt Beta x ----- + Equity Beta x ------
(If Tax Ignored) D+E D + E
Overall Beta (Tax considered):
D(1-T) E

16
= Debt Beta x ---------- + Equity Beta x ----------
D(1-T)+E D(1-T)+E
A school of thought led by MM believe that overall Beta is not affected by
change in Capital structure.
Q. No. 11Q. No. 11Q. No. 11Q. No. 11 : The capital structure of Madhav Ltd is as follows :
Beta Amount Rs. Million
Debt 0 150
Preference shares 0.20 50
Equity shares 1.20 200
Find the beta for the overall beta of the company. How the overall beta change if the
company raises Rs.200m by issuing new equity shares and use this amount for
redeeming the debt and Preference shares?
AnswerAnswerAnswerAnswer
W1 = 150/400 = 0.375 W2 = 50/400 = 0.125 W3 =200/400=0.50
Overall Beta = (0)(0.375) + (0.20)(0.125) + ( 1.20)(0.50) = 0.625
According to MM, the change in the capital structure does not change the overall
beat. Hence, the company action will have no effect on the overall beat i.e. the
overall beat will remain unchanged.
Q. No. 12 :Q. No. 12 :Q. No. 12 :Q. No. 12 :
A Company’s capital structure comprises equity share capital having market value of
Rs.80 crores plus Rs.50 crores debentures. The debt beta coefficient may be
assumed to be 0.25. The current risk – free rate is 8% and the market rate of return
is 16%. Equity Beta = 1.40, Find Ko. Ignore Tax.
Answer Answer Answer Answer
D E
Overall β = D.β x -------- + E.β x ---------
D+E D+E
Overall β = [(0.25) X (50) / (50 +80)] +[(1.40)X(80)/(50+80)] = 0.9577
2Ko = RF + Overall β (RM-RF)
= 8 + .9577(16-8) = 15.66%
Alternative way of calculation of Ko :
Kd = RF + Debt β (RM-RF)
= 8 + 0.25 (16 -8) = 10%
Ke = RF + Equity β (RM-RF)
2 This method of calculating Ko may be applied only when tax is ignored. If tax is to be considered,
only alternative method given in this answer can be applied.

17
= 8 + 1.40 (16-8) = 19.20%
X W XW
10.00 50 500
19.20 80 1,536
130 2,036
Ko = 2036/130 = 15.66%
Q. No. 13 : Q. No. 13 : Q. No. 13 : Q. No. 13 :
The total market value of the equity share of O.R.E Company Rs.60,00,000 and the
total value of the debt is Rs.40,00,000. The treasurer estimate that the beta of the
equity is currently 1.5 and that the expected risk premium on the market is 10 per
cent. The Treasury bill rate is 8 per cent. Ignore Tax.
Required:
(1) What is overall Beta?
(2) Estimate Ko.
Answer Answer Answer Answer
D E
Overall β = D.β x -------- + E.β x ---------
D+E D+E
4
Overall β = (0 X------------)
4+6
6
+ (1.50X----------)
4+6
= .90
3Ko = RF + Overall β (RM-RF)
= 8 + .90(10) = 17%
Alternative way of calculation of Ko :
Kd = RF + Debt β (RM-RF)
= 8 + 0 (10) = 8%
Ke = RF + Equity β (RM-RF)
= 8 + 1.50 (10) = 23%
X W XW
8 40 320
23 60 1380
100 1,700
Ko = 1,700/100 = 17%
3 This method of calculating Ko may be applied only when tax is ignored. If tax is to be considered,
only alternative method given in this answer can be applied.

18
Q. No. 14 : Q. No. 14 : Q. No. 14 : Q. No. 14 :
A project had an equity beta of 1.2 and was going to be financed by a combination of
30% debt and 70% equity. Assuming debt-beta to be zero, calculate the Project beta
taking risk-free-rate of return to be 10% and return on market portfolio at 18%.
Ignore Tax. Ko? (May, 2002)(May, 2002)(May, 2002)(May, 2002)
Answer Answer Answer Answer
D E
Overall β = D.β x -------- + E.β x ---------
D+E D+E
30
Overall β = (0 X------------)
30+70
70
+ (1.20X--------------) = 0.84
30+70
4Ko = RF + Overall β (RM-RF)
= 10 + .84(18-10) = 16.72
Alternative way of calculation of Ko:
Kd = RF + Debt β (RM-RF)
= 10 + 0 (18-10) = 10%
Ke = RF + Equity β (RM-RF)
= 10 + 1.20 (18-10) = 19.60%
X W XW
10.00 30 300
19.60 70 1,372
100 1,672
Ko = 1,672/100 = 16.72%
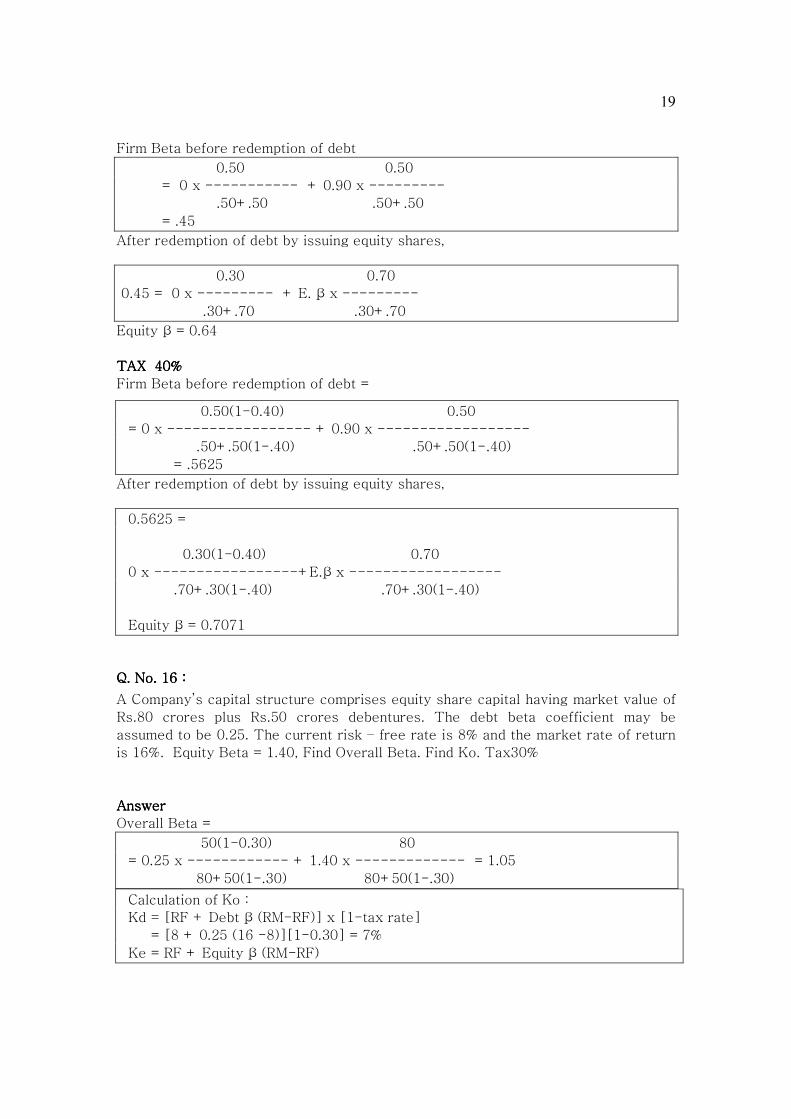
Q. No. 15 :Q. No. 15 :Q. No. 15 :Q. No. 15 :
Given Equity Beta 0.90, Debt Beta 0. Tax NIL. Debt: Equity .50 / .50. What will be
new equity Beta if debt / equity is changed to 0.30 / .70 by issuing additional equity
at Market price to redeem 40% of existing Debt?
What will be your answer if tax rate is 40%.
Answer Answer Answer Answer
NO TAXNO TAXNO TAXNO TAX
4 This method of calculating Ko may be applied only when tax is ignored. If tax is to be considered,
only alternative method given in this answer can be applied.
19
Firm Beta before redemption of debt
0.50 0.50
= 0 x ----------- + 0.90 x ---------
.50+.50 .50+.50
= .45
After redemption of debt by issuing equity shares,
0.30 0.70
0.45 = 0 x --------- + E. β x ---------
.30+.70 .30+.70
Equity β = 0.64
TAX 40%TAX 40%TAX 40%TAX 40%
Firm Beta before redemption of debt =
0.50(1-0.40) 0.50
= 0 x ----------------- + 0.90 x ------------------
.50+.50(1-.40) .50+.50(1-.40)
= .5625
After redemption of debt by issuing equity shares,
0.5625 =
0.30(1-0.40) 0.70
0 x -----------------+E.β x ------------------
.70+.30(1-.40) .70+.30(1-.40)
Equity β = 0.7071
Q. No. 16 :Q. No. 16 :Q. No. 16 :Q. No. 16 :
A Company’s capital structure comprises equity share capital having market value of
Rs.80 crores plus Rs.50 crores debentures. The debt beta coefficient may be
assumed to be 0.25. The current risk – free rate is 8% and the market rate of return
is 16%. Equity Beta = 1.40, Find Overall Beta. Find Ko. Tax30%
Answer Answer Answer Answer
Overall Beta =
50(1-0.30) 80
= 0.25 x ------------ + 1.40 x ------------- = 1.05
80+50(1-.30) 80+50(1-.30)
Calculation of Ko :
Kd = [RF + Debt β (RM-RF)] x [1-tax rate]
= [8 + 0.25 (16 -8)][1-0.30] = 7%
Ke = RF + Equity β (RM-RF)

20
= 8 + 1.40 (16-8) = 19.20%
X W XW
7.00 50 350
19.20 80 1,536
130 1,886
Ko = 1,886/130 = 14.51%
Q. No. 17 :Q. No. 17 :Q. No. 17 :Q. No. 17 :
A Ltd’ s equity Beta is 1.25. Its capital structure is 30% debt and 70% equity. B Ltd
is an identical company except that its gear is 40% debt and 60% equity. Tax rate is
30%. Find equity Beta of B Ltd.
Answer Answer Answer Answer
OVERALL BETA (A) =
30(1-Tax rate) 70
0 X----------------- + (1.25) x ------------- = 0.9615
70 + 30(1- tax rate ) 70 +30(1- tax rate)
OVERALL BETA (B) =
Finance 40 % debt & 60 % equityFinance 40 % debt & 60 % equityFinance 40 % debt & 60 % equityFinance 40 % debt & 60 % equity
40(1-.30) 60
0.9615 = 0 x ------------ + E. Beta x ------------------
60 +40(1-.30) 60 + 40 (1-0.30)
Solving above equation, E. β = 1,4102.
Q. No. 18: Q. No. 18: Q. No. 18: Q. No. 18: A Furniture Ltd is planning to form a subsidiary company which will be
dealing in Fabrics. Current equity Beta of A Furniture Ltd is 1.70. The fabrics
industry’s current equity Beta is 1.60 . The fabrics industry has 30% debt and 70%
equity. With RM = 25% , RF = 10%, tax = 30% and debt Beta =0, find the overall cost
of capital. How your answer change if gearing is 50% and 50%? What if the project is
wholly equity financed?
Answer Answer Answer Answer
Overall cost of capital of fabrics with 30% debt and 70% equity30% debt and 70% equity30% debt and 70% equity30% debt and 70% equity
Ke = 10 + 1.60 (25 –10) = 34
Kd = 10 (1- 0.30) = 7
Source Cost (X) W XW
EQUITY 34 0.70 23.80
DEBT 7 0.30 2.10

21
25.90
Ko = 25.90 %
Finance 50 % debt & 50 % equityFinance 50 % debt & 50 % equityFinance 50 % debt & 50 % equityFinance 50 % debt & 50 % equity
Overall Beta (Fabric Sector) =
30(1-Tax rate) 70
0 X ------------- + (1.60) x --------------- = 1.231
70 + 30(1- tax rate ) 70 +30(1- tax rate)
50(1-.30) 50
1.231 = 0 x -------------- + E. Beta x ----------------
50 +50(1-.30) 50 + 50 (1-0.30)
Solving above equation, E. β = 2.09
Ke = 10 +2.09(25-10) = 41.35
Source Cost (X) W XW
EQUITY 41.35 0.50 20.675
DEBT 7 0.50 3.50
24.175
Dis. Rate or overall cost of capital = 24.175/1 = 24.175%
Project financed by equityProject financed by equityProject financed by equityProject financed by equity onlyonlyonlyonly:
Equity Beta = Overall Beta = 1.231
Ke = 10 + 1.231(25-10) =28.465 % Ko = 28.465%
PORTFOLIO THEORYPORTFOLIO THEORYPORTFOLIO THEORYPORTFOLIO THEORY
“Do not put all your eggs in the same basket”. The wisdom of this maxim is that one
should not put all his wealth in one asset only, rather one should invest in many
assets. In other words, the maxim suggests diversification of investments for risk
reduction.
Portfolio is a combination of securities. Combining securities in a portfolio can
reduce the risk because some of the fluctuations offset each other. Investors can
reduce risk by holding investments in diversified portfolio.

22
There are two theories of Portfolio Management, (a) Traditional Theory (b) Modern
Theory. Both traditional as well as modern theories of the Portfolio Management find
their foundations in the wisdom of the maxim.
The traditional theory does not suggest any methodology for making portfolio, the
assets for constructing the portfolios are just to be picked up only on the basis of
judgment.
Modern Portfolio Theory5 provides a sound method for investors to establish a
disciplined approach to investing. The Modern Portfolio theory (MPT) suggests a
definite methodology6 for this purpose. MPT is based on statistical methods (Mean,
SD and coefficient of correlation). Using SD as a measurement of risk and coefficient
of correlation for calculating portfolio risks are termed as major contributions of
Markowitz, the father of MPT. The theory reveals that the degree of risk reduction
depends upon correlation between returns from different investments. Lower the
correlation between returns from securities, greater the risk reduction potential
when the assets are combined to form a portfolio. If the correlation between returns
from securities is +1, their combination does not reduce the risk.
Teaching noteTeaching noteTeaching noteTeaching note – not to be given in the exam. We shall be studying, the relation
between the value of coefficient of correlation between the returns from the
securities and risk reduction potential of the portfolio constituting them, after
studying the methods of calculating the portfolio risk.
There are two methods of calculating the return and risk of the portfolio (a) Direct
method (b) Indirect method. (Risk may be calculated either Portfolio SD or portfolio
variance.)
DIRECT METHOD
Under direct method, we calculate periodical returns of the portfolio. Mean of these
returns represents portfolio return and SD of these returns represents portfolio risk
(portfolio SD).
INDIRECT METHOD
Portfolio Return
The expected return on a portfolio of securities is the weighted average of the
expected returns of the individual securities making up the portfolio. The weights are
equal to proportion of the investment in each security in the portfolio.
5 MPT was introduced by Markowitz in his paper “Portfolio Selection” which appeared in the
Journal Finance (USA) in 1952 ( At that time , he was a PhD student of Chicago School of
Economics ). Sharpe ( a student of Markowitz ) also contributed a lot towards further advancement
of the theory. (Sharpe’s main contribution was the development of Capital Assets Pricing Model ).
Both Markowitz and Sharpe shared Noble prize in Economics with Miller in 1990.
6 We shall be studying this methodology (in brief ) after studying the basics of the Portfolio
Management.

23
Portfolio Risk
The risk a portfolio is measured by its variance or standard deviation (SD) of a
Portfolio.
Variance of portfolio
= W12....(SD1)
2 + W22....(SD2)
2 + 2....W1....W2....r12.....(SD1)....(SD2)
W1 = Proportion of investment in security A’.
W2 = Proportion of investment in security B’.
(SD1)2 = Variance of returns from security A
(SD2)2 = Variance of returns from security B
r 12 = Coefficient of correlation between returns from securities A & B.
The above – mentioned formula is for calculating variance of a two-asset portfolio.
Variance of “more than two – asset portfolio” can be calculated on similar lines.
For example, variance of three asset portfolio is:
W12.(SD1)
2 + W22.(SD2)
2 + W3 2.(SD3)
2 + 2.r12..W1.W2..SD1.SD2 + 2.r23.. W2.W3.SD2. SD3 + 2.r13.W1.W3.SD1.SD3 Example
Year Return from Security A Return from Security B
2001 11 15
2002 13 9
2003 -8 27
2004 27 -3
2005 17 12
Suppose we invest 50% of funds in A and balance in B. Calculate the return and risk
of the Portfolio.
DIRECT METHOD Let the return is denoted by X
Portfolio Mean = ∑X/n = 60/5 = 12
Portfolio Variance = ∑x2/n = 14.50/5 = 2.90
______ _______
Portfolio SD = √∑x2/n = √14.50/5 = 1.70 INDIRECT METHOD
Let the return of A is denoted by X and that of B by Y.
X x x2 Y y y2 xy
11 -1 1 15 3 9 -3
13 1 1 9 -3 9 -3
-8 -20 400 27 15 225 -300
27 15 225 -3 -15 225 -225
17 5 25 12 0 0 0
∑X = 60 ∑x =0 ∑x2= 652 ∑Y =60 ∑ ∑y
2= 468 ∑xy = -531

24
Mean of X = 12 Mean of Y = 12
______ ______
SD of X = √∑x2 /n= √652/5 = 11.42
_____ ______
SD of Y = √∑y2
/n=√468/5 = 9.68
Coefficient of correlation = (∑xy/n) / ( SDx.SDy)
(-531/5)/(11.42 . 9.68) = -0.9607
Portfolio Variance = (W1)2....(SD1)
2 +(W2)2....(SD2)
2 + 2(W1)(W2)(r12)(SD1)(SD2)
______________________________________________
Portfolio SD = √(W1)2....(SD1)
2 +(W2)2.... (SD2)
2 + 2(W1)(W2)(r12)(SD1)(SD2)
____________________________________________________________________
= √(0.50)2....(11.42)2 + (0.50)2....(9.68)2 + 2(0.50)(0.50)(-0.9607) (11.42)(9.68)
= 1.71
Q. No. 19 : Q. No. 19 : Q. No. 19 : Q. No. 19 : Return from equity shares of two companies for last five years :
Year Lalita Ltd. Sakhi Ltd.
20x1 10% 20%
20x2 20% 10%
20x3 30% -5%
20x4 -10% 15%
20x5 10% 20%
• An investor invests 50% of his investible funds in Lalita and balance in Sakhi.
Find his expected return.
• Find SD of each stock
• Find covariance between Lalita Ltd and Sakhi Ltd.
• Find coefficient of correlation between the two.
• Find portfolio risk, by indirect method, if 40% in invested in the Lalita Ltd and
balance in Salkhi Ltd.
• Find portfolio risk, by direct method, if 40% in invested in the Lalita Ltd and
balance in Salkhi Ltd.
Answer Answer Answer Answer
(a) (a) (a) (a) Let return from Lalita Ltd. = X. Let return from Sakhi Ltd. = Y
XXXX x x
2 Y y y
2 xy
10 -2 4 20 8 64 -16
20 8 64 10 -2 4 -16
30 18 324 -5 -17 289 -306
-10 -22 484 15 3 9 -66

25
10 -2 4 20 8 64 -16
∑X=60 ∑ x2
=880
∑Y =60 ∑ y2
=430
∑xy= -420
Average return of Lalita = ∑X/n = 60/5 =12
Average return of Sakhi = ∑Y/n = 60/5 =12
Expected return of the portfolio = (.50)(12) + (.50)(12) = 12
(b)(b)(b)(b) SD of shares of Lalita Ltd . √[∑x2/n] = √ [880/5] =13.27
SD of shares of Sakhi Ltd . √[∑y2/n] = √[ 430/5] = 9.27
(c)(c)(c)(c) covariance = ∑xy / n = -420 / 5 = -84
(d)(d)(d)(d) Coefficient of correlation=Covariance/[(SDx).(SDy)]
= -84 / [(13.27).(9.27)] = -0.68
(e)(e)(e)(e) Portfolio SD =
√[(0.40)2.(13.27)
2 + (0.60)
2.(9.27)
2 +2(0.40)(0.60)(-0.68)(13.27)(9.27)]
= 4.34
(f)(f)(f)(f) let the return from the portfolio = Z
Let return from portfolio = Z
Z z z2
16 4 16
14 2 4
9 -3 9
5 -7 49
16 4 16
∑Z = 60 ∑ z2 = 94
Mean return from portfolio = ∑Z/n = 60/5 =12
__________
SD of portfolio = √[∑pz2/n] √[94 / 5] = 4.34
Q. No. 20 : Q. No. 20 : Q. No. 20 : Q. No. 20 : Calculate expected return and SD of each of following two investments P
and Q . Also calculate the expected return and SD of a portfolio in which 50% of
funds are invested in P and balance in Q. What if 40% invested in P and balance in Q?
State of Monsoon Probability Return from P Return from Q
Poor 0.10 10 20
Below normal 0.20 20 30
Normal 0.40 30 40
Above normal 0,20 35 50
Excellent 0.10 40 70

26
AnswerAnswerAnswerAnswer:::: Let return from P = X
X p pX x px2
10 .10 1 -18 32.4
20 .20 4 -8 12.8
30 .40 12 2 1.6
35 .20 7 7 9.8
40 .10 4 12 14.4
28 71
Expected return from P = ∑pX/∑p = 28/1 = 28
SD of P = √[(∑px2/∑p)] = = √[(71/1)] = 8.43
Let return from Q = YLet return from Q = YLet return from Q = YLet return from Q = Y
Y p pY y py2
20 .10 2 -21 44.1
30 .20 6 -11 24.2
40 .40 16 -1 0.40
50 .20 10 9 16.2
70 .10 7 29 84.1
41 169
Expected return from Q = ∑pY/∑p = 41/1 =41
SD of Q = √[(∑py2/∑p)] = √[(169/1)] = 13
Calculation of covariance and r
X y p pxy
-18 -21 .10 37.8
-8 -11 .20 17.6
2 -1 .40 -0.8
7 9 .20 12.6
12 29 .10 34.8
102
Covariance = ∑pxy / ∑p = 102/1 =102
Covariance 102

27
r = -------------- = ----------------- = 0.93
(SDx)(SDy) (8.43)(13)
50% in P and balance in Q:50% in P and balance in Q:50% in P and balance in Q:50% in P and balance in Q:
Portfolio return = 28(.50) + 41 (.50) = 34.50
Portfolio SD= √[(0.50)2.(8.43)2 + (0.50)
2.(13)2 +2(0.50)(0.50)(0.93)(8.43)(13)]
= 10.53
40% in P and balance in Q:40% in P and balance in Q:40% in P and balance in Q:40% in P and balance in Q:
Portfolio return = 28(.40) + 41 (.60) = 35.80.
Portfolio SD =√[(0.40)2.(8.43)
2 + (0.60)
2.(13)
2 +2(0.40)(0.60)(0.93)(8.43)(13)
= 11.01
Q.No.21: Q.No.21: Q.No.21: Q.No.21: X Ltd is currently engaged in the business of making documentary films.
The following information, relating to this company, is available:
Total investment in the business : Rs.10 Crores
Expected Return : 20%
SD of returns : 30%
The company is planning to go for the business of making feature films. The
following information, relating to feature film business, is available:
Total investment in the business : Rs.30 Crores
Expected Return : 40%
SD of returns : 20%
Coefficient of correlation between returns from two businesses is 0.90.
X Ltd has a policy of evaluating new projects on the basis of following equation:
Net benefit from the project = 80 Return (%) – variance (%).
If the implementation of the project results in increase in the net benefit, the project
is accepted. Should the project be accepted?
AnswerAnswerAnswerAnswer
Expected return after new business = 20(.25) + 40(.75) = 35
Variance after new business =
(0.25)2.(0.30)2 + (0.75)2.(0.20)2 +2(0.25)(0.75)(0.90)(.30)(.20) = 0.048375
= 4.8375 %
Variance before new business = (0.30)2 = 0.09 = 9%
Net benefit before business = 80(20) – 9 = 1591
Net benefit after business = 80(35) – 4.8375 = 2795.1625

28
As the benefit after the new business is increased, the new business is
recommended.
Q. No. 22 : Q. No. 22 : Q. No. 22 : Q. No. 22 : X Co., Ltd., invested on 1.4.2005 in certain equity shares as below:
Name of Co. No. Shares Cost (Rs.)
M Ltd. 1,000 (Rs.100 each) 2,00,000
N.Ltd. 500 (Rs. 10 each) 1,50,000
In September, 2005, 10% dividend was paid out by M Ltd. and in October, 2005, 30%
dividend paid out by N Ltd. On 31.3.2006 market quotations showed a value of
Rs.220 and Rs. 290 per share for M Ltd. and N Ltd respectively.
On 1.4.2006, investment advisors indicate (a) that the dividends from M Ltd. and N
Ltd. for the year ending 31.3.2007 are likely to be 20% and 35% respectively and (b)
that the probabilities of market quotations on 31.3.2007 are as below:
Probability factor Price/share of M Ltd. Price/share of N Ltd.
0.2 220 290
0.5 250 310
0.3 280 330
You are required to:
(i)(i)(i)(i) Calculate the average return from the portfolio for the year ended
31.3.2006;
(ii)(ii)(ii)(ii) Calculate the expected average return from the portfolio for the year
2006-07;
(iii)(iii)(iii)(iii) Advise X Co. Ltd., of the comparative risk in the two investments by
calculating the standing deviating in each case. ((((NovNovNovNov. 2006) (May, 2008). 2006) (May, 2008). 2006) (May, 2008). 2006) (May, 2008)
AnswerAnswerAnswerAnswer (i)
Year end wealth :::: Cash (received on account of dividend from M)= 10000
+ Cash (received on account of dividend from N)= 1500
+ Market value of shares of M = 2,20,000
+ Market value of shares of N = 1,45,000 = 3,76,500
Investment in the beginning of the year= 2,00,000 + 1,50,000= 3,50,000
Average return from the portfolio for the year ended 31.3.2006 :
(3,76,500 / 3,50,000) - 1 = 0.0757 = 7.57%
(ii) Expected share price of M = 220x.2 + 250x.5 + 280x.3 = 253
Expected share price of N = 312
29
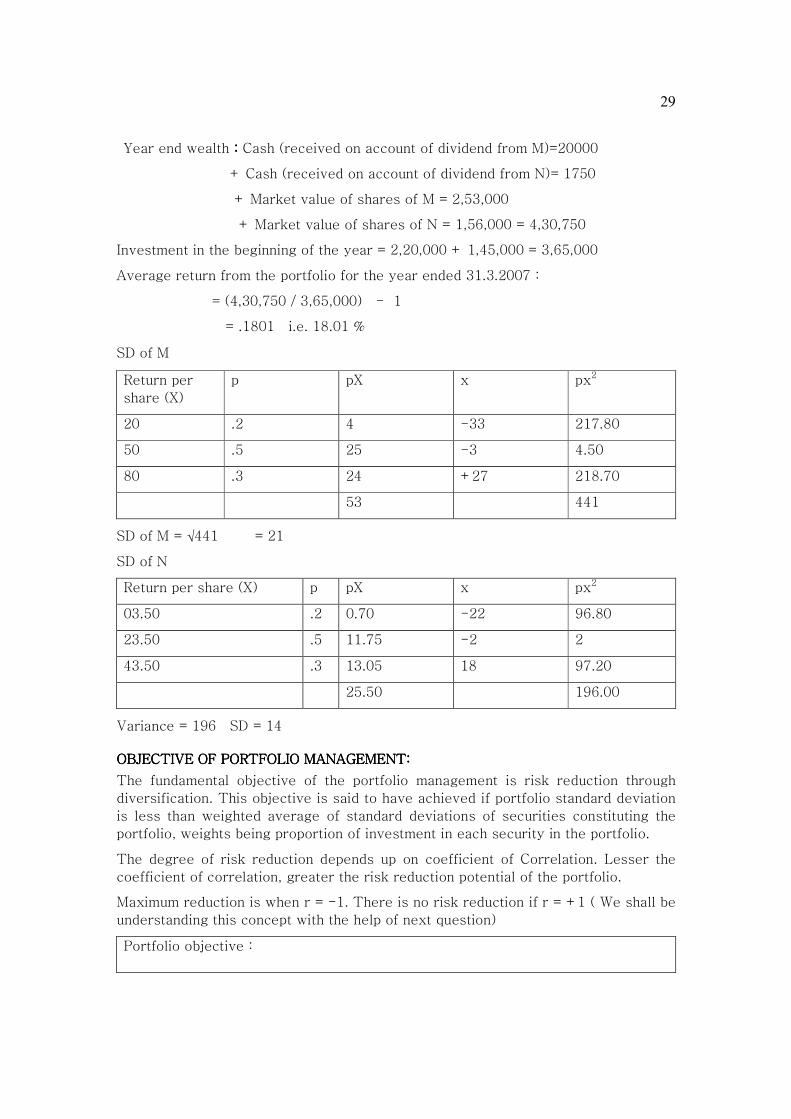
Year end wealth :::: Cash (received on account of dividend from M)=20000
+ Cash (received on account of dividend from N)= 1750
+ Market value of shares of M = 2,53,000
+ Market value of shares of N = 1,56,000 = 4,30,750
Investment in the beginning of the year = 2,20,000 + 1,45,000 = 3,65,000
Average return from the portfolio for the year ended 31.3.2007 :
= (4,30,750 / 3,65,000) - 1
= .1801 i.e. 18.01 %
SD of M
Return per
share (X)
p pX x px2
20 .2 4 -33 217.80
50 .5 25 -3 4.50
80 .3 24 +27 218.70
53 441
SD of M = √441 = 21
SD of N
Return per share (X) p pX x px2
03.50 .2 0.70 -22 96.80
23.50 .5 11.75 -2 2
43.50 .3 13.05 18 97.20
25.50 196.00
Variance = 196 SD = 14
OBJECTIVE OF PORTFOLIO MANAGEMENT: OBJECTIVE OF PORTFOLIO MANAGEMENT: OBJECTIVE OF PORTFOLIO MANAGEMENT: OBJECTIVE OF PORTFOLIO MANAGEMENT:
The fundamental objective of the portfolio management is risk reduction through
diversification. This objective is said to have achieved if portfolio standard deviation
is less than weighted average of standard deviations of securities constituting the
portfolio, weights being proportion of investment in each security in the portfolio.
The degree of risk reduction depends up on coefficient of Correlation. Lesser the
coefficient of correlation, greater the risk reduction potential of the portfolio.
Maximum reduction is when r = -1. There is no risk reduction if r = +1 ( We shall be
understanding this concept with the help of next question)
Portfolio objective :
30
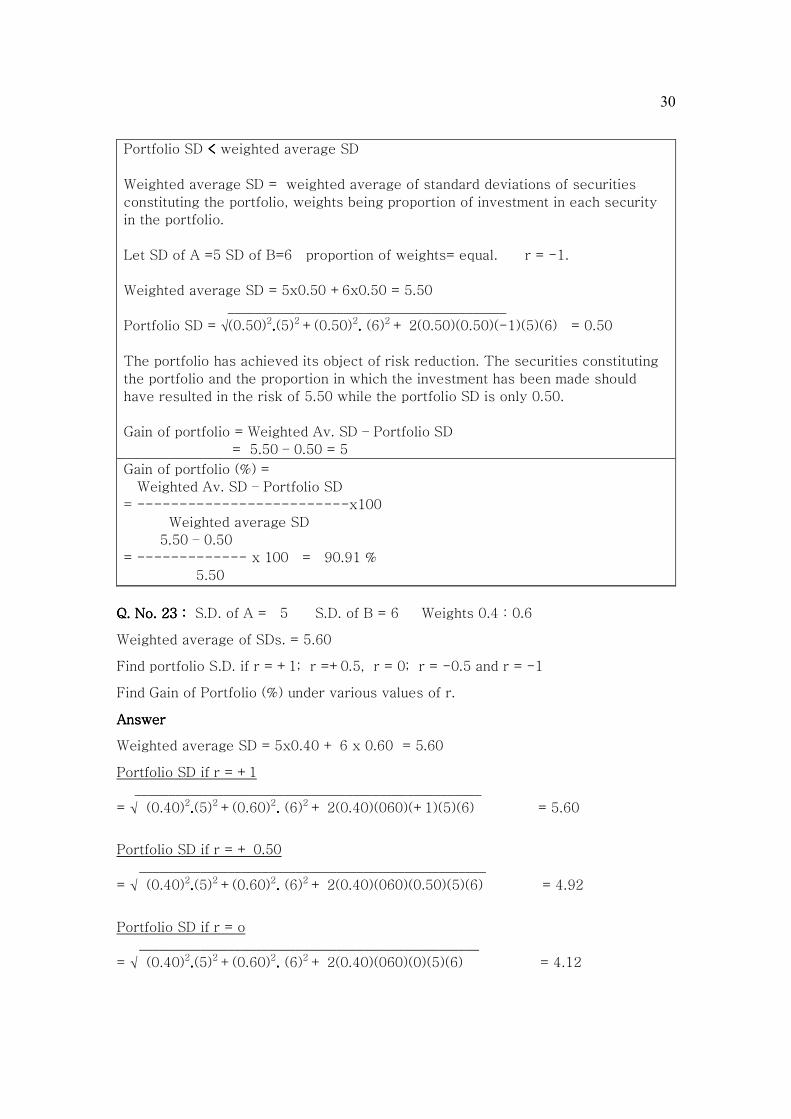
Portfolio SD < < < < weighted average SD
Weighted average SD = weighted average of standard deviations of securities
constituting the portfolio, weights being proportion of investment in each security
in the portfolio.
Let SD of A =5 SD of B=6 proportion of weights= equal. r = -1.
Weighted average SD = 5x0.50 +6x0.50 = 5.50
_________________________________________
Portfolio SD = √(0.50)2....(5)2 +(0.50)2.... (6)2 + 2(0.50)(0.50)(-1)(5)(6) = 0.50
The portfolio has achieved its object of risk reduction. The securities constituting
the portfolio and the proportion in which the investment has been made should
have resulted in the risk of 5.50 while the portfolio SD is only 0.50.
Gain of portfolio = Weighted Av. SD – Portfolio SD
= 5.50 – 0.50 = 5
Gain of portfolio (%) =
Weighted Av. SD – Portfolio SD
= -------------------------x100
Weighted average SD
5.50 – 0.50
= ------------- x 100 = 90.91 %
5.50
Q. No. 23 : Q. No. 23 : Q. No. 23 : Q. No. 23 : S.D. of A = 5 S.D. of B = 6 Weights 0.4 : 0.6
Weighted average of SDs. = 5.60
Find portfolio S.D. if r = +1; r =+0.5, r = 0; r = -0.5 and r = -1
Find Gain of Portfolio (%) under various values of r.
AnswerAnswerAnswerAnswer
Weighted average SD = 5x0.40 + 6 x 0.60 = 5.60
Portfolio SD if r = +1
___________________________________________________
= √ (0.40)2....(5)2 +(0.60)2.... (6)2 + 2(0.40)(060)(+1)(5)(6) = 5.60
Portfolio SD if r = + 0.50
___________________________________________________
= √ (0.40)2....(5)2 +(0.60)2.... (6)2 + 2(0.40)(060)(0.50)(5)(6) = 4.92
Portfolio SD if r = o
__________________________________________________
= √ (0.40)2....(5)2 +(0.60)2.... (6)2 + 2(0.40)(060)(0)(5)(6) = 4.12

31
Portfolio SD if r = -0.50
____________________________________________________
= √ (0.40)2....(5)2 +(0.60)2.... (6)2 + 2(0.40)(060)(-0.50)(5)(6) = 3.12
Portfolio SD if r = -1
____________________________________________________
= √ (0.40)2....(5)2 +(0.60)2.... (6)2 + 2(0.40)(060)(-1)(5)(6) = 1.60
Coefficient of
Correlation
Weighted
average SD
Portfolio SD Gain of portfolio (%)
+1 5.60 5.60 0
+0.50 5.60 4.92 [(5.60-4.92)/5.60]x100=12.14
0 5.60 4.12 [(5.60-4.12)/5.60]x100=26.43
-0.50 5.60 3.12 [(5.60-3.12)/5.60]x100=44.29
-1 5.60 1.60 [(5.60-1.60)/5.60]x100=71.43
The table illustrates that lower the coefficient of correlation, greater the risk
reduction potential. Maximum risk reduction is when r = -1. There is no risk
reduction when r = +1.
Q. No. 24 : Q. No. 24 : Q. No. 24 : Q. No. 24 : Vidurbhai is interested in investing in 2 out of following three shares. He
wants to invest equal amounts in the shares suggested by you. You are given the
following Variance-covariance Table. Suggest.
Equity shares of
Girdhari Ltd.
Equity shares of
Banwari Ltd.
Equity shares of
Murari Ltd.
Girdhari Ltd 16 0.90 0.70
Banwari Ltd 0.90 4 0.20
Murari Ltd. 0.70 0.20 16
AnswerAnswerAnswerAnswer
Portfolio (Girdhari and Banwari) Variance :
= (0.50)2.(16) + (0.50)2.(4) + 2(0.50)(0.50)(0.90) = 5.45
Portfolio (Girdhari and Murari) Variance :
= (0.50)2.(16) + (0.50)2.(16) + 2(0.50)(0.50)(0.70) = 8.35
Portfolio (Murari and Banwari) Variance :
= (0.50)2.(16) + (0.50)2.(4) + 2(0.50)(0.50)(0.20) = 5.10
Q. No. 25 : Q. No. 25 : Q. No. 25 : Q. No. 25 : Equity shares of G Ltd, B Ltd and M Ltd have same expected return.
Using the following variance-covariance table, suggest whether to invest in only G ,
only B, only M, equal amount in G&B, equal amount in G&M or equal amount in
B&M.
Equity shares of G Equity shares of B Equity shares of M.
G Ltd 1.50 0.80 0.90
B Ltd 0.80 1.20 -0.10
M Ltd. 0.90 -0.10 1.30

32
AnAnAnAnswer swer swer swer
Portfolio Variance of G and B :
= (0.50)2.(1.50) + (0.50)2.(1.20) + 2(0.50)(0.50)(0.80) = 1.075
Portfolio Variance of G and M:
= (0.50)2.(1.50) + (0.50)2.(1.30) + 2(0.50)(0.50)(0.90) = 1.15
Portfolio Variance of Murari and Banwari :
= (0.50)2.(1.30) + (0.50)2.(1.20) + 2(0.50)(0.50)(-0.10) = 0.575
Variance of G = 1.50
Variance of B = 1.20
Variance of M = 1.30
Invest equal amount in Murari and Banwari.
Portfolio BetaPortfolio BetaPortfolio BetaPortfolio Beta
= Weighted average of Betas of the Securities constituting the portfolio.... Weights
being Proportions of Investment.
Example: Suppose an investor invests 40% of his funds in security A and 60% of his
funds in security B. Beta of A = 1.20. Beta of B = 1.50.
Beta of Portfolio = 0.40(1.20) + 0.60(1.50) = 13.80
MiMiMiMinimum Risk Portfolionimum Risk Portfolionimum Risk Portfolionimum Risk Portfolio:
For Minimum risk portfolio (also called as minimum variance portfolio, also called as
minimum SD portfolio)
(SD2)2 - r(SD1)(SD2)
W1= ---------------------------
(SD1)2+(SD2)
2 -2r(SD1)(SD2)
(Mathematical derivation of this formula is given in Appendix B)
Q. No. 26Q. No. 26Q. No. 26Q. No. 26: (a) (a) (a) (a) You are supplied the following information regarding equity shares of
the two companies :
Kanhai Ltd. Radhika Ltd.
Average Return 12 % 15 %
SD of return 6 % 3 %
Coefficient of correlation between returns from equity shares of Kanhai Ltd and
Radhika Ltd. = 0.50
An investor is interested in investing Rs.15,00,000 in these two securities. Suggest
the portfolio to minimize the risk.
Answer (a)Answer (a)Answer (a)Answer (a)
If r = 0.50 : : : : Let Kanhai Ltd. = 1 Let Radhika Ltd. = 2

33
(SD2)2 - r(SD1)(SD2)
W1 = ----------------------
(SD1)2+(SD2)
2 -2r(SD1)(SD2)
(.03)2 – (0.50)(.06)(.03)
= -------------------------- = 0
(.06)2 + (.03)2 – 2(0.50)(.06)(.03)
Invest total amount of Rs.15,00,000 in the equity shares of Radhika Ltd.
If the coefficient of correlation is -1, we may not apply this formula. In this case,
the same result, that we get from this formula, can be obtained through the
reverse ratio of the SDs. For example if the SD of A is 1 and that of B is 3, r = -
1, for minimum risk variance the investment may be made in the ratio of 3:1 i.e.
75% of the funds may be invested in A and 25% in B. (We shall get the same
result if we apply the above formula, but that will be time consuming)
Remember that the concept of the reverse ratio of the SDs is applicable only
when r = -1.
Q. No. 26 Q. No. 26 Q. No. 26 Q. No. 26 : (b)(b)(b)(b) How your answer will change if r = -1?
Answer Answer Answer Answer
If r = If r = If r = If r = ----1, 1, 1, 1, for minimum risk variance the investment may be made in the ratio of 3:6
i.e. 1/3rd of the funds may be invested in A and 2/3rd in B i.e. Rs.5,00,000 may be
invested in A and Rs.10,00,000 in B.
Q. No. 27 : The securities A and B have the expected returns and standard deviations
given below. Correlation between expected returns in 0.10.
Return S.D.
A 10% 20
B 20% 10
(i) Compute the return and risk, for a portfolio of A 70 per cent & B 30 per cent. Find
the gain of the portfolio. Suggest the minimum risk portfolio.(ii) Revise your answers
assuming that r is -1.00 instead of 0.10.
AnswerAnswerAnswerAnswer
(i) (i) (i) (i) Return of the portfolio = (0.70x10) + (0.30x20) = 13%
Portfolio Risk(SD)=
________________________________________________________
√(0.70)2....(20)2 +(0.30)2....(10)2 + 2(0.70)(0.30)(0.10) (20)(10) = 14.61
Gain of portfolio (%) =
Weighted Av. SD – Portfolio SD
= ------------------------- x 100
Weighted average SD
17 – 14.61

34
Gain of portfolio (%) = ---------------- x 100 = 14.06
17
Minimum Risk portfolio :
(SD2)2 - r(SD1)(SD2) (10)2 – (0.10)(20)(10)
W1 = ---------------------- = ----------------------- = 0.1739
(SD1)2+(SD2)
2 -2r(SD1)(SD2) (20)2 + (10)2 -2(0.10)(20)(10)
For minimum risk, the investment in A and B should be in the proportion of 0.1739
and 0.8261 respectively.
(ii)(ii)(ii)(ii) Return of the portfolio = (0.70x10) + (0.30x20) = 13%
Portfolio Risk ( SD) =
____________________________________________________ = 11
√(0.70)2....(20)2 +(0.30)2....(10)2 + 2(0.70)(0.30)(-1)(20)(10)
Gain of portfolio (%) =
Weighted Av. SD – Portfolio SD
= ------------------------- x 100
Weighted average SD
17 -11
Gain of portfolio (%) = ------- x 100 = 35.29
17
Minimum Risk portfolio: r = -1. In this case, for minimum risk portfolio, the
investment should be made in the reverse ratio of the SDS. The investment should be
in the ratio of 1:2 in A and B respectively i.e. 1/3 of the total investment should be in
A and 2/3 of the total investment should be in B.
Q. No. 28 : Q. No. 28 : Q. No. 28 : Q. No. 28 : Find the maximum and minimum portfolio Standard Deviation for varying
levels of coefficient of correlation between the following two securities assuming
that the investments are in the ratio of 6:9 :
Return S.D.
A 10% 20
B 20% 10
AnsweAnsweAnsweAnswer r r r
Portfolio SD is maximum when r = +1 . (In this case the portfolio SD is equal to
weighted average SD)
Maximum Portfolio SD = 20 x (0.40) + 10 x (0.60) = 14
Portfolio SD is minimum when r = -1

35
Minimum portfolio SD
_______________________________________________________
= √ ( 0.40)2(20) 2 + (0.60)2(10)2 + 2(0.40)(0.60)(-1)(20)(10) = 2
Q. No. 29.Q. No. 29.Q. No. 29.Q. No. 29. The coefficient of correlation between returns of two securities, A & B, is
0.06. There standard deviations are 0.06 and 0.09 respectively. Calculate the % of
diversification gain if a portfolio is constituted of these two securities with weights
of 0.40 and 0.60 respectively.
AnswerAnswerAnswerAnswer
Weighted average SD = 0.06x0.40 + 0.09x.60 = 0.078
Portfolio SD= 0.060
Gain of portfolio (%) = [(0.078 -0.060)/0.078]x100 = 23.08
Q. No. 30Q. No. 30Q. No. 30Q. No. 30. A Ltd. has an expected return of 22% and standard of 40%. B Ltd has an
expected return of 24 % and standard of 38 %. A Ltd. has a Beta of 0.86 and B Ltd a
Beta of 1.24. The correlation coefficient between the return of A Ltd. and B Ltd is
0.72. The standard deviation of the market return is 20 %. Suggest: (i) Is investing in
B Ltd. better than investing in A Ltd? (ii) If you invest 30% in B Ltd. and 70% in A
Ltd., what is your expected rate of return and portfolio standard deviation? (iii) What
is the market portfolio’s expected rate of return and how much is the risk free rate?
(iv) What is the beta of portfolio A’s weight is 70% and B’ weight is 30%?(May, 2002)(May, 2002)(May, 2002)(May, 2002)
Answer Answer Answer Answer : (i) Yes, investing in B is better than investing in A as B has higher return
and lower risk. (Security B dominates security A, every rational investor will prefer
B as compared to A)
(ii) (a) Expected rate of return =
(0.70x22) + (0.30x24) =22.60%
(ii) (b) Portfolio SD =
(.70)2(.40)2 + (.30)2(.38)2 +
2(.70)(.30)(.72)(.40)(.38) = 37.062
(iii)
22 = RF + .86(RM-RF) ……..(1)
24 = RF + 1.24(RM-RF) ……(2)
solving the equations, (RM-RF) = 5.263
putting this value in (1), RF =17.474 & RM = 22.737
(iv) Beta of portfolio=
(0.86 x 0.70 + 1.24 x 0.30) = 0.974

36
Q. No. 31Q. No. 31Q. No. 31Q. No. 31 : XYZ Limited pays no taxes and is entirely financed by equity shares.
The equity share has a beta of 0.6, and is priced to offer an expected return of 20
per cent, XYZ Ltd. now decides to buy back half of the equity shares by borrowing
an equal amount. If the debt yields a risk free return of 10%, calculate:
(i) The beta of the equity shares after the buyback.
(ii) The required return and risk premium on the equity shares before the
buyback.
(iii) The required return and risk premium on the e. shares after the buyback.
(iv) The required return on debt.
(v) The percentage increase in expected earnings per share.
(vi) The new price-earning multiple.
Assume that the operating profit of the firm is expected to remain constant in
perpetuity. (May, 2002)(May, 2002)(May, 2002)(May, 2002)
Answer :Answer :Answer :Answer :
Beta of firm after buy back = 0.60
D E
0.60 = D.β x -------- + E.β x ---------
D+E D+E
0.50 0.50
0.60 = 0 x ----------- + E. β x ---------
.50+.50 .50+.50
Equity β = 1.20
(ii) Required return = 20 %
Risk free return = 10 %
-------
Risk premium = 10 %
-------
(iii) As β has been doubled, risk has been doubled, therefore risk premium = 20 %
So, required return = RF + risk premium
= 10% + 20% = 30%
(iv) Required return on debt = 10 %
(v) As the required rate has increased by 50%, the EPS will also increase by 50%.
The new EPS is Rs.30.
(vi) Price earning ratio : Before buy back = 100/20 = 5
After buy back = 100/30 = 3.33
Q. No. 32: As an investment manager you are given the following information:
Initial
Price
Rs.
Dividends
Rs.
Market Price at
the end of the
year Rs.
Beta risk
factor
Cement Ltd.(E.Shares) 25 2 50 0.8
Steel Ltd. (E. Shares) 35 2 60 0.7

37
Liquor Ltd. (E. Shares) 45 2 135 0.5
Govt. of India Bonds 1,000 140 1,005 0.99
RF = 14% You are required to calculate:
(i) Expected rate of return of investment in each using CAPM
(ii) Average return of portfolio. (May, 1996)(May, 1996)(May, 1996)(May, 1996)
AnswerAnswerAnswerAnswer
Assumption: There are only these four securities available in the market.
52+62+137+1145
RM = ----------------- -1 =.2633
25+35+45+1000
= 26.33%
Security Expected return
E.Cement Ltd 14+ 0.80(26.33 -14) =23.864
E.Steel Ltd 14+ 0.70(26.33 -14) =22.631
E.Liquor Ltd. 14+ 0.50(26.33 -14) =20.165
GOI Bonds 14+ 0.99(26.33-14) =26.2067
Average return of portfolio
(Assumption : equal amount is invested in each security )
Return (X) W XW
23.864 0.25 5.966
22.631 0.25 5.65775
20.165 0.25 5.04125
26.2067 0.25 6.551675
23.216675
∑XW 23.216675
Average return = -------- = --------- = 23.22 %
∑W 1
Q. No.33: Q. No.33: Q. No.33: Q. No.33: Your client is holding the following securities :
Cost (Rs.) Dividend/
interest
Market price Beta
E. shares of Gold Ltd. 10,000 1725 9800 0.60
E. shares of silver Ltd. 15,000 1000 16200 0.80
E. shares of Bronze Ltd. 14,000 700 20,000 0.60
GOI Bonds 36,000 3600 34,500 1.00
Average return of the portfolio is 15.75%. Calculate expected return of each security
using CAPM. (ii) RF, (Nov. 2005)(Nov. 2005)(Nov. 2005)(Nov. 2005)
Answer Answer Answer Answer
We have to apply CAPM, for this we require RM which is not given in the question.
To calculate RM, let’s assume that in the stock market only four securities are there
(i) E shares of Gold (ii) E shares of Silver (iii) E shares of Bronze and (iv) GOI

38
BONDS. We further assume that their numbers are equal i.e. the number of E shares
of Gold = the number of E shares of Silver = the number of E shares of Bronze = the
number of GOI Bonds.
Wealth in the beginning of the year =
10,000+15,000+14,000+36,000 = 75,000
Wealth at the end of the year =
1,725 +1,000+700+3,600+9,800+16,200+20,000+34,500 = 87525
Wealth ratio of the market = 87525/75000 = 1.167
Rate of return on market portfolio = RM = 16.70%
Assume that the portfolio referred here is being constituted by these four securities
and the amount of investment in all the four securities is equal. Beta of the portfolio
in this case : (0.60)(.25) +(0.80)(.25) +(.60)(.25) +(1)(.25) = 0.75
Average return of the portfolio7 = RF + Beta(RM –RF)
15.75 = RF + .75 (16.67 – RF)
Solving the equation, RF = 12.99%
Expected return on equity
shares of :
Gold
Silver
Bronze
12.99 + 0.60(16.70 –12.99) =
12.99 + 0.80(16.70 –12.99) =
12.99 + 0.60(16.70 –12.99) =
15.216
15.958
15.216
GOI Bonds 12.99 + 1(16.70 –12.99) = 16.70
Q. No. 34 : Q. No. 34 : Q. No. 34 : Q. No. 34 : Following is the data regarding six securities:
A B C D E F
Returns (%) 8 8 12 4 9 8
Risk (%)
(Standard Deviation)
4 5 12 4 5 6
(i)(i)(i)(i) Which of the securities will be selected?
(ii)(ii)(ii)(ii) Assuming perfect correlation, analyze whether it is preferable to invest
75% in security A and 25% in security C. (NOV.96). (NOV.96). (NOV.96). (NOV.96)
Answer (i)Answer (i)Answer (i)Answer (i)
SET A:SET A:SET A:SET A:
(a) A, B and F have same return but A’s SD is least. Hence, B and F are rejected.
7 The term refers to average expected return of the portfolio

39
(b) Now we are left with A, C, D and E. A and D have same SD but D’s return is
lower. Hence D is rejected. We are left with A, C and E.
SET B: SET B: SET B: SET B:
Security Coefficient of variation
A (4/8) x 100 = 50%
C (12/12) x 100 = 100%
E (5/9) x 100 = 55.56%
The securities may be selected in the following order:
(i) A (ii) E (iii) C
Answer (ii)Answer (ii)Answer (ii)Answer (ii)
Portfolio return = 9% SD = 6%
The investment may not be made in this portfolio as a better investment opportunity (investment in E) is available. Q. �o.35
The results of four portfolio managers for a 5-years period are as follows: (RF 10%,
RM 16%)
Portfolio Manager Average Return (%) Beta
Warren 14 0.80
King 17 1.05
Tony 17 1.25
Gates 15 0.90
Select the manager with best performance.
Teaching noteTeaching noteTeaching noteTeaching note:::: Expected return v/s likely return : The term expected return, in
RISK AND RETURN chapter, is used to convey two meanings:
(I) Likely return i.e. what an investor is likely to get i.e. the investor hopes to get
(It is estimated on the basis of past returns) It is also referred as average return
(of past years). Given probabilities, it is estimated on the basis of probabilities.
(II) Expected return i.e. i.e. what an investor deserves to get in view of risk he
has taken (it is equal to RF + RISK PREMIUM) It is also required return. Risk
premium may be calculated on the basis of Beta or SD.
How to identify whether an expected return given in the question is expected
(Likely) or Expected (Risk based)? The answer is simple. If it has been calculated
on the basis of Beta or SD it is expected (risk based) otherwise it is Expected
(Likely).

40
AnswerAnswerAnswerAnswer
Expected return
(risk based)
Expected return
(average return
based on
historical returns)
Comment
Warren 10+0.80(16-10)= 14.80 14 Performance not
satisfactory
King 10+1.05(16-10)= 16.30 17 Performance
satisfactory
Tony 10+1.25(16-10) =17.50 17 Performance not
satisfactory
Gates 10+0.90(16-10)= 15.40 15 -----do------
King’s performance is the best.
Q. No. 36 :Q. No. 36 :Q. No. 36 :Q. No. 36 :
The following data relate to four different portfolios:
Portfolio Expected Rate of S.D. of Returns
Return from Portfolios
A 11% 6.00
B 14% 7.50
C 10% 3.00
D 15% 9.00
The expected return on market portfolio is 8.50 percent with a standard deviation of
3. The RF is 5 per cent. Comment on each of these portfolios.
Answer Answer Answer Answer
Expected return
(risk based)
Expected return
(average return based on
historical returns)
Comment about
performance
A 5+ (3,50)(6/3) = 12 11% Not satisfactory
B 5+(3,50)(7.50/3) = 13.75 14% Satisfactory
C 5+(3,50)(3/3) = 8.50 10% Satisfactory
D 5+(3,50)(9/3) = 15.50 15% Not satisfactory
REDUCING THE RISK OF A PORTFOLIOREDUCING THE RISK OF A PORTFOLIOREDUCING THE RISK OF A PORTFOLIOREDUCING THE RISK OF A PORTFOLIO:
There are two methods of reducing the risk of a portfolio:
(i) Investing a part of investible funds in risk free securities.
(ii) Futures contracts

41
� Investment in Risk free securitiesInvestment in Risk free securitiesInvestment in Risk free securitiesInvestment in Risk free securities
Q. No. 37 :Q. No. 37 :Q. No. 37 :Q. No. 37 : A senior citizen has Rs.500000 to invest. He wants to invest this amount
in different securities. He wants that Beta of his portfolio should be 0.90. He
selected 5 securities having average Beta of 1.20. How he can weight his portfolio to
reach his target Beta?
Answer :Answer :Answer :Answer :
INVESTMENT β WEIGHT
FIVE SECURITIES 1.20 W1
RISK FREE 0 W2
β1 X W1 + β2 X W2
PORTFOLIO β = ---------------------------
W1 + W2
(1.20 X W1) +(0 X W2)
0.90 = ------------------------------
1
Solving the equation, W1 = .75, W2 = .25
Q. No. 38:Q. No. 38:Q. No. 38:Q. No. 38: An investor owns the following investments :
(i) 1 million equity shares of Madhav Ltd price Rs. 40 Beta 1.10
(ii) 2 million equity shares of Keshav Ltd price Rs. 30, Beta 1.20
(iii) 3 million equity shares of Bihari Ltd. pric4 Rs. 10, Beta 1.30
The investor wants to reduce the Beta of his portfolio to 0.80. Suggest.
Answer :Answer :Answer :Answer : Calculation of Beta of the investor’s investments :
Name of
invest.
Beta (X) Weight (W) XW
Madhav
Keshav
Bihari
1.10
1.20
1.30
40/130 = .3077
60/130 = .4615
30/130 = .2308
1
0.3385
0.5538
0.3000
1.1923
To reduce the beta to 0.80:To reduce the beta to 0.80:To reduce the beta to 0.80:To reduce the beta to 0.80:
% % % % Required reduction in risk =[(1.1923 – 0.80) / 1.1923 ] x 100 = 32.90%
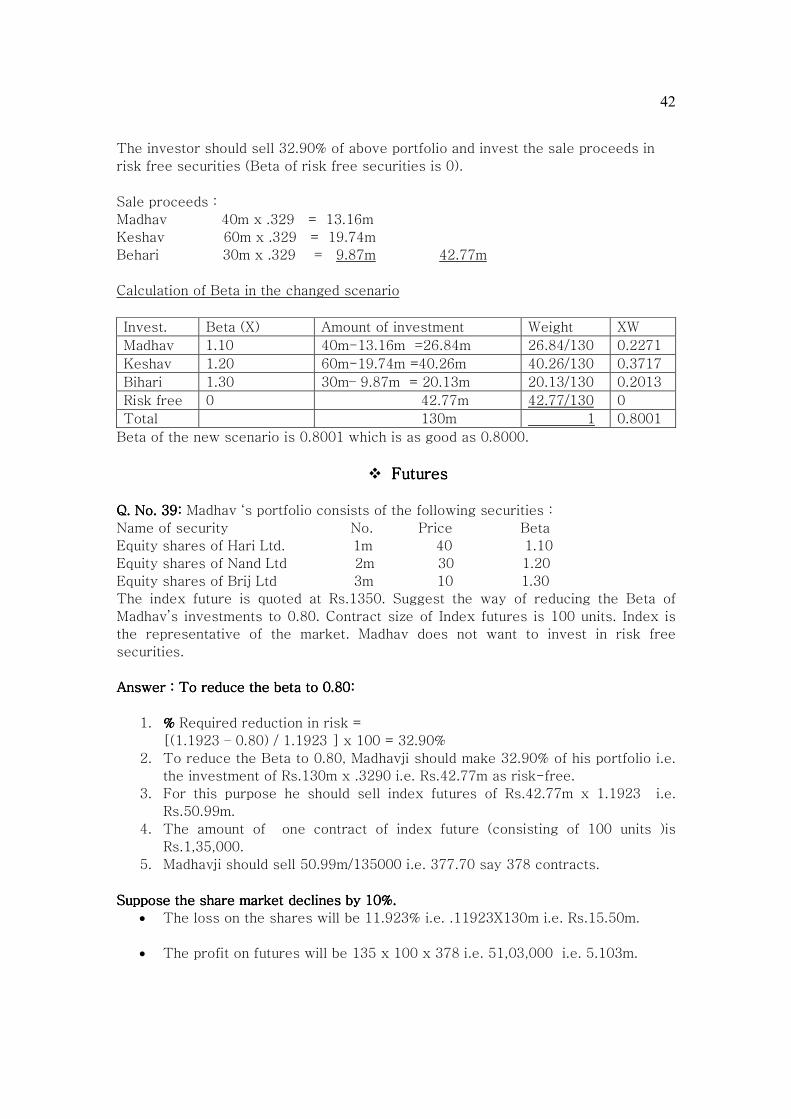
42
The investor should sell 32.90% of above portfolio and invest the sale proceeds in
risk free securities (Beta of risk free securities is 0).
Sale proceeds :
Madhav 40m x .329 = 13.16m
Keshav 60m x .329 = 19.74m
Behari 30m x .329 = 9.87m 42.77m
Calculation of Beta in the changed scenario
Invest. Beta (X) Amount of investment Weight XW
Madhav 1.10 40m-13.16m =26.84m 26.84/130 0.2271
Keshav 1.20 60m-19.74m =40.26m 40.26/130 0.3717
Bihari 1.30 30m– 9.87m = 20.13m 20.13/130 0.2013
Risk free 0 42.77m 42.77/130 0
Total 130m 1 0.8001
Beta of the new scenario is 0.8001 which is as good as 0.8000.
� FuturesFuturesFuturesFutures
Q. No. 39:Q. No. 39:Q. No. 39:Q. No. 39: Madhav ‘s portfolio consists of the following securities :
Name of security No. Price Beta
Equity shares of Hari Ltd. 1m 40 1.10
Equity shares of Nand Ltd 2m 30 1.20
Equity shares of Brij Ltd 3m 10 1.30
The index future is quoted at Rs.1350. Suggest the way of reducing the Beta of
Madhav’s investments to 0.80. Contract size of Index futures is 100 units. Index is
the representative of the market. Madhav does not want to invest in risk free
securities.
Answer :Answer :Answer :Answer : To reduce the beta to 0.80:To reduce the beta to 0.80:To reduce the beta to 0.80:To reduce the beta to 0.80:
1. % % % % Required reduction in risk =
[(1.1923 – 0.80) / 1.1923 ] x 100 = 32.90%
2. To reduce the Beta to 0.80, Madhavji should make 32.90% of his portfolio i.e.
the investment of Rs.130m x .3290 i.e. Rs.42.77m as risk-free.
3. For this purpose he should sell index futures of Rs.42.77m x 1.1923 i.e.
Rs.50.99m.
4. The amount of one contract of index future (consisting of 100 units )is
Rs.1,35,000.
5. Madhavji should sell 50.99m/135000 i.e. 377.70 say 378 contracts.
Suppose the share market declines by 10%.Suppose the share market declines by 10%.Suppose the share market declines by 10%.Suppose the share market declines by 10%.
• The loss on the shares will be 11.923% i.e. .11923X130m i.e. Rs.15.50m.
• The profit on futures will be 135 x 100 x 378 i.e. 51,03,000 i.e. 5.103m.

43
• Net loss on both the positions = 15.5m –5.103m i.e. 10.397 m. This is
approximately equal to 8% of Rs.130m.
ENHANCING THE RISK OF A PORTFOLIOENHANCING THE RISK OF A PORTFOLIOENHANCING THE RISK OF A PORTFOLIOENHANCING THE RISK OF A PORTFOLIO:
There are two methods of enhancing the risk of a portfolio:
(i) Borrowing funds and investing in risky securities
(ii) Futures contracts
A natural query: why the investor would like to enhance his risk? The desire for
higher return entices him to go for enhancing the risk (in the hope of getting
higher return.)
Borrowing Funds andBorrowing Funds andBorrowing Funds andBorrowing Funds and Investing in Risky AssetsInvesting in Risky AssetsInvesting in Risky AssetsInvesting in Risky Assets
Q. No. 40 : Q. No. 40 : Q. No. 40 : Q. No. 40 : Risk free rate of return is 8%.The return from market portfolio is
expected to be 16%. The standard deviation of expected returns from market
portfolio is 10%. Calculate the expected return and standard deviation of following
portfolios:(i) All funds are invested in market portfolio,(ii) All funds are invested in
risk free securities,(iii) 40% of funds are invested in risk free securities and 60 % in
market portfolio and (iv) the investor borrows an amount equal to 20% of his funds
and invests all funds (his own as well as borrowed finds ) in market portfolio.
Answer :Answer :Answer :Answer :
(i) Return : 16% SD = 10%
(ii) Return : 8% SD = 0%
(iii) Return : ( 0.40x8) + (0.60x16) = 12.80%
Variance=(0.40)2.(0)2 +(0.60)2.(0.10)2 +2(0.40)(0.60)(r12)(0)(10) = 0.0036
SD = 6%
(iv) w1 = 1.20 w2 = -0.20
Return = (1.20)(16) + (-0.20)(8) = 17.60
Variance=(1.20)2.(0.10)2 +(-0.20)2.(0)2 +2(1.20)(-0.20)(r12)(10)(0) = 0.0144
SD = 12%
Q. No. 41 :Q. No. 41 :Q. No. 41 :Q. No. 41 : An investor has Rs.1,00,000 to invest. He wants to obtain a return of 20
% on this amount. State the course of his action if Return on the market portfolio is
18 % and Risk free rate of return is 13 %. If the SD of the market portfolio is 5, what
is the standard deviation of his action?
Answer Answer Answer Answer
• Assumption: The investor can borrow at risk free rate.

44
• Let’s borrow Rs.X and invest in the market together with Rs.1,00,000.
• Net return on Rs.1,00,000 = [(100000 + X)(.18)] –[(0.13) X ] = 20,000.
Solving the equation, we get X = Rs.40,000.
To calculate the overall return and risk, the borrowing is taken as negative
investment, its risk is considered as zero (there is no risk in borrowing, there is risk
in investing the amount of borrowing in the shares of the three companies) and its SD
is taken as zero.
• W1 = 1,40,000 / 1,00,000 = 1.40
• W2 = -40,000/ 100000 = -0.40
• Overall return = 0.18 (1.40) + 0.13 (- 0.40) = 0.20
• Overall SD√ [(1.40)2.(5)2 + (-40)2.(0)2 + 2(1.40)(0-.40)(r)(5)(0)]=7
Q. No. 42Q. No. 42Q. No. 42Q. No. 42: An investor owns the following investments :
(i) 1 million equity shares of Madhav Ltd price Rs. 40 Beta 1.10
(ii) 2 million equity shares of Keshav Ltd price Rs. 30, Beta 1.20
(iii) 3 million equity shares of Bihari Ltd. pric4 Rs. 10, Beta 1.30
The investor wants to enhance the Beta of his portfolio to 1.50. Suggest.
AnswerAnswerAnswerAnswer:
To increase the Beta to 1.50, To increase the Beta to 1.50, To increase the Beta to 1.50, To increase the Beta to 1.50, the investor should borrow some money (assuming that
the investor can borrow money at the rate of risk free rate of interest) and invest the
same in the equity shares of the three companies (the new investment should be in
the ratio of amounts of present investments).
To calculate the overall beta, the borrowing is taken as negative investment, its risk
is considered as zero (there is no risk in borrowing, there is risk in investing the
amount of borrowing in the shares of the three companies) and its beta is taken as
zero.
% % % % Required increase in risk = [(1.50 – 1.1923) / 1.1923 ] x 100 = 25.81 %
Borrowings = 130m x .2581 = 33.55 m. This amount should be invested in the shares
of the three companies (the new investment should be in the ratio of amounts of
present investments)
Calculation of Beta in the changed scenario
Investment Beta
(X)
Amount of investment Weight (W) XW
Madhav 1.10 40m +10.32m =
50.32m
50.32/130 .4258
Keshav 1.20 60m +15.48m
=75.48m
75.48/130 .6967

45
Bihari 1.30 30m + 7.75m = 37.75 37.75/130 .3775
Borrowings 0 - 33.55m -33.55/130 0
130m 1 1.50
FutFutFutFuturesuresuresures
Q. No. 43Q. No. 43Q. No. 43Q. No. 43 : Madhav ‘s portfolio consists of the following securities :
Name of security No. Price Beta
Equity shares of Hari Ltd. 1m 40 1.10
Equity shares of Nand Ltd 2m 30 1.20
Equity shares of Brij Ltd 3m 10 1.30
The index future is quoted at Rs. 1350. Suggest the way of increasing the Beta to
1.50. Contract size of Index futures is 100 units. Index is the representative of the
market. Your answer should be based on Index futures.
Answer :Answer :Answer :Answer : To increase the beta to 1.50:To increase the beta to 1.50:To increase the beta to 1.50:To increase the beta to 1.50:
% % % % Required increase in risk = [(1.50 -1.1923 ) / 1.1923 ] x 100 = 25.81%
To increase the Beta to 1.50, Madhavji should purchase index futures of Rs.130m x
0.2581 x 1.1923 i.e. 40m. The amount of one contract of index future (consisting of
100 units ) is Rs.1,35,000. Madhavji should purchase 40m/135000 i.e. 296 contracts.
Suppose the share market declines by 10%.Suppose the share market declines by 10%.Suppose the share market declines by 10%.Suppose the share market declines by 10%.
The loss on the shares will be 11.923% i.e. .11923X130m i.e. Rs.15.50m.
The loss on futures will be 13500 x 296 i.e. 3.996m
Total loss=19.496m.(This amount is approximately equal to 15% of 130m)
HEDGING THE PORTFOLIOHEDGING THE PORTFOLIOHEDGING THE PORTFOLIOHEDGING THE PORTFOLIO
Q. N0. 44:Q. N0. 44:Q. N0. 44:Q. N0. 44: Which positions on index future gives a speculator, a complete hedge
against the following transactions:
(i) The share of Right Ltd is going to rise. He has a long position on cash market of
Rs.50 Lakh on the Right Ltd. the beta of the Right Ltd. is 1.25.
(ii) The share of Wrong Ltd is going to depreciate. He has a short position on the
cash market of Rs. 20 Lakhs of Wrong Ltd. the beta of Wrong Limited is 0.90.
(iii) The share of Fair Limited is going to stagnant. He has a short position on the
cash market of Rs.20 Lakhs of the Fair Ltd. the beta of the Fair Ltd. is 0.75.
AnswerAnswerAnswerAnswer
(i) Sell index futures Rs.62,50,000.
(ii) Purchase index futures Rs.18,00,000
(iii) Purchase index futures Rs. 15,00,000

46
Q. No. 45 : Q. No. 45 : Q. No. 45 : Q. No. 45 : Makhanchor purchased 50,000 equity shares of Pootana Ltd. @ Rs. 200
on 28th Sept. 2005. Beta of his investment is 1.20. he just cannot sell these shares
before 29th December, 2005. Immediately after purchasing these shares, he got
adverse report about the company. He apprehends that the prices of his investment
may fall. He gathers from the market that 29th December, 2005 maturity Index
futures is trading in the market at 1200. Market lot of Index futures is 100 units.
Suggest the action for complete hedge. Suppose he acts on your advice, what will be
his profit of loss if (i) on 29th December, index falls to 1140 (ii) share price to
Pootana Ltd goes down to 185 & (iii) he sells all his shares of Pootana on 29th
December, 2005.
Answer Answer Answer Answer
Purchase position of shares = Rs.1,00,00,000 Beta 1.20.
To protect against loss, Makhanchor should sell index futures of Rs.1,20,00,000 i.e.
he should enter 100 index futures sale contracts.
Maturity:
Gain on index futures=
Rs.60 per unit x 100 units per contract x100 contracts = Rs. 6,00,000
Loss on 50000 shares = 50000 x 15 = Rs. 7,50,000
Net loss Rs. 1,50,000
Q. No. 46Q. No. 46Q. No. 46Q. No. 46 : Sh Bihari ji has the following position in cash segment of the stock
exchange. He is interested in reducing risk to the extent given in the following lines
using Index futures. Suggest.
1. He has a long position on cash market of Rs.50 Lakh on the Right Ltd. the beta of
the Right Ltd. is 1.25. He wants to reduce his risk by 20%.
2. He has a short position on the cash market of Rs. 20 Lakhs of Wrong Ltd. the beta
of Wrong Limited is 0.90. He wants to reduce his risk by 10%
3. He has a short position on the cash market of Rs.20 Lakhs of the Fair Ltd. the beta
of the Fair Ltd. is 0.75. He wants to reduce his risk by 20%
AnswerAnswerAnswerAnswer
Sale Index in the futures market 50L x 1.25 x 0.20
Purchase Index in the futures market 20L x 0.90 x 0.10
Purchase Index in the futures market 20L x 0.75 x 0.20
Net position in Index futures Sale 7.70L
Suppose the market falls by 10% :Suppose the market falls by 10% :Suppose the market falls by 10% :Suppose the market falls by 10% :
Profit on futures +0.77L
Loss on Rights Ltd 50L x 1.25 x 0.10 x 0.20 -1.25L
Profit on Wrong Ltd 20L x 0.90 x 0.10 x 0.10 + 0.18L
Profit on Fair Ltd 20L x 0.75 x 0.10 x 0.20 +0.30L
Total profit or loss 0

47
Suppose the market rises by 10% :Suppose the market rises by 10% :Suppose the market rises by 10% :Suppose the market rises by 10% :
Loss on futures -0.77L
Profit on Rights Ltd 50L x 1.25 x 0.10 x 0.20 +1.25L
Loss on Wrong Ltd 20L x 0.90 x 0.10 x 0.10 - 0.18L
Loss on Fair Ltd 20L x 0.75 x 0.10 x 0.20 -0.30L
Total profit or loss 0
Q.No.47Q.No.47Q.No.47Q.No.47: Ram Buys 10000 shares of X Ltd at Rs.22 and obtains a complete hedge of
shorting 400 Nifties at Rs.1100 each. He closes out his position at the closing price
of the next day at which point the share of X Ltd. has dropped 2% and the Nifty
future has dropped 1.50%. What is the overall profit/loss of the set of transaction.?
(MAY, 2005)(MAY, 2005)(MAY, 2005)(MAY, 2005)
AnswerAnswerAnswerAnswer
Sales of Nifties = 400x1100 = Rs.4,40,000
Purchase of shares of Rs.2,20,000
Loss on shares = Rs.4,400
Profit on Nifties = Rs.6,600
Profit of the set of the transaction = Rs.2,200.
Q. NQ. NQ. NQ. Noooo.48:.48:.48:.48: NARAINI MUTUAL fund is holding 1m equity shares of Shri Ltd. The
current market price is Rs.100 per share. The mutual fund manager believes that
after six months the share is like to appreciate substantially but has the
apprehension that for next six months it may face a declining tendency. If the
apprehension materializes, the NAV of the MF scheme will come down and that may
bring down the reputation of the MF. He wants to completely hedge this position
through the index futures. The stock exchange is currently traded at 5000. Market
lot size is 40 units. Beta value of equity shares of Shri Ltd is 0.80. Suggest the
course of his action. Would this position would be risk less? What would be the beta
of this hedged position?
AnswerAnswerAnswerAnswer
Position in cash market: Investment (purchase) of Rs.100m equity shares.
Suggested position in derivative market for hedging: Sell futures Rs.80m.
The position would be risk less if the return on equity shares of Shri Ltd changes by
80% of the change in return of the Index and that to in the same direction.
The beta of the hedged position would be zero provided the return on equity shares
of Shri Ltd changes by 80% of the change in return of the Index and that to in the
same direction.
MODERN PORTFOLIO THEMODERN PORTFOLIO THEMODERN PORTFOLIO THEMODERN PORTFOLIO THEORYORYORYORY

48
MPT seeks to construct an optimal portfolio by considering the relationship between
risk and return. The theory recommends that the risk of a particular security should
not looked on a standalone basis, rather it should be looked in relation to portfolio. A
security may be very risky but when combined with some other security, the
combination may not be that much risky (because some of its negative fluctuations
may be set off by positive fluctuations of the other security)
The theory explores how an investor can use diversification to optimize his
portfolio.8 Markowitz showed that, using portfolio, the risk can be minimized without
reducing the expected return, by diversifying out the unsystematic risk. Consider
two securities, A and B. A’s expected return is 10% and SD is 15%, B’s expected
return is 20%, SD is 30%. Coefficient of correlation between the returns of the two
assets is 0. An investor is planning to invest all his money in A because he finds that
he cannot bear the risk of B (because B’s risk is quite high). A portfolio manager
suggests him that he may invest 80% of his funds in A and 20% of funds in B. This
will enhance his return to 12% and risk will be reduced to 13.40%.
The theory suggests three steps for portfolio decisions:
(I) Select the securities of your choice9 and Construct all possible portfolios.
(II) Classify these portfolios into two parts (a) Efficient10 and (b) Inefficient11. A
portfolio is classified as efficient one if it is not inefficient.
A portfolio is inefficient if :
(a) it is rejected by application of Set A, or
(b) there exists some other portfolio which is better than this portfolio in both the
respects. i.e. it has higher return and lower risk.
When the efficient portfolios are plotted in risk-return space, we get efficient
frontier. A set of all efficient portfolios is known as efficient frontier12 . As per MPT,
an investor should seek a portfolio that lies on the efficient set.
8 By optimizing the portfolio we mean : constructing a portfolio that gives maximum return for an
acceptance level of risk .
9 Here the investor can take the help of Set A given in the beginning of the chapter.
10 A portfolio is efficient if
(a) it is not rejected by application of Set A, and
(b) there exists no other portfolio which has higher return and lower risk.
11
“ A portfolio is not efficient if there is another portfolio with a higher expected return and a
lower standard deviation, a higher expected return and same standard deviation, or same expected
return but a lower standard deviation.”- Van Horne
12
The efficient frontier is the set of portfolios on the upper left boundary of the attainable set,
between the minimum variance portfolio and the maximum return portfolio.

49
(III) Select the portfolio on efficient frontier. For this purpose, a tangent should be drawn of the efficient frontier starting from the point of Risk Free rate of return on Y-Axis.
Q. �o. 49 : Assuming r between returns from two securities A and B to be -1, Find portfolio return and portfolio SD using the following data : Security A : Mean return 12, SD 16; Security B: mean return 16 SD 20.You may assume that portfolio consists of (i) 100% in A and 0 in B (ii) 90% in A and 10% in B (iii) 80% in A and 20% in B………(xi) 0% and 100% in B. Which of these portfolios are inefficient? How your answer will change if (a) r = +1, (b) r=0, (c) r= +0.5 and (d) =-0.50. Draw the portfolios on Risk and return Chart. Answer Answer Answer Answer
Port-
folio
No.
Invest-
ment
in A %
Invest-
ment
in B %
Port-folio
Return%
Port-
folio SD
if r= r= r= r= ----1111
Whether inefficient
1 100 0 12.00 16.00 Yes, Some other portfolio (No.2)
offers higher return with lower risk
2 90 10 12.40 12.40 Yes, Some other portfolio (No.3)
offers higher return with lower risk
3 80 20 12.80 8.80 Yes, Some other portfolio (No.4)
offers higher return with lower risk
4 70 30 13.20 5.20 Yes, Some other portfolio ( No.5)
offers higher return with lower risk
5 60 40 13.60 1.60 No as it is neither rejected by
application of Set A nor there exists
some other portfolio witch has
higher return and lower SD.
6 50 50 14.00 2.00 ----------do-------
7 40 60 14.40 5.60 ----------do-------
8 30 70 14.80 9.20 ----------do-------
9 20 80 15.20 12.80 ----------do-------
10 10 90 15.60 16.40 ----------do-------
11 0 100 16.00 20.00 ----------do-------

50
X
Y
Diagram 2
Risk
Return
16
15
14
13
12
11
10
9
8
0
2 4 6 8 10 12 14 1 6 18 20
(r =-1)
Answer (a)Answer (a)Answer (a)Answer (a)
Port-
folio
No.
Invest-
ment
in A
%
Invest-
ment
in B
%
Port-
folio
Return
%
Port-
folio
SD if
r = +1r = +1r = +1r = +1
Whether inefficientWhether inefficientWhether inefficientWhether inefficient
1 100 0 12.00 16.00 No as it is neither rejected by
application of Set A nor there
exists some other portfolio witch
has higher return and lower SD.
2 90 10 12.40 16.40 ----------do------------
3 80 20 12.80 16.80 ----------do------------
4 70 30 13.20 17.20 ----------do------------
5 60 40 13.60 17.60 ----------do------------
6 50 50 14.00 18.00 ----------do------------
7 40 60 14.40 18.40 ----------do------------
8 30 70 14.80 18.80 ----------do------------
9 20 80 15.20 19.20 ----------do------------
10 10 90 15.60 19.60 ----------do------------
11 0 100 16.00 20.00 ----------do------------
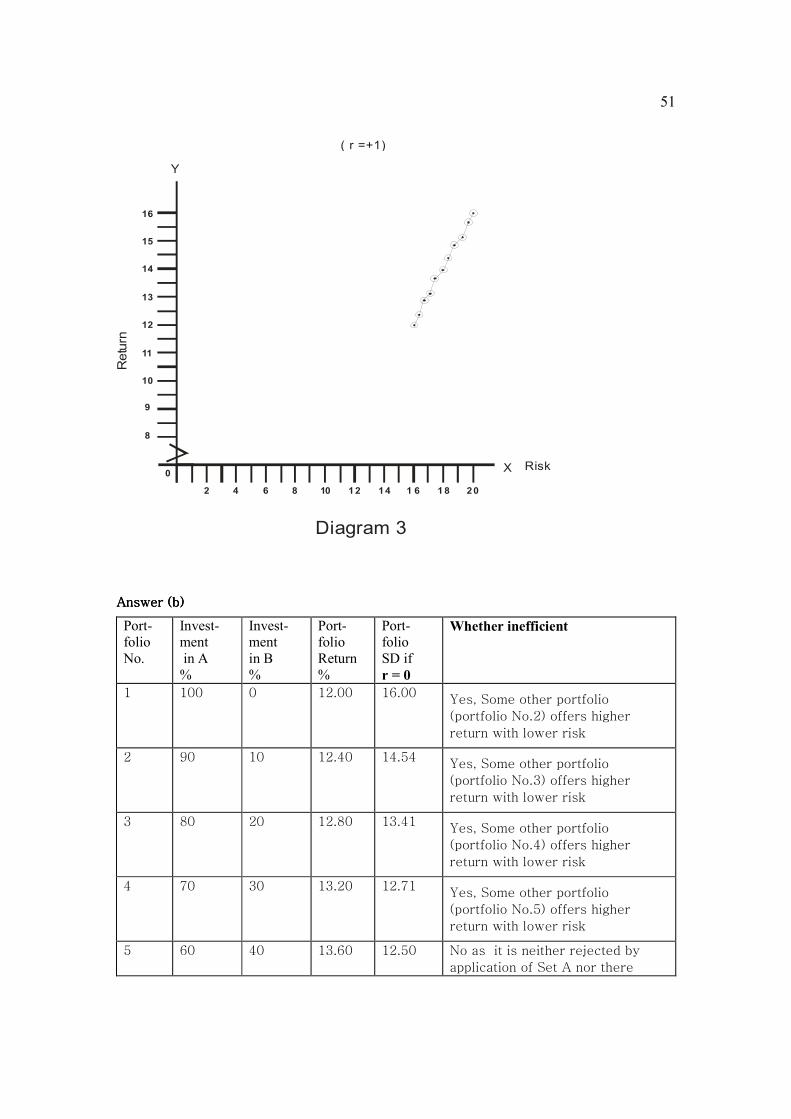
51
X
Y
Diagram 3
Risk
Return
16
15
14
13
12
11
10
9
8
0
2 4 6 8 10 12 14 1 6 18 20
( r =+1)
Answer (b) Answer (b) Answer (b) Answer (b)
Port-folio No.
Invest- ment in A %
Invest- ment in B %
Port-folio Return %
Port-folio SD if r = 0
Whether inefficient
1 100 0 12.00 16.00 Yes, Some other portfolio
(portfolio No.2) offers higher
return with lower risk
2 90 10 12.40 14.54 Yes, Some other portfolio
(portfolio No.3) offers higher
return with lower risk
3 80 20 12.80 13.41 Yes, Some other portfolio
(portfolio No.4) offers higher
return with lower risk
4 70 30 13.20 12.71 Yes, Some other portfolio
(portfolio No.5) offers higher
return with lower risk
5 60 40 13.60 12.50 No as it is neither rejected by
application of Set A nor there

52
exists some other portfolio witch
has higher return and lower SD.
6 50 50 14.00 12.81 ----------do----------
7 40 60 14.40 13.60 ----------do----------
8 30 70 14.80 14.80 ----------do----------
9 20 80 15.20 16.32 ----------do----------
10 10 90 15.60 18.07 ----------do----------
11 0 100 16.00 20.00 ----------do----------
X
Y
Diagram 4
Risk
Return
16
15
14
13
12
11
10
9
8
0
2 4 6 8 10 12 14 1 6 18 20
(r = 0)
Answer (c) Answer (c) Answer (c) Answer (c)
Port-
folio
No.
Invest-
ment
in A
%
Invest-
ment
in B
%
Port-
folio
Return
%
Port-folio
SD if
r= +0.5r= +0.5r= +0.5r= +0.5
Whether inefficientWhether inefficientWhether inefficientWhether inefficient
1 100 0 12.00 16.00 Yes, Some other portfolio
(portfolio No.2) offers higher
return with lower risk
2 90 10 12.40 15.50 Yes, Some other portfolio
(portfolio No.3) offers higher
return with lower risk
3 80 20 12.80 15.20 Yes, Some other portfolio
(portfolio No.4) offers higher
return with lower risk
4 70 30 13.20 15.12 No as it is neither rejected by
application of Set A nor there
exists some other portfolio
witch has higher return and
lower SD.

53
5 60 40 13.60 15.26 ----------do---------
6 50 50 14.00 15.62 ----------do---------
7 40 60 14.40 16.18 ----------do---------
8 30 70 14.80 16.92 ----------do---------
9 20 80 15.20 17.82 ----------do---------
10 10 90 15.60 18.85 ----------do---------
11 0 100 16.00 20.00 ----------do---------
Diagram 5
X
Y
Risk
Return
16
15
14
13
12
11
10
9
8
0
2 4 6 8 10 12 1 4 1 6 18 20
(r = + 0.50)
Answer (d) Answer (d) Answer (d) Answer (d)
Port-
folio
No.
Invest-
ment
in A
%
Invest-
ment
in B
%
Port-folio
Return
%
Port-
folio
SD if
r= r= r= r= ---- .5.5.5.5
Whether inefficientWhether inefficientWhether inefficientWhether inefficient
1 100 0 12.00 16.00 Yes, Some other portfolio
(portfolio No.2) offers higher
return with lower risk
2 90 10 12.40 13.51 Yes, Some other portfolio
(portfolio No.3) offers higher
return with lower risk
3 80 20 12.80 11.34 Yes, Some other portfolio
(portfolio No.4) offers higher
return with lower risk
4 70 30 13.20 9.71 Yes, Some other portfolio
(portfolio No.5) offers higher
return with lower risk

54
5 60 40 13.60 8.91 No as it is neither rejected by
application of Set A nor there
exists some other portfolio
witch has higher return and
lower SD.
6 50 50 14.00 9.17 ----------do-----------
7 40 60 14.40 10.40 ----------do-----------
8 30 70 14.80 12.32 ----------do-----------
9 20 80 15.20 14.66 ----------do-----------
10 10 90 15.60 17.26 ----------do-----------
11 0 100 16.00 20.00 ----------do-----------
Diagram 6
(r = - 0.50)
X
Y
Risk
Return
16
15
14
13
12
11
10
9
8
0
2 4 6 8 10 12 14 1 6 18 20

55
Diagram 7
(r = - 0 .50)
(r = + 1)
( r = 0)
( r = + 0.50)
(r = -1)
X
Y
Risk
Return
16
15
14
13
12
11
10
9
8
0
2 4 6 8 10 12 14 1 6 18 20
Q. No.50: Plot the following portfolios on a graph;Q. No.50: Plot the following portfolios on a graph;Q. No.50: Plot the following portfolios on a graph;Q. No.50: Plot the following portfolios on a graph;
A B C D E F G H
Expected return 10 13 14 16 18 19 19 20
SD 23 20 24 30 30 32 36 43
Which of the portfolios are efficient?
(a) Suppose you can borrow and lend at 10%. Which of the portfolio is the best?
(b) You can’t borrow or lend. You want that the SD of your investment should not
be more than 29. What is the maximum return you could expect?
(c) You can borrow or lend at 10%. You want that the SD of your investment
should not be more than 28. What is the maximum return you could expect?
AnswerAnswerAnswerAnswer
Portfolio
No.
Portfolio
Return %
Portfolio
SD
Whether inefficient
A 10 23 Yes, because B’s return is higher and risk is
lower as compared to this security
B 13 20 No, as it is neither rejected by application of
Set A nor there exists some other portfolio

56
which has higher return and lower SD.
C 14 24 ---------do-----------
D 16 30 Yes, its return is less than that of E though its
risk is the same as that of E
E 18 30 No, as it is neither rejected by application of
Set A nor there exists some other portfolio
which has higher return and lower SD.
F 19 32 --------------do-----------
G 19 36 Yes, its return is same as that of F but risk is
more than that of F.
H 20 43 No as it is neither rejected by application of
Set A nor there exists some other portfolio
which has higher return and lower SD.
Efficient portfolios are: : : : B, C, E, F, H
Teaching noteTeaching noteTeaching noteTeaching note: : : : Not to be given in the exam. The rate at which a party can lend as
well borrow is considered to be risk free rate of interest.
(a) (a) (a) (a) F (b) (b) (b) (b) C
(c) (c) (c) (c) The portfolio of our choice is F but its SD is 32 while we have to limit the SD to
28. To achieve the reduction in SD, we may invest a part of investible funds in F and
other part in Risk free securities. Let’s invest w1 in F and w2 in Risk free.
-------------------
28 = √(w1 )2.(32)2 +0 + 0 w1 = 0.875
Portfolio return = 19x0.875 + 10x0.125 = 17.875%

57
X
Y
Diagram 8
Risk
Return
20
19
18
17
16
15
14
13
12
11
10
0
2 4 6 8 10 12 14 16 18 20 2 2 2 4 2 6 28 30 3 2 34 36 38 40 42 44
Q. No. 51 :Q. No. 51 :Q. No. 51 :Q. No. 51 : Assuming r between returns from two securities A and B to be -1, Find
portfolio risk and portfolio SD using the following data : Security A : Mean return
12, SD 16; Security B: mean return 16 SD 20.You may assume that portfolio consists
of (i) 100% in A and 0 in B (ii) 80% in A and 20% in B (iii) 60% in A and 40% in B (iv)
40% in A and 60% in B (v) 20% in and 80% in B and (vi) 0 in A and 100% in B..
Assuming the risk free rate of return is 8%, what amount should be invested by an
investor in A. Assume that the investor’s investible funds amount to Rs.10m.
Remember:Remember:Remember:Remember: There are two basic differences between Traditional Theory of portfolio
and Modern Portfolio Theory (MPT).
(i) Traditional theory does not consider the coefficient of correlation between the
returns of various securities; The MPT reveals that the degree of risk
reduction depends upon degree of coefficient correlation between returns from
different investments.
(ii) As per Traditional theory, investment decisions should be based on Mean
Return and Risk (SD) of various securities; (We base our investment decisions
on the basis of Coefficient of variation. Coefficient of variation is calculated
using Mean and SD.
As per MPT, the investment should be taken on the basis of SD and Risk premium
Answer Answer Answer Answer

58
Port-
folio
No.
Invest-
ment
in A %
Invest-
ment
in B %
Port-folio
Return%
Port-folio
SD if
r= r= r= r= ----1111
Whether inefficient
1 100 0 12.00 16.00 Yes, Some other portfolio
(portfolio No. 2) offers
higher return with lower risk
2 80 20 12.80 8.80 Yes, Some other portfolio
(portfolio No. 3) offers
higher return with lower risk
3 60 40 13.60 1.60 No as it is neither rejected
by application of Set A nor
there exists some other
portfolio witch has higher
return and lower SD.
4 40 60 14.40 5.60 ----------do------
5 20 80 15.20 12.80 ----------do------
6 0 100 16.00 20.00 ----------do------
X
Y
Diagram 9
Risk
Return
16
15
14
13
12
11
10
9
8
0
2 4 6 8 10 12 14 1 6 18 20

59
SOME MORE ASPECTS OF “RISK AND RETURNSOME MORE ASPECTS OF “RISK AND RETURNSOME MORE ASPECTS OF “RISK AND RETURNSOME MORE ASPECTS OF “RISK AND RETURN
1. EFFICIENT MARKET HYPOTHESIS
2. ALPHA
3. CHARACTERISTIC LINE
4. SECURITY MARKET LINE (SML)
5. CAPITAL MARKET LINE (CML)
6. MARKET MODEL
7. MATRIX APPROACH IN INVESTMENT DECISIONS
EFFICIENT MARKET HYPOTHESISEFFICIENT MARKET HYPOTHESISEFFICIENT MARKET HYPOTHESISEFFICIENT MARKET HYPOTHESIS
EMH is one of the central ideas of modern finance. Market efficiency means that
the market price of a security reflects all available information. In other words,
as per EMH, an efficient market responds quickly to new information, i.e., market
price of security changes rapidly, completely and accurately in accordance with
new information. (According to Adam Smith, "invisible hand" of the market place
works quickly). “The market efficiency will produce prices that are appropriate
in terms of current knowledge, and investors will be less likely to make unwise
investments.” The key to market efficiency is the high level of competition among participants in the market.
This implies that the new information cannot be used to create a trading strategy
to beat the market i.e. the investor cannot make abnormal profits13 in the share
market (except by chance). According to the EMH, stocks always trade at their
fair market value on stock exchanges, making it impossible for investors to
purchase undervalued stocks or sell stocks for inflated prices. Suppose that
Ranbaxy announces a new drug that could completely prevent Dengu. Suppose
before the announcement the price was Rs.530, after this announcement there
will be no seller at this price. The market price of shares of Ranbaxy will change
immediately to a new equilibrium level14, suppose Rs.600, (where it should be in
view of new announcement).. Suppose an investor gets this information and
places an order at this price believing that he will purchase the shares before
this announcement’s impact on the prices of the share and later on when the
prices will move to Rs.600, he will sell and make an abnormal profit. The
13 By abnormal profit we mean: excess profit relative to risk. 14 The equilibrium price of a stock is determined by demand and supply forces,
based on the available information. Quickly as the fresh information becomes
available, a new equilibrium point is reached. The reason is that market ……
→is crowded by active, intelligent, greedy and rational investors who are
competing against each other for profit maximization. The key to market
efficiency is the high level of competition among participants in the market.
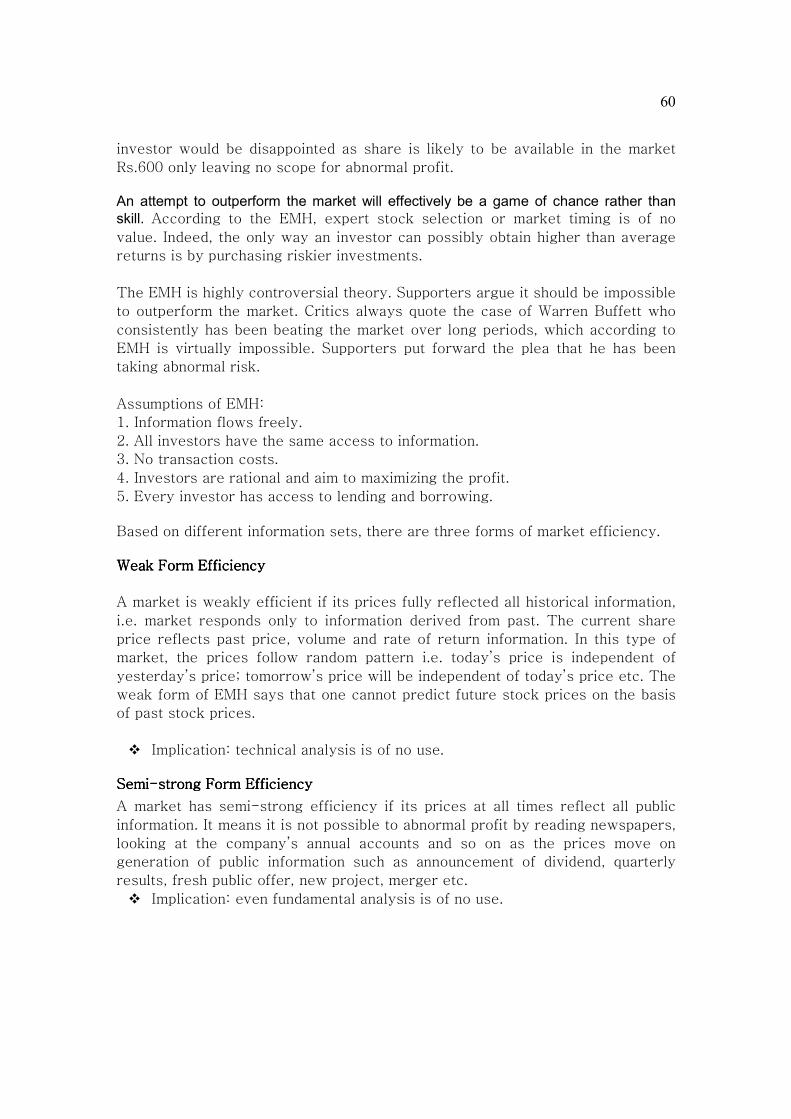
60
investor would be disappointed as share is likely to be available in the market
Rs.600 only leaving no scope for abnormal profit. An attempt to outperform the market will effectively be a game of chance rather than
skill. According to the EMH, expert stock selection or market timing is of no
value. Indeed, the only way an investor can possibly obtain higher than average
returns is by purchasing riskier investments.
The EMH is highly controversial theory. Supporters argue it should be impossible
to outperform the market. Critics always quote the case of Warren Buffett who
consistently has been beating the market over long periods, which according to
EMH is virtually impossible. Supporters put forward the plea that he has been
taking abnormal risk.
Assumptions of EMH:
1. Information flows freely.
2. All investors have the same access to information.
3. No transaction costs.
4. Investors are rational and aim to maximizing the profit.
5. Every investor has access to lending and borrowing.
Based on different information sets, there are three forms of market efficiency.
Weak Form EfficiencyWeak Form EfficiencyWeak Form EfficiencyWeak Form Efficiency
A market is weakly efficient if its prices fully reflected all historical information,
i.e. market responds only to information derived from past. The current share
price reflects past price, volume and rate of return information. In this type of
market, the prices follow random pattern i.e. today’s price is independent of
yesterday’s price; tomorrow’s price will be independent of today’s price etc. The
weak form of EMH says that one cannot predict future stock prices on the basis
of past stock prices.
� Implication: technical analysis is of no use.
SemiSemiSemiSemi----strong Form Efficiencystrong Form Efficiencystrong Form Efficiencystrong Form Efficiency
A market has semi-strong efficiency if its prices at all times reflect all public
information. It means it is not possible to abnormal profit by reading newspapers,
looking at the company’s annual accounts and so on as the prices move on
generation of public information such as announcement of dividend, quarterly
results, fresh public offer, new project, merger etc.
� Implication: even fundamental analysis is of no use.

61
Strong Form EfficiencyStrong Form EfficiencyStrong Form EfficiencyStrong Form Efficiency
Market has strong efficiency if its prices fully reflect all information, both public
and private. Abnormal profit can be made only on the basis of Luck/chance; skills
have no role to play.
� Implications: even insider information is of no use.
Tests for weak form of efficiency: Tests for weak form of efficiency: Tests for weak form of efficiency: Tests for weak form of efficiency:
Run Test: It is a test of randomness of price behavior, (the term randomness
means that the share prices do not follow any trend/pattern) i.e. today’s price is
independent of yesterday’s price; tomorrow’s price will be independent of
today’s price etc. In other words, the test measures the likelihood that a series of
two variables (positive and negative changes) is a random occurrence. There are
two tests:
Run TestRun TestRun TestRun Test
Under this method, the sampling technique of testing the significance is applied.
We find the values of three variables (i) r i.e., no. of runs (ii) n1 (iii) n2 . A run is
defined as the repeated occurrence of the same category of return/price. n1
refers to total number of + changes and n2 refers total number of negative
changes.
We calculate mean and SD of runs using the following formulas:
2n1 n2 X = mean value of r = = ---------- + 1
n1+ n2
2 n1.n2(2n1.n2 - n1 - n2)
SD2 = ---------------------------
(n1 + n2 )2(n1 + n2 -1 )
SD = √(SD)2 Now we find the standard upper limit and standard lower limit of no. of runs for
randomness. If our calculated mean value of r lies within the standard upper limit
and standard lower limits, the randomness is there i.e. the market is weakly
efficient, otherwise it is not weakly efficient.
For calculating the standard upper and lower limit, we have to refer standard
values. These values are available in different tables. If n1 + n2 is less than 30,
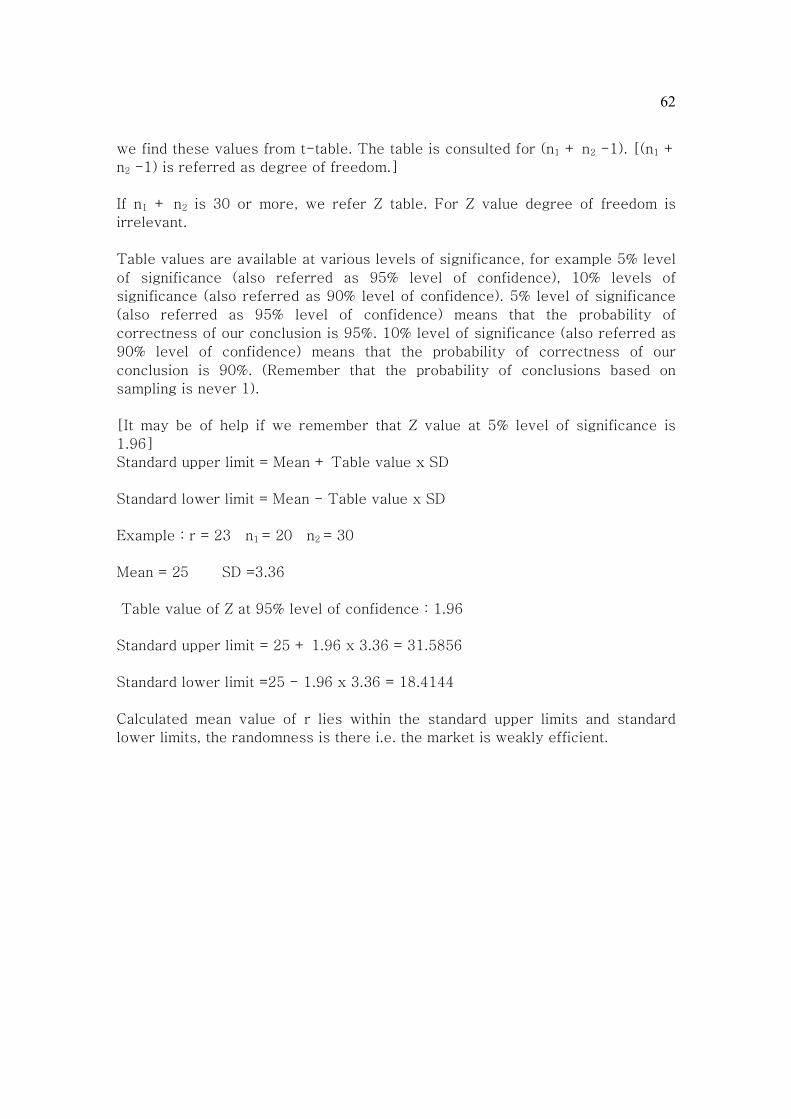
62
we find these values from t-table. The table is consulted for (n1 + n2 -1). [(n1 +
n2 -1) is referred as degree of freedom.]
If n1 + n2 is 30 or more, we refer Z table. For Z value degree of freedom is
irrelevant.
Table values are available at various levels of significance, for example 5% level
of significance (also referred as 95% level of confidence), 10% levels of
significance (also referred as 90% level of confidence). 5% level of significance
(also referred as 95% level of confidence) means that the probability of
correctness of our conclusion is 95%. 10% level of significance (also referred as
90% level of confidence) means that the probability of correctness of our
conclusion is 90%. (Remember that the probability of conclusions based on
sampling is never 1).
[It may be of help if we remember that Z value at 5% level of significance is
1.96]
Standard upper limit = Mean + Table value x SD
Standard lower limit = Mean - Table value x SD
Example : r = 23 n1 = 20 n2 = 30
Mean = 25 SD =3.36
Table value of Z at 95% level of confidence : 1.96
Standard upper limit = 25 + 1.96 x 3.36 = 31.5856
Standard lower limit =25 - 1.96 x 3.36 = 18.4144
Calculated mean value of r lies within the standard upper limits and standard
lower limits, the randomness is there i.e. the market is weakly efficient.

63
Q.Q.Q.Q.No.No.No.No.52525252 The closing value of Sensex for the month of Oct., 2007 is given below:
Date Closing Sensex Value Date Closing Sensex Value
1.10.07 2800
3.10.07 2780
4.10.07 2795
5.10.07 2830
8.10.07 2760
9.10.07 2790
10.10.07 2880
11.10.07 2960
12.10.07 2990
15.10.07 3200
16.10.07 3300
17.10.07 3450
19.10.07 3360
22.10.07 3290
23.10.07 3360
24.10.07 3340
25.10.07 3290
29.10.07 3240
30.10.07 3140
31.10.07 3260
You are required to test the week form of efficient market hypothesis by
applying the run test at 5% and 10% level of significance.
Following value can be used:
Value of t at 5% is 2.101 at 18 degrees of freedom
Value of t at 10% is 1.734 at 18 degrees of freedom
Value of t at 5% is 2.086 at 20 degrees of freedom. Value of t at 10% is 1.725 at
20 degrees of freedom. (8 Marks)) (Nov. 2008 SFM)
Answer Answer Answer Answer
r = 8 n1 = 11 n2 = 8 Mean = 10.26 SD = 2.06
5% Level of significance5% Level of significance5% Level of significance5% Level of significance: Table value of t for 18 degrees of freedom at 5% level
of significance : 2.101
Standard upper limit = 10.26 + 2.101 x 2.06 = 14.5881
Standard lower limit = 10.26 - 2.101 x 2.06 = 5.9319
Calculated mean value of r lies within the standard upper limits and standard
lower limits, the randomness is there i.e. the market is weakly efficient.
10% Level of signif10% Level of signif10% Level of signif10% Level of significance: icance: icance: icance: Table value of t for 18 degrees of freedom at 10%
level of significance : 1.7434
Standard upper limit = 10.26 + 1.7434 x 2.06 = 13.8514
Standard lower limit = 10.26 - 1.7434 x 2.06 = 6.6686
Calculated mean value of r lies within the standard upper limits and standard
lower limits, the randomness is there i.e. the market is weakly efficient.

64
Autocorrelation test:Autocorrelation test:Autocorrelation test:Autocorrelation test:
The autocorrelation test is applied to identify the degree of autocorrelation in a
time series. It measures the correlation between the differences in current and
lagged observations of the time series of stock returns. If the coefficient of
correlation tends to zero, the randomness is there i.e. the market is weakly
efficient, otherwise it is not weakly efficient.
Q.Q.Q.Q.No.No.No.No.55553333 Given the data below: apply autocorrelation test for find whether the
market if weakly efficient. Use time lag of 10 days:
Trading days Closing Sensex
1 13450
2 13440
3 13430
4 13380
5 13370
6 13340
7 13330
8 13335
9 13310
10 13270
11 13250
12 13290
13 13330
14 13290
15 13300
16 13320
17 13330
18 13320
19 13300
20 13320

65
Calculation of Changes in index values ( with time lag of 10 days)
Trading
day
Closing
Sensex
Change (X) Trading
day
Closing
Sensex
Change (Y)
1 13450 11 13250 -
2 13440 -10 12 13290 +40
3 13430 -10 13 13330 +40
4 13380 -50 14 13290 -40
5 13370 -10 15 13300 +10
6 13340 -30 16 13320 +20
7 13330 -10 17 13330 +10
8 13335 +5 18 13320 +10
9 13310 -25 19 13300 -20
10 13270 -40 20 13320 +20
Calculation of coefficient of correlation
X x x2 Y y y2 xy
-10 +10 100 +40 30 900 300
-10 +10 100 +40 30 900 300
-50 -30 90 -40 -50 2500 1,500
-10 +10 100 +10 0 0 0
-30 -10 100 +20 +10 100 -100
-10 +10 100 +10 0 0 0
+5 +25 625 +10 0 0 0
-25 -05 25 -20 -30 900 150
-40 -20 400 +20 10 100 -200
∑X =
-180
∑x = 0 ∑x2 =
1640
∑Y =
+90
∑y =0 ∑y2
=5400
∑xy =
1950
Covariance = ∑xy/n = 1950/9 = 216.67
SD X = √(∑x2 / n) = √(1640/9) = 13.50
SD Y = √(∑y2 / n) = √(54000/9) = 24.50
Covariance 215.67
r = --------------- = -------------- = +0.65
SD X . SD Y 24.50 x 13.50
As r does not tend to zero, the market is not weak.
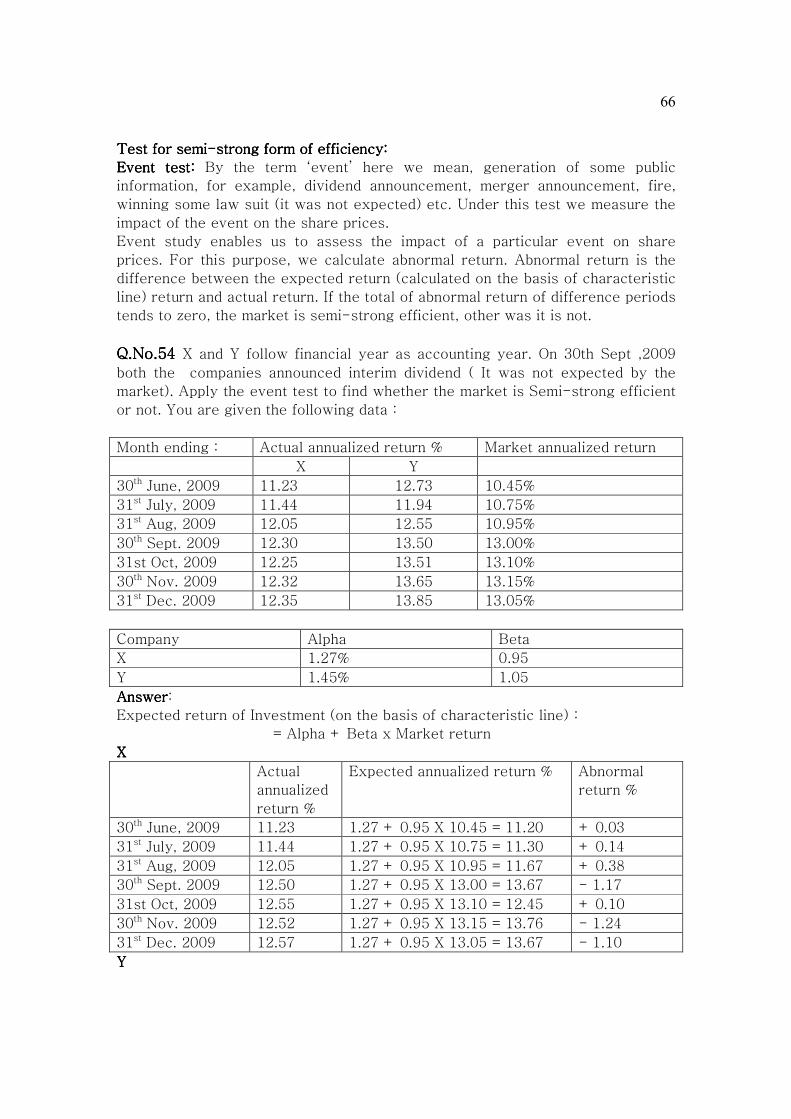
66
Test for semiTest for semiTest for semiTest for semi----strong form of efficiency: strong form of efficiency: strong form of efficiency: strong form of efficiency:
Event test: Event test: Event test: Event test: By the term ‘event’ here we mean, generation of some public
information, for example, dividend announcement, merger announcement, fire,
winning some law suit (it was not expected) etc. Under this test we measure the
impact of the event on the share prices.
Event study enables us to assess the impact of a particular event on share
prices. For this purpose, we calculate abnormal return. Abnormal return is the
difference between the expected return (calculated on the basis of characteristic
line) return and actual return. If the total of abnormal return of difference periods
tends to zero, the market is semi-strong efficient, other was it is not.
Q.Q.Q.Q.No.No.No.No.55554 4 4 4 X and Y follow financial year as accounting year. On 30th Sept ,2009
both the companies announced interim dividend ( It was not expected by the
market). Apply the event test to find whether the market is Semi-strong efficient
or not. You are given the following data :
Month ending : Actual annualized return % Market annualized return
X Y
30th June, 2009 11.23 12.73 10.45%
31st July, 2009 11.44 11.94 10.75%
31st Aug, 2009 12.05 12.55 10.95%
30th Sept. 2009 12.30 13.50 13.00%
31st Oct, 2009 12.25 13.51 13.10%
30th Nov. 2009 12.32 13.65 13.15%
31st Dec. 2009 12.35 13.85 13.05%
Company Alpha Beta
X 1.27% 0.95
Y 1.45% 1.05
AnswerAnswerAnswerAnswer:
Expected return of Investment (on the basis of characteristic line) :
= Alpha + Beta x Market return
XXXX
Actual
annualized
return %
Expected annualized return % Abnormal
return %
30th June, 2009 11.23 1.27 + 0.95 X 10.45 = 11.20 + 0.03
31st July, 2009 11.44 1.27 + 0.95 X 10.75 = 11.30 + 0.14
31st Aug, 2009 12.05 1.27 + 0.95 X 10.95 = 11.67 + 0.38
30th Sept. 2009 12.50 1.27 + 0.95 X 13.00 = 13.67 - 1.17
31st Oct, 2009 12.55 1.27 + 0.95 X 13.10 = 12.45 + 0.10
30th Nov. 2009 12.52 1.27 + 0.95 X 13.15 = 13.76 - 1.24
31st Dec. 2009 12.57 1.27 + 0.95 X 13.05 = 13.67 - 1.10
YYYY

67
Actual
annualized
return %
Expected annualized return % Abnormal
return %
30th June, 2009 12.73 1.45 + 1.05 X 10.45 = 12.42 + 0.31
31st July, 2009 11.94 1.45 + 1.05 X 10.75 = 12.74 - 0.80
31st Aug, 2009 12.55 1.45 + 1.05 X 10.95 = 12.95 - 0.40
30th Sept. 2009 13.50 1.45 + 1.05 X 13.00 = 15.10 - 1.60
31st Oct, 2009 13.51 1.45 + 1.05 X 13.10 = 15.21 -1.70
30th Nov. 2009 13.65 1.45 + 1.05 X 13.15 = 15.26 -1.91
31st Dec. 2009 13.85 1.45 + 1.05 X 13.05 = 15.15 -1.30
Period wise average abnormal return:
Average abnormal return
30th June, 2009 (0.03 + 0.31) / 2 = + 0.17
31st July, 2009 (0.14 - 0.80) / 2 = - 0.33
31st Aug, 2009 (0.38 - 0.40)/ 2 = - 0.01
30th Sept. 2009 (- 1.17 -1.60)/2 = - 1.385
31st Oct, 2009 (+ 0.10 -1.70)/2 = - 0.80
30th Nov. 2009 (- 1.24 - 1.91)/2 = - 1.575
31st Dec. 2009 (- 1.10-1.30) / 2 = - 1.20
Total of average abnormal return = - 5.13
As the total of average abnormal return does not tend to zero, the semi-strong
efficiency is not proved.
Test for Strong form of efficiency: Test for Strong form of efficiency: Test for Strong form of efficiency: Test for Strong form of efficiency:
For testing the Strong form efficiency, we have to compare the “ return obtained
by Mutual fund managers ( who are experts in the field of investment )” with “the
return obtained by Insider trading ( Inside trading is based on private
information)” If the insiders have been able to earn higher returns, the strong
form of efficiency is not proved.
Q. No. Q. No. Q. No. Q. No. 55555555:::: X Ltd’s issued capital is 4 crores equity shares of Rs.10 each. Y Ltd’s
issued capital is 12 crores equity shares of Rs.10 each.
On 14th March, 2005, market price per share is Rs.20 for X & Rs.30 for Y.
On 15th March, 2005, the management of Y decides at a private meeting, to make a
cash takeover bid for X at a price of Rs.30 per share. The take over will result in
synergy gain with a present value of Rs.20 Crores.
On 17th March, 2005, Y Ltd. publicly announces its plan for a cash take over bid. No
announcement is made about synergy gain.

68
On 21st March. 2005, Y Ltd. submits all the documents to the regulatory authorities
and makes a public announcement of all details including synergy gain.
Required: Ignoring tax and assuming the details given are the only factors having an
impact on the share price of X and Y, determine the market price of share of X as
well as Y on 15th March, 17th march and 21st March if market is (1) semi-strong form
efficient, and (2) strong form efficient.
AnswerAnswerAnswerAnswer
Date Semi-strong Strong
X Y X Y
15th March 20 30 30 28.33
17th March 30 26.67* 30 28.33
21st March 30 28.33* 30 28.33
Value per share of Y = (30 x 12Crores -10 x 4Crores)/12Crores = 26.67
Value per share of Y = 26.67 + (20Crores/12 Crores) = 28.33
ALPHAALPHAALPHAALPHA It is expected (Likely) return of an investment when the return from market
portfolio is zero.
Alpha = Average return of the security - (Beta x RM) Example : (X = return on market portfolio; Y = return on specific security)
Year X Y x y xy x2
1981 15 16 0 0 0 0
1982 14 12 -1 -4 4 1
1983 17 19 2 +3 6 4
1984 16 18 1 +2 2 1
1985 13 15 -2 -1 2 4
75757575 80808080 0000 0000 14141414 10101010
Find Alpha.
Answer :Answer :Answer :Answer :
X=15;;;; Y= 16;;;; x =X –X;;;; y= Y –Y
∑xy 14
Covariance between X & Y = ----- = ------ = 2.80
n 5
∑x2 10
Variance of market portfolio = ----- = ----- = 2
n 5
2.80
Beta = ------ = 1.40.
2
Alpha = 16 – ( 1.40 x 15) = -5

69
(Note : This security is 1.40 times riskier as compared to the market. If the return
from the market goes down to 0 i.e. market return fall by 15 percentage points,
return from this security will fall by 15x1.40 i.e. 21 percentage points. At present,
the likely return from the security is 16%; when it will fall by 21 percentage points it
will go down to -5)
Q.No.56Q.No.56Q.No.56Q.No.56:::: Risk free rate of return is 8%.The return from market portfolio is expected
to be 12%. Using the date given below, find the security which is better investment.
Also find Alpha of each security.
Security Expected return Beta
A 15 1.00
B 14 1.50
Answer Answer Answer Answer
The expected rate of return given in the question is actually ‘Likely return’]
SECURITY LIKELY
RETURN
EXPECTED RETURN
A 15 8 +1(12-8) = 12
B 14 8 +1.5(12-8) = 14
Security A is better than security B, as its likely return is more than what the
investor expects (considering the risk the investor has undertaken).
ALPHA = Likely Return – (Beta x RM)
Alpha of A = 15 – (1 x 12) = 3
Alpha of B = 14 – ( 1.5 x 12) = - 4
Q. No. Q. No. Q. No. Q. No. 57575757 : : : : From the following data, find Alpha, Beta and Systematic risk of equity
shares of Babbar Ltd.
Period % Return of equity shares
of Babbar Ltd.
% Return of market
portfolio
1 30 35
2 28 30
3 25 18
4 20 15
5 24 20
6 10 11
7 3 -10
Answer :Answer :Answer :Answer :
Let return of Babbar Ltd = X, return of Market = Y
X Y x y x2 y2 xy
30 35 10 18 100 324 180
28 30 8 13 64 169 104

70
25 18 5 1 25 1 5
20 15 0 -2 0 4 0
24 20 4 3 16 9 12
10 11 -10 -6 100 36 60
3 -10 -17 -27 289 729 459
594 1272 820
Mean of X = 140/7 =20 Mean of Y = 119/7 = 17
SD OF X = 9.21 SD OF Y = 13.48
Covariance = ∑xy/n = 820/7 = 117.1428
Beta = covariance / market variance = (117.1428)/(13.48)2 = 0.645
Alpha = likely return – (Beta x RM) = 20 – (0.645x17) = 9.035
Systematic risk = Beta2 x market variance = (0.645)2 x (13.48)2 = 75.60
CHARACTERISTIC LCHARACTERISTIC LCHARACTERISTIC LCHARACTERISTIC LINEINEINEINE:::: A characteristic line exhibits regression relationship
between the return of an investment and the return on market portfolio.
Equation of Characteristic Line = Alpha + (Beta x RM)
(Return from investment)
Q. NoQ. NoQ. NoQ. No.58.58.58.58 : : : : The rates of return on the security of company Y and market portfolio for
10 periods are given below:
Period Return from security Y % Return on market portfolio %
1 20 22
2 22 20
3 25 18
4 21 16
5 18 20
6 -5 8
7 17 -6
8 19 5
9 -7 6
10 20 11
What is Beta? What is Alpha? What is the Characteristic line of the security? Draw
Characteristic line. (Nov. 2003Nov. 2003Nov. 2003Nov. 2003)
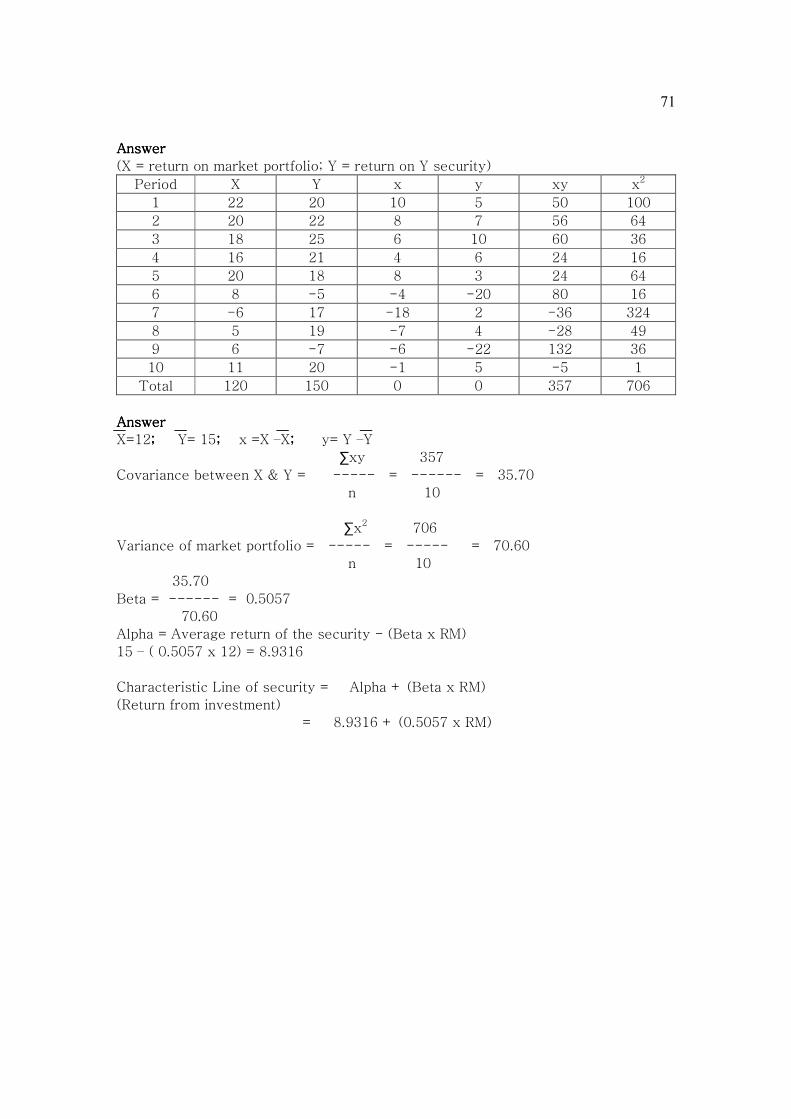
71
Answer Answer Answer Answer
(X = return on market portfolio; Y = return on Y security)
Period X Y x y xy x2
1 22 20 10 5 50 100
2 20 22 8 7 56 64
3 18 25 6 10 60 36
4 16 21 4 6 24 16
5 20 18 8 3 24 64
6 8 -5 -4 -20 80 16
7 -6 17 -18 2 -36 324
8 5 19 -7 4 -28 49
9 6 -7 -6 -22 132 36
10 11 20 -1 5 -5 1
Total 120 150 0 0 357 706
AnswerAnswerAnswerAnswer
X=12; ; ; ; Y= 15;;;; x =X –X;;;; y= Y –Y
∑xy 357
Covariance between X & Y = ----- = ------ = 35.70
n 10
∑x2 706
Variance of market portfolio = ----- = ----- = 70.60
n 10
35.70
Beta = ------ = 0.5057
70.60
Alpha = Average return of the security - (Beta x RM)
15 – ( 0.5057 x 12) = 8.9316
Characteristic Line of security = Alpha + (Beta x RM)
(Return from investment)
= 8.9316 + (0.5057 x RM)
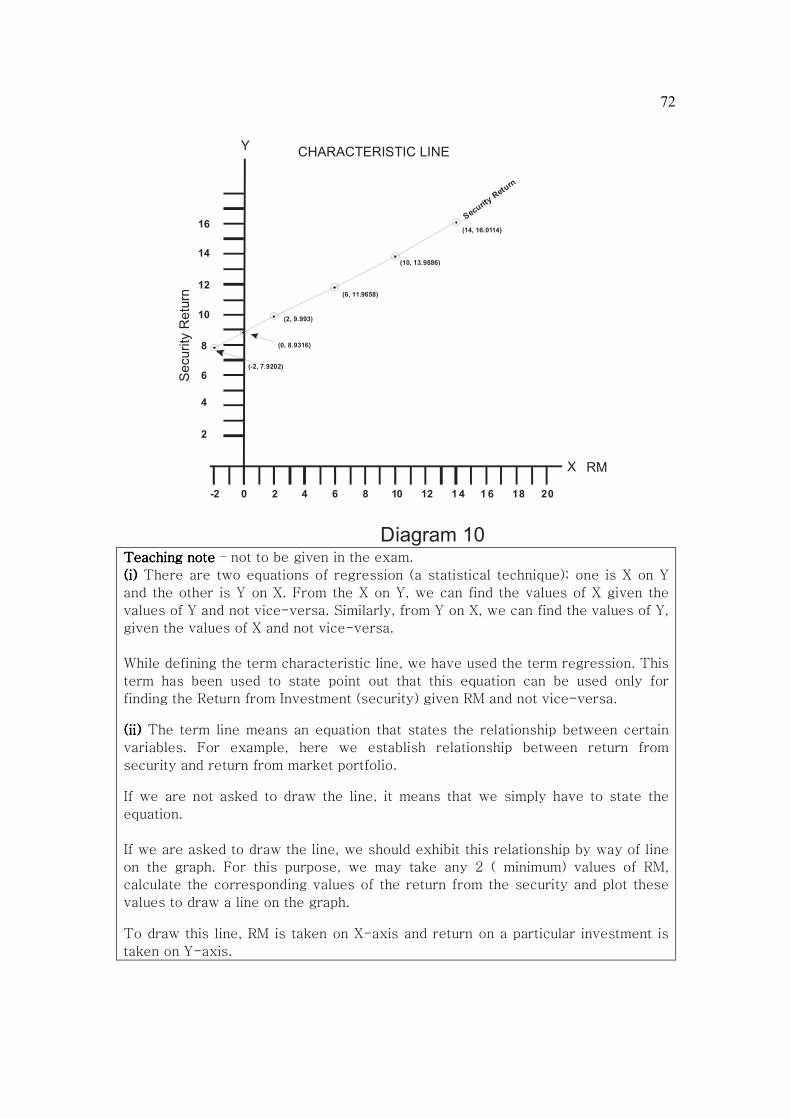
72
X
Y
Diagram 10
RM
Security Return
Security Return
CHARACTERISTIC LINE
16
14
12
10
8
6
4
2
-2 0 2 4 6 8 10 12 1 4 1 6 18 20
(-2, 7.9202)
(0, 8.9316)
(2, 9.993)
(6, 11.9658)
(10, 13.9886)
(14, 16.0114)
Teaching noteTeaching noteTeaching noteTeaching note – not to be given in the exam.
(i)(i)(i)(i) There are two equations of regression (a statistical technique); one is X on Y
and the other is Y on X. From the X on Y, we can find the values of X given the
values of Y and not vice-versa. Similarly, from Y on X, we can find the values of Y,
given the values of X and not vice-versa.
While defining the term characteristic line, we have used the term regression. This
term has been used to state point out that this equation can be used only for
finding the Return from Investment (security) given RM and not vice-versa.
(ii)(ii)(ii)(ii) The term line means an equation that states the relationship between certain
variables. For example, here we establish relationship between return from
security and return from market portfolio. If we are not asked to draw the line, it means that we simply have to state the
equation.
If we are asked to draw the line, we should exhibit this relationship by way of line
on the graph. For this purpose, we may take any 2 ( minimum) values of RM,
calculate the corresponding values of the return from the security and plot these
values to draw a line on the graph.
To draw this line, RM is taken on X-axis and return on a particular investment is
taken on Y-axis.

73
SECURITY MARKET LINE (SML)SECURITY MARKET LINE (SML)SECURITY MARKET LINE (SML)SECURITY MARKET LINE (SML)
A security market line exhibits relationship between expected returns (calculated on
the basis of CAPM) of investments and their Betas. (By expected return we mean,
the total return an investor should get considering the risk he has undertaken)
To draw the line, Betas are taken on X-axis and the expected returns on Y-axis.
Q. No.59Q. No.59Q. No.59Q. No.59 :::: RF 10%. RM 15%, From the following information, draw SML:
Securities Likely Return Beta
E.Shares of A Ltd. 13.00% 0.50
E.Shares of B Ltd. 14.00% 1.00
E.Shares of C Ltd. 18.00% 1.50
E.Shares of D Ltd. 20.00% 2.00
Which share(s) should be undervalued / overvalued?
Teaching noteTeaching noteTeaching noteTeaching note: [“Undervalued” means good investments. These are the
investments regarding which our recommendation is : purchase / hold. Overvalued
means “not good investments”. These are the investments regarding which our
recommendation is : sale.]
Answer Answer Answer Answer
SECURITY LIKELY RETURN EXPECTED RETURN COMMENT
A 13% 10+0.50(15-10) =12.50 UNERVALUED
B 14% 10+1.00(15-10)=15.00 OVERVALUED
C 18% 10+1.50(15-10)=17.50 UNDERVALUED
D 20% 10+2.00(15-10)=20.00 Neutral

74
CAPITAL MARKET LINE (CML)CAPITAL MARKET LINE (CML)CAPITAL MARKET LINE (CML)CAPITAL MARKET LINE (CML)
A CML exhibits relationship between expected returns of investments and their
standard-deviations. (By expected return we mean, the total return an investor
should get considering the risk he has undertaken). To draw this line, SDs are taken
on X-axis and the expected returns on Y-axis.
Q. No. Q. No. Q. No. Q. No. 60606060::::The following data relate to four different portfolios:
Portfolio Expected Rate of S.D. of Returns
Return from Portfolios
A 16% 6.00
B 14% 7.50
C 12% 3.00
D 15% 9.00
The expected return on market portfolio is 9.50 percent with a standard deviation of
3. The RF is 5 per cent. Draw CML to comment on each of these portfolios.
AnswerAnswerAnswerAnswer
Portfolio LIKELY RETURN EXPECTED RETURN COMMENT
A 16% 5+9.00 = 14 UNERVALUED
B 14% 5+11.25 = 16.25 OVERVALUED
C 12% 5+4.50 = 9.50 UNDERVALUED
D 15% 5+13.50 = 18.50 OVERVALUED

75
MARKET MOMARKET MOMARKET MOMARKET MODELDELDELDEL
CAMP states the expected return of an investment. (By expected return we mean,
the total return an investor should get considering the risk he has undertaken).
Market Model (MM) states the likely return of an investment in the form of following
equation:
Likely Return or return based on MM: Likely Return or return based on MM: Likely Return or return based on MM: Likely Return or return based on MM:
Risk adjusted Excess Return + RF +Beta (RM-RF)
ExampleExampleExampleExample
Alpha 4%, RF 6%, Beta = 2
RM 10%, Find return based on MM.
Answer Answer Answer Answer :
If return from market portfolio is zero, i.e. return from market portfolio falls by 10
percentage points, the return from security will fall by 20%; even than the return
from security will be 4%. It means likely return from the security is 24%. Expected
return from the security is : 6 + 2 (10-6) = 14%. Hence, risk adjusted excess return
= 10%. (This risk adjusted excess return is also called as Jenson’s Alpha. It is
different from the Alpha that we have studied in the first paragraph of this note)
Likely Return i.e. return based on MM: 10 + 6 + 2 (10Likely Return i.e. return based on MM: 10 + 6 + 2 (10Likely Return i.e. return based on MM: 10 + 6 + 2 (10Likely Return i.e. return based on MM: 10 + 6 + 2 (10----6) = 24%6) = 24%6) = 24%6) = 24%
MATRIX APPROACH IN INVESTMENTMATRIX APPROACH IN INVESTMENTMATRIX APPROACH IN INVESTMENTMATRIX APPROACH IN INVESTMENT DECISIONSDECISIONSDECISIONSDECISIONS
Investment consultants favour the matrix approach because of its clear focus of the
factors affecting the investment decisions.. A matrix is formed of various acceptable
investment opportunities and factors affecting the investment decisions. Three
important decisions affecting the factors are : (i) Return (ii) Risk and (iii) Liquidity.
Acceptable standard levels are decided. Each acceptable level is considered worth
100 points. The points allotted for return changes in direct proportion of the likely
returns from the investments under our consideration. The points allotted for risk
and liquidity changes in reverse proportion to the standards for acceptable levels.
Q. Q. Q. Q. No.61No.61No.61No.61: : : : Suppose an investor expects a return of 15%, his acceptable level of risk is
4 and he expects a liquidity of 2 days. He gathers the following likely data for four
investments. Recommend one security for investment following the Matrix Approach.
RETURN RISK LIQUIDITY
A 12% 2 2 DAYS
B 18% 4 1 DAY
C 24% 8 4 DAYS
D 15% 1 8 DAYS

76
Answer Answer Answer Answer
Investment MatrixInvestment MatrixInvestment MatrixInvestment Matrix
Return Risk Liquidity Total
AAAA 80 200 100 380
BBBB 120 100 200 420
CCCC 160 50 50 260
DDDD 100 400 25 525
As per As per As per As per the matrix, D is recommended for the investment.
GENERAL PROBLEMSGENERAL PROBLEMSGENERAL PROBLEMSGENERAL PROBLEMS
Q. No.Q. No.Q. No.Q. No. 62626262 : : : : The data for three securities P,Q, and R are as follows:
Securities Likely return SD
P 15% 0.20
Q 15% 0.19
R 20% 0.24
Does anyone security dominates another? Why? Which type of investor prefers R?
Teaching noteTeaching noteTeaching noteTeaching note : Security A dominates Security B in following three situations:
(i) A and B have same returns but A’s SD is less than that of B.
(ii) A’s return is higher than that of B but their standard deviations are
equal.
(iii) A’s return is higher than that of B but A’s SD is less than that of B
Answer Answer Answer Answer
Q dominates P as Q’s return is the same as that of P but its (Q’s) SD is lower than
that of P. An aggressive type investor prefers R . Aggressive investors invest in
securities with higher expected returns and for this they undertake higher degree of
risk.
QQQQ. No. 63. No. 63. No. 63. No. 63: : : : 4 D plc is manufacturing company whose share are listed on the London
International Stock Exchange. It is expecting to have surplus cash resources
available for at least 12 months. The board has decided to develop an investment
portfolio of marketable securities. The company’s financial advisers have
recommended four securities for the board to consider. These are as follows:
Security 1 regularly traded shares in a medium-sized UK retailing company.
The equity beta is quoted as 1.2.
Security 2 shares in a relatively small but rapidly growing UK company in a high-
technology industry. The shares have an equity beta of 1.6.
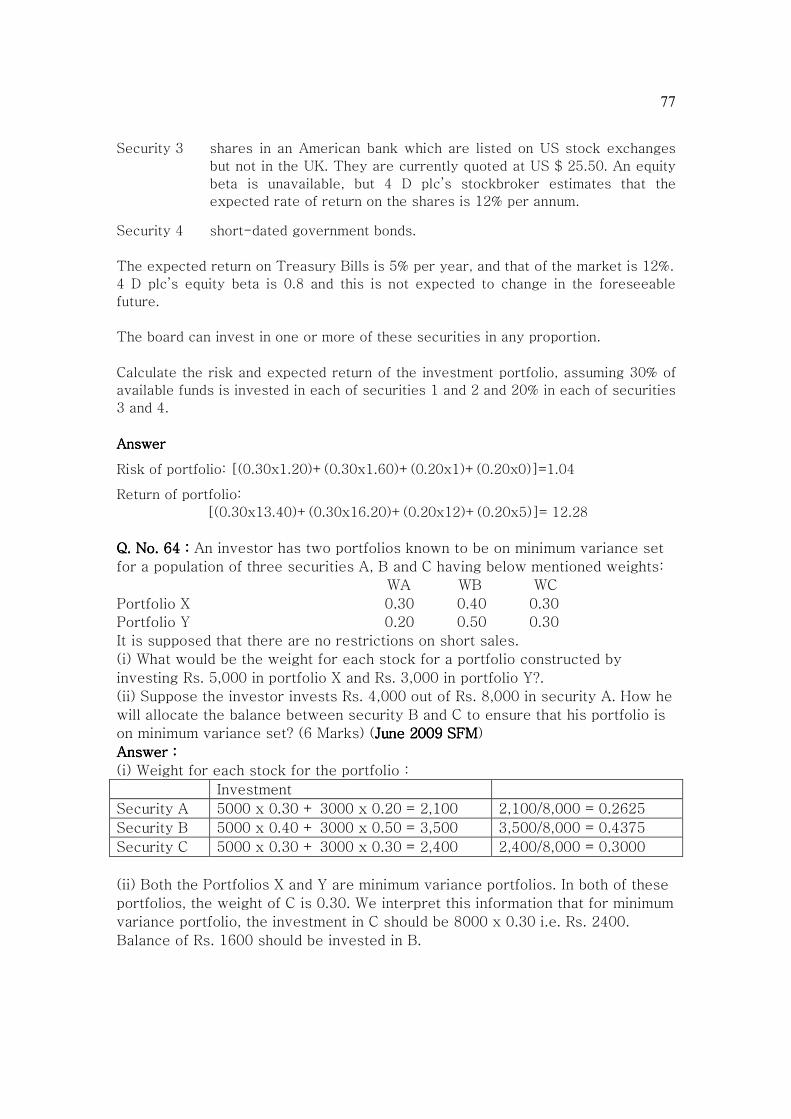
77
Security 3 shares in an American bank which are listed on US stock exchanges
but not in the UK. They are currently quoted at US $ 25.50. An equity
beta is unavailable, but 4 D plc’s stockbroker estimates that the
expected rate of return on the shares is 12% per annum.
Security 4 short-dated government bonds.
The expected return on Treasury Bills is 5% per year, and that of the market is 12%.
4 D plc’s equity beta is 0.8 and this is not expected to change in the foreseeable
future.
The board can invest in one or more of these securities in any proportion.
Calculate the risk and expected return of the investment portfolio, assuming 30% of
available funds is invested in each of securities 1 and 2 and 20% in each of securities
3 and 4.
AnswerAnswerAnswerAnswer
Risk of portfolio: [(0.30x1.20)+(0.30x1.60)+(0.20x1)+(0.20x0)]=1.04
Return of portfolio:
[(0.30x13.40)+(0.30x16.20)+(0.20x12)+(0.20x5)]= 12.28
QQQQ. No. 64. No. 64. No. 64. No. 64 : : : : An investor has two portfolios known to be on minimum variance set
for a population of three securities A, B and C having below mentioned weights:
WA WB WC
Portfolio X 0.30 0.40 0.30
Portfolio Y 0.20 0.50 0.30
It is supposed that there are no restrictions on short sales.
(i) What would be the weight for each stock for a portfolio constructed by
investing Rs. 5,000 in portfolio X and Rs. 3,000 in portfolio Y?.
(ii) Suppose the investor invests Rs. 4,000 out of Rs. 8,000 in security A. How he
will allocate the balance between security B and C to ensure that his portfolio is
on minimum variance set? (6 Marks) (June 2009 SFMJune 2009 SFMJune 2009 SFMJune 2009 SFM)
Answer : Answer : Answer : Answer :
(i) Weight for each stock for the portfolio :
Investment
Security A 5000 x 0.30 + 3000 x 0.20 = 2,100 2,100/8,000 = 0.2625
Security B 5000 x 0.40 + 3000 x 0.50 = 3,500 3,500/8,000 = 0.4375
Security C 5000 x 0.30 + 3000 x 0.30 = 2,400 2,400/8,000 = 0.3000
(ii) Both the Portfolios X and Y are minimum variance portfolios. In both of these
portfolios, the weight of C is 0.30. We interpret this information that for minimum
variance portfolio, the investment in C should be 8000 x 0.30 i.e. Rs. 2400.
Balance of Rs. 1600 should be invested in B.

78
Q. No.65:Q. No.65:Q. No.65:Q. No.65: Shyam Sunder has been holding 1,00,000 equity shares of Mohan Ltd
costing Rs.20,00,000. He borrowed 50,000 equity shares of Gopal Ltd. and sold these
shares at the rate of Rs.20. He invested the sale proceeds of these shares in the
shares of Mohan Ltd. Expected return of equity shares of Mohan Ltd is 12 % and
that of Gopal Ltd is 18 %.Coefficient of correlation between the return of the two
securities is 0.70. SD of returns of the two companies are: Mohan 0.20 and Gopal
0.80. Find the expected return and risk of Shyam Sunder‘s investments.
Answer Answer Answer Answer
W1 = 1.50 W2 = -0.50
Expected Return of investment = (1.50)(12) + (-0.50)(18) = 9
Portfolio SD =
_______________________________________________________________
√(1.50)2(0.20) 2 +(-0.50)2(0.80)2 +2(1.50)(-0.50)(0.70)(0.20)(0.80) = 0.29
The investor’s decision is not optimum as this has reduced the expected income and
increased the risk.
Q. No.6Q. No.6Q. No.6Q. No.66666: : : : The following date relates to a portfolio : Year Nominal return (%) Inflation (%)
2001 20 5
2002 30 10
2003 40 7
2004 5 6
2005 -2 2 Find the SD of the real returns in different years.
Answer: Answer: Answer: Answer:
(1+Real Return)(1+Inflation) = 1 + Nominal return
• (1+ Real Return) (1.05) = 1.20
Real return in 2001 = 0.1429 = 14.29%
• (1+ Real Return) (1.10) = 1.30
Real return in 2002 = 18.18%
• (1+ Real Return) (1.07) = 1.40
Real return in 2003 = 30.84
• (1+ Real Return) (1.06) = 1.05
Real return in 2004 = - 0.9433 %
• (1+ Real Return) (1.02) = 0.98
Real return in 2005 = - 3.92 %

79
X x x2
14.29 2.60 6.76
18.18 6.49 42.12
30.84 19.15 366.72
- 0.9433 -12.63 159.17
- 3.92 -15.61 243.67
818.44
Mean = 11.69
SD = 12.79
Q. No.6Q. No.6Q. No.6Q. No.67777: SD of market returns is 25%. (a) Estimate the SD of portfolio with a Beta of
1.20. Assume that the portfolio funds have been allocated in about 50 sectors of the
economy. (b) Estimate the SD of a portfolio which has all the investment in
Government securities. (c) Estimate the Beta of a well-diversified portfolio having
S.D. 10 %. (d) SD of a portfolio is 25%. The portfolio consists shares of only 3
sectors of the economy i.e. Power, Pharma and IT. Can you say some thing about its
Beta?
Answer Answer Answer Answer
(a) (a) (a) (a) This a well diversified portfolio. In such portfolio, the unsystematic risk is almost
nil. In the market portfolio also, the unsystematic risk is nil. SD of market represents
systematic risk. Beta of 1.20 indicates that the portfolio is 1.20 times riskier than
that of market. Hence SD of the portfolio is 30%.
(b)(b)(b)(b) Zero
(c)(c)(c)(c) In a well diversified portfolio, the unsystematic risk is almost nil. In the market
portfolio also, the unsystematic risk is nil. SD of market represents systematic risk.
SD of this portfolio represents the systematic risk of this portfolio. Its SD is only 40
% of the market SD. In other words this portfolio is 0.40 times riskier than the
market. Market Beta is 1. Hence the Beta of the portfolio is 0.40.
(d) (d) (d) (d) SD of the market is 25% (it has only systematic risk). SD of the portfolio (not well
diversified) is 25% (it has systematic as well as unsystematic risk). In means in this
portfolio the systematic risk is less than 25%. It means its Beta is less than 1.
Q. No. Q. No. Q. No. Q. No. 68686868:::: A portfolio consists of equity shares of 20 companies, with equal amount
of investment in all the 20 companies. The Beta of shares of 12 companies if 1.20
and that of 8 companies is 0.70. Find the Beta of the total Investment.
AnswerAnswerAnswerAnswer
60% of the investment is in 12 companies having a Beta of 1.20 and 40% of the
investment is in 8 companies having a Beta of 0.70.
Portfolio beta = 0.60x 1.20 + 0.40x 0.70 = 1.00
Q. No.Q. No.Q. No.Q. No.69696969: How many variance items and how many covariance items you require to
calculate the risk of a portfolio consisting of 40 different securities.

80
AnswerAnswerAnswerAnswer
No. of variance items = n = 40
No. of covariance items = nC2 = 780
Q. No. 7Q. No. 7Q. No. 7Q. No. 70000: A portfolio consists of 25 different securities, with equal amount of
investment in all the 25 Securities. SD of each security is 0.60. Coefficient of
correlation with each other’s return is 0.40. What is the SD of the portfolio?
Answer Answer Answer Answer
_____________________________________________
Portfolio SD= √ 25.(0.60) 2( 0.04 )2+300.2.(0.04) 2.(0.40)(0.60) 2 = 0.391
Q. No. 7Q. No. 7Q. No. 7Q. No. 71111:::: Expected dividend per share Rs.8. Ke = 10%. g = 5%. Find the value of
the share. If Expected EPS is Rs.12, find the rate of return on retained earnings.
What portion of the market price is for growth opportunities (i.e. for a ROE on
retained earnings over and above Ke)?
AnswerAnswerAnswerAnswer
D1 8
P = --------- = ------------ = 160
Ke – g 0.10 – 0.05
g = b.r Where g = growth rate, B= retained EPS to EPS
r = rate of return on retained earnings
0.05 = (1/3)r
r = 15 %
If r would have been 10% : g = b.r = (1/3)(0.10) = 0.0333
D1 7.8728
P = --------- = ------------ = 118.09
Ke – g 0.10 – 0.0333
Market price for growth opportunities = 41.91
Q. No. 7Q. No. 7Q. No. 7Q. No. 72222. . . . BSE Index 5,000.
Value of portfolio Rs.10,10,000
Risk free rate : 9% p.a.
Dividend yield on Index : 6% p.a.
Beta of portfolio : 1.50
We assume that a future contract on the BSE index for four months is used to
hedge the value of the portfolio over next three months. One futures contract is
for delivery of 50 times the index.
Based on the above information calculate:
(i) Price of futures contract
(ii) The gain on short future position if the index turns out to be 4,500 in
three months. (Nov. 2007)(Nov. 2007)(Nov. 2007)(Nov. 2007)

81
AnswerAnswerAnswerAnswer
(i) Price of the futures contract: Spot price + carrying cost – returns
= 5000 + 5000 x(0.09 x 4/12) - 5000 x(0.06 x 4/12)
= 5050
(ii) Value of one futures contract = 5050x50 = 2,52,500
No. of contracts for hedging = (1.50x10,10,000) / 252500 = 6
Sell 6 futures contract maturity 4 months.
Price of futures contract (maturity one month):
4500 + 4500 x(0.09 x 1/12) - 4500 x(0.06 x 1/12)
= 4511.25
Close the futures contract @ Rs.4511.25
Profit on futures = 50 x 6 x (5050 – 4511.25) = Rs.1,61,625
Q. No. 73Q. No. 73Q. No. 73Q. No. 73: : : : Last year the dividend per share was Rs.3. Dividend has been growing
at the rate of 5 per annum and this growth is likely to be maintained. Find the
current price of the share assuming the required rate of return to be 10% p.a. for
first 5 years, 12% p.a. for next 5 years and 15% p.a. after that for infinite period.
AnswerAnswerAnswerAnswer
Year Dividend per share
1 3.1500
2 3.3075
3 3.4729
4 3.6465
5 3.8289
6 4.0203
7 4.2213
8 4.4324
9 4.6540
10 4.8867
11 5.1310
12 5.3876
P = [3.15/(1.10)] + [3.3075/(1.10)2] + [3.4729/(1.10)3] [3.6465/(1.10)4]
[3.8289/(1.10)5] + [4.0203/{(1.10)5.(1.12)}] +[4.2213/{(1.10)5.(1.12)2}]
+……………………………+[4.8867/{(1.10)5.(1.12)5}] +
[{4.8867(1.05)}/{(1.10)5.(1.12)5.(1.15)}]+
[{4.8867(1.05)2}/{(1.10)5.(1.12)5.(1.15)2}]+ …………… ∞
= [3.15/(1.10)] + [3.3075/(1.10)2] + [3.4729/(1.10)3] [3.6465/(1.10)4]
[3.8289/(1.10)5] + [4.0203/{(1.10)5.(1.12)}] +[4.2213/{(1.10)5.(1.12)2}]
+……………………………+[4.8867/{(1.10)5.(1.12)5}] +
[{4.8867(1.05)}/{(1.10)5.(1.12)5.(1.15)}] +
[{4.8867(1.05)2}/{(1.10)5.(1.12)5.(1.15)2}]+ …………… ∞

82
[{4.8867(1.05)}/{(1.10)5.(1.12)5.(1.15)}]
= 22.91+--------------------------------= 22.91+18.07= 40.98
1 – [1.05 / 1.15]
Q. No. Q. No. Q. No. Q. No. 74747474: An investor has invested Rs. 1,00,000 in five different securities. He is
interested in investing another Rs. 20,000. He is considering the following securities:
BETA
A 1.00
B 0.50
C 0
D - 0.50
E - 0. 70
Suggest the security in which he should invest assuming that his object is the risk
reduction.
AnswerAnswerAnswerAnswer For maximum risk reduction, the investor should invest in E.
Q. No. Q. No. Q. No. Q. No. 75757575 : : : : Expected returns on two stocks for particular market returns are given
below :
Market return Aggressive Defensive
7% 4% 9%
25% 40% 18%
You are required to calculate: (a) the betas of the two stocks
(b) Expected return of each stock if the market return is equally likely to be 7%
or 25%
(c) The Security market line if the RF is 7.50% and the market return is equally
likely to be 7% or 25%.
(d) The Alphas of the two stocks. (May, 2007)(May, 2007)(May, 2007)(May, 2007)
Answer:Answer:Answer:Answer:
(a)(a)(a)(a) Aggressive : When market return increased from 7% to 25% i.e. by 18%, the
return of aggressive security increased from 4% to 40% i.e. by 36 %. It means
the Beta is 2.
Defensive : When market return increased from 7% to 25 % i.e. by 18%, the
return of defensive increased from 9% to 18% i.e. by 9%. It means the Beta is
0.50.
(b)(b)(b)(b) Expected return of Aggressive = 4(0.50) + 40 (0.50) = 22
Expected return of defensive = 9(0.50) + 18(0.50) = 13.50

83
(c)(c)(c)(c) Expected return of market portfolio : 7(0.50) + 25 (0.50) = 16%
Security market line = RF + Beta (RM-RF) = 7.50 + Beta (16 -7.50)
= 7.50 + 8.50Beta
(d) (d) (d) (d) Alpha = Return from security – Beta x RM
Alpha of Aggressive = 22 – 2(16) = -10
Alpha of defensive = 13.50 – 0.50(16) = 5.50
Q. No.76Q. No.76Q. No.76Q. No.76 A study by a mutual fund has revealed the following data in respect of
three securities:
Security SD(%) Correlation with Index. Pm15
A 20 0.60
B 18 0.95
C 12 0.75
The SD of the market portfolio has been observed as 15%.
(i) What is the sensitivity of returns of each stock with respect to the market?
(ii) What are the co-variances among the various stock?
(iii) What would be the risk of the portfolio consisting of all the stocks equally?
(iv) What is the Beta of the portfolio consisting of equal investment in each
stock?
(v) What is the total systematic and unsystematic risk of the portfolio in (iv).
( Nov. 2009( Nov. 2009( Nov. 2009( Nov. 2009)
AnswerAnswerAnswerAnswer
(i) Security A :
Covariance
Coefficient of correlation = ----------------
SDA x SDMarket
Covariance
0.60 = -------------
0.20 x 0.15
Covariance = 0.018
Security B :
Covariance
Coefficient of correlation = ----------------
SDB x SDMarket
Covariance
0.95 = --------------
0.18 x 0.15
Covariance = 0.02565
15 Portfolio market

84
Security C:
Covariance
Coefficient of correlation = ----------------
SDC x SDMarket
Covariance
0.75 = --------------
0.12 x 0.15
Covariance = 0.0135
Beta ( sensitivity ) of A = 0.018/(0.15)2 = 0.80
Beta ( sensitivity ) of B = 0.02565/(0.15)2 = 1.14
Beta ( sensitivity ) of C = 0.0135 / (0.15)2 = 0.6
(ii) Assumption : Let the coefficient correlation between A & B =1
Let the coefficient correlation between A & C =1
Let the coefficient correlation between B &C =1
A & BA & BA & BA & B
Covariance
Coefficient of correlation = ----------------
SDA x SDB
Covariance
1 = --------------
0.20 x 0.18
Covariance = 0.036
A & CA & CA & CA & C
Covariance
Coefficient of correlation = ----------------
SDA x SDC
Covariance
1 = --------------
0.20 x 0.12
Covariance = 0.024
B & CB & CB & CB & C
Covariance
Coefficient of correlation = ----------------
SDB x SDC
Covariance
1 = --------------
0.18 x 0.12
Covariance = 0.0216

85
(iii) Variance of portfolio = (W1SDA)2 + (W2SDB)
2 + (W3SDC)
2 +
2W1W2rSDASDB
+2W1W3rSDASDc +2W2W3rSDBSDC
= (0.3333x0.20)2 + (0.3333x0.18)2
+ (0.3333x0.12)2
+ 2x0.3333x0.3333x1x0.20x0.18
+ 2x0.3333x0.3333x1x0.20x0.12
+ 2x0.3333x0.3333x1x0.18x0.12
= 0.00444 + 0.00360 + 0.001560
+ 0.0080 + 0.0053 + 0.0048 = 0.0277
-------
SD of portfolio = √0.0277 = 0.1664
(ii) Beta of portfolio = ( 0.80 + 1.14 + 0.60 )/ 3 = 0.8467
(iii) Systematic Risk of portfolio (variance) = (0.8467)2(0.15)2 = 0.016
Total risk of portfolio (variance) = 0.0277
Unsystematic risk(variance) = 0.0277 – 0.016 = 0.0117
I�TER�ATIO�AL I�VESTI�G
The world is getting smaller every day. As economies grow more interconnected,
investment in cross border investments in shares and debt instruments is
multiplying. International investing has two key advantages (i) higher return and
strong diversification (which reduces the risk).
Higher Return:Higher Return:Higher Return:Higher Return:
(i) Economic conditions: Economic conditions are not the same in all the
countries. At a particular time, some economies grow must faster than
other economies. For example, currently the economies of BRIC are
growing a much faster rate than the economies of USA and Europe.
Higher rate of growth of the economies lead to faster growth of the
companies of those economies. International investing targets at
multiplying the wealth of the investors through investing in these
companies.
(ii) Foreign exchange expectations: Some times international investing is
done to take the advantage of expected appreciation of the currency of
the target country. Many FIIs have taken this advantage by investing in
India. Suppose an FII invested in India when 1$ = Rs.45. They take
back their investment proceeds when 1$ = Rs.40.
Diversification:Diversification:Diversification:Diversification:
Stock market volatility is a major reason for investing globally. Investing in
several different countries can help reduce the impact on your portfolio when
one region experiences an economic downturn. This variety in market
performance can work to smooth your total portfolio performance through the
power of diversification. International investing faces many risks like political

86
risk, information risk, high transactions cost risk, foreign exchange risk etc. The
political risk cannot be quantified, it can only be analyzed. Hence, finance
mangers do not have much role to play while considering this risk. Information
risk has been reduced recently transparency in financial markets is increasing
throughout the globe. The transaction cost is pre-determined and this risk is
known at the time of investment. Hence, it not poses any threat.
The main risk is Foreign exchange risk. Suppose an FII invests in a country.
After some time the FII wants to withdraw from that country. If during the period
of investment, the currency of the country (in which investment was made)
depreciates, the FII suffers loss; even the gain made on the investment may turn
into loss.
For example, A Swiss FI invested 1m CHFs in India when the foreign exchange
rate was 1 CHF = Rs.30. The investment value grows by 10%. Now the FII wants
to withdraw from India. Suppose, the foreign exchange rate is 1 CHF = Rs.35.
The amount to be repatriated is Rs.33m/35 i.e 0.9429m CHFs. i.e. negative
return of 5.708 %.
International investing approach differs from Internal investing mainly on
account of foreign exchange risk. While calculating the expected return and
risk of the cross border investing, the investor has to consider the foreign
exchange risk.
Rii = (1 + Ri )(1+Rfe ) – 1
Rii = Return from international investing
Ri = Return from investment in terms of currency in which investment has
been made.
Rfe = % decline or appreciation in the currency of the country in which
investment has been made.
In the above example, Ri = 0.10
% discount of Rupee = {(1/35) – ( 1/30)] / [(1/30)] = 0.1428
Rfe = -0.1428
Rii = (1 + Ri )(1+Rfe ) – 1 = (1 + 0.10 )(1- 0.1428) – 1 = -0.05708
= -5.708%
SD of Returns from international investing :
____________________________________
SDii = √(SDi)2+ (SDfe)2 + 2.r.(i,fe)(SDi) (SDfe)
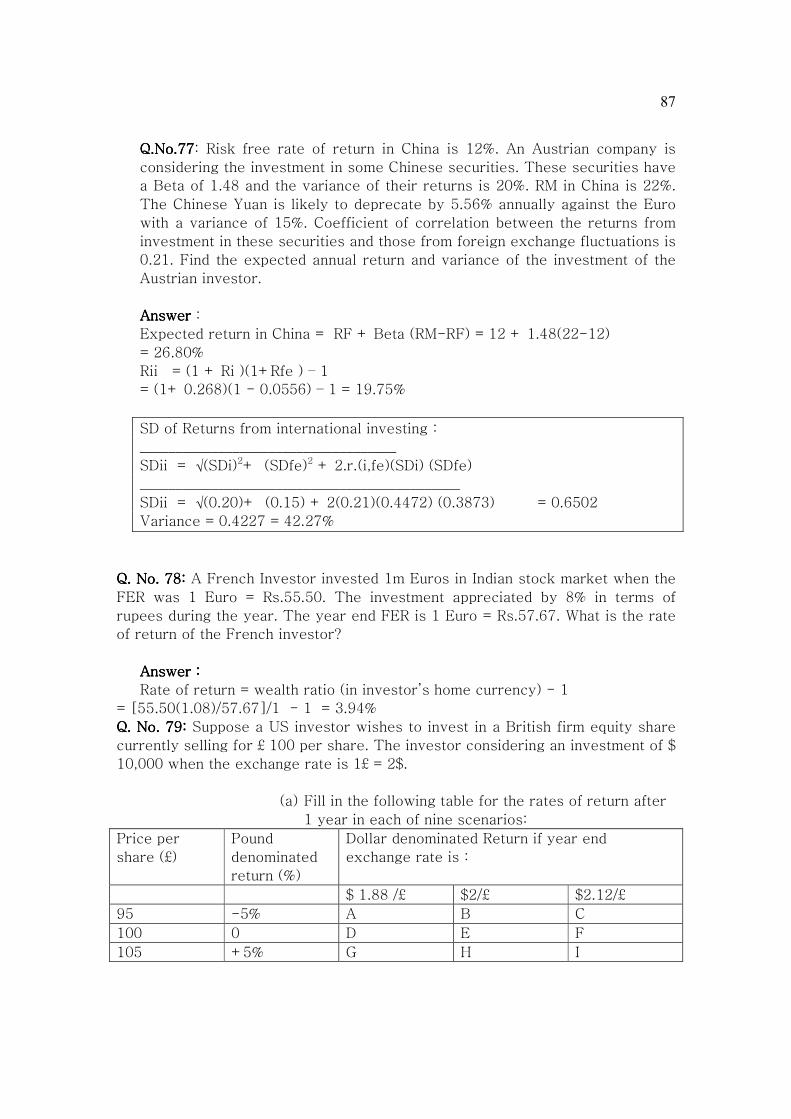
87
Q.No.Q.No.Q.No.Q.No.77777777: Risk free rate of return in China is 12%. An Austrian company is
considering the investment in some Chinese securities. These securities have
a Beta of 1.48 and the variance of their returns is 20%. RM in China is 22%.
The Chinese Yuan is likely to deprecate by 5.56% annually against the Euro
with a variance of 15%. Coefficient of correlation between the returns from
investment in these securities and those from foreign exchange fluctuations is
0.21. Find the expected annual return and variance of the investment of the
Austrian investor.
AnswerAnswerAnswerAnswer :
Expected return in China = RF + Beta (RM-RF) = 12 + 1.48(22-12)
= 26.80%
Rii = (1 + Ri )(1+Rfe ) – 1
= (1+ 0.268)(1 - 0.0556) – 1 = 19.75%
SD of Returns from international investing :
____________________________________
SDii = √(SDi)2+ (SDfe)2 + 2.r.(i,fe)(SDi) (SDfe)
_____________________________________________
SDii = √(0.20)+ (0.15) + 2(0.21)(0.4472) (0.3873) = 0.6502
Variance = 0.4227 = 42.27%
Q. No. 78Q. No. 78Q. No. 78Q. No. 78:::: A French Investor invested 1m Euros in Indian stock market when the
FER was 1 Euro = Rs.55.50. The investment appreciated by 8% in terms of
rupees during the year. The year end FER is 1 Euro = Rs.57.67. What is the rate
of return of the French investor?
Answer :Answer :Answer :Answer :
Rate of return = wealth ratio (in investor’s home currency) - 1
= [55.50(1.08)/57.67]/1 - 1 = 3.94%
Q. No. 79Q. No. 79Q. No. 79Q. No. 79: : : : Suppose a US investor wishes to invest in a British firm equity share
currently selling for £ 100 per share. The investor considering an investment of $
10,000 when the exchange rate is 1£ = 2$.
(a) Fill in the following table for the rates of return after
1 year in each of nine scenarios:
Price per
share (£)
Pound
denominated
return (%)
Dollar denominated Return if year end
exchange rate is :
$ 1.88 /£ $2/£ $2.12/£
95 -5% A B C
100 0 D E F
105 +5% G H I

88
(b) When is the Dollar denominated return equal to the Pound denominated
return?
(c) Find the expected Pound denominated return and SD of Pound
denominated returns. Assume equal probability for each of the three probable
prices after 1 year.
(d) If the outcome of each of 9 outcomes is equally likely, find (i) the
Expected Dollar denominated return and (ii) SD of Dollar denominated
returns.
(e) Suppose the investor sells £ 5,100 on forward basis (Maturity: 1 year) at
the rate of $ 2.07 /£ : find (i) the Expected Dollar denominated return and (ii)
SD of Dollar denominated returns. Assume equal probability for each possible
outcome.
(f) Compare the SD calculated under (c) and (d)
(g) Compare the SD calculated under (d) and (e)
Answer (a)Answer (a)Answer (a)Answer (a)
Price per
share (£) at
year end
Pound
denominated
return (%)
Dollar denominated Return if year end
exchange rate is :
$ 1.88 /£ $2/£ $2.12/£
95 -5% A B C
100 0 D E F
105 +5% G H I
The investor purchased 50 shares @ £100 each
A [(50x 95x1.88) / 10,000] – 1 -10.70%
B [(50x95x 2.00) / 10,000] – 1 - 5.00%
C [(50x95x 2.12) / 10,000] – 1 +0.70%
D [(50x 100x1.88) /10,000] – 1 -6.00%
E [(50x100x 2.00) /10,000] – 1 0%
F [(50x100x 2.12) /10,000] – 1 +6.00%
G [(50x 105x1.88) /10,000] – 1 -1.30%
H [(50x105x 2.00) /10,000] – 1 +5.00%
I [(50x105x 2.12) /10,000] – 1 +11.30%
Answer (b)Answer (b)Answer (b)Answer (b)
Dollar denominated return equals to Pound denominated return when there is no
change in Foreign exchange rate, i.e. year end foreign exchange rate = beginning
of the year rate : 1 Pound = 2 $
Answer (c) Answer (c) Answer (c) Answer (c) X = Pound denominated return
X Probability(p) pX x px2
-5 1/3 -5/3 -5 8.33
0 1/3 0 0 0
+5 1/3 +5/3 -5 8.33
∑pX = 0 ∑px2 = 16.66
______

89
Expected return = 0 SD = √16.66 = 4.08
Answer (d) Answer (d) Answer (d) Answer (d) X = $ denominated return
X Probability(p) pX x px2
-10.70% 1/9 -10.70/9 =-1.19 -10.70 12.72
- 5.00% 1/9 -0.56 - 5.00 2.78
+0.70% 1/9 +0.07 +0.70 0.054
-6.00% 1/9 -0.67 -6.00 4.00
0% 1/9 0 0 0
+6.00% 1/9 +0.67 +6.00 4
-1.30% 1/9 -0.14 -1.30 0.188
+5.00% 1/9 +0.56 +5.00 2.78
+11.30% 1/9 +1.26 +11.30 14.188
∑pX = 0 ∑px2 = 40.71
______
Expected return = 0 SD = √40.71 = 6.38
Answer (e)Answer (e)Answer (e)Answer (e)
A [(50x 95x1.88) +(5100 x 0.19)] / 10,000 – 1 -1.01%
B [(50x95x 2.00) +(5100 x 0.07)] / 10,000 – 1 -1.43%
C [{50x95x 2.12}+{(5100) x (-0.05)}] / 10,000 – 1 -1.85%
D [(50x 100x1.88) +(5100 x 0.19) /10,000] – 1 +3.69%
E [(50x100x 2.00) +(5100 x 0.07)/10,000] – 1 +3.57%
F [{50x100x 2.12}+{(5100) x (-0.05)}] /10,000 – 1 +3.45%
G [(50x 105x1.88) +(5100 x 0.19)] /10,000] – 1 +8.39%
H [(50x105x 2.00) +(5100 x 0.07) /10,000] – 1 +8.57%
I [{50x105x 2.12)}+{(5100) x (-0.05)}]/10,000] – 1 +8.75%
X = Dollar denominated return with forward
X Probability(p) pX x px2
-1.01% 1/9 -0.1122 -4.58 2.3307
-1.43% 1/9 -0.1589 -5.00 2.7778
-1.85% 1/9 -0.2055 -5.42 3.2640
+3.69% 1/9 +0.4100 +0.12 0.0016
+3.57% 1/9 +0.3966 0 0
+3.45% 1/9 +0.3833 -0.12 0.0016
+8.39% 1/9 +0.9322 +4.82 2.5814
+8.57% 1/9 +0.9522 +5.00 2.7778
+8.75% 1/9 +0.9722 +5.18 2.9814
∑pX = 3.5699 ∑px2
=16.7163

90
______
Expected return = 3.5699 SD = √16.7163 = 4.09
Answer (f)Answer (f)Answer (f)Answer (f)
SD under (c) : 4.08
SD under (d) : 6.38
The SD under (d) is more than that under (c) as while (c) has only investment
risk, (d) has not only investment risk but also foreign exchange risk.
Answer (g)Answer (g)Answer (g)Answer (g)
SD under (d) : 6.38
SD under (e) : 4.09
Both the cases are based on $ denominated returns. SD under (e) is less as
compared to (d) as under (d) the risk has been reduced with the help of forward
contract.
Q. No. 80Q. No. 80Q. No. 80Q. No. 80 : : : : If the current exchange rate is Euro 1.50/£, one year forward contract
rate is Euro 1.56/£, the interest rate in a British Government security is 7%. Find
risk free rate of return for the French investor if the investment is made for one
year.
Answer :Answer :Answer :Answer :
Let the investor brings Euro 1,500 for investment. This is equal to £ 1,000.
At the end of the year, this will grow to £1,070.
Rate of return = wealth ratio (in investor’s home currency) - 1
= [(1070x1.56)/1500] - 1 = 11.28%
Q. No. 81Q. No. 81Q. No. 81Q. No. 81 : : : : You are a Chinese investor considering the purchase of one of the
following securities. (Face value of the Chinese Government Security is CY 100
and that of the French Government security is Euro 100)
Bond Time horizon Coupon Price
French Govt. 6 months 7.50% 100
Chinese Govt. 6 months 6.50% 100
Calculate the expected % change in FE rate which would result in the two bonds
having equal total return in CY over 6 months time horizon. Verify your
calculations assuming the Chinese investor invested CY 1,00,000 and the foreign
exchange rate at the time of investment was : 1 Euro = 5 CY
AnswerAnswerAnswerAnswer
Investment on Chinese Government security = 3.25%
Return on French Government security ( In CY) = (1.0375)(1-RFE) – 1
For equal return : 0.0325 = (1.0375)(1-RFE) – 1
RFE = 0.4819% (discount on Euro)
Verification
Spot rate : 1 Euro = 5CY
Expected rate after 6 months : 1 Euro = [(5) –(5x0.4819/100)]CY
= 4.9759 CY
Return on French Govt security (in CY) = (1.0375)(1-0.004819) – 1 = 0.0325
= 3.25%

91
Q. No. 82Q. No. 82Q. No. 82Q. No. 82: : : : You are an Italian investor who purchased Canadian securities for CD
1,950 1 year ago when the foreign exchange rate was: 1 Euro = 1.50 CD. The
value of the security, now, is CD 2,340 and the exchange rate is: 1 Euro = 1.80
CD. Find the rate of return of the investor.
AnswerAnswerAnswerAnswer
Return = Wealth ratio (in Euro) -1
= [(2340/1.80) /(1950/1.50)] -1 = 0
Q. No. 83Q. No. 83Q. No. 83Q. No. 83:::: An Investment manager of a Luxemburg Mutual Fund plans to invest
Euro 15m in domestic securities for 60 days. The investment policy of the mutual
fund permits her to invest abroad provided the foreign exchange risk is covered
through forward contract.
What rate of return will the manager earn if she invests either in Chine or
Australia and hedges the Euro value of her investment proceeds through
forward? Use the data given in the following table.
What must be the approximate 60 days interest rate in Euro denominated
Government securities.
Interest rates: (60 days )
China government 6 % p.a.
Australian government 3 % p.a.
Exchange rate EURO per unit of foreign currency
Spot 60 days forward
Chinese Yuan 0.2000 0.2010
Australian Dollar 0.5000 0.5025
Assume 360 days in a year.
Answer Answer Answer Answer : 60 days interest rate in Euro denominated Government securities
Spot rate : 1 CY = 0.2000 Euro
60 days forward rate : 1 CY(1.01) = 0.2000Euro(1+r)
( where r is interest on one Euro for two months)
1 CY = 0.1980 Euro (1+r)
We are given : 1 CY = 0.2010
0.2010 = 0.1980Euro (1+r)
Euro (1+r) = 0.2010/0.1980 =1.01515
r= 0.01515 = 1.515% = 9.09% p.a.

92
Alternative solution : 1 AD = 0.50 Euro
60 days forward rate : 1 AD(1.005) = 0.5000Euro(1+r)
( where r is interest on one Euro for two months)
1 AD = 0.4975 Euro (1+r)
We are given : 1 AD = 0.5025Euro
0.5025 Euro = 0.49751244Euro (1+r)
(1+r) = 0.5025/0.49751244 =1.01025
r= 0.01025 = 1.0025% = 6.015% p.a.
The forward rates are not based on IRPT, otherwise by both the methods the
interest of Euro would have been same. Hence, Euro interest rate can not be
determined.
Return (Euro ) = Wealth ratio in Euro -1
Investment in China : Return ( Euro) = [75m(1.01)x(0.2010)]/(15m)]-1
= 0.01505% ( for two months )
Investment in Australia: Return (Euro)= [30m(1.005)x(0.5025)]/(15m)]-1
= 0.0025% ( for two months )
Q. No. 8Q. No. 8Q. No. 8Q. No. 84444 :::: A Chinese investor invests CY 1,00,000 in an Australian government
security carrying 8% p.a. interest when the foreign exchange rate was 1AD =
4CY.
(a) What is the CY denominated return for one year if the year end exchange rate
is CY 3.50, CY 4.00 or CY 4.50? Assume no hedging of the foreign exchange risk.
(b) What is the CY denominated return for one year if the investor covered his
foreign exchange risk by booking the forward contract (one year maturity).
Assume CY denominated securities yield at 6% p.a. and that the forward rates
are based on IRPT.
(c) What is the CY denominated return for one year if the investor covered his
foreign exchange risk by booking the forward contract (one year maturity) at
CY 4.12?
AnswerAnswerAnswerAnswer
(a) At the time of investment; CY 1,00,000 = 25,000 Australian Dollars
Return (CY ) = Wealth ratio in CY -1
Year end exchange rate
Return (in CY) 1AD = 3.5CY
1AD = 4CY
1AD = 4.50CY
Wealth at the time
of investment
1,00,000 CY 1,00,000 CY 1,00,000 CY
Wealth at year
end
25000(1.08)x3.50
= 94,500 CY
25000(1.08)(4)
= 1,08,000 CY
125000(1.08)(4.50)
= 1,21,500 CY
Return (94500/100000) -
1 = -5.50%
(108000/100000)
-1 = 8%
(121500/100000)
-1 = 21.50%

93
(b) Spot rate : 1 AD = 4 C
Forward rate : 1 AD(1.08) = 4 CY (1.06)
: 1 AD = 3.9259
Return (CY ) = Wealth ratio in CY -1
= [(25000x1.08) x 3.9259]/(100000) -1 = 6%
(c) Return (CY ) = Wealth ratio in CY -1
= [(25000x1.08) x 4.12]/(100000) -1 = 11.24%
Q. No. Q. No. Q. No. Q. No. 85858585: Hari, a Canadian investor, is considering investing 40% of his investing
funds in domestic market and balance either in Britain or France. Coefficient of
correlation between returns on the shares between Canada and France is 0.50.
Coefficient of correlation between returns on the shares between Canada and
Britain is 0.30. Expected return in each country is 15%. Variance of returns in
each country is 16%? Advise whether France or Britain?
AnswerAnswerAnswerAnswer
Expected return is same. Variance of returns is same. The decision of the
investment would be guided by only one factor, i.e. risk reduction through
portfolio. For this purpose, we prefer the portfolio of the securities having least
coefficient of correlation.
In this case, Hari should invest in Canada and Britain.
There will be no reduction in his income but the risk would be reduced.
Q. No. Q. No. Q. No. Q. No. 86868686: : : : A French Investor invested 1m Euros in Indian stock market when the
FER was 1 Euro = Rs.55. The investment appreciated by 10% in terms of rupees
during the year. The end FER is 1 Euro = Rs.57. What is the rate of return of the
French investor?
AnswerAnswerAnswerAnswer
Suppose the investor invested 1 Euro.
Investment in Rupee = Rs.55
Maturity value = Rs.60.50
No. of Euros = 60.50/57 = 1.0614
Return = Wealth ratio -1 = [(1.0614/1) – 1] = 0.0614 = 6.14%

94
Q. No. 87Q. No. 87Q. No. 87Q. No. 87:::: Consider following annual rates of return and foreign exchange rates:
Year Rates of return in Beginning of the year exchange
rate of Australian Dollar per Euro
Australian
Dollar
French
Euro
2001 12% 7% A$2.50
2002 - 7% 15% A$2.00
2003 11% - 5% A$1.75
2004 10% 9% A$2.00
2005 7% 11% A$1.60
2006 A$1.50
Determine the Simple average rate of return of an Australian investor who
invests in France.
Determine the Simple average rate of return of a French investor who invests in
Australia.
AnswerAnswerAnswerAnswer
Australian Investor :
Return on
investment
Return on foreign currency Return in home
currency
7% % gain/loss on Euro =(2-2.50)/2.50
= -20%
(1.07)(1-.20) -1
= - 14.40%
15% % gain/loss on Euro =(1.75-2.00)/2.00
= -12.50%
(1.15)(1-.125) -1
= 0.625%
-5% % gain/loss on Euro =(2.00-1.75)/1.75
= 14.2857%
(1.142857)(1-.05) -
1 = 8.57%
9% % gain/loss on Euro =(1.60-2.00)/2.00
= -20%
(1.09)(1-.20) – 1
= -12.80%
11% % gain/loss on Euro =(1.50-1.60)/1.60
= -6.25%
(1.11)(1-.0625) – 1
= 4.0625
Total -13.9425
Simple Average - 2.7885%

95
French Investor
Return on
investme
nt
Return on foreign currency Return in home currency
12% % gain/loss on A$ =(0.50-0.40)/0.40 =
25%
(1.12)(1.25) -1 = 40%
- 7% % gain/loss on A$ =(0.571-0.50)/0.50 =
14.20%
(1-.07)(1.1420) -1 =
6.206%
11% % gain/loss on A$ = (0.50-
0.5714)/0.5714
= -12.50%
(1.11)(1-.125) -1 = -
2.875%
10% % gain/loss on A$ =(0.625-0.50)/0.50 =
25%
(1.10)(1.25) – 1 =
37.50%
7% % gain/loss on A$ = (0.66667-
0.625)/0.625
= 6.67%
(1.07)(1.0667) – 1 =
14.14%
Total 94.791
Simple Average 18.96%
ARBITRAGE PRICING THEORY (APTARBITRAGE PRICING THEORY (APTARBITRAGE PRICING THEORY (APTARBITRAGE PRICING THEORY (APT))))
The APT is based upon the assumption that there are a few major macro-
economic factors that influence security returns. In other words the APT holds
that
(i) the expected return from a security is a linear function of various factors
affecting the returns from the securities in the market; these factors may be
interest rate, inflation, currency rates, GDP growth, oil prices etc., each
factor is represented by a factor specific beta coefficient.
(ii) the correct price of the asset can be determined using the APT model
derived expected rate.
This method is an alternative to Capital Asset Pricing Model which assumes that
the expected return is linearly related to only one specific factor and that is
market return. We know that this market return is affected by various macro
factors16 like interest rate, inflation, GDP growth, currency rates, oil prices etc.
(Macro factors are also referred as risk factors.)
16 Macro factors are also referred as risk factors.

96
The CAPM considers the effect of these factors in totality i.e. in the form of
market return; the APT considers these factors separately.
As per APT: Expected return
= RF +[Beta1 x ∆ Risk Factor1]+[Beta2 x ∆ Risk factor2]+…………………...+
[Betan x ∆ Risk factorn]
This can also be presented as follows:
As per APT: Expected return = λ0 + ( λ1.b1 + λ2.b2+ λ3.b3…+ λn.bn )
There are two parts of expected return.
(i) the first part is λ0 ; ( it is pronounced as Lambda zero ) ; it represents risk
free return. In APT, the term RF return refers to the expected rate of return if
the macro-factors (which affect the return from the security) remain unchanged.
Suppose the return from a particular share is affected by four macro-factors (a)
GDP growth (b) Inflation (c) interest rates and (d) oil prices. The expectation is
that GDP will grow at 5%, inflation will be at 3%, interest rates will be at 7% and
oil prices will be at $ 60. If all this happens, the share is likely to have a return of
10%. In the above formula, RF refers to this rate i.e. RF is taken as 10%.
(ii) the remaining part represents risk premium. The Lambda parameters
( i.e. λ1 , λ2 , λ3 , …….. λn ) represent change in the units of the macro-factors
that affect the risk premium; the examples of such factors are interest rates, oil
prices, GDP growth, inflation rates etc. b1 ,.b2 ,b3……bn are referred as Betas or
sensitivity factors. A Beta factor represents change in risk premium in case of
one unit change of a macro-factor affecting the risk premium.
Beta value of any factor is taken as one if the security has average exposure to
that factor.
Units of macro-factors are of two types:
(a) Macro-factors are given in percentage: In this case the change in the units of
macro-factors is measured in terms of percentage points. Suppose RF was
calculated assuming that GDP growth will be 5%; the revised estimates are that
GDP will grow at 7%, the change in the units of GDP growth will be taken as 2%.
If λ1 represents change in GDP growth, the value of λ1 is 2%.
(b) Macro-factors are given in absolute figures. In this case the change in the
units of macro-factors is measured in terms of terms of change in absolute
figures

97
Suppose the return from a particular share is affected by four macro-factors (a)
GDP growth (b) Inflation (c) interest rates and (d) oil prices. Assuming that GDP
will grow at 5%, inflation will be at 3%, interest rates will be at 7% and oil prices
will be at $ 60, the RF was calculated as 10%. The revised estimates are that
GDP will grow at 9%, inflation will be at 2%, interest rates will be at 8% and oil
prices will move from $ 60 to $ 66. The sensitivity factors for GDP growth
inflation, interest rates and oil prices are 0.10, -0.10, -0.12 and -0.03
respectively.
Expected return = λ0 + ( λ1.b1 + λ2.b2+ λ3.b3…+ λn.bn )
= 10 + [{(3) x (0.10)} + {(-1) x (-0.10)} + {(1) x (-0.12)} + {(6) x (-0.03)}]
= 10.10 %
In some exam questions, we are given Risk Free rate (risk free rate in the real
sense; for example treasury bill rate or Government security interest rate). In
such questions, we consider the absolute units of macro factors and not change
in units of macro-factors. Example: Suppose the treasury bill rate is 8%. The
return from a share depends upon 3 factors (a) GDP Growth (b) Inflation and (c)
interest rates. The Betas of GDP growth, inflation and interest rates are 0.50,
-0.05 and -0.01 respectively. Find the expected return if GDP grows by 8%,
inflation is 2% and interest is 5%. In this case, the expected return is:
8 +{8 x 0.50} +{(2x)-(0.05)} +{(5)x(-0.01)} = 11.85 %
Q . No. Q . No. Q . No. Q . No. 88888888: RF rate : 7%. Using the following data, find the expected return of a
portfolio assuming that 40% of the funds are invested in security A and 60% in B.
Macro-factors λ Beta (A) Beta (B)
1 8 % 0.60 0.90
2 5 % 1.10 0.80
3 - 4 % 0.90 1.20
Answer : Expected return of A = λ0 + ( λ1.b1 + λ2.b2+ λ3.b3 ) = 0.07+[{(0.08) x (0.60)}+{( 0.05) x (1.10)} + {(-0.04)x (0.90)}]
= 0.137 = 13.70 %
Expected return of B = λ0 + ( λ1.b1 + λ2.b2+ λ3.b3 ) = 0.07+[{(0.08)x(0.90)}+{(0.05)x(0.80)}+{(-0.04)x(1.20)}]
= 0.134 = 13.40%
Expected return of the portfolio : 0.40 (13.70) + 0.60 (13.40) = 13.52 %
ARBITRAARBITRAARBITRAARBITRAGEGEGEGE
Arbitrage is the process of taking advantage of the price differential. Arbitrage
actions by different arbitrageurs tend to remove the price differential. Arbitrage
is possible in the following three cases :

98
(i) The same asset quotes at different prices in different markets. For
example, prices of shares of a particular company in BSE and NSE
(ii) There are different expected returns for two or more similar assets (i.e.
the assets having the same risk). For example, suppose there are two assets
having the same risk, theoretically, their expected returns must be same. If
their returns are different, the arbitrageur will sell the assets having lower
return and buy the assets having the higher returns and have some profit.
(iii) The realization from an asset on a future date is certain. If today its price
is not equal to the present value of the amount to be realized, the present
value should be calculated using risk free rate.
The APT, developed by Stephen Ross in 1976, deals with the second possibility
of arbitrage. If there are two assets which have same risk, theoretically their
expected returns should be same. If their expected returns are different, the
arbitrageurs will sell the assets having lower returns) and buy the assets having
higher returns and have some profit.
The following discussion will help us in understanding the arbitrage process.
Q No.Q No.Q No.Q No.89898989: Suppose there is only one macro factor in an economy and that is
growth rate of GDP. For share A, the Beta of this factor is 1.19 (i.e. if GDP
growth increases by 1 percentage point, the value of the share increase by 1.19
percentage point and vice versa.) The GDP is expected to grow at 5.50% and
based on this the required return of the share is 9.50%. Suppose the government
announces that GDP is expected to grow by 6.30%, what will be the required rate
of return?
Answer Answer Answer Answer Required return of A = λ0 + ( λ1.b1 ) = 9.50 + (0.80x1.19) = 10.452%
Q. No. Q. No. Q. No. Q. No. 90909090: Suppose there is only one macro factor in an economy and that is
growth rate of GDP. For share A, the Beta of this factor is 1.18 (i.e. if GDP
growth increases by 1 percentage point, the value of the share increase by 1.18
percentage point and vice versa.) For share B, the Beta of this factor is
0.76.Required return of A is 13% and that of B 9.50%. What is λ0 ?
Answer : Answer : Answer : Answer :
Required return = λ0 + ( λ1.b1 )
Required return of A : 13.00 = λ0 +(( λ1.X 1.18 )
Required return of B : 9.50 = λ0 +( λ1.X 0.76 )
Solving the equations, we get λ0 = 3.16
Q. No. 91Q. No. 91Q. No. 91Q. No. 91: : : : Suppose that there are only two macro factors in an economy-
Industrial production (IP) and inflation rate (IR). IP is expected to change by 3%
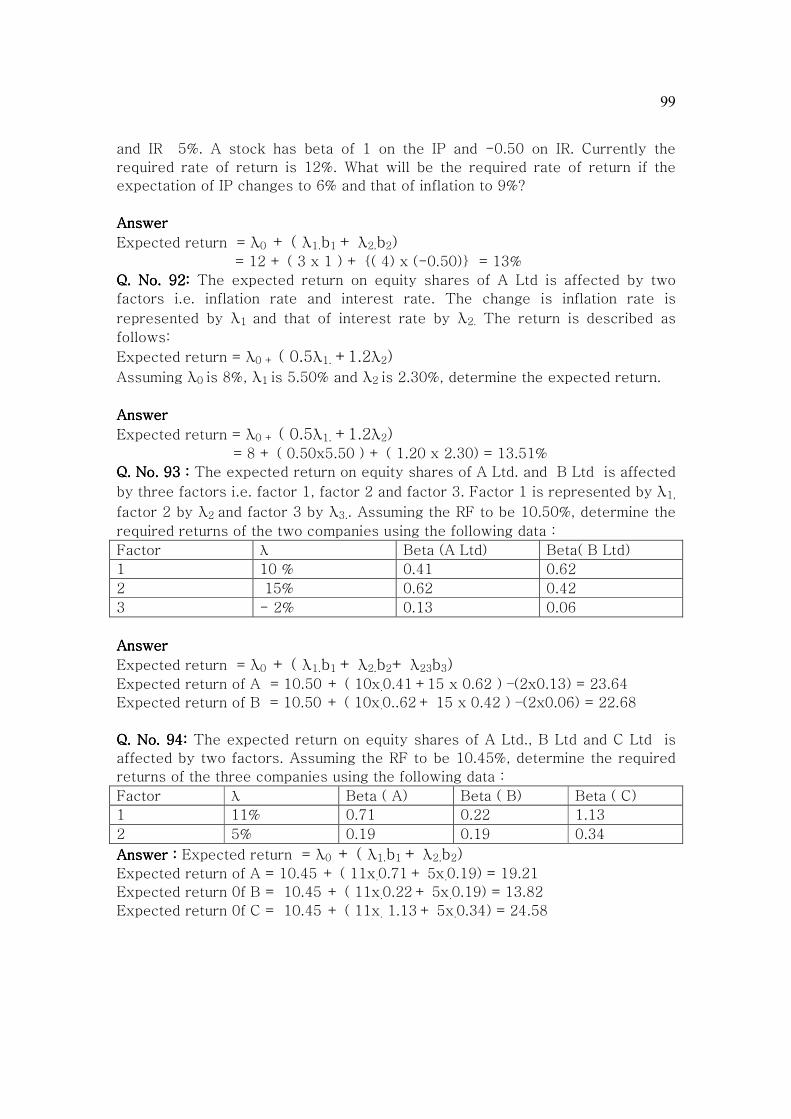
99
and IR 5%. A stock has beta of 1 on the IP and -0.50 on IR. Currently the
required rate of return is 12%. What will be the required rate of return if the
expectation of IP changes to 6% and that of inflation to 9%?
AnswerAnswerAnswerAnswer
Expected return = λ0 + ( λ1.b1 + λ2.b2) = 12 + ( 3 x 1 ) + {( 4) x (-0.50)} = 13%
Q. No. 92Q. No. 92Q. No. 92Q. No. 92: : : : The expected return on equity shares of A Ltd is affected by two
factors i.e. inflation rate and interest rate. The change is inflation rate is
represented by λ1 and that of interest rate by λ2. The return is described as
follows:
Expected return = λ0 + ( 0.5λ1. +1.2λ2)
Assuming λ0 is 8%, λ1 is 5.50% and λ2 is 2.30%, determine the expected return.
AnswerAnswerAnswerAnswer
Expected return = λ0 + ( 0.5λ1. +1.2λ2) = 8 + ( 0.50x5.50 ) + ( 1.20 x 2.30) = 13.51%
Q. No. 93Q. No. 93Q. No. 93Q. No. 93 :::: The expected return on equity shares of A Ltd. and B Ltd is affected
by three factors i.e. factor 1, factor 2 and factor 3. Factor 1 is represented by λ1,
factor 2 by λ2 and factor 3 by λ3.. Assuming the RF to be 10.50%, determine the
required returns of the two companies using the following data :
Factor λ Beta (A Ltd) Beta( B Ltd)
1 10 % 0.41 0.62
2 15% 0.62 0.42
3 - 2% 0.13 0.06
AnswerAnswerAnswerAnswer
Expected return = λ0 + ( λ1.b1 + λ2.b2+ λ23b3) Expected return of A = 10.50 + ( 10x.0.41 +15 x 0.62 ) –(2x0.13) = 23.64
Expected return of B = 10.50 + ( 10x.0..62 + 15 x 0.42 ) –(2x0.06) = 22.68
Q. No. 94Q. No. 94Q. No. 94Q. No. 94: : : : The expected return on equity shares of A Ltd., B Ltd and C Ltd is
affected by two factors. Assuming the RF to be 10.45%, determine the required
returns of the three companies using the following data :
Factor λ Beta ( A) Beta ( B) Beta ( C)
1 11% 0.71 0.22 1.13
2 5% 0.19 0.19 0.34
Answer : Answer : Answer : Answer : Expected return = λ0 + ( λ1.b1 + λ2.b2) Expected return of A = 10.45 + ( 11x.0.71 + 5x.0.19) = 19.21
Expected return 0f B = 10.45 + ( 11x.0.22 + 5x.0.19) = 13.82
Expected return 0f C = 10.45 + ( 11x. 1.13 + 5x.0.34) = 24.58
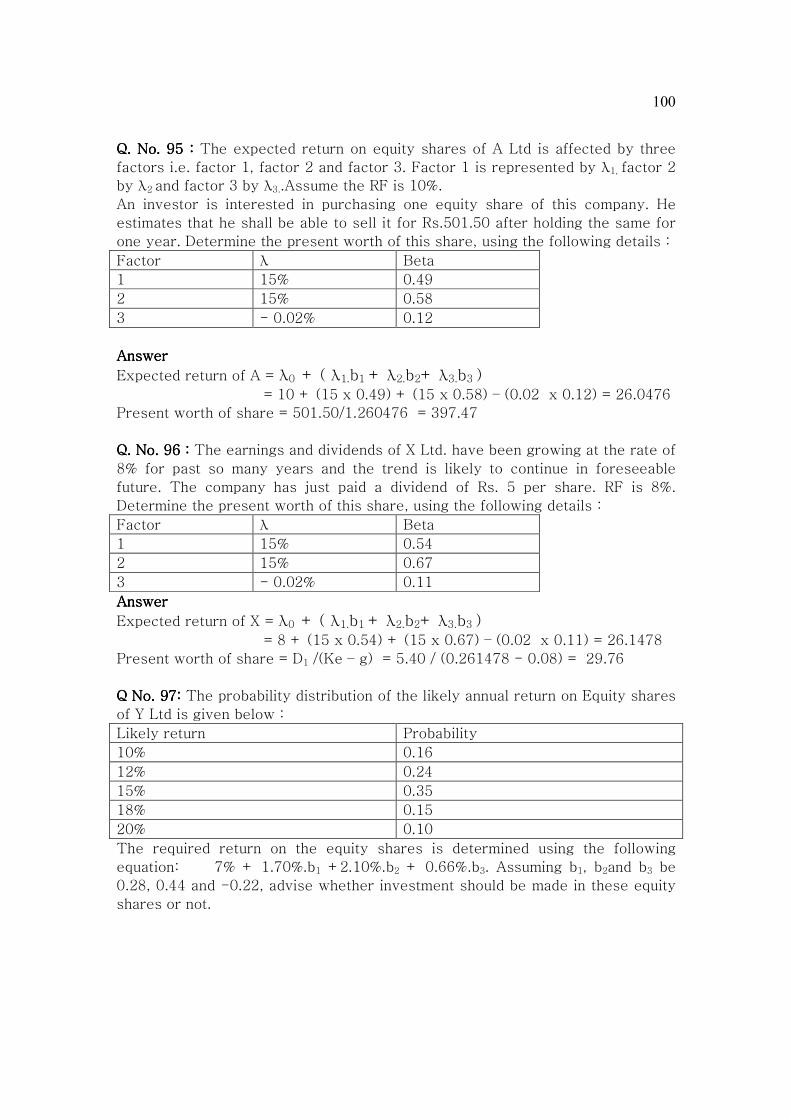
100
Q. No. 95Q. No. 95Q. No. 95Q. No. 95 :::: The expected return on equity shares of A Ltd is affected by three
factors i.e. factor 1, factor 2 and factor 3. Factor 1 is represented by λ1, factor 2
by λ2 and factor 3 by λ3..Assume the RF is 10%.
An investor is interested in purchasing one equity share of this company. He
estimates that he shall be able to sell it for Rs.501.50 after holding the same for
one year. Determine the present worth of this share, using the following details :
Factor λ Beta
1 15% 0.49
2 15% 0.58
3 - 0.02% 0.12
AnswerAnswerAnswerAnswer
Expected return of A = λ0 + ( λ1.b1 + λ2.b2+ λ3.b3 ) = 10 + (15 x 0.49) + (15 x 0.58) – (0.02 x 0.12) = 26.0476
Present worth of share = 501.50/1.260476 = 397.47
Q. No. 9Q. No. 9Q. No. 9Q. No. 96666 : : : : The earnings and dividends of X Ltd. have been growing at the rate of
8% for past so many years and the trend is likely to continue in foreseeable
future. The company has just paid a dividend of Rs. 5 per share. RF is 8%.
Determine the present worth of this share, using the following details :
Factor λ Beta
1 15% 0.54
2 15% 0.67
3 - 0.02% 0.11
Answer Answer Answer Answer
Expected return of X = λ0 + ( λ1.b1 + λ2.b2+ λ3.b3 ) = 8 + (15 x 0.54) + (15 x 0.67) – (0.02 x 0.11) = 26.1478
Present worth of share = D1 /(Ke – g) = 5.40 / (0.261478 - 0.08) = 29.76
Q No. 97Q No. 97Q No. 97Q No. 97: : : : The probability distribution of the likely annual return on Equity shares
of Y Ltd is given below :
Likely return Probability
10% 0.16
12% 0.24
15% 0.35
18% 0.15
20% 0.10
The required return on the equity shares is determined using the following
equation: 7% + 1.70%.b1 +2.10%.b2 + 0.66%.b3. Assuming b1, b2and b3 be
0.28, 0.44 and -0.22, advise whether investment should be made in these equity
shares or not.

101
Answer : Answer : Answer : Answer : Expected return of Y= λ0 + ( λ1.b1 + λ2.b2+ λ3.b3 ) = 7 + (1.70 x 0.28) + (2.10 x 0.44) - (0.66 x 0.22)
= = = = 8.25
Likely return = 10x0.16 + 12x0.24 + 15x0.35 + 18x0.15 + 20x0.10
= 14.43
As the likely return is more than the required return, the investment is
recommended.
Q. No.98Q. No.98Q. No.98Q. No.98:::: Assume that there is only one factor that affects the return of the
equity shares. Given the following data of two shares, determine the Equilibrium
Arbitrage Pricing line:
Share Expected Return Beta
A 16% 1.60
B 10% 0.60
Teaching note:Teaching note:Teaching note:Teaching note: Equilibrium Equation or equilibrium model (also referred as
Equilibrium Arbitrage Pricing Line): This is an equation which is consistent with
the data of given two or more portfolios.
AnswerAnswerAnswerAnswer : Expected return = λ0 + λ1....b1
16 = λ0 + λ1....(1.60) ………..(1)
10 = λ0 + λ1....(0.60) ………..(2)
Subtracting (2) from (1) :
λ1.= 6
Putting this value in (1) or (2) : λ0 = 6.40
Equilibrium Arbitrage pricing line = λ0 + λ1....b1= 6.40 + 6....b1
Q. No.99Q. No.99Q. No.99Q. No.99: Assume the following equilibrium – priced assets exist : Portfolio Expected return b1 b2
A 16.10% 0.90 0.75
B 12.80% 0.66 0.58
C 18.50% 0.96 1.18
What is the equilibrium equation of two factor APT model?
AnswerAnswerAnswerAnswer
16.10 = λ0 + ( λ1.x 0.90 + λ2.x 0.75 )
12.80 = λ0 + ( λ1.x 0.66 + λ2.x 0.58)
18.50 = λ0 + ( λ1.x 0.96 + λ2.x 1.18 )
Solving the equations, we get : λ0 = 3.272
λ1 = 10.87
λ2.= 4.06
Equilibrium equation = 3.272 + 10.87b1 + 4.06b2
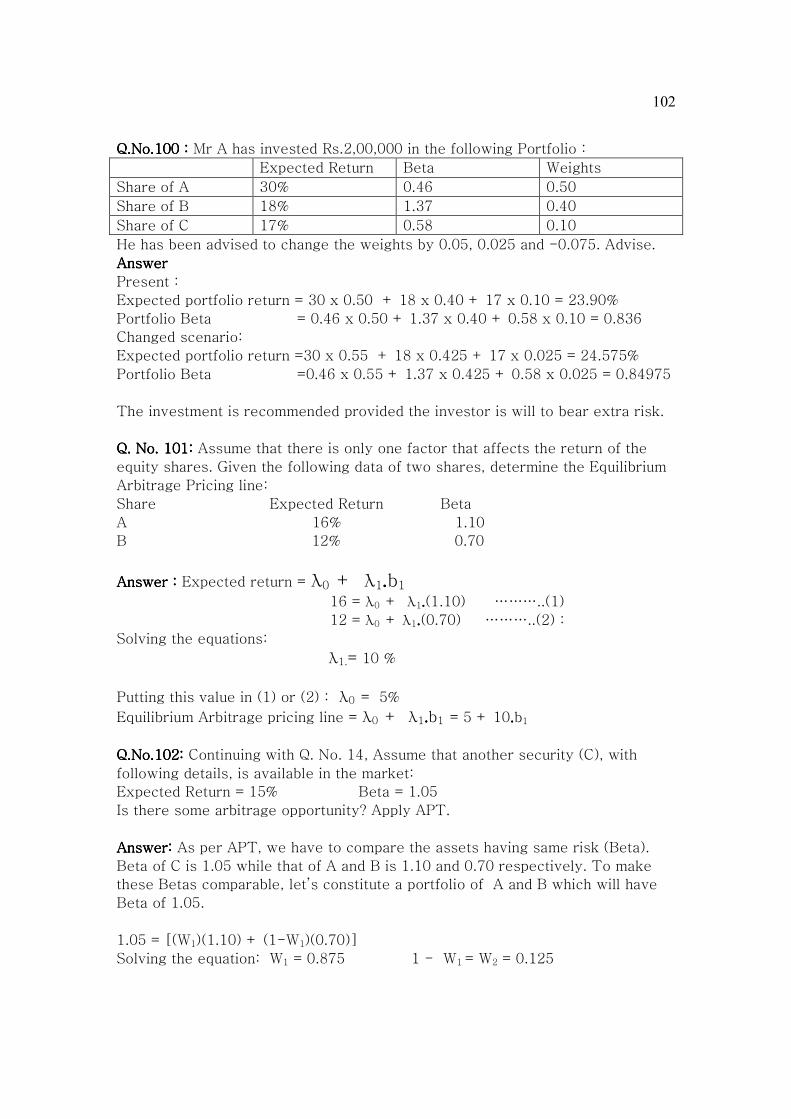
102
Q.No.100Q.No.100Q.No.100Q.No.100 : : : : Mr A has invested Rs.2,00,000 in the following Portfolio :
Expected Return Beta Weights
Share of A 30% 0.46 0.50
Share of B 18% 1.37 0.40
Share of C 17% 0.58 0.10
He has been advised to change the weights by 0.05, 0.025 and -0.075. Advise.
Answer Answer Answer Answer
Present :
Expected portfolio return = 30 x 0.50 + 18 x 0.40 + 17 x 0.10 = 23.90%
Portfolio Beta = 0.46 x 0.50 + 1.37 x 0.40 + 0.58 x 0.10 = 0.836
Changed scenario:
Expected portfolio return =30 x 0.55 + 18 x 0.425 + 17 x 0.025 = 24.575%
Portfolio Beta =0.46 x 0.55 + 1.37 x 0.425 + 0.58 x 0.025 = 0.84975
The investment is recommended provided the investor is will to bear extra risk.
Q. No. 101Q. No. 101Q. No. 101Q. No. 101:::: Assume that there is only one factor that affects the return of the
equity shares. Given the following data of two shares, determine the Equilibrium
Arbitrage Pricing line:
Share Expected Return Beta
A 16% 1.10
B 12% 0.70
Answer :Answer :Answer :Answer : Expected return = λ0 + λ1....b1 16 = λ0 + λ1....(1.10) ………..(1)
12 = λ0 + λ1....(0.70) ………..(2) :
Solving the equations:
λ1.= 10 %
Putting this value in (1) or (2) : λ0 = 5%
Equilibrium Arbitrage pricing line = λ0 + λ1....b1 = 5 + 10....b1
Q.No.102Q.No.102Q.No.102Q.No.102: : : : Continuing with Q. No. 14, Assume that another security (C), with
following details, is available in the market:
Expected Return = 15% Beta = 1.05
Is there some arbitrage opportunity? Apply APT.
Answer:Answer:Answer:Answer: As per APT, we have to compare the assets having same risk (Beta).
Beta of C is 1.05 while that of A and B is 1.10 and 0.70 respectively. To make
these Betas comparable, let’s constitute a portfolio of A and B which will have
Beta of 1.05.
1.05 = [(W1)(1.10) + (1-W1)(0.70)]
Solving the equation: W1 = 0.875 1 - W1 = W2 = 0.125

103
Expected return of this portfolio: (0.875x 16) + (0.125x12) = 15.50
Asset Expected return Beta
C 15% 1.05
Portfolio of A & B with W1
as 0.875 and W2 as 0.125
15.50 1.05
Both the assets have same Beta but C’s return is lower. Hence arbitrage profit is
possible through Shorting ( Borrow the securities and selling them ) C and
purchasing A & B.
Borrow shares of C having current market value of Rs.1,00,000. Sell these
shares. Use the sale proceeds to buy shares of A Rs.87500 and shares of B
Rs.12500.
Asset Initial cash flow Year end cash flows
Portfolio of A & B with W1
as 0.875 and W2 as 0.125
- 100000 +1,15,500
C +100000 -115000
0 + 500
Q No. 103Q No. 103Q No. 103Q No. 103 : : : : Consider the following data for one factor ( GDP) economy.
Portfolio Expected return Beta
A 11% 1.18
B 6% 0
Suppose there is another portfolio C with Beta of 0.59 and expected return
of 8%.What would be the arbitrage opportunity?
Answer:Answer:Answer:Answer:
As per APT, we have to compare the assets having same risk (Beta).
Beta of C is 0.59 while that of A and B is 1.18 and 0 respectively. To make these
Betas comparable, let’s constitute a portfolio of A & B which will have Beta 0.59.
0.59 = [(W1)(1.18) + (1-W1)(0)]
Solving the equation: W1 = 0.50 1 - W1 = W2 = 0.50
Expected return of this portfolio: (0.50x 11) + (0.50x6) = 8.50
Asset Expected return Beta
C 8.00% 0.59
Portfolio of A & B with W1
as 0.50 and W2 as 0.50
8.50% 0.59

104
Both the assets have same Beta but C’s return is lower. Hence arbitrage profit is
possible through Shorting ( Borrow the securities and selling them ) C and
purchasing A & B.
Borrow shares of C having current market value of Rs.1,00,000. Sell these
shares. Use the sale proceeds to buy shares of A Rs.50000 and shares of B
Rs.50000.
Asset Initial cash flow Year end cash flows
Portfolio of A & B with W1
as 0.50 and W2 as 0.50
- 100000 +1,08,000
C +100000 -1,08,500
0 + 500
Q. No. 104Q. No. 104Q. No. 104Q. No. 104: : : : Using the following details, can we make arbitrage profit ::::
Expected Return Beta 1 Beta 2
Share of A 17% 1.10 0.70
Share of B 11% 0.50 0.60
Share of C 16.50% 0.80 0.65
Answer : Answer : Answer : Answer : As per APT, we have to compare the assets having same risk (Beta).
Beta1 of C is 0.80 while that of A and B is 1.10 and 0.50 respectively. To make
these Betas comparable, let’s constitute a portfolio of A and B which will have
Beta of 0.80.
0.80 = [(W1)(1.10) + (1-W1)(0.50)]
Solving the equation: W1 = 0.50 1 - W1 = W2 = 0.50
Beta2 of C is 0.65 while that of A and B is 0.70 and 0.60 respectively. To make
these Betas comparable, let’s constitute a portfolio of A and B which will have
Beta of 0.65.
0.65 = [(W1)(0.70) + (1-W1)(0.60)]
Solving the equation: W1 = 0.50 1 - W1 = W2 = 0.50
Expected return of this portfolio: (0.50x 17) + (0.50x11) = 14
Asset Expected return Beta1 Beta2
C 16.50% 0.80 0.65
Portfolio of A & B with W1
as 0.50 and W2 as 0.50
14% 0.80 0.65

105
Both the assets have same Beta but C’s return is higher. Hence arbitrage profit is
possible through shorting (Borrow the securities and selling them) A & B and
purchasing C.
Borrow shares of A & having current market value of Rs.50,000 each. Sell these
shares. Use the sale proceeds to buy shares of C Rs.100000.
Asset Initial cash flow Year end cash flows
Portfolio of A & B with W1
as 0.50 and W2 as 0.50
+ 100000 -1,14,000
C -100000 +1,16500
0 + 2500
Q. No. 105Q. No. 105Q. No. 105Q. No. 105 The expected return on equity shares of A Ltd is affected by three
macro factors i.e. Change in GDP Growth, change Oil prices and change in
Monsoon. Assume the RF is 10%. The values of these factors are as follows:
Macro Factors : Value of Macro factor
Change in GDP 6%
Change in Oil prices -2%
Change in Monsoon 3%
(i) Suppose a share has average exposure to each of these factors.
Expected Return?
(ii) A share has very high exposure to Change in GDP growth ( Beta =
2.50) but no exposure to other factors. Expected return?
(iii) A share has very high exposure to Change in oil prices ( Beta = 3),
average exposure to change in GDP but no exposure to change in
Monsoon. Expected return?
(iv) A share has no exposure to all these factors. Expected return?
Answer Answer Answer Answer
(i) (i) (i) (i) The term ‘‘‘‘average exposure’ is used to denote that beta of that macro factor
is one.
Expected return = λ0 + ( λ1.b1 + λ2.b2+ λ3.b3 ) = 10 + (6x1) + (-2x1) + (3 x1 ) = 17%
(ii) Expected return = λ0 + ( λ1.b1 + λ2.b2+ λ3.b3 ) = 10 + (6 x 2.50) + (-2 x 0) + (3 x 0) = 25%
(iii) Expected return = λ0 + ( λ1.b1 + λ2.b2+ λ3.b3 ) = 10 + (6 x 1) + (-2 x 3) + (3 x 0) = 10%
(iv) Expected return = λ0 + ( λ1.b1 + λ2.b2+ λ3.b3 ) = 10 + (6 x 0) + (-2 x 0) + (3 x 0) = 10%

106
Q. No. 1Q. No. 1Q. No. 1Q. No. 106060606 The expected return on equity shares in an economy is affected by
four macro factors i.e. Change in GDP Growth, change Oil prices, change in
Monsoon and change in Book value. Assume the RF is 10%. The values of these
factors are as follows:
Macro Factors : Value of Macro factor
Change in GDP 6%
Change in Oil prices -2%
Change in Monsoon 3%
Change in Book value 10%
Given the following factor sensitivities of the equity shares of four companies,
find the expected return on equity shares of each company.
Factor sensitivities
Factor Madhav Ltd. Keshav Ltd. Krishna Ltd. Damodar Ltd.
Change in
GDP
1.50 2.00 0.50 0.20
Change in Oil
prices
-1.00 -0.05 -0.10 -0.90
Change in
Monsoon
0.20 0.50 2.00 1.50
Change in
Book value
0.25 0.50 0.65 0.55
AnswerAnswerAnswerAnswer :
Expected return = λ0 + ( λ1.b1 + λ2.b2+ λ3.b3 + λ34b4) Expected return of Madhav:10+(6x1.50)+(-2 x -1)+(3 x0.20)+(10 x 0.25)
= 24.10 %
Expected return of Keshav:10+(6x 2)+(-2 x -0.05)+(3 x0.50)+(10 x 0.50)
= 28.40 %
Expected return of Krisjhna:10+(6x0.50)+(-2 x -0.10)+(3 x 2.00)+(10 x 0.65)
= 25.30%
Expected return of Damodar:10+(6x0.20)+(-2 x -0.90)+(3 x1.50)+(10 x 0.55)=
= 19.40% %
Q. No.107Q. No.107Q. No.107Q. No.107 The expected return on equity shares in an economy is affected by
four macro factors i.e. Change in GDP Growth, change Oil prices, change in
Monsoon and change in Book value. Assume the RF is 10%. The values of these
factors are as follows:
Macro Factors : Value of Macro factor
Change in GDP 6%
Change in Oil prices -2%
Change in Monsoon 3%
Change in Book value 10%
Given the following factor sensitivities of the equity shares of four companies,
find the expected return on equity shares of each company.

107
Factor sensitivities
Factor Madhav Ltd. Keshav Ltd. Krishna Ltd. Damodar Ltd.
Change in
GDP
1.50 2.00 0.50 0.20
Change in Oil
prices
-1.00 -0.05 -0.10 -0.90
Change in
Monsoon
0.20 0.50 2.00 1.50
Change in
Book value
0.25 0.50 0.65 0.55
Murari had Rs.1,00,000 to invest. He borrowed 100 shares of Damodar Ltd. and
sold at the rate of Rs.500. He invested Rs. 150000 equally in the equity shares of
other three companies. Find the Expected return of the portfolio.
Answer: Answer: Answer: Answer:
W1 = 50,000 / (50,000 + 50,000 + 50,000 – 50,000) = 0.50
W2 = 50,000 / (50,000 + 50,000 + 50,000 – 50,000) = 0.50
W3 = 50,000 / (50,000 + 50,000 + 50,000 – 50,000) =0.50
W4 = -50,000/ (50,000 + 50,000 + 50,000 – 50,000) =-0.50
Beta of portfolio (change in GDP) =
= 1.50 x 0.50 + 2.00 x 0.50 + 0.50 x 0.50 – 0.20 x 0.50
= 1.90
Beta of portfolio (change in Oil prices) =
= - 1.00 x 0.50 – 0.05 x 0.50 - 0.10 x 0.50 + 0.90 x 0.50
= -0.125
Beta of portfolio (change in Monsoon) =
= 0.20 x 0.50 + 0.50 x 0.50 + 2.00 x 0.50 – 1.50 x 0.50
= 0.60
Beta of portfolio (change in Book value) =
= 0.25 x 0.50 +0.50 x 0.50 + 0.65 x 0.50 - 0.55 x 0.50
= 0.425
Expected return of the portfolio = λ0 + ( λ1.b1 + λ2.b2+ λ3.b3 + λ34b4)
= 10 + (6.00 x 1.90) + (-2 )x(-0.125) + 3x0.60+10x0.425
= 27.70%
Note : The commission on borrowing the shares has not been considered as it is
not given in the question.
Q. No. Q. No. Q. No. Q. No. 108108108108 The expected return on equity shares in an economy is affected by
four macro factors i.e. Change in GDP Growth, change Oil prices, change in
Monsoon and change in Book value. Assume the RF is 10%. The risk premiums of
these factors are as follows:
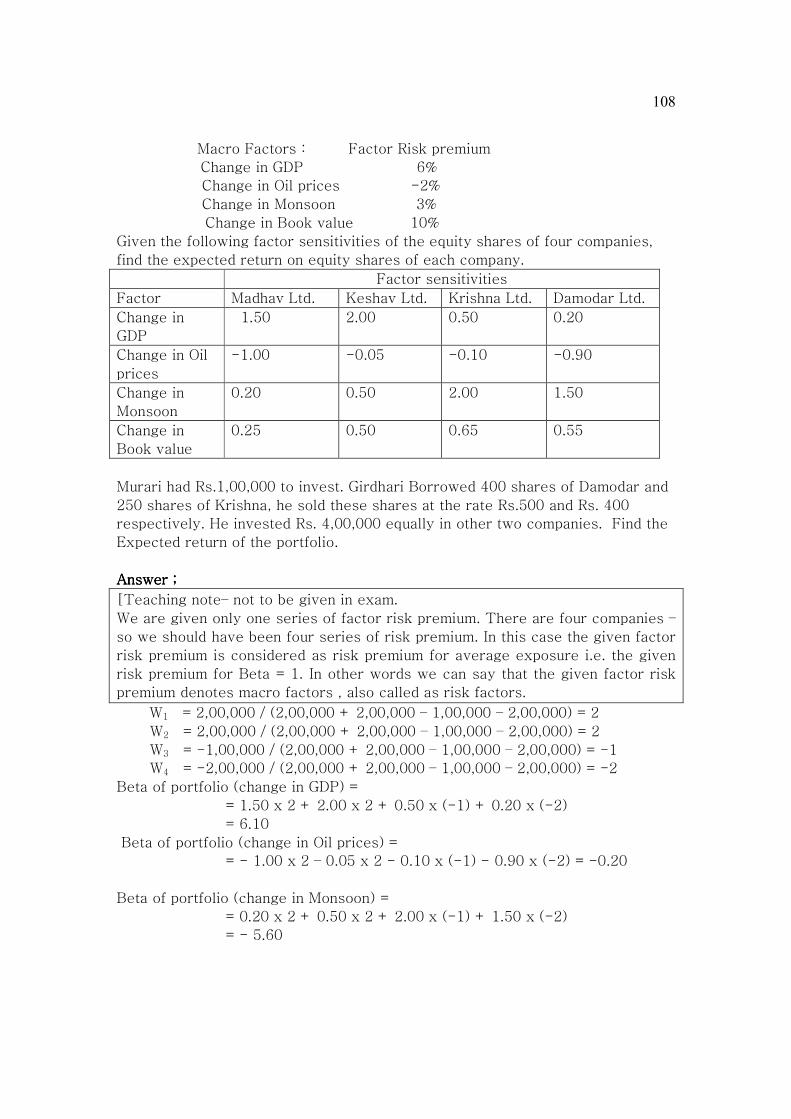
108
Macro Factors : Factor Risk premium
Change in GDP 6%
Change in Oil prices -2%
Change in Monsoon 3%
Change in Book value 10%
Given the following factor sensitivities of the equity shares of four companies,
find the expected return on equity shares of each company.
Factor sensitivities
Factor Madhav Ltd. Keshav Ltd. Krishna Ltd. Damodar Ltd.
Change in
GDP
1.50 2.00 0.50 0.20
Change in Oil
prices
-1.00 -0.05 -0.10 -0.90
Change in
Monsoon
0.20 0.50 2.00 1.50
Change in
Book value
0.25 0.50 0.65 0.55
Murari had Rs.1,00,000 to invest. Girdhari Borrowed 400 shares of Damodar and
250 shares of Krishna, he sold these shares at the rate Rs.500 and Rs. 400
respectively. He invested Rs. 4,00,000 equally in other two companies. Find the
Expected return of the portfolio.
Answer ;Answer ;Answer ;Answer ;
[Teaching note– not to be given in exam.
We are given only one series of factor risk premium. There are four companies –
so we should have been four series of risk premium. In this case the given factor
risk premium is considered as risk premium for average exposure i.e. the given
risk premium for Beta = 1. In other words we can say that the given factor risk
premium denotes macro factors , also called as risk factors.
W1 = 2,00,000 / (2,00,000 + 2,00,000 – 1,00,000 – 2,00,000) = 2
W2 = 2,00,000 / (2,00,000 + 2,00,000 – 1,00,000 – 2,00,000) = 2
W3 = -1,00,000 / (2,00,000 + 2,00,000 – 1,00,000 – 2,00,000) = -1
W4 = -2,00,000 / (2,00,000 + 2,00,000 – 1,00,000 – 2,00,000) = -2
Beta of portfolio (change in GDP) =
= 1.50 x 2 + 2.00 x 2 + 0.50 x (-1) + 0.20 x (-2)
= 6.10
Beta of portfolio (change in Oil prices) =
= - 1.00 x 2 – 0.05 x 2 - 0.10 x (-1) - 0.90 x (-2) = -0.20
Beta of portfolio (change in Monsoon) =
= 0.20 x 2 + 0.50 x 2 + 2.00 x (-1) + 1.50 x (-2)
= - 5.60

109
Beta of portfolio (change in Book value) =
= 0.25 x 2 +0.50 x 2 + 0.65 x (-1) + 0.55 x (-2)
= - 0.25
Expected return of the portfolio = λ0 + ( λ1.b1 + λ2.b2+ λ3.b3 + λ34b4)
= 10 + (6.00 x 6.10) + (-2 )x(-0.20) + 3x(-5.60)+10x(-0.25)
= 27.20%
Note : The commission on borrowing the shares has not been considered as it is
not given in the question.
Q. No. 109Q. No. 109Q. No. 109Q. No. 109 The expected return on equity shares in an economy is affected by
four macro factors i.e. Change in GDP Growth, change Oil prices, change in
Monsoon and change in Book value. Assume the return from Treasury Bills is
10%.
Given the following data, find the expected return as well actual return on equity
shares of each company.
Factor sensitivities
Factor Madhav Ltd. Keshav Ltd. Krishna Ltd. Damodar Ltd.
Change in
GDP
1.50 2.00 0.50 0.20
Change in Oil
prices
-1.00 -0.05 -0.10 -0.90
Change in
Monsoon
0.20 0.50 2.00 1.50
Change in
Book value
0.25 0.50 0.65 0.55
Factor Expected rate of change Actual rate of change
Change in GDP 6% 5%
Change in Oil prices 2% 3%
Change in Monsoon 3% 2%
Change in Book value 5% 6%
Answer Answer Answer Answer :
Expected return = λ0 + ( λ1.b1 + λ2.b2+ λ3.b3 + λ34b4) Expected return of Madhav;10+{6x1.50}+{2x(-1)}+{3x0.20}+{5x0.25}
=18.85%
Expected return of Keshav;10+{6x2}+{2x(-0.05)}+{3x0.50}+{5x0.50}
=25.90%
Expected return of Krishna;10+{6x0.50}+{2x(-0.10)}+{3x2}+{5x0.65}
= 22.05%
Expected return of Damodar;10+{6x0.20}+{2x(-0.90)}+{3x1.50}+{5x0.55}
= 16.65%
Actual return = λ0 + ( λ1.b1 + λ2.b2+ λ3.b3 + λ34b4)

110
Actual return of Madhav : 18.85+{(-1)x1.50}+{1x(-1)}+{(-1)x0.20}+{1x0.25}
= 16.40%
Alternative way : Actual return of Madhav :
= = = = 10+{5x1.50}+{3x(-1)}+{2x0.20}+{6x0.25}=16.40%
Actual return of Keshav;25.90+{(-1)x2}+{1x(-0.05)}+{(-1)x0.50}+{1x0.50}
= 23.85%
Alternative way : Actual return of Keshav :
= = = = 10+{5x2}+{3x(-0.05)}+{2x0.50}+{6x0.50}
= 23.85
Actual return of Krishna; 22.05+{(-1)x0.50}+{1x(-0.10)}+{(-1)x2}+{1x0.65}
= 20.10%
Actual return of Damodar;
16.65+{(-1)x0.20}+{1x(-0.90)}+{(-1)x1.50}+{1x0.55}
= 14.60%
Q. No. 110Q. No. 110Q. No. 110Q. No. 110
Mr. X owns a portfolio with the following characteristics:
Security A Security B Risk Free security
Factor 1 sensitivity 0.80 1.50 0
Factor 2 sensitivity 0.60 1.20 0
Expected Return 15% 20% 10%
It is assumed that security returns are generated by a two factor model.
(i) If Mr. X has Rs. 1,00,000 to invest and sells short Rs. 50,000 of security B and
purchases Rs. 1,50,000 of security A what is the sensitivity of Mr. X’s portfolio
to the two factors?
(ii) If Mr. X borrows Rs. 1,00,000 at the risk free rate and invests the amount he
borrows along with the original amount of Rs. 1,00,000 in security A and B in the
same proportion as described in part (i), what is the sensitivity of the portfolio to
the two factors?
(iii) What is the expected return premium of factor 2? (8 Marks) (June,2009 (June,2009 (June,2009 (June,2009 ) ) ) )
AnswerAnswerAnswerAnswer (i) : W1 = [1,50,000 / ( 1,50,000 – 50000)] = 1.50
W2 = [-50000 / ( 1,50,000 – 50,000)] = - 0.50
Portfolio sensitivity (Beta) of Factor 1: 1.50 x 0.80+(-0.50) x 1.50 = 0.45
Portfolio sensitivity (Beta) of Factor 2: 1.50 x 0.60+(-0.50) x 1.20 = 0.30
(ii) The proportion of investments between A and B [in part (i) of the question] :
1.50 : - 0.50. It means the amount of short sale of B should be 1/3rd of
investment in A.
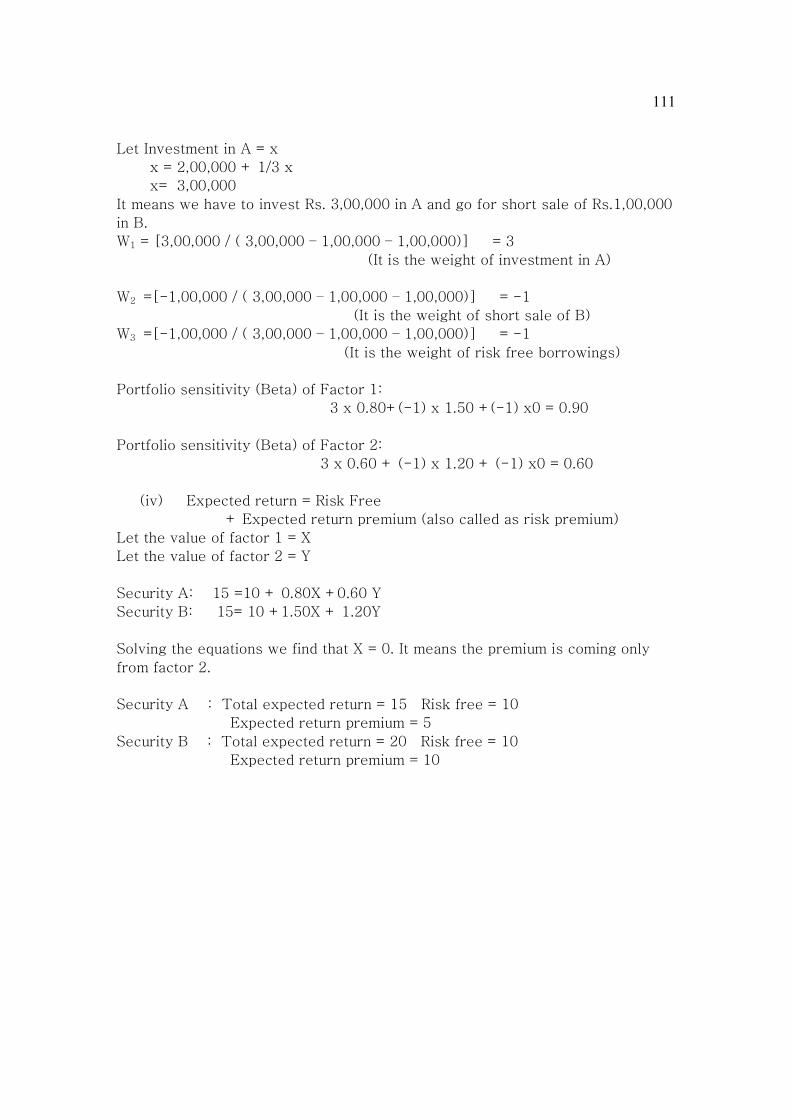
111
Let Investment in A = x
x = 2,00,000 + 1/3 x
x= 3,00,000
It means we have to invest Rs. 3,00,000 in A and go for short sale of Rs.1,00,000
in B.
W1 = [3,00,000 / ( 3,00,000 – 1,00,000 – 1,00,000)] = 3
(It is the weight of investment in A)
W2 =[-1,00,000 / ( 3,00,000 – 1,00,000 – 1,00,000)] = -1
(It is the weight of short sale of B)
W3 =[-1,00,000 / ( 3,00,000 – 1,00,000 – 1,00,000)] = -1
(It is the weight of risk free borrowings)
Portfolio sensitivity (Beta) of Factor 1:
3 x 0.80+(-1) x 1.50 +(-1) x0 = 0.90
Portfolio sensitivity (Beta) of Factor 2:
3 x 0.60 + (-1) x 1.20 + (-1) x0 = 0.60
(iv) Expected return = Risk Free
+ Expected return premium (also called as risk premium)
Let the value of factor 1 = X
Let the value of factor 2 = Y
Security A: 15 =10 + 0.80X +0.60 Y
Security B: 15= 10 +1.50X + 1.20Y
Solving the equations we find that X = 0. It means the premium is coming only
from factor 2.
Security A : Total expected return = 15 Risk free = 10
Expected return premium = 5
Security B : Total expected return = 20 Risk free = 10
Expected return premium = 10
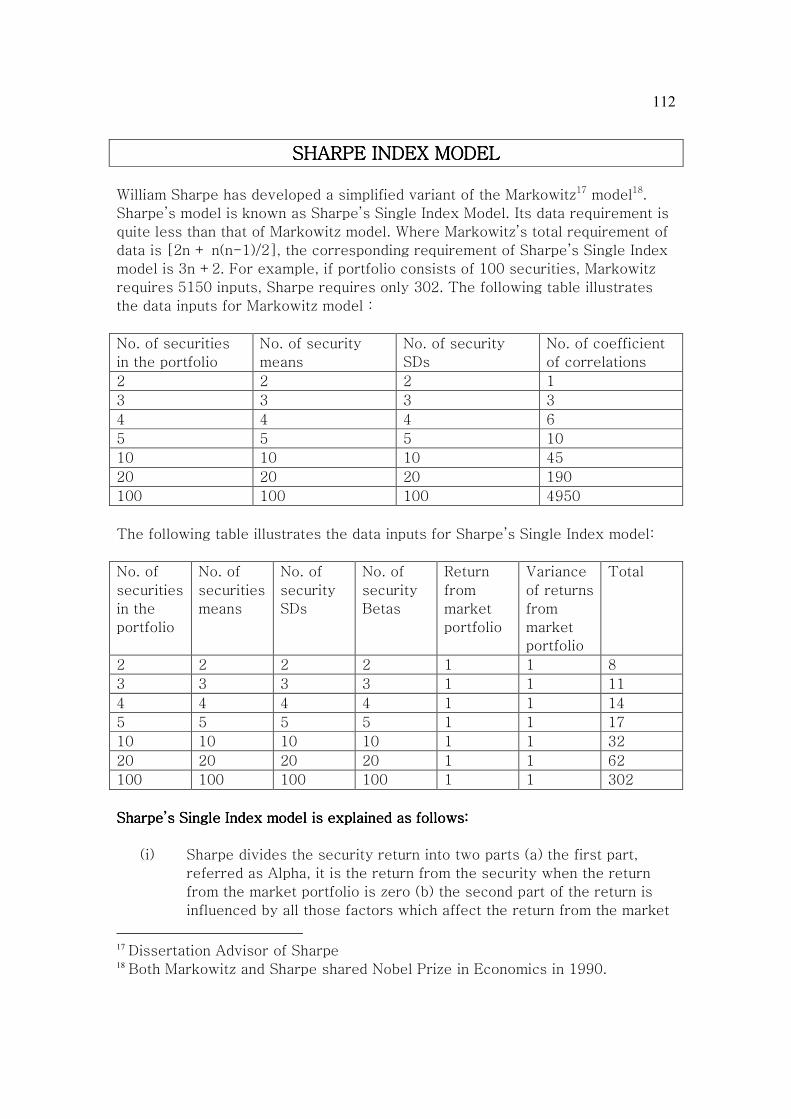
112
SHARPE INDEX MODELSHARPE INDEX MODELSHARPE INDEX MODELSHARPE INDEX MODEL
William Sharpe has developed a simplified variant of the Markowitz17 model18.
Sharpe’s model is known as Sharpe’s Single Index Model. Its data requirement is
quite less than that of Markowitz model. Where Markowitz’s total requirement of
data is [2n + n(n-1)/2], the corresponding requirement of Sharpe’s Single Index
model is 3n +2. For example, if portfolio consists of 100 securities, Markowitz
requires 5150 inputs, Sharpe requires only 302. The following table illustrates
the data inputs for Markowitz model :
No. of securities
in the portfolio
No. of security
means
No. of security
SDs
No. of coefficient
of correlations
2 2 2 1
3 3 3 3
4 4 4 6
5 5 5 10
10 10 10 45
20 20 20 190
100 100 100 4950
The following table illustrates the data inputs for Sharpe’s Single Index model:
No. of
securities
in the
portfolio
No. of
securities
means
No. of
security
SDs
No. of
security
Betas
Return
from
market
portfolio
Variance
of returns
from
market
portfolio
Total
2 2 2 2 1 1 8
3 3 3 3 1 1 11
4 4 4 4 1 1 14
5 5 5 5 1 1 17
10 10 10 10 1 1 32
20 20 20 20 1 1 62
100 100 100 100 1 1 302
Sharpe’s Single Index model is explained as follows:Sharpe’s Single Index model is explained as follows:Sharpe’s Single Index model is explained as follows:Sharpe’s Single Index model is explained as follows:
(i) Sharpe divides the security return into two parts (a) the first part,
referred as Alpha, it is the return from the security when the return
from the market portfolio is zero (b) the second part of the return is
influenced by all those factors which affect the return from the market
17 Dissertation Advisor of Sharpe 18 Both Markowitz and Sharpe shared Nobel Prize in Economics in 1990.

113
portfolio i.e. the second part is dependent on the return from the
market portfolio.
Security return = security Alpha + (security Beta x RM)
Portfolio return = Portfolio Alpha + ( Portfolio Beta x RM)
Where,
Portfolio Beta = Portfolio Beta = W1β1 +W2β2 + W3β3 +…………….+ Wnβn
Portfolio Alpha = W1Alpha1 +W2Alpha2 + W3Alpha3 +…………+ WnAlphan
(ii) Portfolio Risk i.e. Portfolio variance =
Market variance x (Portfolio Beta)2 +
[(W1)2 x (unsystematic risk of security1)] +
[(W2)2 x (unsystematic risk of security2)]+
[(W3)2 x (unsystematic risk of security3)]+……………………….+
[(Wn)2 x (unsystematic risk of securityn)]
(iii) Covariance1,2 = Beta1.Beta2.market variance.
Example : Beta of security A = 1.20
Beta of Security B = 1.10
Market variance = 10.
Calculate covariance between A and B.
Calculate covariance between A and market.
Calculate covariance between B and Market
Answer:
Covariance between A and B = 1.20 x 1.10 x10 = 13.20
Covariance between A and market = 1.20 x 1 x10 = 12.00
Covariance between B and market = 1.10 x 1 x10 = 11.00
(iv) R = Coefficient of determination = r2
R explains the proportion of systematic risk (out of total risk) when the
risk is calculated as variance.
ExampleExampleExampleExample : Calculate Beta of A from the following data:
Security A Security B Market
R 0.16 0.17
Total Variance 7 6 5
AnswerAnswerAnswerAnswer
Systematic risk (of A )= 0.16 x 7 = 1.02
1.02 = Beta2 x 5
Beta = 0.45

114
(v) The model does not calculate the coefficients of correlation between each
pair of the securities as it holds that the coefficient of correlation among various
securities get reflected in the market variance
Q. No. 1Q. No. 1Q. No. 1Q. No. 111111111: : : : A portfolio manager analyzes 70 stocks. She wants to draw efficient
frontier under Markowitz’s portfolio theory. How many estimates of expected
returns, variances and co-variances are to be calculated? How your answer will
change if you follow Sharpe’s Single Index approach?
Answer : MarkowitzAnswer : MarkowitzAnswer : MarkowitzAnswer : Markowitz
No. of securities in
the portfolio
No. of security
means
No. of
security SDs
No. of co-
variances
70 70 70 70(69)/2 = 2415
Sharpe’s Index ModSharpe’s Index ModSharpe’s Index ModSharpe’s Index Model :el :el :el :
No. of
securities
in the
portfolio
No. of
securities
means
No. of
security
SDs
No. of
security
Betas
Return
from
market
portfolio
Variance
of returns
from
market
portfolio
70 70 70 70 1 1
Q.No.Q.No.Q.No.Q.No.111111112 : 2 : 2 : 2 : The following are the estimates for two stocks :
Stock Expected Return Beta Residual SD
A 12.50% 0.84 29%
B 18.60% 1.26 44%
Market SD is 23% and the risk free rate of return is 7.60%.
What is the SDs of A and B?
Suppose you construct a portfolio with following proportions :
A 0.28 B 0.46 T bIll 0.26
Compute the expected return, Standard Deviation, Beta and nonsystematic Risk
of the port folio.
Answer :Answer :Answer :Answer :
Systematic risk of a security ( Based on SD) = Security’s Beta x Market SD
Systematic risk of A (Based on SD) = 0.84 x 0.23 = 0.1932
SD of A = 0.1932 + 0.2900 = 0.4832 =48.32%
Systematic risk of B (Based on SD) = 1.26 x 0.23 = 0.2898
SD of B = 0.2898 + 0.4400 = 0.7298 = 72.98%
Expected return of portfolio = 12.50x0.28 + 18.60x0.46 + 7.60x0.26 = 14.032%
Portfolio Beta = 0.84x0.28 + 1.26x0.46+ 0x0.26 = 0.8148
Unsystematic risk of A ( based on Variance ) = (0.4832)2 - (0.1932)2 = 0.1962
Unsystematic risk of B ( based on Variance ) = (0.7298)2 - (0.2898)2 = 0.4486

115
Portfolio Variance =
Market variance x (Portfolio Beta)2 +
[(W1)2 x (unsystematic risk of security1 based on variance] +
[(W2)2 x (unsystematic risk of security2) based on variance]+
[(W3)2 x (unsystematic risk of security2) based on variance]
= (0.23)2 x(0.8148)2 + (0.28)2 x(0.1962) + (0.46)2 x(0.4486) +(0.26)2x0
= 0.1454
Portfolio SD = √0.1454 = 0.38
Unsystematic risk of Portfolio ( Based on variance)
=(0.28)2 x(0.1962) + (0.46)2 x(0.4486) +(0.26)2x0 = 0.11
Q.No.Q.No.Q.No.Q.No.113 113 113 113 :::: The coefficient of correlation between returns of market and those of
Security A is 1.00. RM = 10% . Expected return of Security A is 8%. Estimate
Beta of Security A.
Hint : Let the market return = X Let the security A return = Y
X x x2 Y y xy
12 2 4 9.60 1.60 3.20
11 1 1 8.80 0.80 0.80
10 0 0 8.00 0 0
9 -1 1 7.20 -0.80 0.80
8 -2 4 6.40 -1.60 3.20
∑X = 50 ∑ x2 = 10 ∑Y = 40 ∑xy = 8
Covariance = ∑xy / n = 8/5 = 1.60
Market variance = ∑x2 / n = 10/5 = 2
Security A’s Beta = covariance / market variance = 1.60/ 2 = 0.80
Q.Q.Q.Q. No. No. No. No. 111111114 :4 :4 :4 : Calculate the expected returns, alpha values and total variances for
the following stocks.
Asset Expected return % Beta Residual SD%
Stock A 19.50 1.28 59
Stock B 18.40 1.81 70
Stock C 16.90 0.72 63
Stock D 12.10 1.01 58
RM = 16.60%. Market SD(%) = 23.50. RF rate = 9%
Answer : Answer : Answer : Answer : Expected return = RF + Beta(RM-RF)
Expected return of A = 9 + 1.28(16.60 -9) = 18.73%
Expected return of B = 9 + 1.81(16.60 -9) = 22.76%
Expected return of C = 9 + 0.72(16.60 -9) = 14.47%
Expected return of D = 9 + 1.01(16.60 -9) = 16.68%

116
Alpha = Security return ( Likely ) – RMxBeta
Alpha of A = 19.50 – 16.60x1.28 = -1.748
Alpha of B = 18.40 – 16.60x1.81 = - 11.646
Alpha of A = 16.90 – 16.60x0.72 = +4.948
Alpha of A = 12.10 – 16.60x1.01 = -4.666
Systematic risk of a security ( Based on SD) = Security’s Beta x Market SD
Systematic risk of A ( Based on SD) = 1.28 x 0.2350 = 0.3008
Systematic risk of B ( Based on SD) = 1.81 x 0.2350 = 0.4254
Systematic risk of C ( Based on SD) = 0.72 x 0.2350 = 0.1692
Systematic risk of D ( Based on SD) = 1.01 x 0.2350 = 0.2374
Unsystematic risk of A ( Based on SD) = 0.59
Unsystematic risk of B ( Based on SD) = 0.70
Unsystematic risk of C ( Based on SD) = 0.63
Unsystematic risk of D ( Based on SD) = 0.58
SD Variance
A 0.3008 + 0.59 = 0.8908 0.7935
B 0.4254 +0.70 = 1.1254 1.2665
C 0.1692 +0.63 = 0.7992 0.6387
D 0.2374 +0.58 = 0.8174 0.6681
Q.Q.Q.Q. No. No. No. No. 111111115 :5 :5 :5 : The following are the details of three stocks :
Stock Market capitalization Beta Risk Premium SD %
A Rs. 4.000 Billion 1.05 11.00% 38
B Rs 1.356 Billion 0.27 5.00% 36
C Rs.1.644 Billion 1.79 17.50% 57
Market SD = 24%
What is the mean (%) of risk premium of the three stocks?
What is the covariance between stock A and the market?
Decompose the variance of C into systematic and unsystematic components
Answer Answer Answer Answer
W1 = 4/(4+1.356+1.644) = 0.5714
W2 = 1.356/(4+1.356+1.644) = 0.1937
W1 = 1.644/(4+1.356+1.644) = 0.2349
Mean (%) of risk premium of 3 stocks =
11.00x0.5714 + 5x0.1937 + 17.50x0.2349 = 11.36
Beta = Covariance / Market variance
Beta A = 1.05 =Covariance / (0.24)2
Covariance of A = 0.06048
Variance of C = 0.3249
Systematic risk of C ( Based on Variance) = (1.79)2 x (0.24)2 = 0.1846
Unsystematic risk of C ( Based on Variance) = 0.3249 - 0.1846 = 0.1403

117
Q. No. Q. No. Q. No. Q. No. 111111116: 6: 6: 6: Following are the details of a portfolio consisting of three shares :
Share Portfolio
weight
Beta Expected
return
Total variance
A 0.20 0.40 14 0.015
B 0.50 0.50 15 0.025
C 0.30 1.10 21 0.100
SD of market portfolio returns = 10%
(a) Find the portfolio Beta.
(b) Residual variance of each of three shares
(c) Portfolio Variance using Sharpe Index Model
(d) Expected return of the portfolio
(e) Portfolio variance (on the basis of Modern portfolio theory given by
Markowitz). You are given the following additional data.
Covariance (A,B) = 0.030 Covariance (A,C) = 0.020
Covariance (B,C) = 0.040
AnswerAnswerAnswerAnswer
(a) Portfolio Beta = 0.40x0.20 + 0.50x0.50 + 1.10x0.30 =0.66
(b)
Total variance Systematic risk (variance) Residual variance
A 0.015 (0.40)2 x0.01 =0.0016 0.0134
B 0.025 (0.50)2 x0.01 =0.0025 0.0225
C 0.100 (1.10)2 x0.01 =0.0121 0.0879
(c) Portfolio variance (Sharpe) :
Market variance x (Portfolio Beta)2 +
[(W1)2 x (unsystematic risk of security1 based on variance] +
[(W2)2 x (unsystematic risk of security2) based on variance]+
[(W3)2 x (unsystematic risk of security2) based on variance]
= (0.10)2 x(0.66)2 + (0.20)2 x(0.0134) +(0.50)2 x(0.0225)+ (0.30)2x(0.0879)
= 0.01842
(d) Expected return on portfolio: 14x0.20 + 15x0.50 + 21x0.30 = 16.60%
(e) Portfolio variance (Markowitz):
= (0.20) 2x(0.015) + (0.50) 2x(0.025) +(0.30) 2x(0.100) +
2(0.20)(0.50)(0.030) + 2(0.20)(0.30)(0.020) + 2(0.50)(0.30)(0.040)
= 0.03625
Q.Q.Q.Q. No. No. No. No. 111111117 : 7 : 7 : 7 : Given that risk premium on market portfolio is 10%, RF is 6% and
market SD is 0.30, complete the following table :
Share Expected
return
Standard
deviation
Beta Residual
variance
A 15% 0.0375
B 14% 0.40
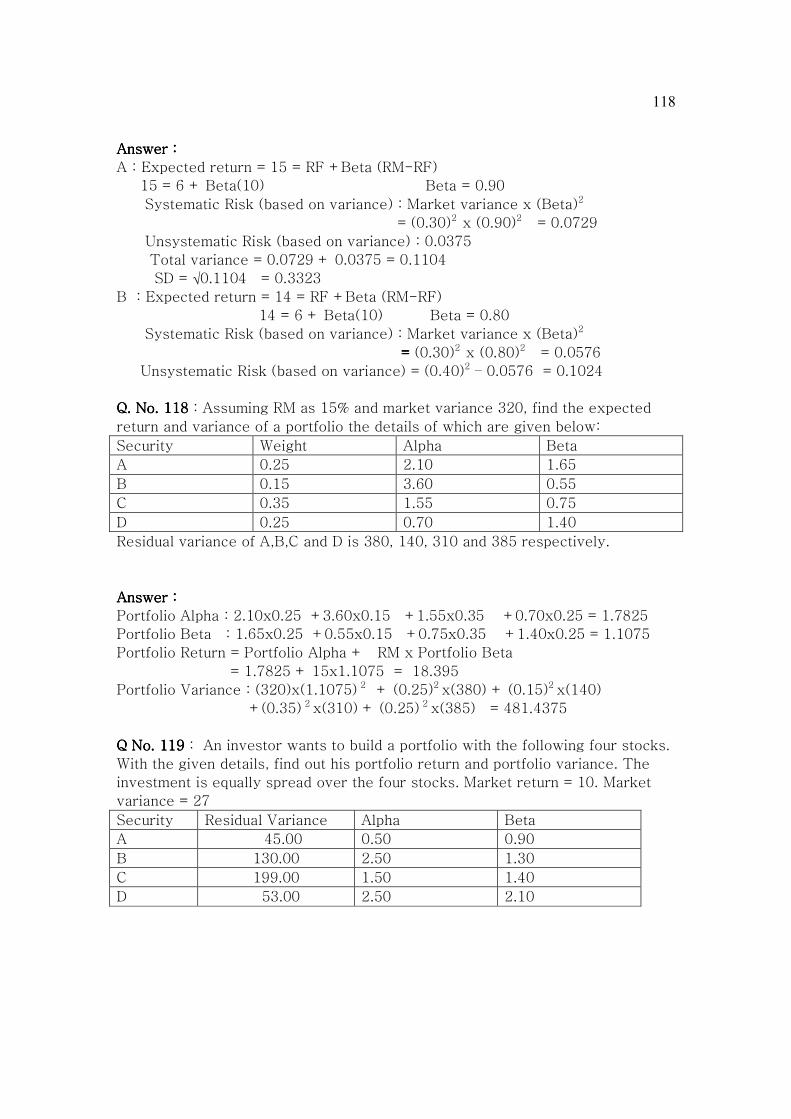
118
Answer : Answer : Answer : Answer :
A : Expected return = 15 = RF +Beta (RM-RF)
15 = 6 + Beta(10) Beta = 0.90
Systematic Risk (based on variance) : Market variance x (Beta)2
= (0.30)2 x (0.90)2 = 0.0729
Unsystematic Risk (based on variance) : 0.0375
Total variance = 0.0729 + 0.0375 = 0.1104
SD = √0.1104 = 0.3323
B : Expected return = 14 = RF +Beta (RM-RF)
14 = 6 + Beta(10) Beta = 0.80
Systematic Risk (based on variance) : Market variance x (Beta)2
= = = = (0.30)2 x (0.80)2 = 0.0576
Unsystematic Risk (based on variance) = (0.40)2 – 0.0576 = 0.1024
Q. No. Q. No. Q. No. Q. No. 111111118 8 8 8 : Assuming RM as 15% and market variance 320, find the expected
return and variance of a portfolio the details of which are given below:
Security Weight Alpha Beta
A 0.25 2.10 1.65
B 0.15 3.60 0.55
C 0.35 1.55 0.75
D 0.25 0.70 1.40
Residual variance of A,B,C and D is 380, 140, 310 and 385 respectively.
Answer :Answer :Answer :Answer :
Portfolio Alpha : 2.10x0.25 +3.60x0.15 +1.55x0.35 +0.70x0.25 = 1.7825
Portfolio Beta : 1.65x0.25 +0.55x0.15 +0.75x0.35 +1.40x0.25 = 1.1075
Portfolio Return = Portfolio Alpha + RM x Portfolio Beta
= 1.7825 + 15x1.1075 = 18.395
Portfolio Variance : (320)x(1.1075) 2 + (0.25)2 x(380) + (0.15)2 x(140)
+(0.35) 2 x(310) + (0.25) 2 x(385) = 481.4375
Q No. Q No. Q No. Q No. 111111119 9 9 9 : An investor wants to build a portfolio with the following four stocks.
With the given details, find out his portfolio return and portfolio variance. The
investment is equally spread over the four stocks. Market return = 10. Market
variance = 27
Security Residual Variance Alpha Beta
A 45.00 0.50 0.90
B 130.00 2.50 1.30
C 199.00 1.50 1.40
D 53.00 2.50 2.10

119
AnswerAnswerAnswerAnswer
Portfolio Alpha : 0.50x0.25 +2.50x0.25 +1.50x0.25 +2.50x0.25 = 1.75
Portfolio Beta : 0.90x0.25 +1.30x0.25 +1.40x0.25 +2.10x0.25 = 1.425
Portfolio Return = Portfolio Alpha + RM x Portfolio Beta
= 1.75 + 10x1.425 = 16%
Portfolio Variance :
= (27)(1.425)2 +(0.25) 2x(45) +(0.25) 2x(130) +(0.25) 2x(199)+(0.25) 2x(53)
= = = = 81.5175
Q. No. 1Q. No. 1Q. No. 1Q. No. 122220: 0: 0: 0: An investor wants to build a portfolio with the following four stocks.
With the given details, find out his portfolio return and portfolio variance. The
investment is equally spread over the four stocks. Market return = 10. Market
variance = 5
Security Residual Variance Alpha Systematic variance
A 3.00 - 0.08 5.10
B 5.50 0.11 2.20
C 1.10 0.02 3.30
D 2.30 -0.15 3.20
AnswerAnswerAnswerAnswer
Systematic variance = [(Beta)2x Market Variance]
A : 5.10 = [(Beta)2x 5] Beta = 1.01
B : 2.20 = [(Beta)2x 5] Beta = 0.66
C : 3.30 = [(Beta)2x 5] Beta = 0.81
D : 3.20 = [(Beta)2x 5] Beta = 0.80
Portfolio Alpha : 0.25(-0.08 + 0.11 + 0.02 -0.15) = -0.025
Portfolio Beta : 0.25( 1.01 + 0.66 + 0.81 + 0.80) = 0.842
Portfolio return = Portfolio Alpha + RM x Portfolio Beta
= -0.025 + 0.842x10 = 8.395
Portfolio Variance : 5x(0.842)2 + (0.25)
2x(3.00+5.50+1.10+2.30)
=4.28857

120
Q. No. 121:Q. No. 121:Q. No. 121:Q. No. 121: 1,000 Equity shares are listed on a stock exchange. Each share has a
Beta of 1 and SD of 0.40. A portfolio manager selected 40 shares after his
research; 20 shares had Alpha of 3% and another 20 had Alpha of -3%. He
borrowed the negative Alpha shares of Rs.1,00,000 each, sold these shares and
invested the amount equally in 20 shares having positive Alpha. Calculate the
portfolio return and variance.
AnswerAnswerAnswerAnswer : Portfolio return : Rs.1,20,000
Variance = [(0.40)2 .(1,00,000)2] x 20 +[(0.40)2 .(-1,00,000)2] x 20
= 64000 Million
Teaching noteTeaching noteTeaching noteTeaching note : It is a zero investment portfolio. In this case, the weights are
“the amounts of investments” and not the ratio of investment.
SHARPE’S OPTIMAL PORTFOSHARPE’S OPTIMAL PORTFOSHARPE’S OPTIMAL PORTFOSHARPE’S OPTIMAL PORTFOLIOLIOLIOLIO A Portfolio is defined as optimal portfolio if its Sharpe Ratio is highest. Sharpe
ratio is defined as risk premium per unit of total risk. Putting differently:
Sharpe ratioSharpe ratioSharpe ratioSharpe ratio = (Expected return – Risk Free return)/ SD
The difference between expected return and risk free return is referred as risk
premium. It is also refereed as “Mean excess return”.
In the following paragraphs, we shall be referring the Sharpe ratio as “Risk
premium/SD”.
By expected return we mean, the return that the investor expects on the basis of
historical data.
The following steps are required for portfolio construction under Sharpe’s
approach:
(i) Calculate the ratio of “Risk Premium/Beta” for each security.
(ii) Rank the ratios calculated under (i) in descending order.
(iii) Calculate the ratios of Beta2 / Residual variance for each security.
(iv) Multiply (ii) and (iii) [ {(Risk premium/Beta) x(Beta2 / Residual
variance)} = {(Risk premium x Beta)/(Residual variance)]
(v) Find cumulative value of (iii)

121
(vi) Find cumulative values of (iv)
(vii) Calculate Ci for each security.
C1 = Market variance x (Risk premium x Beta)/(Residual variance)
1 + Market variance (Beta2 / Residual variance)
C2 = [{(Market variance)x(Risk premium x Beta)}/(Residual variance)]
1 + [Market variance (Beta2 / Residual variance)]
And so on.
The value of (i) (Risk premium x Beta)/(Residual variance) and (ii) (Beta2 /
Residual variance) are to be taken from cumulative columns.
The highest Ci value is referred as C*. It is the cut-off rate. Security with C*
value and the securities before this security are to be included in the portfolio,
others are rejected.
vii)
The next step is to calculate the weights. For this purpose, we have to calculate
Zi.
Zi=[ Beta/residual variance] X [(Risk premium/Beta) - C*]
W1 = Zi /(Zi + Zii + Ziii + …….. +Zn)
W2 = Zii /(Zi + Zii + Ziii + …….. +Zn)
And so on.
[All these steps are simplified version of advanced mathematical derivations.
Such derivations are beyond the scope of this note]
RefereRefereRefereReferencencencence : : : :
Study Material on SFM page 7.28 -7.30 ( Board of Studies, ICAI)
Q . No. 122 Q . No. 122 Q . No. 122 Q . No. 122 Mr. Ramesh wants to invest in stock market. He has got the following
information about individual securities:
Security Expected return Beta SD2 ci
A 15 1.5 40
B 12 2 20
C 10 2.5 30
D 09 1 10
E 08 1.2 20
F 14 1.5 30

122
Market Index variance is 10 and the risk free rate of return is 7%. What should
be the optimum portfolio assuming no short sales.
( May, 2010) ( 10 Marks)( May, 2010) ( 10 Marks)( May, 2010) ( 10 Marks)( May, 2010) ( 10 Marks)
Teaching note – not required in the examnot required in the examnot required in the examnot required in the exam: SD2 ci given in the last question of the
question refers to Residual variance. It is evident from the following
observations:
(i) Systematic risk of B = 22 x 10 = 40. The figure given in the last column is 20.
The figure given in the last column cannot be total risk as total risk cannot be
less than systematic risk. It means the figures given in the last column represent
residual risk.
(ii) Systematic risk of C = 2.52 x 10 = 62.50. The figure given in the last column
is 30. The figure given in the last column cannot be total risk as total risk cannot
be less than systematic risk. It means the figures given in the last column
represent residual risk.
Answer Answer Answer Answer :
Note: It is assumed that the ci given in the question is ei.
(ei refers to residual variance)
Security Risk premium Beta Risk Premium/Beta
A 8 1.5 5.33
B 5 2 2.50
C 3 2.5 1.20
D 2 1 2
E 1 1.2 0.83
F 7 1.5 4.67
Secu-
rity
(Risk
Premium)/
(Beta)
(Beta2) /
(Residual
Variance)
(Risk
premium x
Beta) /
(Residual
variance)
Cum.
Value of
(Beta2 /
Residual
Variance)
Cum. Value
of (Risk
premium x
Beta)/
(Residual
variance)
C
A 5.33 0.05625 0.30 0.05625 0.30 1.92
F 4.67 0.07500 0.35 0.13125 0.65 2.8110
B 2.50 0.20000 0.50 0.33125 1.15 2.667
D 2.00 0.10000 0.20 0.43125 1.35 2.5414
C 1.20 0.20833 0.25 0.63958 1.60 2.1635
E 0.83 0.07200 0.06 0.71158 1.66 2.0452
Zi=[ Beta/residual variance] X [(Risk premium/Beta) - C*]

123
= = = = [1.5/40] X [(5.33-2.8110)] = 0.09446625
Zii = [1.5/30] x [4.67 -2.8110] = 0.09295
0.280335
W1 = 0.0944625/(0.0944625 + 0.09295) = 0.50
W2 = 0.09295 /(0.0944625 + 0.09295) = 0.50
Mr. Ramesh should invest 50% of his funds in A and 50% in F.
Teaching note Teaching note Teaching note Teaching note –––– not to be given in the exam :not to be given in the exam :not to be given in the exam :not to be given in the exam :
Security A :
variance = (1.50)2.(10) + 40 = 62.50
SD = 7.91
Sharpe ratio : 8/7.91 = 1.0113
Portfolio :
portfolio expected return = = 14.50
Portfolio Beta = 1.5
Portfolio systematic risk (Variance) = 1.5 x 1.5 x 10 = 22.50
Portfolio Unsystematic risk (variance) =
(0.5)2.(40) + (0.5)2.(30) = 17.50
Portfolio total risk ( variance) = 40
Portfolio SD = 6.3246
Sharpe ratio = 7.5/6.3246 1.19
A has got highest Sharpe ratio among all the six securities. Portfolio’s Sharpe
ratio is more than even A’s Sharpe ratio.
Q. No. 123Q. No. 123Q. No. 123Q. No. 123:
Security A Security B Market
Alpha 3 -1
Beta 1.10 1.20 ?
Return ? ? 10%
R .40 ?
Residual SD 9% 12% ?
Variance ? ? ?
AnswerAnswerAnswerAnswer
� Beta of Market = 1
� Residual variance of market = 0
� Required return of A = 3 + (1.1 x 10) = 14 %
� Required return of B = -1 + (1.2 x 10) = 11 %

124
� Systematic Risk of A = (1.10)2.(market variance)
=1.21(Market Variance)
0.40[1.21(Market variance) + 0.81] =1.21(Market-Variance)
� 0.484(Market Variance) + 0.324 = 1.21(Market-Variance)
� -0.726(Market Variance) = - 0.324
� Market variance = 0.45%
� Systematic Risk of A = (1.10)2.(0.45) = 0.5445 %
� Unsystematic Risk of A = 0.81%
� Total risk of A =1.3545%
� Systematic Risk of B = (1.20)2.0.45 = 0.648%
� Unsystematic risk of B : 1.44%
� Total risk of B = 2.088
� R of B = 0.648/(0.648 + 1.44) = 0.31
Security A Security B Market
Alpha
Beta 1
Return 14 11
R 0.31
Residual SD 9% 12% 0
Variance 1,3545% 2.088 0.45%
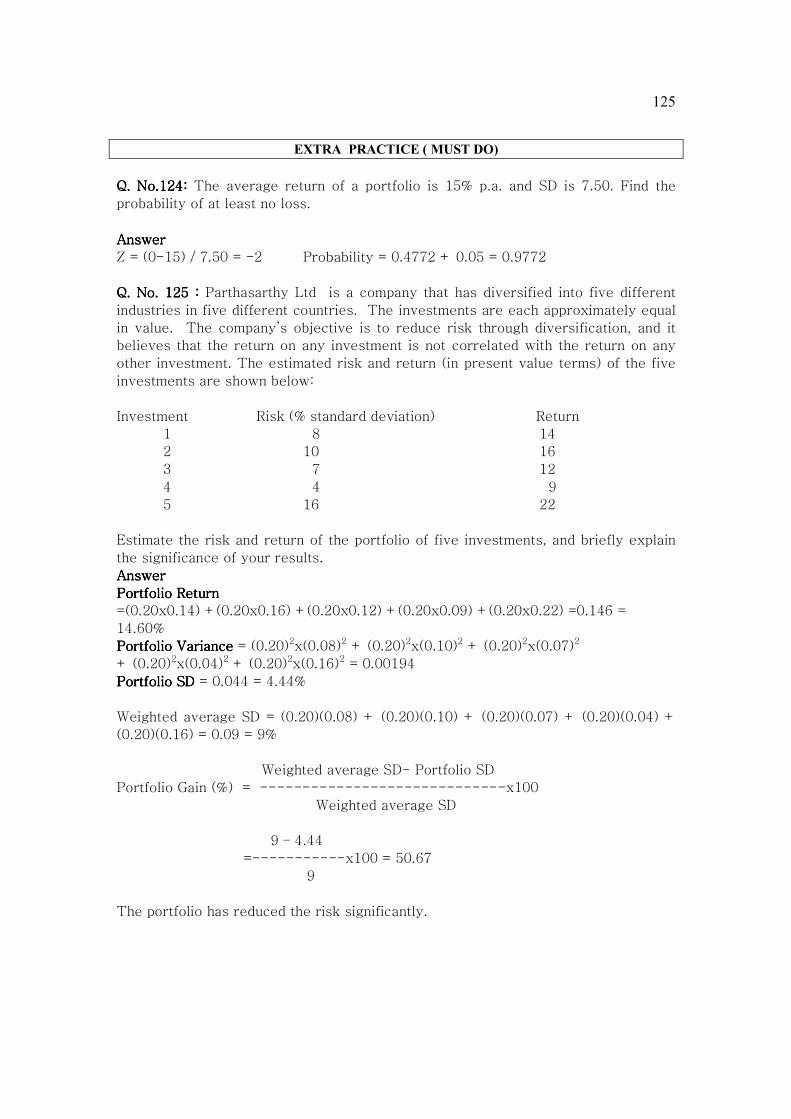
125
EXTRA PRACTICE ( MUST DO)
Q. No.Q. No.Q. No.Q. No.124124124124: : : : The average return of a portfolio is 15% p.a. and SD is 7.50. Find the
probability of at least no loss.
Answer Answer Answer Answer
Z = (0-15) / 7.50 = -2 Probability = 0.4772 + 0.05 = 0.9772
Q. No. Q. No. Q. No. Q. No. 125125125125 : : : : Parthasarthy Ltd is a company that has diversified into five different
industries in five different countries. The investments are each approximately equal
in value. The company’s objective is to reduce risk through diversification, and it
believes that the return on any investment is not correlated with the return on any
other investment. The estimated risk and return (in present value terms) of the five
investments are shown below:
Investment Risk (% standard deviation) Return
1 8 14
2 10 16
3 7 12
4 4 9
5 16 22
Estimate the risk and return of the portfolio of five investments, and briefly explain
the significance of your results.
AnswerAnswerAnswerAnswer
Portfolio Return Portfolio Return Portfolio Return Portfolio Return
=(0.20x0.14) +(0.20x0.16) +(0.20x0.12) +(0.20x0.09) +(0.20x0.22) =0.146 =
14.60%
Portfolio VariancePortfolio VariancePortfolio VariancePortfolio Variance = (0.20)2x(0.08)2 + (0.20)2x(0.10)2 + (0.20)2x(0.07)2
+ (0.20)2x(0.04)2 + (0.20)2x(0.16)2 = 0.00194
Portfolio SDPortfolio SDPortfolio SDPortfolio SD = 0.044 = 4.44%
Weighted average SD = (0.20)(0.08) + (0.20)(0.10) + (0.20)(0.07) + (0.20)(0.04) +
(0.20)(0.16) = 0.09 = 9%
Weighted average SD- Portfolio SD
Portfolio Gain (%) = -----------------------------x100
Weighted average SD
9 – 4.44
=-----------x100 = 50.67
9
The portfolio has reduced the risk significantly.
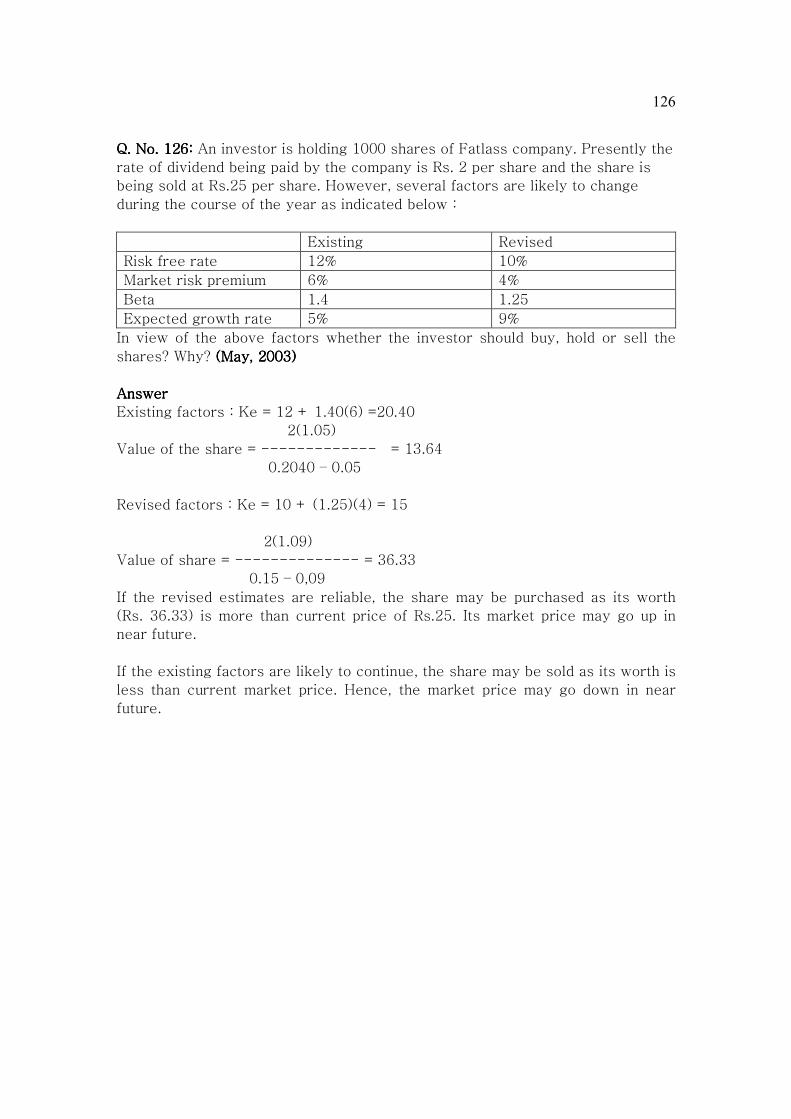
126
Q. No.Q. No.Q. No.Q. No. 126: 126: 126: 126: An investor is holding 1000 shares of Fatlass company. Presently the
rate of dividend being paid by the company is Rs. 2 per share and the share is
being sold at Rs.25 per share. However, several factors are likely to change
during the course of the year as indicated below :
Existing Revised
Risk free rate 12% 10%
Market risk premium 6% 4%
Beta 1.4 1.25
Expected growth rate 5% 9%
In view of the above factors whether the investor should buy, hold or sell the
shares? Why? (May, 2003)(May, 2003)(May, 2003)(May, 2003)
Answer Answer Answer Answer
Existing factors : Ke = 12 + 1.40(6) =20.40
2(1.05)
Value of the share = ------------- = 13.64
0.2040 – 0.05
Revised factors : Ke = 10 + (1.25)(4) = 15
2(1.09)
Value of share = -------------- = 36.33
0.15 – 0,09
If the revised estimates are reliable, the share may be purchased as its worth
(Rs. 36.33) is more than current price of Rs.25. Its market price may go up in
near future.
If the existing factors are likely to continue, the share may be sold as its worth is
less than current market price. Hence, the market price may go down in near
future.

127
EXTRA PRACTICE QUESTIO�S (OPTIO�AL)
Q. No. Q. No. Q. No. Q. No. 127127127127:::: RF = 10%, RM = 20%, Beta of a security = 1.50. Payout ratio = 60%.
Earning per share in the year just ended Rs.10. The company earns a rate of return
of 20% on its retained earnings. Find the equilibrium value of the share. If it is
available in the market at Rs. 20 and it is expected that after 1 year it will be quoted
in the market at 25% above the present equilibrium value, what is return for holding
the share for 1 year?
AnswerAnswerAnswerAnswer
Ke = RF + Beta(RM-RF)
= 10 + 1.50(20-10) = 25%
g = b.r, Where,
g = rate of growth
b = ratio of retained EPS to EPS
r = rate of return on retained earnings
D1 6(1.08)
Equilibrium price of share = P = ------- = --------- = 38.18
Ke - g 0.25 – 0.08
Equilibrium price of the share after 1 year : 38.18(1.25) = 47.65
Return for holding the share for 1 year = [47.65/20) – 1] = 138.24%
Q. No.128Q. No.128Q. No.128Q. No.128: : : : Mr Brijwasi invested Rs.1,00,000 in the equity shares of three companies
– Girdhari Ltd., Banwari Ltd. and Murari Ltd. in the ratio of 4:3:3. Given the following
Variance-covariance Matrix for the three companies, find the portfolio variance :
Equity shares of
Girdhari Ltd.
Equity shares of
Banwari Ltd.
Equity shares of
Murari Ltd.
Equity shares of
Girdhari Ltd.
46 -22 12
Equity shares of
Banwari Ltd.
-22 32 21
Equity shares of
Murari Ltd.
12 21 18
Answer Answer Answer Answer
Portfolio variance = (0.40)2(46)+(0.30)2(32)+(0.30)2(18)+
2(0.40)(0.30)(-22)+
2(0.40)(0.30)(12) +
2(0.30)(0.30)(21) = 13.24

128
Q. No. Q. No. Q. No. Q. No. 129129129129: : : : Hari has his investments in equity shares of four companies :
No. of shares
held
Face
value
Beta Market
price
Exp.
Return
Govind Ltd 10,000 Rs. 5 1.2 Rs. 30 19 %
Mansukha Ltd 20,000 Rs.10 0.80 Rs.50 13 %
Parthsarthy Ltd 30,000 Rs. 2 0.90 Rs.40 14%
Krishna Ltd 40,000 Re. 1 1.50 Rs.10 20%
RF = 5 % RM = 15 %. Find the risk of the portfolio relative to the market risk.
Should the composition of the portfolio changed?
Answer Answer Answer Answer
Investment Proportion
Govind 10000x30 = 3,00,000 3,00,000 / 29,00,000 = 0.1034
Manshukha 20000x50 = 10,00,000 10,00,000 / 29,00,000 = 0.3449
Parthsarthy 30000x40 = 12,00,000 12,00,000 / 29,00,000 =0.4138
Krishna 40000x10 = 4,00,000 4,00,000 / 29,00,000 = 0.1379
Total 29,00,000 1.00
Risk of portfolio relative to market (Beta) =
1.20(0.1034) + 0.80(0.3449) + 0.90(0.4138) + 1.50 (0.1379)= 0.9793
Required return:
Govind 5 + 1.20(15 – 5) 17 %
Manshukha 5 + 0.80 ( 15-5) 13 %
Parthsarthy 5 + 0.90 (15 -5) 14 %
Krishna 5 + 1.50 ( 15 – 5) 20 %
• Mansukha, Parthasarthy and Krishna are neutral securities i.e. the required
return from these securities is equal to Expected (likely) return.
• If the investor cannot afford increased risk, there should be no change in the
portfolio; if the investor is willing to bear increased risk, he should invest all
the funds in Govind.
Q. No. 130Q. No. 130Q. No. 130Q. No. 130: : : : Madhav purchased a share for Rs.100. After 1 year, its value may be
Rs.500 (Probability 0.50) or Rs.100 (Probability 0.30) or 0. Find the expected return
and SD of the investment.
Answer Answer Answer Answer
Wealth ratio Return (X) Probability pX x px2
500/100 =5 400% 0.50 200 220 24200
100/100 =1 0 0.30 0 -180 9720
0/100 = 0 -100% 0.20 -20 -280 15680
180 49600
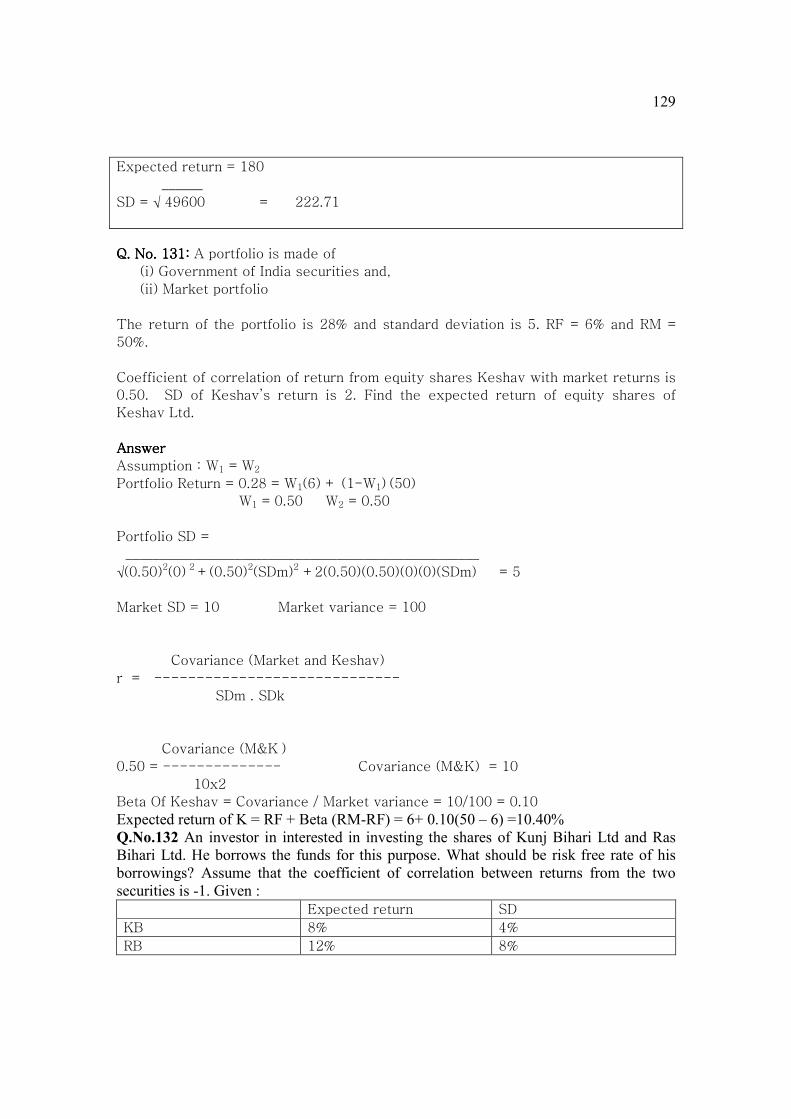
129
Expected return = 180
______
SD = √ 49600 = 222.71
Q. No. Q. No. Q. No. Q. No. 131131131131: : : : A portfolio is made of
(i) Government of India securities and,
(ii) Market portfolio
The return of the portfolio is 28% and standard deviation is 5. RF = 6% and RM =
50%.
Coefficient of correlation of return from equity shares Keshav with market returns is
0.50. SD of Keshav’s return is 2. Find the expected return of equity shares of
Keshav Ltd.
Answer Answer Answer Answer
Assumption : W1 = W2
Portfolio Return = 0.28 = W1(6) + (1-W1) (50)
W1 = 0.50 W2 = 0.50
Portfolio SD =
____________________________________________________
√(0.50)2(0) 2 +(0.50)2(SDm)2 +2(0.50)(0.50)(0)(0)(SDm) = 5
Market SD = 10 Market variance = 100
Covariance (Market and Keshav)
r = -----------------------------
SDm . SDk
Covariance (M&K )
0.50 = -------------- Covariance (M&K) = 10
10x2
Beta Of Keshav = Covariance / Market variance = 10/100 = 0.10
Expected return of K = RF + Beta (RM-RF) = 6+ 0.10(50 – 6) =10.40% Q.�o.132 An investor in interested in investing the shares of Kunj Bihari Ltd and Ras Bihari Ltd. He borrows the funds for this purpose. What should be risk free rate of his borrowings? Assume that the coefficient of correlation between returns from the two securities is -1. Given : Expected return SD
KB 8% 4%
RB 12% 8%

130
AnswerAnswerAnswerAnswer
If we invest in the ratio of 8:4, i.e. 2/3 : 1/3 in KB and RB respectively, we shall have
to bear the minimum risk.
Variance or risk of this portfolio =
(2/3)2(0.04)
2 + (1/3)
2(0.08)
2 + 2(1/3)(2/3)(-1)(0.04)(0.08)
= 0
Return from this portfolio = 8(2/3) + 12(1/3) = 9.33
Risk free rate of return= 9.33%
Q. No. Q. No. Q. No. Q. No. 133133133133:::: The current market price of share is Rs.50. The expected rate of return
is 10%. Expected dividend yield is 6%. What shall be the cum-dividend market price
of the share at the year end? Ex-dividend?
AnswerAnswerAnswerAnswer
Cum-dividend market price at year end = 50(1.10) = 55
Ex-dividend price = 52
Q. No. 134Q. No. 134Q. No. 134Q. No. 134: : : : The current market price of share is Rs.50. The expected rate of return
is 10%. Assuming payout ratio to be zero, what should be the market price of the
share after 4 years from today?
AnswerAnswerAnswerAnswer
Market price after 4 years from today ; 50(1.10)4
= 73.21
Q. No. 135Q. No. 135Q. No. 135Q. No. 135: : : : The current market price of share is 63. The expected rate of return is
10%. Last year the dividend per share was Rs.3. Dividend has been growing at the
rate of 5 per annum and this growth is likely to be maintained. At what price you
shall be able to buy the share after 3 years from today?
Answer Answer Answer Answer
3(1.05)4
Market price after 3 years = ---------- = 72.93
0.10 – 0.05
Q. No.Q. No.Q. No.Q. No. 136136136136: : : : An investor selects two equity shares for investment – A and B. Current
market price of A is Rs.400. The probability distribution of A’s expected price next
year is as follows:
Price Probability
360 0.10
440 0.80
480 0.10

131
Other data:
A B
Correlation with market 0.80 0.20
Expected return Not known 9%
SD Not known 12
Market SD=8. Coefficient of correlation between returns from A&B = 0.63
The investor invests 25% in A and 75% in B. What is his expected return? Calculate
the Variance and Beta of his portfolio. How your answer will change if he invests
25% in A, 60% in B and 15% in C? Assume C is a risk-free security with expected
return of 5%.
Answer Answer Answer Answer
Calculation of expected return and SD of A :
Year end Price Return (X) pX x px2
360 -10% -1 -19 36.10
440 +10% 8 +1 0.80
480 +20% 2 +11 12.1
Total 9 49
Expected return of A = 9 SD of returns from A = 7
Covariance (Market and A)
r = -----------------------------
SDm . SDa
Covariance (M&A )
0.80 = -------------- Covariance (M&A) = 44.80
8x7
Beta of A = Covariance (M&A)/ market variance
= 44.80 /64 = 0.70
Covariance (Market and B)
r = -----------------------------
SDm . SDb
Covariance (M&B)
0.20 = -------------- Covariance (M&B) = 19.20
8x12
Beta of B = Covariance (M&B)/ market variance
= 19.20 /64 = 0.30
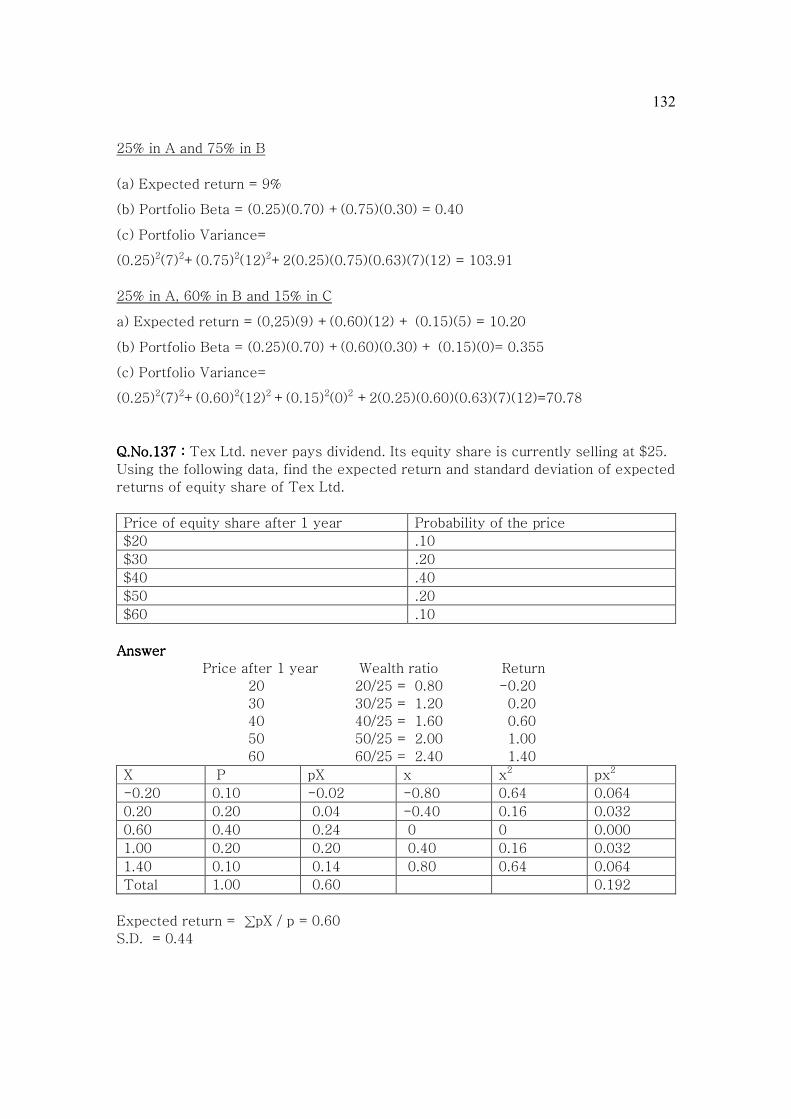
132
25% in A and 75% in B
(a) Expected return = 9%
(b) Portfolio Beta = (0.25)(0.70) +(0.75)(0.30) = 0.40
(c) Portfolio Variance=
(0.25)2(7)2+(0.75)2(12)2+2(0.25)(0.75)(0.63)(7)(12) = 103.91
25% in A, 60% in B and 15% in C
a) Expected return = (0,25)(9) +(0.60)(12) + (0.15)(5) = 10.20
(b) Portfolio Beta = (0.25)(0.70) +(0.60)(0.30) + (0.15)(0)= 0.355
(c) Portfolio Variance=
(0.25)2(7)2+(0.60)2(12)2 +(0.15)2(0)2 +2(0.25)(0.60)(0.63)(7)(12)=70.78
Q.No.Q.No.Q.No.Q.No.137 137 137 137 : : : : Tex Ltd. never pays dividend. Its equity share is currently selling at $25.
Using the following data, find the expected return and standard deviation of expected
returns of equity share of Tex Ltd.
Price of equity share after 1 year Probability of the price
$20 .10
$30 .20
$40 .40
$50 .20
$60 .10
Answer Answer Answer Answer
Price after 1 year Wealth ratio Return
20 20/25 = 0.80 -0.20
30 30/25 = 1.20 0.20
40 40/25 = 1.60 0.60
50 50/25 = 2.00 1.00
60 60/25 = 2.40 1.40
X P pX x x2 px2
-0.20 0.10 -0.02 -0.80 0.64 0.064
0.20 0.20 0.04 -0.40 0.16 0.032
0.60 0.40 0.24 0 0 0.000
1.00 0.20 0.20 0.40 0.16 0.032
1.40 0.10 0.14 0.80 0.64 0.064
Total 1.00 0.60 0.192
Expected return = ∑pX / p = 0.60
S.D. = 0.44

133
Q. No. 138Q. No. 138Q. No. 138Q. No. 138: : : : Madhav purchased a share for Rs.100. After 1 year, its value may be
Rs.500 (Probability 0.50) or Rs.100 (Probability 0.30) or 0. Find the expected return
and SD of the investment.
Answer :Answer :Answer :Answer :
Wealth ratio Return (X) Probability pX x px2
500/100 =5 400% 0.50 200 220 24200
100/100 =1 0 0.30 0 -180 9720
0/100 = 0 -100% 0.20 -20 -280 15680
180 49600
________
Expected return = 180 SD = √ 49600 = 222.71
Q. No. Q. No. Q. No. Q. No. 139139139139: : : : Calculate the total variances for the following stocks.
Asset Beta Residual SD%
Stock A 1.3 50
Stock B 1.8 64
Stock C 0.7 60
Stock D 1.0 55
Market SD(%) = 20.
Answer Answer Answer Answer
Systematic risk of A: Beta of A x Market Standard Deviation
= 1.30 x 20% = 26%
Total Risk of A (SD of A) = 26 + 50 = 76%
Systematic risk of B: Beta of B x Market Standard Deviation
= 1.80 x 20% = 36.00%
Total Risk of B (SD of B) = 36+ 64 = 100%
Systematic risk of C: Beta of C x Market Standard Deviation
= 0.70 x 20% = 14%
Total Risk of C (SD of C) = 14 + 60 = 74%
Systematic risk of D: Beta of D x Market Standard Deviation
= 1.00 x 20% = 20.00%
Total Risk of D (SD of D) = 20+ 55 = 75%
Q. No. Q. No. Q. No. Q. No. 140140140140:::: Risk free rate of return is 8 %. The return from market portfolio is
expected to be 16 %. Inder Ltd. has just paid a dividend of Rs. 3 per share. The
expected growth rate of dividend is 10% p.a. Its equity Beta is 1.50. Using CAPM,
find the required return of equity shareholders. What is the present market price per
equity share (using the required rate of return calculated by you)?

134
Answer :Answer :Answer :Answer : Ke = RF + Beta(RM-RF)
= 8 + 1.5(16-8) = 20 %
D1 3(1.10)
P = ------------ = ------------- = Rs.33
Ke – g 0.20 – 0.10
Q. No. Q. No. Q. No. Q. No. 141141141141:::: Coefficient of correlation between returns from market portfolio and
those from security Zeta is 0.65. SD of Zeta is 0.25 and that of market is 0.20. Find
Beta of Zeta.
Answer :Answer :Answer :Answer :
Covariance
r = ---------------
(SDx)(SDy)
Covariance
0.65 = ------------
0.25x0.20
Covariance = 0.0325
Beta = (covariance / market variance) = (0.0325) / (0.20)2 = 0.8125
Q. No. Q. No. Q. No. Q. No. 142142142142:::: Find the expected return of security X on the basis of following data:
Risk free rate of return 8%, expected return from market portfolio 12%, SD of X
0.50, SD of market 0.40, relevant correlation 0.80.
Answer Answer Answer Answer
Covariance
r = ---------------
(SDx)(SDy)
Covariance
0.80 = ------------
0.50x0.40
Covariance = 0.16
Beta = covariance / market variance = (.16) / (.40)2 =1
Expected return = 8% + 1(12-8) = 12%

135
Q. No. 143Q. No. 143Q. No. 143Q. No. 143:::: Given below is information of market rates of Returns and Data from two
companies
Year 2002 Year 2003 Year 2004
Market (%) 12 11 9
Company A (%) 13 11.5 9.8
Company B (%) 11 10.5 9.5
Determine the Beta coefficients of shares of A and B. (Nov. 2004)(Nov. 2004)(Nov. 2004)(Nov. 2004)
Answer Answer Answer Answer
Calculation of Beta of A Let the return from market = X Let the return from the A Ltd = Y
X x Y y xy x2
12 1.33 13.00 1.5667 2.0837 1.7689
11 0.33 11.50 0.0667 0.0220 0.1089
9 -1.67 9.80 -1.6333 2.7276 2,7889
∑X = 32 ∑Y=34.30 4.8333 ∑x2=4.6667
Mean of X = 10.67 Mean of Y = 11.4333
Covariance = ∑xy/n = 4.8333/3 = 1.6111
Market variance = ∑x2/n = 4.6667/3 = 1.5556
Beta = covariance/Market variance = 1.6111/1.5556 = 1.036
Calculation of Beta of B Let the return from market = X Let the return from the B Ltd = Y
X x Y y xy x2
12 1.33 11.00 0.6667 0.8867 1.7689
11 0.33 10.50 0.1667 0.0550 0.1089
9 -1.67 9.50 -0.8333 1.3916 2,7889
∑X = 32 31 2.3333 ∑x2=4.6667
Mean of X = 10.67 Mean of Y = 10.3333
Covariance = ∑xy/n = 2.3333/3 = 0.7777
Market variance = ∑x2/n = 4.6667/3 = 1.5556
Beta = covariance/Market variance = 0.7777/1.5556 = 0.50
Q. No. Q. No. Q. No. Q. No. 144144144144:::: A company pays a dividend of Rs.2 per share with a growth rate of 7%.
The risk free rate is 9% and the market rate of return is 13%. The company has a
beta factor of 1.50. However, due to a decision of the Finance manager, beta is likely
to increase to 1.75. Find out the present as well as the likely value of the share after
the decision.(May, 2005)(May, 2005)(May, 2005)(May, 2005)
Answer Answer Answer Answer
Interpretation : Dividend of Rs.2 per share has just been paid.
Before the decision of the finance manager:
Ke = RF + Beta(RM-RF) = 9 + 1.50(13-9) =15%

136
D1 2.14
P = ------------- = ----------- = 26.75
Ke – g 0.15 – 0.07
After the decision of the finance manager :
Ke = RF + Beta (RM-RF) = 9 + 1.75(13-9) = 16%
D1 2.14
P = ------------- = ----------- = 23.78
Ke – g 0.16 – 0.07
Alternative solution ;Alternative solution ;Alternative solution ;Alternative solution ;
Interpretation : Dividend of Rs.2 per share is to be paid.
Before the decision of the finance manager:
Ke = RF + Beta(RM-RF) = 9 + 1.50(13-9) =15%
D1 2.00
P = ------------- = ----------- = 25.00
Ke – g 0.15 – 0.07
After the decision of the finance manager :
Ke = RF + Beta (RM-RF) = 9 + 1.75(13-9) = 16%
D1 2.00
P = ------------- = ----------- = 22.22
Ke – g 0.16 – 0.07
Teaching Teaching Teaching Teaching notenotenotenote---- not to be given in the exam. The first answer is preferred because
the question says “company pays” (present tense), it can be interpreted as has
been paid (present tense). In the second answer, we are interpreting as the
company is going to pay (future tense), while the question is talking about present
tense.
Q. No. Q. No. Q. No. Q. No. 145145145145:::: RF is 7%, RM is15%, market SD 0.20, SD of security K = 0.24, r between
returns from security K and those from the market is 0.68. Find the required return
from security K.
Answer Answer Answer Answer
Covariance
r = ---------------
(SDx)(SDy)
Covariance
0.68 = ------------
0.20x0.24
Covariance = 0.03264

137
Beta = (covariance / market variance) = 0.03264 / (0.20)2 = 0.816
Ke = RF + Beta(RM-RF) = 7 + 0.816(15-7) = 13.53
Q. No. Q. No. Q. No. Q. No. 146146146146 :::: The Beta coefficient of Target Ltd is 1.4. The company has been
maintaining 8% rate of growth of dividends and earnings . The last year dividend was
Rs.4.00 per share . Return on government securities is 10%. Return on market
portfolio is 15%. The current market price is Rs. 36. What will be the equilibrium
price per share of target Ltd.? Would you advise purchasing the share? (May, 1997)(May, 1997)(May, 1997)(May, 1997)
Answer :Answer :Answer :Answer :
Ke = RF + Beta (RM-RF) = 10 + 1.40(15-10) = 17%
D1 4.32
P = ------------- = ----------- = 48
Ke – g 0.17 – 0.08
The worth of the share is Rs.48 while it is available in the market at Rs.36.
Purchase of the share is recommended.
Q. No. 14Q. No. 14Q. No. 14Q. No. 147777:::: An investor is seeking the price to pay for a security, whose SD is 3%, r
for the security with market is 0.80. Market SD = 2.2%. RF = 5.20% . RM =9.80%
Find the required return. (May,1998)(May,1998)(May,1998)(May,1998)
Answer : Answer : Answer : Answer :
Covariance
r = ---------------
(SDx)(SDy)
Covariance
0.80 = ------------
0.03x0.022
Covariance = 0.000528
Beta = (covariance / market variance) = 0.000528 / (0.022)2 = 1.0909
Ke = RF + Beta(RM-RF) = 5.20 + 1.0909(9.80-5.20) = 10.22%
Q No. 148Q No. 148Q No. 148Q No. 148: : : : The distribution of return of security F and the market portfolio P is
given below :
Probability Return %
F P
0.30 30 -10
0.4 20 20
0.30 0 30
You are required to calculate the expected return of security F and the market
portfolio P, the covariance between the market portfolio and security and Beta of the
security. (May 2006)(May 2006)(May 2006)(May 2006)
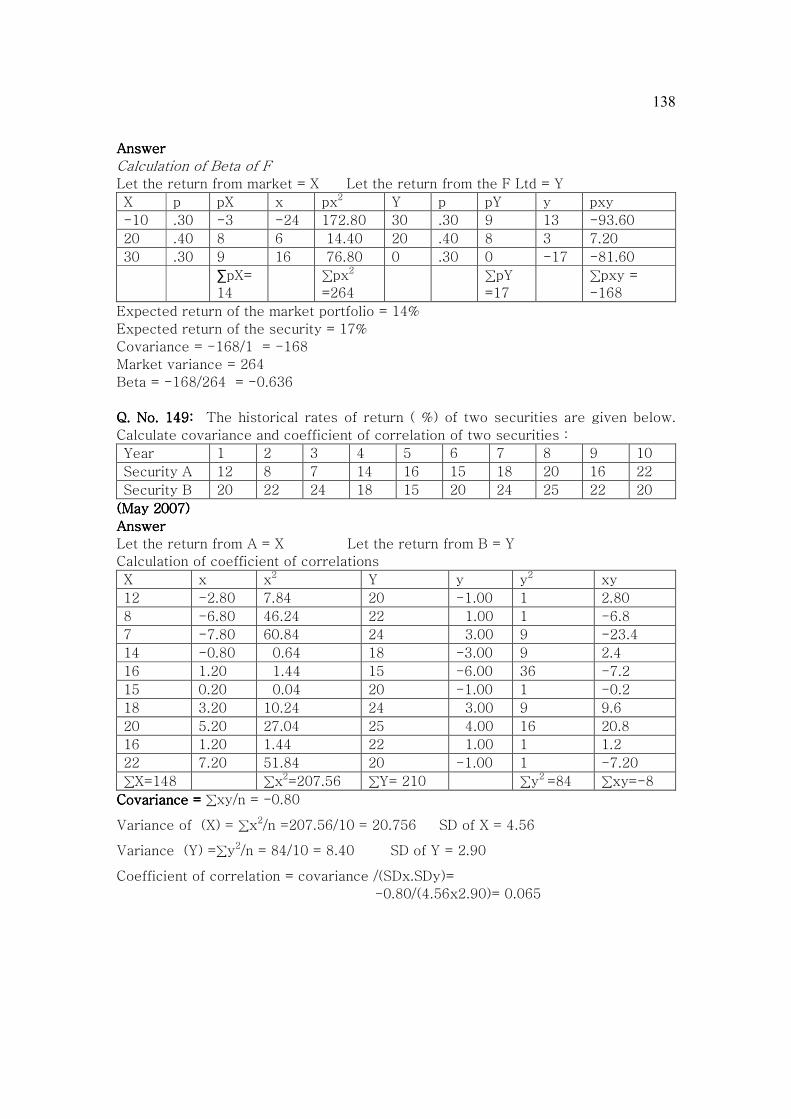
138
Answer Answer Answer Answer
Calculation of Beta of F Let the return from market = X Let the return from the F Ltd = Y
X p pX x px2 Y p pY y pxy
-10 .30 -3 -24 172.80 30 .30 9 13 -93.60
20 .40 8 6 14.40 20 .40 8 3 7.20
30 .30 9 16 76.80 0 .30 0 -17 -81.60
∑pX=
14
∑px2
=264
∑pY
=17
∑pxy =
-168
Expected return of the market portfolio = 14%
Expected return of the security = 17%
Covariance = -168/1 = -168
Market variance = 264
Beta = -168/264 = -0.636
Q. No. 149Q. No. 149Q. No. 149Q. No. 149:::: The historical rates of return ( %) of two securities are given below.
Calculate covariance and coefficient of correlation of two securities :
Year 1 2 3 4 5 6 7 8 9 10
Security A 12 8 7 14 16 15 18 20 16 22
Security B 20 22 24 18 15 20 24 25 22 20
(May 2007)(May 2007)(May 2007)(May 2007)
Answer Answer Answer Answer
Let the return from A = X Let the return from B = Y
Calculation of coefficient of correlations
X x x2 Y y y2 xy
12 -2.80 7.84 20 -1.00 1 2.80
8 -6.80 46.24 22 1.00 1 -6.8
7 -7.80 60.84 24 3.00 9 -23.4
14 -0.80 0.64 18 -3.00 9 2.4
16 1.20 1.44 15 -6.00 36 -7.2
15 0.20 0.04 20 -1.00 1 -0.2
18 3.20 10.24 24 3.00 9 9.6
20 5.20 27.04 25 4.00 16 20.8
16 1.20 1.44 22 1.00 1 1.2
22 7.20 51.84 20 -1.00 1 -7.20
∑X=148 ∑x2=207.56 ∑Y= 210 ∑y2 =84 ∑xy=-8
Covariance = Covariance = Covariance = Covariance = ∑xy/n = -0.80
Variance of (X) = ∑x2/n =207.56/10 = 20.756 SD of X = 4.56
Variance (Y) =∑y2/n = 84/10 = 8.40 SD of Y = 2.90
Coefficient of correlation = covariance /(SDx.SDy)=
-0.80/(4.56x2.90)= 0.065

139
Q.No.Q.No.Q.No.Q.No.150150150150:::: The following are the details of investments of Sachin Ganguly:
Equity shares of following
companies
Amount of investment (Rs) Expected return
A Ltd. Rs.100000 10%
B Ltd Rs.200000 11%
C Ltd. Rs.300000 13%
D Ltd. Rs.400000 14%
E Ltd. Rs.100000 18%
F Ltd. Rs.200000 20%
Find the expected return of Sachin’s portfolio.
Answer Answer Answer Answer
X W XW
10 10/130 0.76923
11 20/130 1.69231 13 30/130 3.00000
14 40/130 4.30769
18 10/130 1.38462
20 20/130 3.07692
Total 1 14.23
Expected return = 14.23/1 =14.23 %
Q.No.Q.No.Q.No.Q.No.151151151151: : : : The equity shares of Devta Ltd. and Shree Ltd. have expected returns of
14% and 18% respectively while the standard deviations are 25 % and 35%. The
correlation coefficient between expected returns from these two securities is 0.42.
Find the expected return and variance of expected returns of a portfolio in which
20% of funds are invested in Devta Ltd. and balance in Shree Ltd.
Answer:Answer:Answer:Answer:
20 % in Devta and 80% in Shree
Portfolio Return = [14x.20] +[18x.80] = 17.20 %
Portfolio Variance :
= (.20)2.(0.25)2 + (.80)2.(0.35)2 + 2(.20)(.80)(.42)(0.25)(0.35)
= 0.3044 = 30.44 %
Q. No. Q. No. Q. No. Q. No. 152152152152: : : : The correlation of coefficient between return from two securities, A and
B, is -1. (i) Using the following information, suggest how an investor should invest
Rs.500000 in these two securities so that risk is minimum.
A B
Expected return 17% 16%
S.D. 20% 30%
(ii) What will be your answer if coefficient correlation is 0.10 instead of -1?

140
Answer :Answer :Answer :Answer :
(i) r = -1 In this case, for minimum risk portfolio, the investment should be
made in the reverse ratio of the SDS i.e. 30:20 i.e. 0.60 : 0.40
Invest Rs.300000 in A & Rs.200000 in B.
(ii)
(SDB)2 – r (SDA)(SDB)
WA = ----------------------------
(SDA) 2 +(SDB)2 -2r(SDA)(SDB)
(30) 2 –(.10)(20)(30)
= -------------------------- (20) 2
+(30) 2 – 2(.10)(20)(30)
= 0.7119. WB = 0.2881
Invest Rs.355950 in A & Rs.144050 in B
Q. No. Q. No. Q. No. Q. No. 153153153153: : : : Find the Beta of portfolio of seven securities owned by Mr.X, details are
as follows:
Security Beta Investment as % of total
funds invested
A 1.50 10%
B 1.60 10%
C 0.90 20%
D 0.80 30%
E 0.70 10%
F 1.05 10%
G 1.25 10%
If risk free rate of return is 7% and expected return of market portfolio is 12%, find
the expected return of the portfolio of Mr X.
Answer:Answer:Answer:Answer:
Portfolio Beta :
(1.50 x 0.10) +(1.60 x 0.10) + ……+(1.25 x 0.10) = 1.03
Expected return of portfolio = 7 + 1.03(12-7) = 12.15 %
Q. No. Q. No. Q. No. Q. No. 154154154154: : : : Find the expected return and standard deviation of a portfolio consisting
of three securities A,B, and C, the details of which are given below. You may
assume that 40% of funds are invested in A and 30% in each of B & C.
Securities Expected return Standard deviation
A 10% .07
B 12% .10
C 15% .20

141
The correlation coefficient between returns of A&B is 0.50.The corresponding
figures for A & C and B & C are 0.70 and 0.40 respectively.
Answer:Answer:Answer:Answer:
Expected return of portfolio = (10x0.40) +(12x0.30) +(15x0.30) = 12.10
Portfolio SD = 9.96%
Q. No. 155Q. No. 155Q. No. 155Q. No. 155:::: SD of market returns is 30%, risk premium on the market portfolio is 10
%, RF is 6 %. Find the expected return and SD of a portfolio in which 0 % in Market
and 100 % in RF, 20 % in market and 80 in RF, 40% in Market and 60 % in RF ……….
100% in market and 0% in RF.
Answer Answer Answer Answer
Market RF Expected return SD of portfolio
0 100 6 0
20 80 .20(16) +0.80(6) = 8.00 .20(30) =6
40 60 .40(16)+0.60(6)= 10.00 .40(30) =12
60 40 .60(16)+0.40(6)= 12.00 .60(30) =18
80 20 .80(16)+0.20(6)= 14.00 .80(30) =24
100 0 16 30
Q. No.Q. No.Q. No.Q. No.156156156156:::: Your client is holding the following securities;
Cost (Rs.) Dividend(Rs.) Market price (Rs.) Beta
Equity shares
Co.X
Co.Y
Co.Z
8000 800 8200 0.80
10000 800 10500 0.70
16000 800 22000 0.50
PSU Bonds 34000 3400 32300 1.00
Risk Free rate of return : 15%.
Calculate (a) Expected rate of return in each, using the CAPM.
(b) Average return of the portfolio. (May, 2003)(May, 2003)(May, 2003)(May, 2003)
AnswerAnswerAnswerAnswer : Assumption: There are only these four securities available in the market.
9000+11300+22800+35700
RM = ---------------------------- -1 =.1588
8000+10000+16000+34000
= 15.88%
Security Expected return
X 15+ 0.80(15.88 -15) = 15.704
Y 15+ 0.70(15.88 -15) = 15.616
Z 15+ 0.50(15.88 -15) = 15.440
PSU Bonds 15+ 1.00(15.88-15) = 15.880
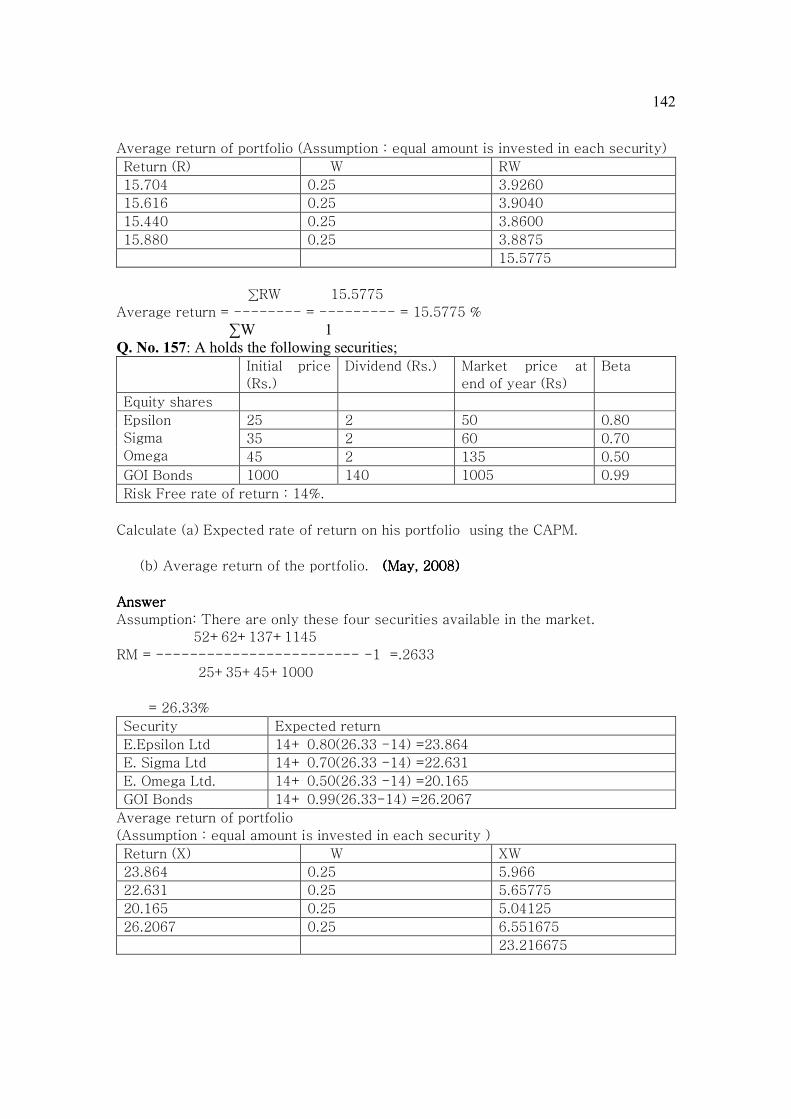
142
Average return of portfolio (Assumption : equal amount is invested in each security)
Return (R) W RW
15.704 0.25 3.9260
15.616 0.25 3.9040
15.440 0.25 3.8600
15.880 0.25 3.8875
15.5775
∑RW 15.5775
Average return = -------- = --------- = 15.5775 %
∑W 1 Q. �o. 157: A holds the following securities; Initial price
(Rs.)
Dividend (Rs.) Market price at
end of year (Rs)
Beta
Equity shares
Epsilon
Sigma
Omega
25 2 50 0.80
35 2 60 0.70
45 2 135 0.50
GOI Bonds 1000 140 1005 0.99
Risk Free rate of return : 14%.
Calculate (a) Expected rate of return on his portfolio using the CAPM.
(b) Average return of the portfolio. (May, 2008)(May, 2008)(May, 2008)(May, 2008)
AnswerAnswerAnswerAnswer
Assumption: There are only these four securities available in the market.
52+62+137+1145
RM = ------------------------ -1 =.2633
25+35+45+1000
= 26.33%
Security Expected return
E.Epsilon Ltd 14+ 0.80(26.33 -14) =23.864
E. Sigma Ltd 14+ 0.70(26.33 -14) =22.631
E. Omega Ltd. 14+ 0.50(26.33 -14) =20.165
GOI Bonds 14+ 0.99(26.33-14) =26.2067
Average return of portfolio
(Assumption : equal amount is invested in each security )
Return (X) W XW
23.864 0.25 5.966
22.631 0.25 5.65775
20.165 0.25 5.04125
26.2067 0.25 6.551675
23.216675

143
∑XW 23.216675
Average return = -------- = --------- = 23.22 %
∑W 1
Q.Q.Q.Q. No.No.No.No. 158158158158:::: Following is the data regarding six securities :
A B C D E F
Return 8 8 12 4 9 8
Risk 4 5 12 4 5 6
(i) Assuming three will have to be selected, state which ones will be picked
(ii) Assuming perfect correlation, show whether it is preferable to invest 75%
in A and 25% in C or to invest 100% in E. (Nov. 2002)(Nov. 2002)(Nov. 2002)(Nov. 2002)
Answer (i)Answer (i)Answer (i)Answer (i)
SET A:SET A:SET A:SET A:
(a) A, B and F have same return but A’s SD is least. Hence, B and F are rejected.
(b) Now we are left with A, C, D and E. A and D have same SD but D’s return is
lower. Hence D is rejected. We are left with A, C and E.
SET B: SET B: SET B: SET B:
Security Coefficient of variation
A (4/8) x 100 = 50%
C (12/12) x 100 = 100%
E (5/9) x 100 = 55.56%
The securities may be selected in the following order:
(ii) A (ii) E (iii) C
Answer (ii)Answer (ii)Answer (ii)Answer (ii)
Portfolio return = 9% SD = 6%
The investment may not be made in this portfolio as a better investment opportunity
(investment in E) is available.
Q . No.Q . No.Q . No.Q . No. 159159159159 Following is the data regarding six securities :
U V W X Y Z
Return 10 10 15 5 11 10
Risk 5 6 13 5 6 7
(i) Which three will be selected ?
(ii) Assuming perfect correlation, show whether it is preferable to invest 80%
in U and 20% in W or to invest 100% in Y. (May. 2004)(May. 2004)(May. 2004)(May. 2004)

144
Answer (i)Answer (i)Answer (i)Answer (i)
SET A:SET A:SET A:SET A:
(a) U, V and Z have same return but U’s SD is least. Hence, V and Z are rejected.
(b) Now we are left with U, W, X and Y. U and X have same SD but X’s return is
lower. Hence X is rejected. We are left with U, W and Y. These three securities may
be selected.
Answer (ii)Answer (ii)Answer (ii)Answer (ii)
Portfolio return =11% SD = 6.60%
The investment may not be made in this portfolio as a better investment opportunity
(investment in Y) is available.
Q. No.Q. No.Q. No.Q. No.160160160160:::: The results of four securities for a 5-years period are as follows: (RF
8%, RM 14%)
Securities Average Return (%) Beta
A 13 0.80
B 14 1.05
C 17 1.25
D 13 0.90
Which securities are overvalued? Undervalued?
Answer Answer Answer Answer
AVERAGE RETURN IS LIKELY RETURN
SECURITY LIKELY RETURN EXPECTED RETURN COMMENT
A 13% 8+0.80(14-8) =12.8 UNDERVALUED
B 14% 8+1.05(14-8)=14.30 OVERVALUED
C 17% 8+1.25(14-8)=15.50 UNDERVALUED
D 13% 8+0.90(14-8)=13.40 OVERVALUED
Q. No. Q. No. Q. No. Q. No. 161161161161: : : : Mr Dravid invested 75% of his funds in security E and 25% in F, both
securities have a Beta of 1.40. SD of market portfolio is 25%. Risk premium of
market portfolio is 10%. Find expected risk premium from the portfolio of E and F.
Answer : Answer : Answer : Answer : Weighted average Beta of portfolio = 1.40
Expected risk premium of portfolio = 1.40 x 10 = 14%
Q. No. 1Q. No. 1Q. No. 1Q. No. 162626262:::: XYZ Ltd has cash flow and until the surplus funds are utilized to meet the
future capital expenditure, likely to happen after several months, are invested in a
portfolio of short-term equity investments, details for which are given below:
Investment No. of
shares
Beta Market price per
share (Rs.)
Expected dividend
yield (%)
I 60,000 1.16 4.29 19.50
II 80,000 2.28 2.92 24.00
III 1,00,000 0.90 2.17 17.50
IV 1.25,000 1.50 3.14 26.00

145
The current market return is 19% and risk free rate is 11%. Required to :
(i) calculate the risk of XYZ’s short term investment portfolio relative to that
of the market
(ii) whether XYZ should change the composition of its portfolio. (Nov.’07)(Nov.’07)(Nov.’07)(Nov.’07)
Answer Answer Answer Answer
Assumption: Ex-dividend market price per share at the time of purchase of the
shares = Expected ex-dividend market price at the time of expiry of the time horizon
for which the investment is made.
Working note :
Investment Amount of investment Proportion of
investment
I 60,000x4.29 =2,57,400 0.2339
II 80,000x2.92 =2,33,600 0.2123
III 1,00,000x2.17 =2,17,000 0.1972
IV 1,25,000x3.14 =3,92,500 0.3566
Total 11,00,500 1.00
(i(i(i(i) Risk of portfolio: Portfolio Beta
1.16(0,2339) + 2.28(0.2123) +(0.90)(0.1972) + 1.50(0.3566) = 1.47
The portfolio is 1.47 times riskier than the market portfolio.
(ii)(ii)(ii)(ii) Expected return
a. : 11 + 1.16(8) = 20.28
b. : 11 + 2.28(8) = 29.24
c. : 11 + 0.90(8) = 18.
d. : 11 + 1.50(8) = 23.00
e.
Investment Expected return
(risk based)
Expected return
(Likely)
Comment
I 20.28 19.50 Overvalued
II 29.24 24.00 Overvalued
III 28.20 17.50 Overvalued
IV 23.00 26.00 Undervalued
The composition of the investment may be changed. Securities I, II and III should be
replaced with some other good investments (including IV).

146
Q. No.Q. No.Q. No.Q. No.163163163163: : : : A company has a choice of investments between several different equity
oriented mutual funds. The company has an amount of Rs.1 Crore to invest. The
details of the mutual funds are as follows:
Mutual fund Beta
A 1.60
B 1.00
C 0.90
D 2.00
E 0.60
Required;
(i)(i)(i)(i) If the company invests 20% of its investment in the first two mutual funds
and an equal amount in the mutual funds C, D and E, what is the Beta of
the portfolio?
(ii)(ii)(ii)(ii) If the company invests 15% of its investment in C, 15% in A, 10% in E and
the balance in equal amount in the other two mutual funds, what is the
Beta of the portfolio?
(iii) If the expected return of the market portfolio is 12% at a Beta factor of 1,
what will be the portfolios’ expected return in both the situations given
above. (May, 2008)(May, 2008)(May, 2008)(May, 2008)
Answer Answer Answer Answer
(i) (i) (i) (i) Assumption: the company invests 10% in each of A and B mutual funds.
Portfolio Beta = (0.10)(1.60 + 1.00) + (0.80/3)(0.90+2.00++0.60) =1.1933
(ii) (ii) (ii) (ii) Portfolio Beta :
0.15(1.60+0.90) + 0.30(1.00+2.00) +0.10(0.60) = 1.335
(iii)(iii)(iii)(iii) Assumption : RF = 10%
I case : I case : I case : I case : Expected return = 10 + 1.1933 (2) = 12.39%
II case : II case : II case : II case : Expected return = 10 + 1.335 (2) = 12.27%
Q. No.164Q. No.164Q. No.164Q. No.164 Consider the following information on two stock, A and B :
Year Return on A (%) Return on B (%)
2006 10 12
2007 16 18
You are required to determine:
(i) The expected return on a portfolio containing A and B in the
proportion of 40% and 60%

147
(ii) The SD of return from each of the two stocks
(iii) The covariance of returns from the two stocks
(iv) Correlation coefficient between the returns of the two stocks
(v)(v)(v)(v) The risk of a portfolio containing A and B in the proportion of 40% and
60%. ( Nov. 2008 SFM) ( Nov. 2008 SFM) ( Nov. 2008 SFM) ( Nov. 2008 SFM)
AnswerAnswerAnswerAnswer : (i) Expected return of A = (10+16) / 2 = 13%
Expected return of B = (12+18) / 2 = 15%
Expected return of Portfolio = 13 x 0.40 + 15 x 0.60 = 14.20%
(ii) Calculation of SD of A :
X x x2
10 -3 9
16 +3 9
∑x2 =18
SD of A = √(18/2) = 3
Calculation of SD of B :
Y y y2
12 -3 9
18 +3 9
∑x2 =18
SD of B = √(18/2) = 3
(iii) Covariance of Returns from two stocks
XXXX x Y y xy
10 -3 12 -3 9
16 +3 18 +3 9
∑x =0 ∑y = 0 ∑xy =18
Covariance = ∑xy / n = 18/2 = 9
(i) Coefficient of Correlation = Covariance / (SDA x SDB)
= 9 / (3 x 3) = 1
(ii) Portfolio Risk =
___________________________________________________
√(W1)2....(SD1)
2 +(W2)2.... (SD2)
2 + 2(W1)(W2)(r12)(SD1)(SD2)

148
________________________________________________
= √(0.40)2.... (3)2 +(0.60)2.... (3)2 + 2(0.40)(0.60)(1)(3)(3) = 3
Q. No.1Q. No.1Q. No.1Q. No.165 65 65 65 An investor holds two stock A and B. AN analyst prepared ex-ante19
probability distribution for the possible economic scenarios and conditional
returns for the two stocks and the market Index as follows:
Economic scenario Probability Conditional returns%
A B Market
Growth 0.40 25 20 18
Stagnation 0.30 10 15 13
Recession 0.30 -5 -8 -3
The risk free rate during the next year is expected to be 11%. Determine
whether the investor should liquidate his holdings in A & B or on the contrary
make fresh investment in them. CAPM assumptions are holding true. (NOV. 2009 (NOV. 2009 (NOV. 2009 (NOV. 2009
SFM )SFM )SFM )SFM )
Answer:Answer:Answer:Answer:
Expected return of A : 25 x 0.40 + 10 x 0.30 -5 x 0.30 = 11.50%
Expected return of B : 20 x 0.40 + 15 x 0.30 -8 x 0.30 = 10.10%
Expected return market : 18 x 0.40 + 13 x 0.30 -3 x 0.30 = 10.20%
Calculation of Market variance : ( Let the market return = Z)
Returns (Z) z p Pz2
18 7.80 0.40 24.336
13 2.80 0.30 2.352
-3 -13.20 0.30 52.272
∑ pz2 = 78.96
Market variance = 78.96
Covariance between A and market : ( Let the return from A = X)
x z p pxz
13.50 7.80 0.40 42.12
-1.50 2.80 0.30 -1.26
19 The term exexexex----aaaantententente is a Latin word meaning "before the event". Ex-ante
is used most commonly in the commercial world, where results of a
particular action, or series of actions, are forecast in advance.

149
-16.50 -13.20 0.30 65.34
∑pxz = 106.20
Covariance between A and market = 106.20
Covariance between B and market : ( Let the return from B = Y)
y z p pyz
9.90 7.80 0.40 30.888
4.90 2.80 0.30 4.116
-18.10 -13.20 0.30 71.676
∑pyz = 106.68
Covariance between B and market = 106.68
Beta = Covariance between security and market / market variance
Beta of A = 106.20/78.96 = 1.345
Beta of B = 106.68/78.96 = 1.351
Expected return : RF + Beta (RM-RF)
Expected return of A = 11 + 1.345(10.20-11) = 9.924%
Expected return of B = 11 + 1.351(10.20-11) = 9.920%
As the actual returns of both the securities are higher than their expected
returns, both the securities are undervalued i.e. more amount of investment
should be made in these securities.
Q. No.166 Q. No.166 Q. No.166 Q. No.166 The returns on stock A and market portfolio for a period of 6 years
are as follows:
Year Return on A (%) Return on market portfolio (%)
1 12 8
2 15 12
3 11 11
4 2 -4
5 10 9.5
6 -12 -2
You are required to determine:
(i) Characteristic line for stock A
(ii) The systematic and unsystematic risk of stock A. (8 Marks)(June 2009)June 2009)June 2009)June 2009)

150
AnswerAnswerAnswerAnswer
(i) Calculation of Beta and SD of A
Return
on A %
(X)
Return on
market
Portfolio (Y)
x y x2 y2 xy
12 8 5.67 2.25 32.15 5.0625 12.7575
15 12 8.67 6.25 75.17 39.0625 54.1875
11 11 4.67 5.25 21.81 27.5625 24.5175
2 -4 -4.33 -9.75 18.75 95.0625 42.2175
10 9.50 3.67 3.75 13.47 14.0625 13.7625
-12 -2 -18.33 -7.75 335.99 60.0625 142.0575
∑X = 38 ∑Y = 34.50 ∑x2 =
497.34
∑y2 =
240.875
∑xy =
89.50 2
Mean return of A = 38/6 = 6.33 Mean Return of market: 34.50/6 = 5.75
Variance of A = 497.34 / 6 = 82.89
Variance of Market = 240.875 / 6 = 40.15
Covariance = 289.50 / 6 = 48.25
Beta = 48.45 / 40.15 = 1.21
Alpha = mean return of security – Beta x RM
= 6.33 – 1.21 x 5.75 = - 0.6275
Characteristic Line = Alpha + Beta x RM
= - 0.6275 + 1.21 x RM
(ii) Total risk of A = 82.89
Systematic risk of A = Beta2 x market variance = 58.78
Unsystematic risk of A = Total risk of A – systematic risk of A
= 82.89 – 58.78 = 24.11
Q. No.167 Q. No.167 Q. No.167 Q. No.167 A stock costing Rs.120 pays no dividend. The possible prices of the
stock at the end of the year are given below with respective probabilities:
Price 115 120 125 130 135 140
Probability 0.10 0.10 0.20 0.30 0.20 0.10
Calculate the expected return. Calculate the SD of the returns.

151
AnswerAnswerAnswerAnswer
Price Wealth
ratio
Return
(%) (X)
p pX x px2
115 115/120
= 0.9583
- 4.17 0.1 -0.42 11.25 12.66
120 120 /120
= 1
0 0.1 0 - 7.08 5.02
125 125/120
= 1.0417
4.17 0.2 0.83 -2.91 1.69
130 130/120
= 1.0833
8.333 0.3 2.50 1.253 0.47
135 135/120
= 1.125
12.50 0.2 2.50 5.42 5.88
140 140/120
= 1.1666
16.67 0.1 1.67 9.59 9.20
∑pX =
7.08
∑ px2 =
34.92
Expected return = ∑pX/∑p = 7.08/1 = 7.08
Standard Deviation =√( ∑ px2 /∑p ) =√( ∑ 34.92 / 1 ) = 5.91
Q. No.Q. No.Q. No.Q. No.168168168168 ABC Ltd has been maintaining a growth rate of 10% in dividends. The
company has paid dividend of Rs.3 per share. The rate of return on market
portfolio is 12% and the risk free rate of return in the market has been observed
as 8%. The Beta co-efficient of the company’s share is 1.5.You are required to
calculate the expected rate of return on the company’s share as per CAPM model
and equilibrium price per share by dividend growth model.(Nov.2008)(Nov.2008)(Nov.2008)(Nov.2008) Answer :Answer :Answer :Answer :
Ke = Expected rate of return on equity share = RF + Beta(RM - RF)
= 8 + 1.50(12-8) = 14%
3(1.10)
Equilibrium price per share = -------------- = 82.50
0.14 – 0.10

152
Q. No.169 Q. No.169 Q. No.169 Q. No.169 Mr A is interested to invest Rs.1,00,000 in the securities market. He
selected two securities B and D for this purpose. The risk return profile of these
securities are as follows:
Secuirty Risk (SD) Expected Return
B 10% 12%
D 18% 20%
The co-efficient of correlation between B and D is 0.15.
You are required to calculate the portfolio risk and portfolio return of the
following portfolios of B and D to be considered by A for his investment:
(i) 100% investment in B only
(ii) 50% of the funds invested in B and D both
(iii) 75% of the fund in B and rest 25% in D
(iv) 25% of the fund I n B and rest 75% in D
(v) 100% investment in D only
Also indicate that which portfolio is the best for him from risk as well return
point of view? ((((Nov. 2008Nov. 2008Nov. 2008Nov. 2008))))
AnswerAnswerAnswerAnswer
(i) 100% investment in B only
Return : 12% Risk = 10
(ii) 50% of the funds invested in B and D both
Return = 12(0.50) + 20 ( 0.50) = 16
Portfolio variance = (WB.SDB)2 + (WD.SDD)
2 + 2WB.WD.rBD.SDB.SDD
=(0.50x0.10)2+(0.50x0.18)2+ 2x0.50x0.50x0.15x0.10xx0.18
= 0.01194
Portfolio (Risk) : SD = 0.10.93 = 10.93%
(iii) 75% of the funds invested in B and 25% in D
Return = 12(0.75) + 20 ( 0.25) = 14
Portfolio variance = (WB.SDB)2 + (WD.SDD)
2 + 2WB.WD.rBD.SDB.SDD
=(0.75x0.10)2+(0.25x0.18)2+ 2x0.75x0.25x0.15x0.10xx0.18
= 0.00866
Portfolio (Risk) : SD = 0.09307 = 9.307%

153
(iv) 25% of the funds invested in B and 75% in D
Return = 12(0.25) + 20 ( 0.75) = 18
Portfolio variance = (WB.SDB)2 + (WD.SDD)
2 + 2WB.WD.rBD.SDB.SDD
= (0.25x0.10)2+(0.75x0.18)2+ 2x0.25x0.75x0.15x0.10xx0.18
= 0.01986
Portfolio (Risk) : SD = 0.1409 = 14.09%
(v) 100% investment in D only : Return : 20% Risk = 18
Q. No.170 Q. No.170 Q. No.170 Q. No.170 A firm paid a dividend of Rs.2 last year.. The estimated growth rate of
the dividend is 5%.Determine the estimated market price of the share if the
estimated growth rate (i) rises to 8% and (ii0 falls to 3%. Also find the present
price of the share assuming Ke = 15.50% ((((NOV. 2009 NOV. 2009 NOV. 2009 NOV. 2009 SFM)SFM)SFM)SFM)
AnswerAnswerAnswerAnswer
Market price of share :
D1
P = -——–
Ke – g
Current market price = 2(1.05) /( 0.155-0.05) = 20
Market price if growth rate is 8% = 2(1.08) /( 0.155-0.08) = 28.80
Market price if growth rate is 3% = 2(1.03) /( 0.155-0.03) = 16.48
154
THEORETICAL ASPECTSTHEORETICAL ASPECTSTHEORETICAL ASPECTSTHEORETICAL ASPECTS
Q. No. Q. No. Q. No. Q. No. 171717171111 : : : : Write a short note on systematic and unsystematic risk in connection
with the portfolio investment. (May, 1999)(May, 1999)(May, 1999)(May, 1999)
Distinguish between Systematic and Unsystematic risk. (Nov. 2004). (Nov. 2004). (Nov. 2004). (Nov. 2004)
Discuss various kinds of systematic and unsystematic risks. (Nov. 2006)(Nov. 2006)(Nov. 2006)(Nov. 2006)
Answer :Answer :Answer :Answer : Unsystematic Risk Unsystematic Risk Unsystematic Risk Unsystematic Risk
It is also known as micro level risk. It is concerned with the company or industry.
Strike, wrong decisions by the management, change in management, increase in input
costs (without increase in sale price), change in government policy regarding
particular type of companies or products, emerging of substitutes of the company's
product(s), cancellation of export order, key-person leaving the company, fire,
embezzlement by employees, unexpected tax demand, major problem in the plant,
etc. The incidence of such risks can be reduced through effective portfolio
selections. The two serious unsystematic risks are:
(i) Business risk: Business risk is the possibility of adverse change in EBIT.
Examples are: Reduction in demand for company’s products, increase in
costs of inputs, change in import-export policy concerning the company,
Labour strike, some key-person’s leaving the company, cancellation of
large sized export order etc.
(ii) Financial risk: It is the possibility of bankruptcy. It arises because of
dependence on borrowed funds and that to it high interest rates.
(iii) Default risk: The major customer of the company may go bankrupt.
Systematic RiskSystematic RiskSystematic RiskSystematic Risk
It is known as macro level risk. It is concerned with the economy as a whole. The
factors causing this type of risk affect all the investments in a similar fashion (and
not in a similar degree). Examples are : failure of monsoon, change in government,
change in credit policy, recession, war, change in tax policy, etc. Every portfolio has
to bear this risk. The two most serious systematic risks are :
(i) Interest rate risk : increase in interest rates generally have adverse effects
on the financial position and earnings of the companies.
(ii) Inflation risk : inflation disturbs business plans of the most of the
organizations. Input costs m ay go up, all the increase in input costs may not
been passed to the customers.
(iii) Political risk : This risk involves (a) change in government policies and
political instability.
Q. No. Q. No. Q. No. Q. No. 171717172222: “ : “ : “ : “ Higher the return, higher will be the risk”. In this context discuss the
various risks associated with portfolio planning. ( Nov. 1996). ( Nov. 1996). ( Nov. 1996). ( Nov. 1996)

155
Answer : First deserve and then desire is Answer : First deserve and then desire is Answer : First deserve and then desire is Answer : First deserve and then desire is an old maxim.an old maxim.an old maxim.an old maxim. The wisdom of this maxim is
that higher return should be expected only by those who are willing to bear higher
risk. If an investor is not willing to go for higher risk, he should invest in risk-free
securities (say, for example Government securities) and naturally he should not
expect the higher return. There are two parts of return from investment (i) Risk-free
return, and (ii) risk premium. It is the risk premium that enhances the return from the
investment. Risk premium is a function of risk. Risk premium changes in direct
proportion of risk (return does not change in direct proportion of risk). Hence, higher
return should be expected only by those who bear higher degree of risk.
The statement that Higher the return, higher will be risk needs to be amended. The
word will should be substituted by the word may. Higher risk may result in one of the
following three mutually exclusive cases : (i) Higher return, (ii) Lower return, (iii)
Negative return. Taking higher return is no guarantee of higher return. Everyone
wants higher return; if taking higher risk is guarantee of higher return, no one will go
for lower risk.
Higher risk may not result in higher return because of the following risks associated
with the investments:
Unsystematic Risk Unsystematic Risk Unsystematic Risk Unsystematic Risk : : : : Refer to answer to Question 1Refer to answer to Question 1Refer to answer to Question 1Refer to answer to Question 1
Systematic RiskSystematic RiskSystematic RiskSystematic Risk :::: Refer to answer to Question 1Refer to answer to Question 1Refer to answer to Question 1Refer to answer to Question 1
Q.No.Q.No.Q.No.Q.No.171717173333:::: Briefly explain Capital asset Pricing Model. (Nov 1997; May 2003)(Nov 1997; May 2003)(Nov 1997; May 2003)(Nov 1997; May 2003)
(Nov. 2009) (Nov. 2009) (Nov. 2009) (Nov. 2009) Assumptions of CAPM. (May, 2006)(May, 2006)(May, 2006)(May, 2006) (N0v. 2008)(N0v. 2008)(N0v. 2008)(N0v. 2008)
Answer: Answer: Answer: Answer:
For appreciating the CAPM, we have to understand different types of risks on the
investments.
The required rate of return on the investments depends on the riskiness of the
investments. Lesser the risk, lesser the required rate of return and vice-versa. The
risks on the investments can be decomposed in two parts:
(i) Systematic Risk
(ii) Unsystematic risk
Systematic risk refers to variability in return on investment due to market factors
that affect all investments in a similar fashion.
Theme of the CAPM is that the investors need to be compensated for (i) Time value
of money and (ii) Risk they have taken.
The required rate of return can be divided in two parts:
(i) Compensation for time value of money. It is represented by Risk free rate of
return
(ii) Compensation for taking the risk i.e. Risk premium.
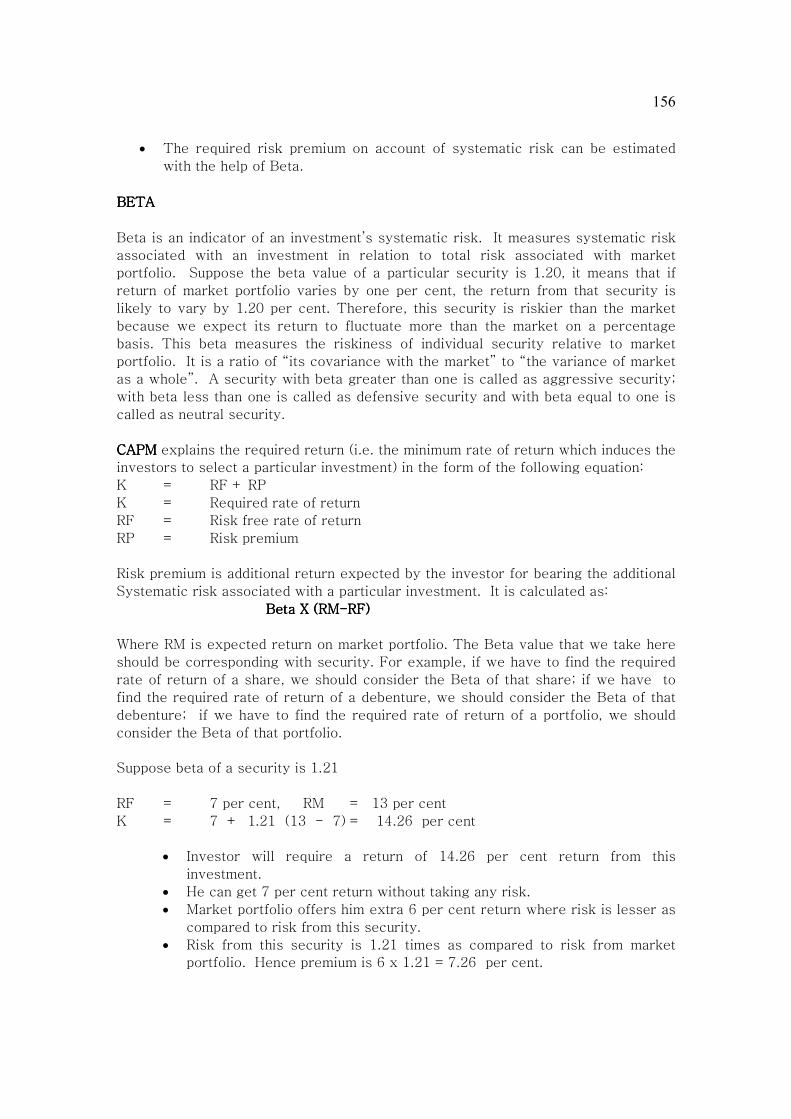
156
• The required risk premium on account of systematic risk can be estimated
with the help of Beta.
BETABETABETABETA
Beta is an indicator of an investment’s systematic risk. It measures systematic risk
associated with an investment in relation to total risk associated with market
portfolio. Suppose the beta value of a particular security is 1.20, it means that if
return of market portfolio varies by one per cent, the return from that security is
likely to vary by 1.20 per cent. Therefore, this security is riskier than the market
because we expect its return to fluctuate more than the market on a percentage
basis. This beta measures the riskiness of individual security relative to market
portfolio. It is a ratio of “its covariance with the market” to “the variance of market
as a whole”. A security with beta greater than one is called as aggressive security;
with beta less than one is called as defensive security and with beta equal to one is
called as neutral security.
CAPMCAPMCAPMCAPM explains the required return (i.e. the minimum rate of return which induces the
investors to select a particular investment) in the form of the following equation:
K = RF + RP
K = Required rate of return
RF = Risk free rate of return
RP = Risk premium
Risk premium is additional return expected by the investor for bearing the additional
Systematic risk associated with a particular investment. It is calculated as:
Beta X (RMBeta X (RMBeta X (RMBeta X (RM----RF)RF)RF)RF)
Where RM is expected return on market portfolio. The Beta value that we take here
should be corresponding with security. For example, if we have to find the required
rate of return of a share, we should consider the Beta of that share; if we have to
find the required rate of return of a debenture, we should consider the Beta of that
debenture; if we have to find the required rate of return of a portfolio, we should
consider the Beta of that portfolio.
Suppose beta of a security is 1.21
RF = 7 per cent, RM = 13 per cent
K = 7 + 1.21 (13 - 7) = 14.26 per cent
• Investor will require a return of 14.26 per cent return from this
investment.
• He can get 7 per cent return without taking any risk.
• Market portfolio offers him extra 6 per cent return where risk is lesser as
compared to risk from this security.
• Risk from this security is 1.21 times as compared to risk from market
portfolio. Hence premium is 6 x 1.21 = 7.26 per cent.

157
• Thus required rate of return is equal to risk free return + risk premium.
The attraction of the CAPM is its powerfully simple logic and intuitively pleasing
predictions about how to measure risk and about the relation between expected
return and risk.
CAPM is based on the following assumptions :
• There are no taxes or transaction costs.
• Investors always desire more return to less, and they are risk averse;
• All investors have identical investment time horizons.
• All investors have identical opinions about expected returns and volatilities
• There are no restrictions on the borrowing and lending of money at the risk-
free rate of interest.
• All investments are traded in the market, the assets are infinitely devisable,
and there are no restrictions on short selling.
• The market is perfectly efficient. That is, every investor receives and
understands the same information and processes it accurately
• All investors have expectations. They know that higher returns can be earned
only by taking enhanced risk. They are rational and know their risk tolerance
capacity.
• There are no arbitrage opportunities.
• Returns are distributed normally.
• No inflation and no change in the level of interest rate exist.
QQQQ. No. . No. . No. . No. 1741741741744444: : : : Explain briefly the two basic principles of effective portfolio
management. (May 1996; Nov. 1999). (May 1996; Nov. 1999). (May 1996; Nov. 1999). (May 1996; Nov. 1999)
Answer : Answer : Answer : Answer :
The two basic principles of effective portfolio management are :
(i) Invest on the basis of fundamentals of the security.
(ii) Review and update the portfolio regularly.
The object of the portfolio management is to provide maximum return on the
investments by taking only optimum risk. To achieve these objectives, the portfolio
manager should invest in diversified securities and see that the coefficient of
correlation between these securities is as less as possible (only then the portfolio
will be able to reduce the risk). This is the foundation of portfolio management. The
portfolio manager should follow the above-mentioned principles to further
strengthen his targets of higher returns and optimum risk.
The first principle The first principle The first principle The first principle suggests that investment should be made only in those securities
which are fundamentally strong. The strength of a security depends upon three
strengths: (a) strength of the company, (b) strength of the industry, and (c) strength
of the economy. The strength of the company depends upon various factors like (i)
intelligent, dedicated and motivated human resources, (ii) management having
positive values and vision, (iii) policy regarding encouraging R&D, (vi) integrity of
promoters, and (v) long range planning for profits.

158
The second principleThe second principleThe second principleThe second principle suggests that the portfolio should be reviewed continuously and
if need be, revised immediately. The Fundamentals of the company, industry and
economy keep on changing. Accordingly, the portfolio should be revised according to
emerging situations. For example, in case of monsoon failure, investments should
move from fertilizer companies to irrigation companies, in case some sick-minded
person takes over as CEO of the company, perhaps desired step will be to disinvest
the securities of the company, in case cheaper substitutes have emerged for any
industry's product, better move to some other industry, etc.
Two more points regarding the second principle
(i) Sometimes, after making the investment in some securities, portfolio manager
realizes that his decision of investing in that security is wrong, he should not
wait for happening of some event which will make his decision as a right one
(if there is some loss on that investment, he should not even wait for
breakeven); rather he should move immediately liquidate his position in that
security.
(ii) Do not bother much about transaction cost related to reshuffling of the
portfolio, consideration of such small costs generally result in heavy
losses or foregone opportunities of earning profit.
Q. No.Q. No.Q. No.Q. No.175175175175:::: Write a short note on the objectives of portfolio management.
( Nov. 1998)( Nov. 1998)( Nov. 1998)( Nov. 1998)
Answer:Answer:Answer:Answer:
OBJECTIVES OF PORTFOLIO MANAGEMENT
There are seven objectives of portfolio management:
ReturnReturnReturnReturn
Portfolio management is technique of investing in securities. The ultimate object of
investment in the securities is return. Hence, the first objective of portfolio
management is getting higher return.
Capital GrowthCapital GrowthCapital GrowthCapital Growth
Some investors do not need regular returns. Their object of portfolio management is
that not only their current wealth is invested in the securities; they also want a
channel where their future incomes will also be invested.
LiquidityLiquidityLiquidityLiquidity
Some investors prefer that the portfolio should be such that whenever they need
their money, they may get the same.
Availability of Money at PreAvailability of Money at PreAvailability of Money at PreAvailability of Money at Pre----decided Timedecided Timedecided Timedecided Time
Some persons invest their money to use it at pre-decided time, say education of
children, etc. Their objective of portfolio planning would be that they get their money
at that time.

159
Favourable Tax TreatmentFavourable Tax TreatmentFavourable Tax TreatmentFavourable Tax Treatment
Sometimes, some portfolio planning is done to obtain some tax savings.
Maintaining the Purchasing PowerMaintaining the Purchasing PowerMaintaining the Purchasing PowerMaintaining the Purchasing Power
Inflation eats the value of money, i.e., purchasing power. Hence, one object of the
portfolio is that it must ensure maintaining the purchasing power of the investor
intact besides providing the return.
Risk Reduction through Diversification Risk Reduction through Diversification Risk Reduction through Diversification Risk Reduction through Diversification
It is the perhaps most important object of the portfolio management. All other
objectives (mentioned above) can be achieved even without portfolio, i.e., through
investment in a single security, but reduction (without sacrificing the return) is
possible only through portfolio.
Single most important objective of the portfolio management is risk reduction
through diversification.
Q. No. Q. No. Q. No. Q. No. 171717176666: : : : Write note on factors affecting investment decisions in portfolio
management. (May, 2000)May, 2000)May, 2000)May, 2000)
AnAnAnAnswer:swer:swer:swer:
Factors affecting investment decisions in portfolio/asset allocation in portfolio are as
follows:
Risk ToleranceRisk ToleranceRisk ToleranceRisk Tolerance
RISK refers to the volatility of portfolio's value. The amount of risk the investor is
willing to take on is an extremely important factor. While some people do become
more risk averse as they get older; a conservative investor remains risk averse over
his life-cycle. An aggressive investor generally dares to take risk throughout his life.
If an investor is risk averse and he takes too much risk, he usually panic when
confronted with unexpected losses and abandon their investment plans mid-stream
and suffers huge losses.
Return NeedsReturn NeedsReturn NeedsReturn Needs
This refers to whether the investor needs to emphasize growth or income.
Investment Time HorizonInvestment Time HorizonInvestment Time HorizonInvestment Time Horizon
The time horizon starts when the investment portfolio is implemented and ends when
the investor will need to take the money out. The length of time you will be investing
is important because it can directly affect your ability to reduce risk. Longer time
horizons allow you to take on greater risks with a greater total return potential. If
the time horizon is short, the investor has greater liquidity needs some attractive
opportunities of earning higher return has to be sacrificed and the result is reduced
in return.
Tax ExposureTax ExposureTax ExposureTax Exposure
Investors in higher tax brackets prefer such investments where the return is tax
exempt, others will have no such preference.

160
Q. No.Q. No.Q. No.Q. No.171717177777: (i) : (i) : (i) : (i) What sort of investor normally views the variance (or Standard
Deviation) of an individual security’s return as security’s proper measure of risk?
(ii) (ii) (ii) (ii) What sort of investor rationally views the beta of a security as the security’s
proper measure of risk? In answering the question, explain the concept of beta.
(May, 2004)(May, 2004)(May, 2004)(May, 2004)
Answer : (i)Answer : (i)Answer : (i)Answer : (i) Investor with long-term time horizon ( investing from long term point of
view ) view SD as the proper measure of security’s risk. SD is a measure of total
risk and if the investment is from long term point of view total risk should be
considered.
Longer the period, larger the risk - as in long run fundamentals of the economy as
well as company may change. All these changes are reflected in SD of past returns
of security (the implied assumption is that the history repeats itself). (ii) (ii) (ii) (ii) Investor
with short run time horizon view beta as the proper measure of risk. Beta measures
systematic risk of the security. Any bad news (say no-trust motion against
government, slightest possibility of war, death or serious illness of some key person
of the economy) may upset the market and result is adverse impact on the price of
the security. If beta of the security is high, even slight adverse factor resulting in
slight adverse impact on the market may have substantial adverse impact on price of
the security.
Concept of Beta: Beta is an indicator of an investment’s systematic risk. It measures
systematic risk associated with an investment in relation to total risk associated with
market portfolio. Suppose the beta value of a particular security is 1.20, it means
that if return of market portfolio varies by one per cent, the return from that security
is likely to vary by 1.20 per cent. Therefore, this security is riskier than the market
because we expect its return to fluctuate more than the market on a percentage
basis. This beta measures the riskiness of individual security relative to market
portfolio. It is a ratio of “its covariance with the market” to “the variance of market
as a whole”. A security with beta greater than one is called as aggressive security;
with beta less than one is called as defensive security and with beta equal to one is
called as neutral security.
Q. No.Q. No.Q. No.Q. No.171717178888: Explain Equity Style Management.
AnswerAnswerAnswerAnswer
Equity investment, a complex process, requires a lot of expertise, experience
and time. Small investors do not have time, skill or access to the information to
assess available investment opportunities and manage their money most
effectively. They do not have sufficient money to invest for reducing the risk
through diversification. That’s why generally such investors outsource the
investment function to outside agencies like portfolio managers, mutual funds,
pension funds etc. These agencies pool the investors’ money and make collective
investments on behalf of their clients/customers. The investment is managed by
professional fund managers ensuring higher return, lesser risk and adequately
liquidity. This has led to reduced direct equity investment by individuals and a

161
corresponding increase in the institutional investing. While holding equities
through money management institutions has made it possible for individual
investors to reap diversification benefits and to benefit from expertise of
portfolio managers, it is not been without cost. Investors have to bear the cost
for this approach.
Equity Style Management is the new frontier in institutional investment
management. Professional portfolio managers generally do not have a choice
about applying the general investment philosophy to govern the portfolios they
manage. They are constrained either byeither byeither byeither by
� the client’s guidelines and risk tolerance, or
� Self- stated investment objectives (This is generally applicable in case of
mutual funds schemes. Such schemes define and confine the investment
strategy)
The concept of the equity style management requires the professional fund
managers to achieve the higher returns for their clients while operating as per
the pre-determined general investment philosophy i.e. “the guide lines of the
client” / “self- stated investment objectives”. The term ‘style’ here refers to
equity exposure that the portfolio manager should take to lead to / exceed the
expected returns. A group of securities is said to belong to a similar ‘style’ when
there is a high degree of co-movement in their prices. It has been observed that
there are categories of equity shares that have similar characteristics and
performance patterns. Also, the returns of these equity shares categories
performed differently than other categories of the equity shares. The returns of
shares of the same category are highly high degree of positive correlation.
Style is referred as an investment scheme that groups stocks based on common
characteristics. There are different types of the styles that the fund managers
may implement. For example, growth stocks, value stocks, small cap stocks, mid
capitalization stocks, large caps etc. Each of these styles has its distinctive
features including distinctive risk characteristics. Equity style management aims
to identify and describe the characteristics of an investment portfolio. Style
classes are not static. A large cap value or small cap growth stock doesn't stay
that way forever. PE ratios and market caps change every day. So, today's small
cap value stock may become tomorrow's large cap growth stock, and vice versa.
The investors use style to (i) understand what types of investments their fund
managers are buying for them (ii) monitor style consistency and (iii) control risk.
Ongoing assessments of style are important because the investors need to
ensure that managers do what is assigned. For this purpose the performance of
the fund manager is compared with some bench mark. For example, the return of
large cap style can be compared with the return on Nifty. Also the performance

162
of a fund manager managing a particular style can be compared with that of other
fund managers managing the similar types of equity styles. The performance
assessment is done on the basis of risk adjusted returns.
There are two approaches regarding managing the equity styles: (i) Active
approach and (ii) Passive approach.
• Active approachActive approachActive approachActive approach: Active investing approach aims at beating the market.
The philosophy of the active investing is share markets are not fully
efficient. There are situations when the shares are mispriced and there
are opportunities to profit for the smart investors.
incur greater transactions and advisory costs.
Passive approachPassive approachPassive approachPassive approach: Passive investing approach believes that it is not possible to
beat the market. The philosophy of the active investing is share markets are fully
efficient. One can earn only normal returns (risk based returns) from the share
market. The shares are not mispriced at any time. Hence, neither the share
selection nor the timing results in super-normal return. Passive managers invest
in broad sectors of the market and expect the average normal returns.
Different styles:Different styles:Different styles:Different styles:
Though the equity shares can be classified into styles in different ways, the most
popular styles are ‘growth’ and ‘value’. In other words, we can say that growth
and value are styles of investing in equity shares.
Growth shares are associated with high-quality; successful companies whose
earnings are expected to continue growing at an above-average rate relative to
the market. Growth shares generally have
the following characteristics:
(i) high price-to-earnings (P/E) ratios
(ii) high price-to-book ratios.
(iii) show sound growth rates and potential for future growth.
(iv) expected to give larger capital appreciation in future
(v) represent a relatively safe investment
Value shares are those, which the market has overlooked and as a result their
price is low (relative what it is worth) and about to increase when the necessary
market corrections occur. Value shares generally have the following
characteristics :
(i) low price-to-earnings (P/E) ratios
(ii) low price-to-book ratios.
(iii) value stocks generally have good fundamentals, but they may have
fallen out of favour in the market.
(iv) represent a more risky investment

163
Neither approach guarantees to provide positive returns (not to talk of
supernormal return); both carry investment risk.
Assets Allocation :Assets Allocation :Assets Allocation :Assets Allocation :
Asset allocation accounts for a large part of the variability in the return on a
portfolio. Asset allocation is generally defined as the allocation of an investor's
investible funds among a number of "major" asset classes. This allocation aims at
value creation but it is constrained by the risk-aversion of the investor. If the
investor is not risk-averse, the major portion of the investible funds may be
allocated to equity; if the investor is risk-averse, the major portion of the
investible funds may be allocated to fixed income securities.
Style decision :Style decision :Style decision :Style decision :
Asset allocation involves a risk decision. This decision is followed by ‘Style’
decision. The style decision is guided by both risk and return. The investor has
to decide whether he wants to go for large cap growth shares or mid cap value
shares etc. The portfolio manager may advise the investor on this matter but the
decision is to be taken by the investor.
Investment Philosophies: Investment Philosophies: Investment Philosophies: Investment Philosophies:
There are two investment philosophies followed by the portfolio managers:
(i) Top down philosophy. and
(ii) Bottom up philosophy.
Top down philosophy follows the following investment process (a) First consider
the macro-factors i.e. the state of economy; invest in the economy that is strong
and growing (b) then, consider the industry; invest in the industry which is
expected to outperform other industries (c) finally, consider the company; invest
in the company which is expected to be best in the industry.
Bottom up philosophy gives maximum weight to the ‘company’ i.e. a bottom-up
investor considers the financial health, products, supply and demand, and other
aspects of a company's performance over a given period of time. Using this
approach the portfolio manager pay less attention to the economy as a whole, or
to the prospects of the industry a company is in.
Performance EvaluationPerformance EvaluationPerformance EvaluationPerformance Evaluation::::
A portfolio is judged against a benchmark by comparing a series of returns from
the portfolio with the corresponding returns for the benchmark. Suppose the
bench mark provides a risk premium of 10%, its standard deviation of the returns
from this bench mark is 5. Now further suppose that the standard deviation of
returns from the portfolio under assessment is 6. The portfolio should provide
minimum risk premium of 12%. If the risk free rate of return is 10%, the portfolio
manager is required to provide minimum 22% return.
Q. No.Q. No.Q. No.Q. No.171717179 : 9 : 9 : 9 : Write a note o n Arbitrage Operations. (Nov(Nov(Nov(Nov. 20. 20. 20. 2008080808))))

164
AnswerAnswerAnswerAnswer Arbitrage is the process of taking advantage of the price differential.
Arbitrage actions by different arbitrageurs tend to remove the price differential.
Arbitrage is possible in the following three cases :
(i) The same asset quotes at different prices in different markets. For
example, prices of shares of a particular company in BSE and NSE
(ii) There are different expected returns for two or more similar assets (i.e.
the assets having the same risk). For example, suppose there are two assets
having the same risk, theoretically, their expected returns must be same. If
their returns are different, the arbitrageur will sell the assets having lower
return and buy the assets having the higher returns and have some profit.
(iii) The realization from an asset on a future date is certain. If today its price
is not equal to the present value of the amount to be realized, the present
value should be calculated using risk free rate.

165
Example ; APPENDIX AExample ; APPENDIX AExample ; APPENDIX AExample ; APPENDIX A
SD SD% Variance Variance%
(a) 2 ? ? ?
(b) 0.07 ? ? ?
(c) ? 7 ? ?
(d) ? 40 ? ?
(e) ? ? 16 ?
(f) ? ? 9 ?
(g) ? ? ? 36
(h) ? ? ? 64
(i) ? ? ? 100
Answer:Answer:Answer:Answer:
SD SD% Variance Variance%
(a) 2 200 4 400
(b) 0.07 7 0.0049 0.49
(c) 0.07 7 0.0049 0.49
(d) 0.40 40 0.16 16
(e) 4 400 16 1600
(f) 3 300 9 900
(g) 0.60 6 0.36 36
(h) 0.80 80 0.64 64
(i) 1 100 1 100
Example Example Example Example : : : : Find the (i) portfolio Variance (ii) portfolio SD, using the following data.
Secruity A SD = 36%
Security B SD = 64%
r between returns from the two securities = -1
Equal amount of investment is made in each of the two securities.
Answer Answer Answer Answer
Portfolio Variance =
(0.50)2(0.36)2+(0,50)2(0.64)2 + 2(0.50)(0.50)(-1)(0.36)(0.64)=0.0196
= 1.96%
Alternative wayAlternative wayAlternative wayAlternative way:
Portfolio Variance =
[(0.50)2(36)2+(0,50)2(64)2 + 2(0.50)(0.50)(-1)(36)(64)]/ 100 = 1.96%
Portfolio SD:Portfolio SD:Portfolio SD:Portfolio SD:
____________________________________________________________________________________________________________________________________________________________________________________________________________________________________________________
√(0.50)2(0.36)2+(0,50)2(0.64)2 + 2(0.50)(0.50)(-1)(0.36)(0.64) =0.14
Alternative wayAlternative wayAlternative wayAlternative way:
Portfolio SD =
______________________________________________________
√[(0.50)2(36)2+(0,50)2(64)2 + 2(0.50)(0.50)(-1)(36)(64)] = 14%

166
APPENDIX APPENDIX APPENDIX APPENDIX BBBB
DERIVATION FOR MINIMUM VARIANCE FORMULA
Let’s invest w1 in one and (1- w1) in other security. Let portfolio
variance=y
Y = (w1)2 .(SD1)
2 +(1- w1)
2.(SD2)
2 + 2(w1.)(1- w1).r12.( SD1) (SD2)
=(w1)2 .(SD1)
2 + [1+(w1)
2 -2 w1] .(SD2)
2 + 2(w1.)(1- w1).r12.( SD1) (SD2)
= (w1)2 .(SD1)
2 + (SD2)
2 +(w1)2.(SD2)
2 -2 w1. (SD2)
2
+ 2(w1.).r12.( SD1) (SD2) -2(w1.)2.r12.( SD1) (SD2)
dy/w1 = 2(w1) .(SD1)2 + 0
+2(w1).(SD2)2 -2. (SD2)
2
+ 2.r12.( SD1) (SD2) -4(w1).r12.( SD1) (SD2)
As per minima concept of differential Calculus, we get minimum value of y
by putting dy/w1 =0
2(w1) .(SD1)2 +2(w1).(SD2)
2 -2. (SD2)
2 + 2.r12.( SD1) (SD2)
-4(w1).r12.( SD1) (SD2) = 0
2(w1) .(SD1)2 +2(w1).(SD2)
2 -4(w1).r12.( SD1) (SD2)
= 2. (SD2)2 - 2.r12.( SD1) (SD2)
(w1) .(SD1)2 +(w1).(SD2)
2 -2(w1).r12.( SD1) (SD2)
= (SD2)2 - r12.( SD1) (SD2)
w1[(SD1)2 +(SD2)
2 -2.r12.( SD1) (SD2)] = (SD2)2 - r12.( SD1) (SD2)
(SD2)2 - r12.( SD1) (SD2)
w1 = -------------------------------------------
(SD1)2 +(SD2)
2 -2.r12.( SD1) (SD2)