Embed Size (px)
Citation preview

CHAPTER 4PROBLEM DEFINITION

BRISBANE CITY COUNCIL
Brisbane Metro Business Case (May 2017)
CHAPTER 4 – PROBLEM DEFINITION 1
4 PROBLEM DEFINITION
4.1 Purpose and Overview of this Chapter
The purpose of this chapter is to identify and articulate the priority problems the Brisbane
Metro will aim to address. At the end of this chapter, the service needs for the Brisbane
CHAPTER SUMMARY AND RECOMMENDATIONS:
Identifying problems is critical to understanding the scope of issues that a project can address. Developing a sound understanding of the extent, scale, root cause and effect of problems provides a strong evidence-based foundation for developing a project solution. Failure to do this may result in mismatching problems and solutions and/or developing solutions that don’t adequately or effectively alleviate the problem in the long term.
Problems to be addressed by the Brisbane Metro have been identified within the context of forecast population, economic and employment growth in Brisbane and the wider South East Queensland (SEQ) region.
Guided by the strategic objectives, problems have been investigated at four levels, specifically:
o Strategic problems facing Brisbane and the SEQ region, considering the interrelationships between transport, land use and economic productivity and prosperity
o Transport problems facing Brisbane and SEQ as a region, including car dependency, congestion and the impact of Brisbane’s topography on the efficiency of the transport network
o Bus problems experienced on the Brisbane network, particularly around increasing demand, capacity constraints and reducing reliability
o Rail problems experienced on the SEQ network, including its limited footprint across the region that restricts the ability of rail to cater for travel demands from demographic growth areas.
These problems have been prioritised in order to understand the outcomes sought and service needs from an investment in transport infrastructure. The priority problems to be addressed are:
o Strategic – limited accessibility and connectivity
o Strategic – economic growth and productivity
o Transport network – inadequate ability to meet future public transport demand without infrastructure intervention and/or service redesign
o Bus network – capacity constraints limit potential growth of bus services
o Bus network – degrading journey times and reliability
o Bus network – worsening amenity in the inner-city.
A ‘without project’ case has been established to determine the benefits of a project solution, as well as understand the impact on the strategic objectives without intervention.

BRISBANE CITY COUNCIL
Brisbane Metro Business Case (May 2017)
CHAPTER 4 – PROBLEM DEFINITION 2
Metro will be clearly articulated to support the options analysis presented in Chapter 5, and
the Project solution presented in Chapter 6.
The findings of this chapter will ultimately justify the Brisbane Metro’s customer and product
benefits presented in Chapter 7, and city and place benefits presented in Chapter 8.
This chapter outlines:
The strategic context driving the need for a step-change in public transport capacity through Brisbane’s inner-city and the Central Business District (CBD) to improve access to inner-city jobs and facilitate economic growth.
The current and future transport network issues that are causing network congestion, overcrowding and reduced efficiency.
The critical bus network problems, including capacity constraints, reducing reliability, increasing operational inefficiencies and impacts to CBD congestion and amenity.
The key rail issues that are contributing to the wider strategic and transport network problems, including the network’s limited coverage and CBD accessibility as well as capacity, frequency and reliability constraints.
The outcomes sought for a new transport initiative that will address the identified problems.
The prioritisation of the identified problems and derivation of service needs to provide focus for the development of an optimal solution for the Brisbane Metro.
A definition of the ‘without project’ case, highlighting the current and future implications of changes for transport demand in Brisbane.
4.2 Context for Problem Definition
As discussed in Chapter 3, Brisbane is an economic powerhouse for Queensland and is its
gateway to the global economy. The prosperity of Brisbane’s economy is critical to the
prosperity of industries and sectors across Queensland and Australia. Given the significance
of Brisbane’s economy, the structure and functionality of the city has implications for all
levels of government, industry and the community.
In increasing the capacity of cities, consideration must be given to the role that transport
infrastructure can play in shaping their development. With the changing spatial distribution of
employment, many jobs (in particular, higher-skill, higher-paying jobs) are centralising in
Australia’s major cities.
At the same time, much of the population growth across Australian cities continues to occur
on the urban fringes. The result is that an increasing number of people are living further
away from city centres and the jobs they provide, leading to a growing need to effectively
connect homes and workplaces.
Transport is an enabler of economic activity, through providing access for workers to jobs
and for goods and services to markets. Ineffective movement of people and goods to and
within inner cities has the potential to reduce productivity and impact economic growth at the
local, state and national levels.
A well-planned transport initiative, coupled with appropriate land use policies and
interventions such as investment attraction, can make the transport system a catalyst for a
wider site and city transformation.

BRISBANE CITY COUNCIL
Brisbane Metro Business Case (May 2017)
CHAPTER 4 – PROBLEM DEFINITION 3
The Australian Government’s Smart Cities Plan indicates that most world-class cities have
invested in fast, efficient public transport systems to provide viable alternatives to private
vehicles1. These cities have used transport investments to reduce congestion, and its
associated costs, and enable economic opportunity and growth.
4.3 Approach to Problem Definition
Identifying problems is critical to understanding the scope of issues that a project can
address. Developing a sound understanding of the extent, scale, cause and effect of
problems provides a strong evidence-based foundation for developing a project solution.
Failure to do this may result in a mismatch of problems and solutions and/or solutions that
do not adequately or effectively alleviate the problem in the long term.
Limited funding and competing transport system needs and trade-offs mean that
governments and society generally cannot afford to address all identified problems. This
means that setting priorities is an important element in identifying and assessing the
problems.
The identification, assessment and prioritisation of the problems outlined in this chapter have
been developed through the consideration of the strategic objectives, as well as the
numerous studies, strategies and proposals developed by the Australian Government,
Queensland Government and Council. The long term demographic forecasts and strategic
challenges also provide context for the problem analysis.
These outcomes were used as a basis to develop an initial list of problems associated with
Brisbane’s growing transit system, falling within the following categories:
Strategic problems
Transport network problems
Bus network problems
Rail network problems.
A problem identification workshop was held with internal stakeholders and key advisors to
agree the problems and identify potential root causes and the effects of the problems. A
broad range of problems were identified to ensure an integrated approach to the project
options analysis process and identified problems were prioritised to enable effective decision
making and direction.
The project outcomes sought were then identified, ensuring strategic alignment with the
State Infrastructure Plan and draft South East Queensland Regional Plan (ShapingSEQ).
The outcomes sought for the problems which were noted as priority problems became the
service needs for the Brisbane Metro.
Figure 4.1 provides a summary of the process used to complete the problem analysis.
1 Department of the Prime Minister and Cabinet. (2016). Smart Cities Plan.

BRISBANE CITY COUNCIL
Brisbane Metro Business Case (May 2017)
CHAPTER 4 – PROBLEM DEFINITION 4
Figure 4.1 – Problem analysis process
4.4 Strategic Problems
Cities are the principal drivers of the nation’s economic growth. The four largest capital cities
in Australia – Sydney, Melbourne, Brisbane and Perth contribute nearly 60 per cent of
Australia’s Gross Domestic Product2 (GDP).
CBDs and inner-city locations provide highly concentrated centres for employment
(particularly in knowledge-intensive activities and specialised services) and therefore
generally experience higher levels of productivity than rural and regional towns and cities.
Transport improvements can increase the strength of agglomeration (the critical mass and
concentration of activities) to the extent that they increase connectivity within the spatial
economy of a city. By changing the way people and firms have access to economic activity,
transport increases the potential realisation of agglomeration externalities and the
productivity effects derived from it. The concentration of jobs in these centres allow
businesses access to a large pool of skilled workers, and provides the opportunity to obtain
the benefit from proximity to suppliers and customers, driving efficiencies and generating
further opportunities.
Inner-city businesses generally provide jobs that are more export focused and contribute
more to the growth of the economy, as compared to jobs in outer areas of the city which
generally serve the domestic market.
Chapter 3 provided detail on the forecast growth for Brisbane over the next 25 years and the
impact this growth will have on demand for infrastructure and services in SEQ. This includes
transport infrastructure, which is vital to support growth as it provides the means for people
to access jobs and services. As such, demand for travel is expected to grow in response to
population growth and the associated increase in economic activity.
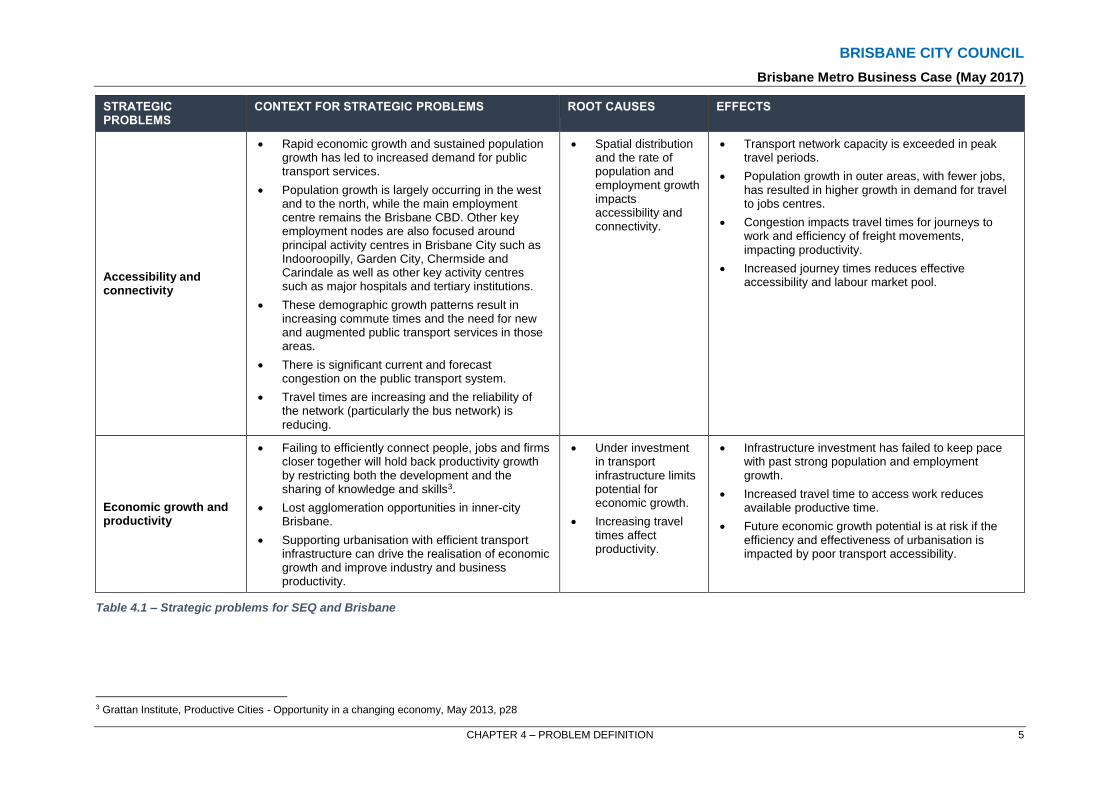
Table 4.1 provides an overview of the identified strategic problems (including some
additional context for each identified problem), root causes and effects for the SEQ region
and the inner-city of Brisbane.
2 Australian National Accounts: State Accounts, Cat. No. 5220.0 and SGS Economics & Planning, Australian Cities Accounts 2012-13, February 2014, p3
BRISBANE CITY COUNCIL
Brisbane Metro Business Case (May 2017)
CHAPTER 4 – PROBLEM DEFINITION 5
STRATEGIC PROBLEMS
CONTEXT FOR STRATEGIC PROBLEMS ROOT CAUSES EFFECTS
Accessibility and connectivity
Rapid economic growth and sustained population growth has led to increased demand for public transport services.
Population growth is largely occurring in the west and to the north, while the main employment centre remains the Brisbane CBD. Other key employment nodes are also focused around principal activity centres in Brisbane City such as Indooroopilly, Garden City, Chermside and Carindale as well as other key activity centres such as major hospitals and tertiary institutions.
These demographic growth patterns result in increasing commute times and the need for new and augmented public transport services in those areas.
There is significant current and forecast congestion on the public transport system.
Travel times are increasing and the reliability of the network (particularly the bus network) is reducing.
Spatial distribution and the rate of population and employment growth impacts accessibility and connectivity.
Transport network capacity is exceeded in peak travel periods.
Population growth in outer areas, with fewer jobs, has resulted in higher growth in demand for travel to jobs centres.
Congestion impacts travel times for journeys to work and efficiency of freight movements, impacting productivity.
Increased journey times reduces effective accessibility and labour market pool.
Economic growth and productivity
Failing to efficiently connect people, jobs and firms closer together will hold back productivity growth by restricting both the development and the sharing of knowledge and skills3.
Lost agglomeration opportunities in inner-city Brisbane.
Supporting urbanisation with efficient transport infrastructure can drive the realisation of economic growth and improve industry and business productivity.
Under investment in transport infrastructure limits potential for economic growth.
Increasing travel times affect productivity.
Infrastructure investment has failed to keep pace with past strong population and employment growth.
Increased travel time to access work reduces available productive time.
Future economic growth potential is at risk if the efficiency and effectiveness of urbanisation is impacted by poor transport accessibility.
Table 4.1 – Strategic problems for SEQ and Brisbane
3 Grattan Institute, Productive Cities - Opportunity in a changing economy, May 2013, p28

BRISBANE CITY COUNCIL
Brisbane Metro Business Case (May 2017)
CHAPTER 4 – PROBLEM DEFINITION 6
4.4.1 Strategic Problem 1: Accessibility and Connectivity
The Australian Government’s Smart Cities Plan states that in the 21st century, cities need to
be productive and accessible4. The productivity of the economy, and its capacity to generate
and distribute opportunities to all, depends on how well cities link workers with employers
and businesses. Improving these linkages has the potential to increase productivity and
national prosperity, and make Australia a more attractive destination for global talent and
leading international firms5.
As Brisbane and the wider region continues to grow, transport to and around the city will
become increasingly challenging. Chapter 3 identifies that population growth will occur in
areas outside of the inner suburbs of Brisbane, while the main employment centre will
remain the Brisbane CBD. Other key employment nodes are also focused around principal
activity centres in Brisbane City such as Indooroopilly, Garden City, Chermside and
Carindale as well as other key activity centres such as major hospitals and tertiary
institutions.
Figure 4.2 demonstrates this, showing the vast majority of the region’s residential growth to
2041 is forecast to be outside of the Brisbane City area, while much of the employment
growth remains in Brisbane. This presents a considerable transport challenge for the region.
Figure 4.2 – Forecast Brisbane share of population and employment growth (2016 to 2041)6
Growing demand for mobility and connectivity is placing pressure on Brisbane’s existing
transport networks, resulting in longer and more variable travel times, crowding on public
transport services and significant peak period congestion on the arterial road network. This
is driving the need for new and additional public transport services.
4 Department of Prime Minister and Cabinet, Smart Cities Plan, Commonwealth of Australia, 2016, p2 5 Grattan Institute, Productive cities - Opportunity in a changing economy, Jane-Frances Kelly and Peter Mares, May 2013, p4-5 6 Data supplied by Transport and Main Roads in November 2016

BRISBANE CITY COUNCIL
Brisbane Metro Business Case (May 2017)
CHAPTER 4 – PROBLEM DEFINITION 7
Poor land use outcomes, such as unstructured growth in the form of urban sprawl, can also
erode regional accessibility and connectivity. Areas with primarily homogenous land uses
force residents to commute to areas of employment. With housing policies aimed at boosting
construction of new houses, significant development continues to take place in greenfield
sites on the city’s fringes, where public transport accessibility is limited and of a lower level
of service than inner areas, resulting in higher levels of car dependency. Inner area
residential densification within Brisbane City is also growing, placing higher demands on
public transport and active transport networks in these areas where car-ownership and
residential parking provision is lower than in fringe areas.
As demonstrated in Figure 4.3, the percentage of jobs that can be accessed within a half
hour public transport trip declines rapidly with distance from the city centre, and will decline
significantly over the next 25 years in the absence of significant investment in public
transport.
Figure 4.3 – Percentage of Brisbane jobs that can be reached in 30 minutes on board public transport7
The maps above indicate limitations on access to employment for people living in the outer
areas of Brisbane. For the majority of people more than a 10 kilometre straight line distance
from the General Post Office (GPO), less than 20 per cent of jobs can be reached within 30
minutes on public transport; dropping to less than 10 per cent by 2041.
Without good transport accessibility, residents of outer areas have access to fewer jobs than
inner-city residents, particularly to the high value jobs located in city centres, and are
therefore more vulnerable to fluctuations in the economy.
7 Brisbane Metro Transport Model (2017)

BRISBANE CITY COUNCIL
Brisbane Metro Business Case (May 2017)
CHAPTER 4 – PROBLEM DEFINITION 8
Transport infrastructure that can effectively integrate into the existing networks as well as
overcome the issues of land use segregation and transport related social disadvantages will
significantly improve accessibility and connectivity in SEQ.
4.4.2 Strategic Problem 2: Economic Growth and Productivity
Without an effective transport network, population increases (and therefore travel demand)
will increase travel times (particularly for commuting journeys), increase the variability in
travel times and increase congestion, as discussed in Section 4.5.1 below. This negatively
impacts the economy, reducing productivity and increasing transport costs for freight. As
such, transport connectivity is important in supporting both high-productivity agglomerations
and labour market participation8.
Agglomeration is when people and businesses co-locate because they draw benefit from
being in close proximity to each other. A key factor to improving productivity is through
agglomeration benefits, with labour mobility critical to achieving this. Highly skilled and
educated people tend to congregate in areas such as cities, which provide high value jobs.
This collective pooling of skills has synergistic effects on productivity, fostering the growth
and spread of knowledge, encouraging innovation, attracting other talented people and
boosting labour participation.
Agglomeration benefits employers, employees and the wider economy. Employers have
access to a greater pool of skilled workers and can better match these workers to
knowledge-intensive jobs. Workers have access to higher value jobs and a more resilient job
market, which provides alternative opportunities in the event that an individual firm or a
market sector experiences a downturn. Agglomeration also assists with the spread of
knowledge throughout the economy, both between firms and from worker to worker.
The benefits of agglomeration are best achieved by investment in public transport
infrastructure to efficiently link workers with the knowledge-intensive jobs that drive
economic activity9. Both Sydney and Melbourne are investing heavily in urban public
transport to improve accessibility, productivity and enable greater economic opportunity.
Without similar investment in strategic public transport infrastructure, Brisbane’s economic
strength will be weakened and the broader SEQ region will lag behind Melbourne and
Sydney in urban competitiveness.
Poor accessibility and connectivity limits potential productivity improvements by limiting the
ability of businesses and people to connect and share opportunities, skills and knowledge.
Connecting residential areas in the greater urban area with employment is essential to
maintaining a productive city. Longer and more variable commute times, crowding and
congestion are detrimental to meeting this fundamental need.
Improvements to the public transport network that increase the efficiency of commuting,
serve the increasingly urbanised jobs market and support the transition to knowledge and
service industries, are crucial to achieving sustainable and diverse economic growth in
Brisbane.
4.5 Transport Problems
As outlined in Chapter 3, significant population growth in the SEQ region will mostly occur
outside of the Brisbane Local Government Area (LGA). However, Brisbane’s CBD and inner-
8 Grattan Institute, Productive cities - Opportunity in a changing economy, Jane-Frances Kelly and Peter Mares, May 2013, p39 9 State of Australian Cities 2014-15, Department of Infrastructure and Regional Development, p111

BRISBANE CITY COUNCIL
Brisbane Metro Business Case (May 2017)
CHAPTER 4 – PROBLEM DEFINITION 9
city precincts will remain the focus of jobs growth for the region, coupled with
accommodating increased residential densification. To ensure that inner Brisbane can
realise this potential for economic growth, it will be necessary to ensure that the road, public
transport and freight networks are equal to the task through timely and judicious investment
in urban transport infrastructure.
With population growth in the wider region and employment opportunities in inner-city
precincts, there will be greater demand for people to travel in Brisbane on all transport
modes. Public transport trips to and within inner Brisbane are projected to grow from
260,000 in 2016 to 550,000 trips per day in 2041. This is an increase of more than 110
percent in public transport demand10.
While demand for car travel will also increase, the limitations of road capacity will result in
increasing congestion and the spreading of travel demand and congestion through longer
periods of the day. As roads become more congested, bus services will also be affected,
particularly in the dense inner-city precincts, which are most reliant on transit. The city centre
will continue to be the main attractor, but around 60 per cent of total trips will be to other
inner-city destinations.
Existing transport operations will be unable to support this growth in population and
economic activity. New transport options will be essential to better connect growing suburbs,
key economic and education precincts and the city centre.
Table 4.2 provides an overview of the identified transport problems for the SEQ region and
the inner-city of Brisbane.
10 Brisbane Metro Transport Model (2017)

BRISBANE CITY COUNCIL
Brisbane Metro Business Case (May 2017)
CHAPTER 4 – PROBLEM DEFINITION 10
TRANSPORT PROBLEMS
ROOT CAUSES EFFECTS
Car dependency and road congestion
Historical development of Brisbane's strong radial transport network inclusive of motorway standard connections directly serving the CBD, particularly from the south.
Historical development of Brisbane’s transport network during the rise in car-ownership as the city was rapidly growing during the 1960s and 1970s.
Topographical constraints related to the Brisbane River crossing on the public transport network, particularly from the south, leads to challenges to providing ‘direct routes’ for public transport.
The high cost of infrastructure to cross the river has been a barrier to good network integration.
Continued reliance on private vehicles for commuter trips to Brisbane CBD will occur unless public transport provides an attractive alternative.
As travel demand grows and capacity is exceeded in peaks, congestion will spread to longer periods of the day.
Unplanned incidents worsen existing peak congestion and increase the potential for gridlock.
Unreliable travel times for road based public transport make it a less attractive alternative to car use.
Increasing road congestion will impact on road based public transport, further reducing travel time reliability.
Low density development in outer areas is challenging to service well and efficiently by public transport.
Lack of affordable housing and rising house prices in inner-city areas.
Inadequate public transport service provision to residential growth areas leads to car dependency or social isolation.
Continuing development in outer areas will increase road congestion on radial routes in Brisbane.
Inadequate capacity to meet future public transport demand
Increasing travel demand due to sustained population growth and increased economic activity will place pressure on all elements of the transport network.
As travel demand grows and public transport network capacity is exceeded in peaks, congestion will increase.
Employment growth in inner-city areas is driving increases in work related travel demand from both inner urban growth areas and outer suburbs.
Low density development in outer areas is inefficient to service well by public transport.
Transport networks need to cater for more complex travel patterns to match residential and employment growth patterns.
Parts of the existing network are approaching capacity limits, which increases the likelihood of network failure and causes longer, less reliable bus and rail trips.
Limited crossings of the Brisbane River impact CBD accessibility for public transport.
Historical lack of investment in new public transport assets due previous land use and transport policies.
Current capacity constraints on key links in the transport network, at key public transport nodes and stations constrain throughput and impact travel time reliability.
Brisbane’s topography The high cost of infrastructure to cross the river has been a barrier to good network Limited crossings of the Brisbane River

BRISBANE CITY COUNCIL
Brisbane Metro Business Case (May 2017)
CHAPTER 4 – PROBLEM DEFINITION 11
TRANSPORT PROBLEMS
ROOT CAUSES EFFECTS
and historic pattern of development impacts on network efficiency
integration.
Public resistance to implementing travel demand management measures.
impact on CBD connectivity for all modes.
Previous choices to limit capital costs during rail network construction have left legacy issues for capacity.
Historical development of Brisbane’s transport network.
Historical development and alignment of the rail network results in indirect access to the CBD for southside commuters.
Inefficient supply chains for freight
Challenges for public transport to present a more attractive alternative to car-use for commuters from outer urban areas travelling to Brisbane’s significant CBD and inner-city employment nodes.
High car dependency and resulting congestion on the major road network impacts freight movement.
Duplication and network complexity for buses within CBD.
High number of bus stops in Brisbane’s CBD.
Kerbside commercial vehicle servicing needs for business within Brisbane CBD conflict with kerbside needs for buses.
Unreliable travel times for road based public transport and transport network congestion impact productivity.
Increased journey times for workers impacts productivity and affects supply chains.
Table 4.2 – Transport problems for SEQ and Brisbane

BRISBANE CITY COUNCIL
Brisbane Metro Business Case (May 2017)
CHAPTER 4 – PROBLEM DEFINITION 12
4.5.1 Transport Problem 1: Car dependency and road congestion
Cars currently dominate the way people generally move around Brisbane, with more than 80
per cent of all trips by private vehicle11. During the peak periods, public transport mode share
to Brisbane’s CBD is strong at around 60 per cent, demonstrating that integrated public
transport focused on major employment and activity centres can play a significant role in
implementing a sustainable land-use transport strategy.
The spatial distribution of population growth across Brisbane is polarised, with low density
growth on the city’s outskirts and high density growth increasing in the inner suburbs.
Between 2001 and 2011, 53 per cent of population growth in the Brisbane Statistical
Division12 was located in the outer areas, growing at an average rate of 2.6 per cent per
annum, as shown in Table 4.3.
INDICATOR SYDNEY SD
MELB. SD BRISBANE SD
PERTH SD
Population change, 2001 to 2011 477, 641 636,320 408,905 351,527
Average annual rates of growth, 2001 to 2011 %
Population of CBD 3.5 6.5 12.7 9.2
Population of inner sector (excluding CBD) 0.8 1.6 3.4 1.4
Population of Middle sector 1.3 0.9 1.8 1.4
Population of Outer sector 0.9 2.4 2.6 2.9
Total population 1.1 1.7 2.3 2.3
Spatial distribution of growth, 2001 to 2011 %
Proportion of population growth in Inner sector 21.7 12.2 8.0 12.3
Proportion of population growth in Middle sector 32.8 25.7 39.3 19.3
Proportion of population growth in Outer sector 45.5 62.1 52.8 68.4
TOTAL 100.0 100.0 100.0 100.0
Table 4.3 – Population growth by sector for four capital city statistical divisions (2001 to 2011)13
The largest proportion of forecast growth will be in low density areas 30-40 kilometres from
the Brisbane CBD, as shown in Figure 4.4, where more affordable housing is available. This
leads to more services being spread out, resulting in low occupancy per kilometre travelled
and increasing the need for government subsidies for services.
Furthermore, these new outer suburbs have less public transport access and remain heavily
reliant on private car use to access jobs, education and other goods and services. If these
are not available locally, people will have to travel further to meet their needs, commuting
journeys are longer both in distance and time, and traffic congestion will worsen.
Brisbane’s road network is operating at or close to capacity during peak periods in most of
the key commuter arterials serving the CBD, resulting in congestion for all road users
including commercial vehicles. This is most apparent in the inner-city.
11 The State of Queensland, Department of Infrastructure, Local Government and Planning, Shaping SEQ - Draft South East Queensland Regional Plan, October 2016, p133 12 Brisbane Statistical Division comprises the area from the border of the Gold Coast north to the border of the Sunshine Coast and west to the eastern border of the Lockyer Valley Regional Council area. It also includes most of the Bribie Island, Moreton Island and North Stradbroke Island. 13 Ibid, p35

BRISBANE CITY COUNCIL
Brisbane Metro Business Case (May 2017)
CHAPTER 4 – PROBLEM DEFINITION 13
Figure 4.4 – Proportion of population growth occurring at various distances from GPO (2016 to 2041)14
Continued growth in car travel will increase congestion and impact on freight and
commercial movements. Across the entire transport network, total trips are forecast to
increase significantly by almost 40 per cent from 2012 to 2041 to a total of almost 9.3 million
trips per day, with the forecast growth in total private vehicle kilometres increasing
significantly by 60 per cent. The increase in the total private vehicle kilometres travelled
between 2012 and 2041 will place significant pressure on an already congested road
network during peak periods, with increased travel times15.
The Bureau of Infrastructure, Transport and Regional Economics (BITRE) estimated that the
avoidable cost of congestion to the Brisbane economy was roughly $1,000 per person in
2015 or $2.3 billion in total in 2010 dollars16. Current and projected costs of congestion to
2030 are shown in Figure 4.5.
14 Brisbane Metro Transport Model (2017) 15 Department of Transport and Main Roads, Bus and Train Project Business Case, Queensland Government and Brisbane City Council, Sep 2014, p4 to 6 16 Bureau of Infrastructure, Transport and Regional Economics (BITRE), 2015, Traffic and congestion cost trends for Australian capital cities, Information Sheet 74, BITRE, Canberra

BRISBANE CITY COUNCIL
Brisbane Metro Business Case (May 2017)
CHAPTER 4 – PROBLEM DEFINITION 14
Figure 4.5 – Average per capita congestion costs for Australian metropolitan areas17
Another measure of congestion is the increasing time taken to travel the same distance (i.e.
reduced accessibility). Figure 4.6 shows a comparison of time taken to drive to the Brisbane
CBD in the morning peak in 2016 and 2041. The time contours are closer together in the
2041 plot, indicating that only shorter distances can be traversed for the same time period in
2041 than in 2016, i.e. travel time is increasing. This will affect not only car trips, it will also
slow road based public transport, such as buses, and freight vehicles.
17 BITRE, 2015, Traffic and congestion cost trends for Australian capital cities, Information Sheet 74, BITRE, Canberra

BRISBANE CITY COUNCIL
Brisbane Metro Business Case (May 2017)
CHAPTER 4 – PROBLEM DEFINITION 15
Figure 4.6 – Comparison of morning peak road travel times to the CBD (2016 to 2041)18
Transport modelling assessed changes in network performance between 2016 and 2041.
The modelling identified the following for the Brisbane Statistical Division:
A forecast 46 per cent increase in total person trips each weekday from 7.77 million each weekday in 2016 to 11.38 million in 2041 in line with projected increases in population.
By 2041 cars will remain the predominant travel mode accounting for 78 per cent of all travel in the Brisbane Statistical Division (BSD), increasing 40 per cent from 6.3 million in 2016 to 8.8 million in 2041.
By 2041, vehicle kilometres travelled (VKT) by car are forecast to increase by 68 per cent, due to longer trip lengths, however, vehicle hours travelled (VHT) is forecast to increase by 138 per cent, as a result of delays from increasing congestion on the road network.
As a result, average travel speeds across the region’s road network are forecast to reduce from 54 kilometres per hour (km/h) in 2016 to 39 km/h in 2041.
Commercial vehicle trips are forecast to increase by 67 per cent.
Average commercial vehicle speeds are forecast to reduce from 65 km/h in 2016 to 46 km/h in 2041.
The proportion of public transport trips will be higher, with mode share rising from 7.3 per cent in 2016 to 11.5 per cent in 2041.
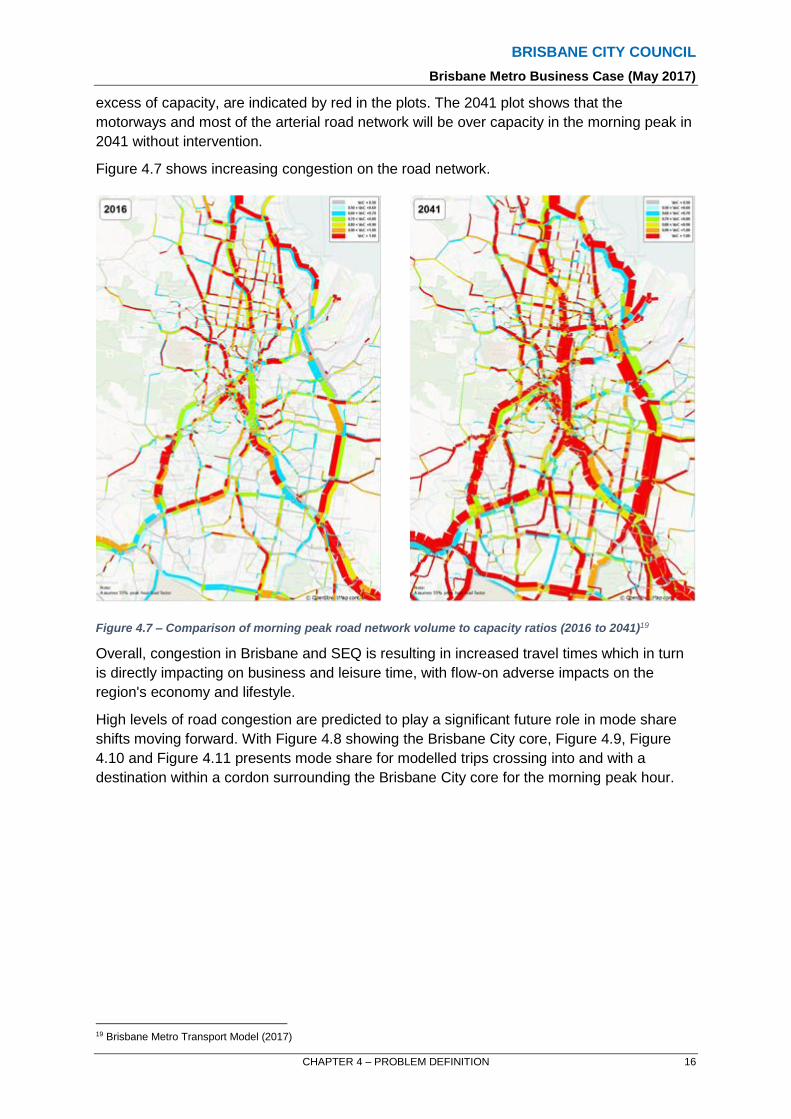
Transport modelling plots of volume to capacity for the morning peak in 2016 and 2041 show
how congested Brisbane’s transport networks will become over time, with network
performance deteriorating significantly by 2041. Congested corridors, where demand is in
18 Brisbane Metro Transport Model (2017)
BRISBANE CITY COUNCIL
Brisbane Metro Business Case (May 2017)
CHAPTER 4 – PROBLEM DEFINITION 16
excess of capacity, are indicated by red in the plots. The 2041 plot shows that the
motorways and most of the arterial road network will be over capacity in the morning peak in
2041 without intervention.
Figure 4.7 shows increasing congestion on the road network.
Figure 4.7 – Comparison of morning peak road network volume to capacity ratios (2016 to 2041)19
Overall, congestion in Brisbane and SEQ is resulting in increased travel times which in turn
is directly impacting on business and leisure time, with flow-on adverse impacts on the
region's economy and lifestyle.
High levels of road congestion are predicted to play a significant future role in mode share
shifts moving forward. With Figure 4.8 showing the Brisbane City core, Figure 4.9, Figure
4.10 and Figure 4.11 presents mode share for modelled trips crossing into and with a
destination within a cordon surrounding the Brisbane City core for the morning peak hour.
19 Brisbane Metro Transport Model (2017)

BRISBANE CITY COUNCIL
Brisbane Metro Business Case (May 2017)
CHAPTER 4 – PROBLEM DEFINITION 17
Figure 4.8 – Brisbane City Core
Figure 4.9 – People movement and mode share into City Core during the morning peak (2016 to 2041)20
20 Brisbane Metro Transport Model (2017)
BRISBANE CITY COUNCIL
Brisbane Metro Business Case (May 2017)
CHAPTER 4 – PROBLEM DEFINITION 18
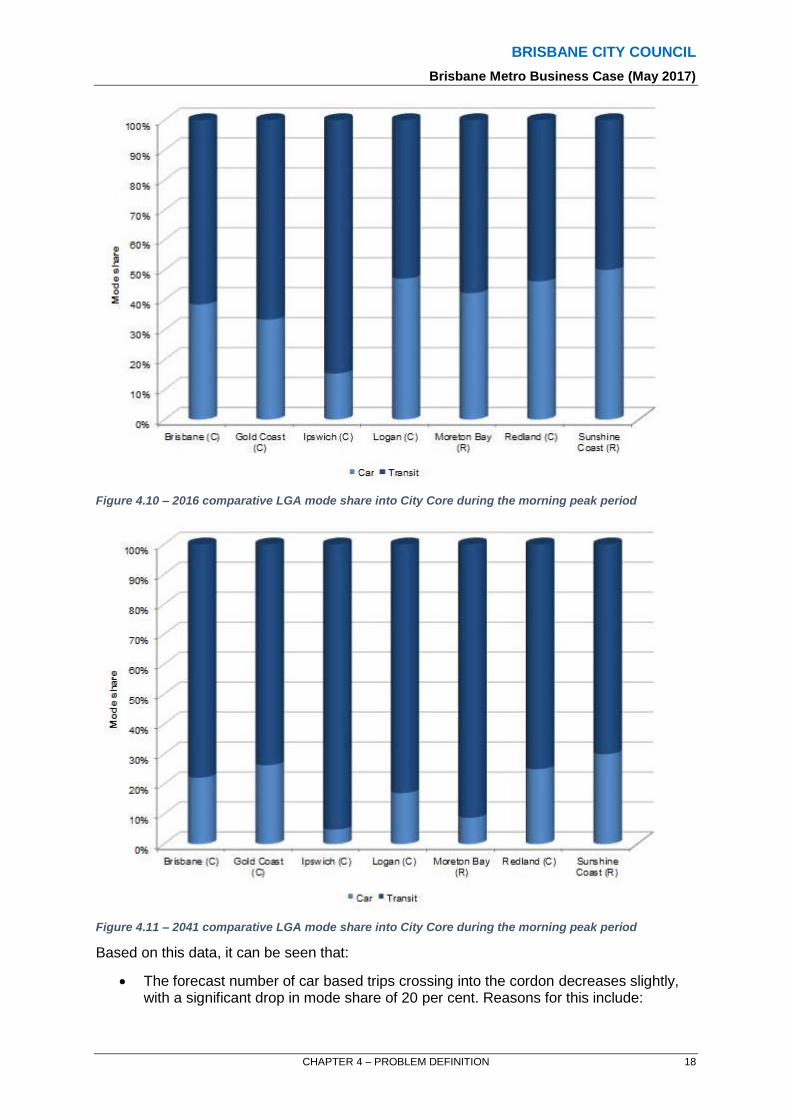
Figure 4.10 – 2016 comparative LGA mode share into City Core during the morning peak period
Figure 4.11 – 2041 comparative LGA mode share into City Core during the morning peak period
Based on this data, it can be seen that:
The forecast number of car based trips crossing into the cordon decreases slightly, with a significant drop in mode share of 20 per cent. Reasons for this include:

BRISBANE CITY COUNCIL
Brisbane Metro Business Case (May 2017)
CHAPTER 4 – PROBLEM DEFINITION 19
o Population and employment growth within the City Core results in less road capacity available for vehicles travelling from outside into the cordon.
o High levels of congestion for long lengths of road network result in substantially longer travel times, making transit that is dedicated and segregated highly attractive in comparison.
Transit based trips and mode share are forecast to increase significantly, specifically:
o Bus travel into the cordon is forecast to increase from 16,000 trips to 24,000. While this growth is not insubstantial, bus travel time is also impacted greatly by road congestion, limiting its potential without the provision of more segregated busway infrastructure, within the CBD and between the existing busways.
o Rail travel into the cordon is forecast to increase from 21,000 trips to almost 65,000 trips; largely driven by rail being the only mode that provides a segregated service unaffected by road congestion between the CBD and high population growth outer areas. This is reflected in the mode share shifts of the Ipswich, Logan and Moreton Bay LGAs.
4.5.2 Transport Problem 2: Inadequate capacity to meet future public transport demand
Travel demand increases with growth in economic activity and population growth.
Employment growth in Brisbane will be concentrated around the CBD and inner suburbs,
resulting in a work-related increase in travel demand on the most congested sections of the
transport network during peak periods.
Recent population growth has been greatest in the outer sector of Brisbane, where housing
is comparatively more affordable. These new suburbs, however are essentially dormitory
suburbs and have low self-sufficiency for employment and services, increasing the need to
travel, particularly for access to employment opportunities.
Trips across the transport network are forecast to significantly increase into the future. The
demand for travel is expected to exceed the rate of national population growth and the rate
of economic growth21. As presented in Section 4.5.1 above, with a transport system that
continues to be heavily dominated by car travel, congestion on the road network will
continue to increase, consequently impacting travel times and travel time reliability for road
based public transport such as buses. Further impacts for bus based travel are due to traffic
congestion caused by unplanned incidents. Overall, these problems result in a higher direct
economic contribution of bus congestion, in Brisbane, where bus patronage is double that of
rail22.
Congestion will be further exacerbated by forecast increases in public transport trips. These
are forecast to increase at a faster rate, almost doubling between 2016 and 2041 to
1.3 million trips per day with public transport passenger kilometres predicted to increase to
over 20 million kilometres per day23.
Also, as employment growth in inner areas spreads beyond the CBD, the radial nature of the
existing public transport network will add further complexity to trips, involving one or more
transfers between services for the same mode or between modes. This increasing
21 ACIL Allen Consulting (2014), Urban Transport Infrastructure: National Economic Analysis, p379 22 ACIL Allen Consulting (2014), Urban Transport Infrastructure: National Economic Analysis, p107 23 ACIL Allen Consulting (2014), Urban Transport Infrastructure: National Economic Analysis, p4-6
BRISBANE CITY COUNCIL
Brisbane Metro Business Case (May 2017)
CHAPTER 4 – PROBLEM DEFINITION 20
complexity of trips will further degrade travel time and travel time reliability for public
transport journeys, impacting the level of service of trips to locations outside of the CBD.
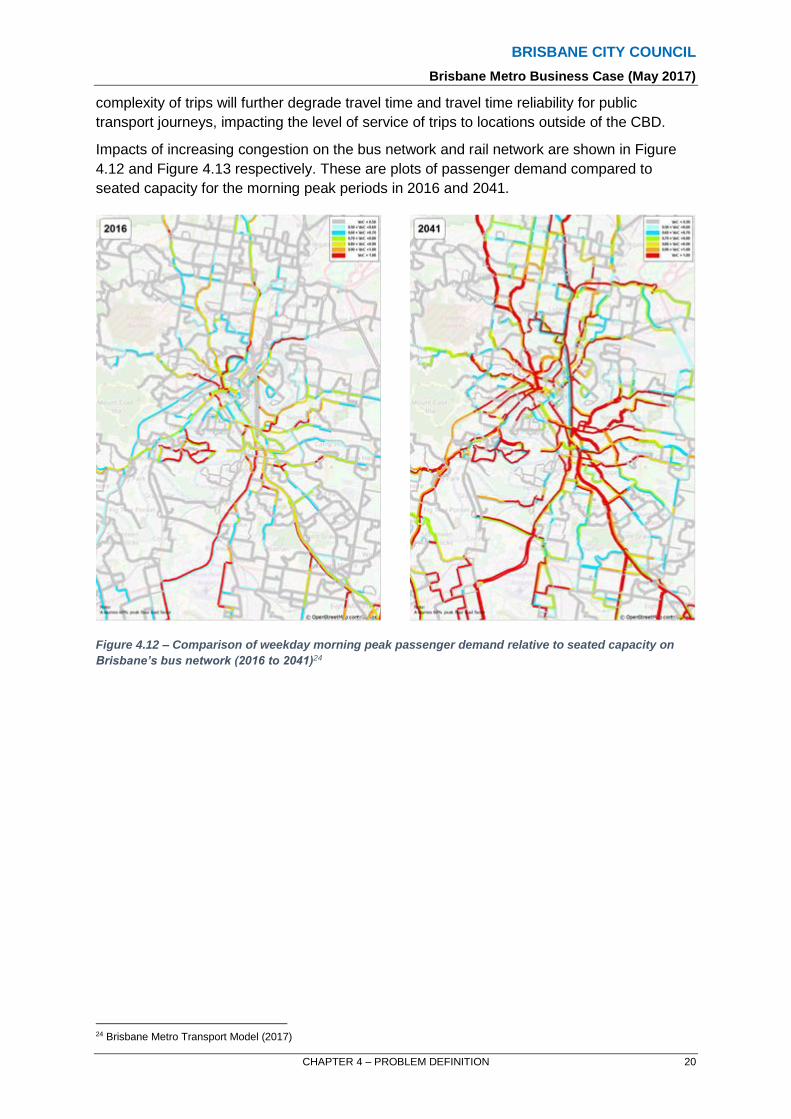
Impacts of increasing congestion on the bus network and rail network are shown in Figure
4.12 and Figure 4.13 respectively. These are plots of passenger demand compared to
seated capacity for the morning peak periods in 2016 and 2041.
Figure 4.12 – Comparison of weekday morning peak passenger demand relative to seated capacity on
Brisbane’s bus network (2016 to 2041)24
24 Brisbane Metro Transport Model (2017)
BRISBANE CITY COUNCIL
Brisbane Metro Business Case (May 2017)
CHAPTER 4 – PROBLEM DEFINITION 21
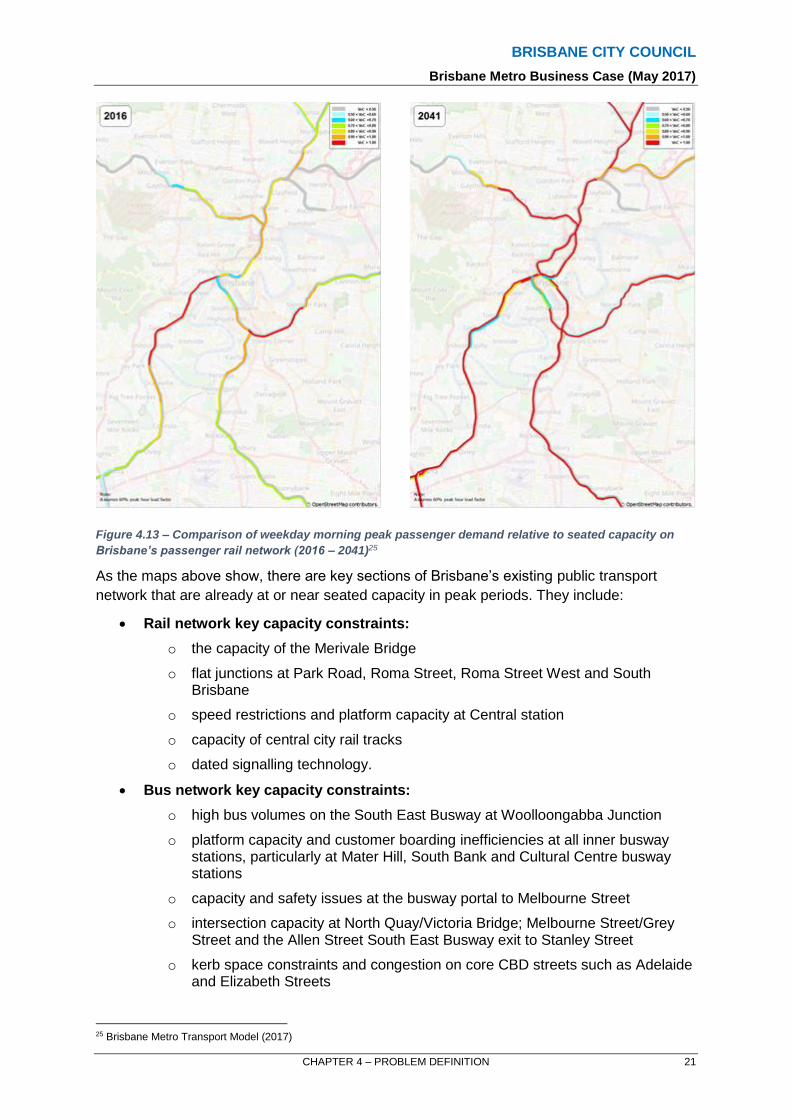
Figure 4.13 – Comparison of weekday morning peak passenger demand relative to seated capacity on
Brisbane’s passenger rail network (2016 – 2041)25
As the maps above show, there are key sections of Brisbane’s existing public transport
network that are already at or near seated capacity in peak periods. They include:
Rail network key capacity constraints:
o the capacity of the Merivale Bridge
o flat junctions at Park Road, Roma Street, Roma Street West and South Brisbane
o speed restrictions and platform capacity at Central station
o capacity of central city rail tracks
o dated signalling technology.
Bus network key capacity constraints:
o high bus volumes on the South East Busway at Woolloongabba Junction
o platform capacity and customer boarding inefficiencies at all inner busway stations, particularly at Mater Hill, South Bank and Cultural Centre busway stations
o capacity and safety issues at the busway portal to Melbourne Street
o intersection capacity at North Quay/Victoria Bridge; Melbourne Street/Grey Street and the Allen Street South East Busway exit to Stanley Street
o kerb space constraints and congestion on core CBD streets such as Adelaide and Elizabeth Streets
25 Brisbane Metro Transport Model (2017)
BRISBANE CITY COUNCIL
Brisbane Metro Business Case (May 2017)
CHAPTER 4 – PROBLEM DEFINITION 22
o insufficient layover space in the CBD.
These constraints cause delays and congestion on the rail and bus networks, increasing the
likelihood of network failure and resulting in longer, less reliable bus and rail trips. These
problems are further presented and discussed in Section 4.6 and Section 4.7 respectively.
Without investment in transport infrastructure, there will be insufficient capacity to meet the
projected growth in population and employment. This will have economic ramifications for
Brisbane with greater congestion, impacting workers accessing jobs and increasing transport
costs for freight and eroding labour productivity.
4.5.3 Transport Problem 3: Brisbane’s topography and historic pattern of development impacts on network efficiency
Brisbane’s public transport network is a radial network focused on the CBD. The busway
component of the public transport network also directly services some of Brisbane’s key
economic activity centres such as the University of Queensland (via the dedicated Eleanor
Schonell bus and active transport bridge), the Mater Hill hospital precinct, the Royal
Brisbane and Women’s Hospital precinct, tertiary education/research precincts at Boggo
Road, South Bank and Kelvin Grove and the Garden City principal activity centre.
While there are road alternatives for cross-city trips that bypass the CBD, most of the public
transport routes converge in the inner-city. This means that services on these routes are
required to travel on the most congested sections of the network, impacting on travel time
and travel time reliability.
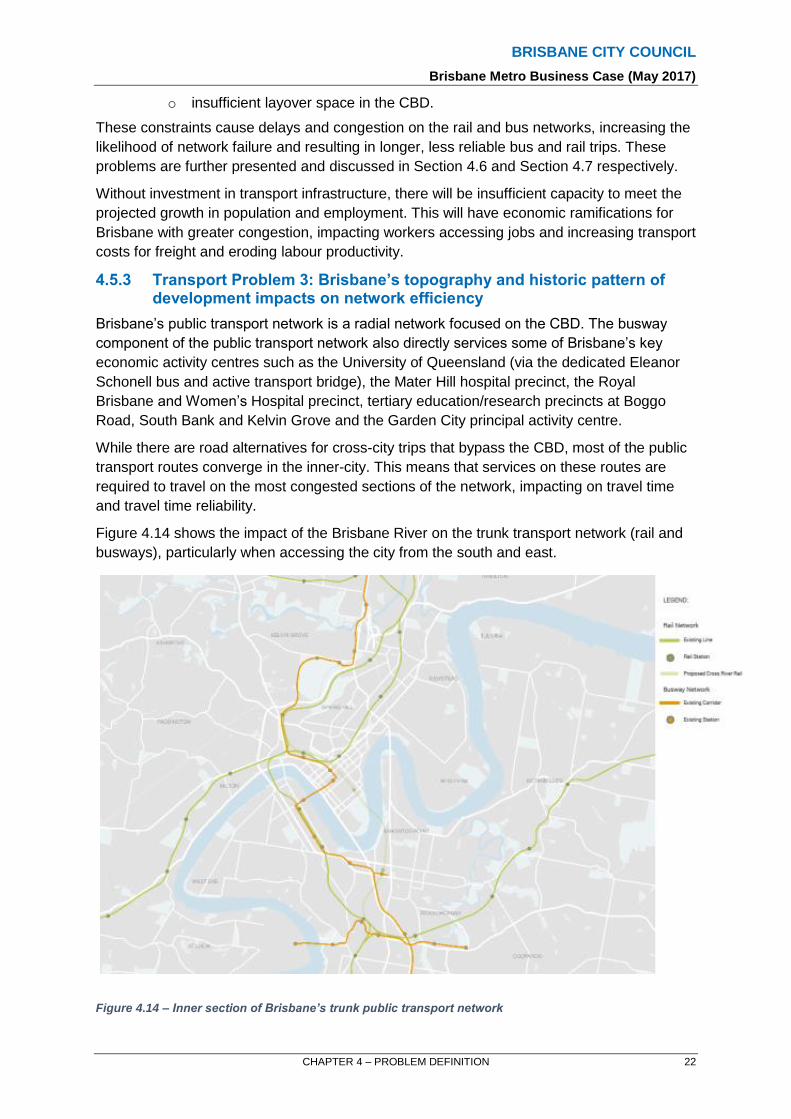
Figure 4.14 shows the impact of the Brisbane River on the trunk transport network (rail and
busways), particularly when accessing the city from the south and east.
Figure 4.14 – Inner section of Brisbane’s trunk public transport network

BRISBANE CITY COUNCIL
Brisbane Metro Business Case (May 2017)
CHAPTER 4 – PROBLEM DEFINITION 23
Historic development of the transport network over the last 45 years between areas south of
the Brisbane River and the Brisbane CBD (located on the north side of the river) has
provided improved accessibility for growth areas to the south and south-east of Brisbane.
Key initiatives such as the opening of the Captain Cook Bridge in 1972 and the Merivale
Bridge (opened in 1978) have improved cross-river bus and rail travel. Prior to these bridges
all train services terminated at South Brisbane while all buses used the Victoria or Story
Bridges.
The South East Busway, opened and progressively developed since 2000, including its
dedicated use of part of the Victoria Bridge, has significantly increased bus connectivity from
the south-east and facilitated strong patronage growth. However, the barrier effect of the
Brisbane River and limited crossings to the CBD results in inherent indirectness in public
transport routing, and also presents operational efficiency constraints for public transport
services. Currently for buses, the majority of services accessing the city from the south and
southeast must use either the Captain Cook Bridge, which is subject to increasing traffic
congestion, or for busway services, the Victoria Bridge. All rail services need to travel via the
Merivale Bridge to cross the river.
These infrastructure constraints for public transport and the flexibility and convenience
offered by private car travel can make the latter a more attractive option for access to the
CBD and increase the challenges in providing growth in public transport service levels to
cater for sustained growth in travel demand to the CBD from the south.
4.5.4 Transport Problem 4: Inefficient supply chains for freight
Commercial vehicle trips for the Brisbane Statistical Division are forecast to increase by 67
per cent, with average commercial vehicle speeds forecast to reduce from 65 km/h in 2016
to 46 km/h in 204126.
The forecast reduction in vehicle speeds demonstrates the impact of growing congestion on
the region’s transport network, with impacts for freight vehicles exacerbated on road
corridors and cross-river linkages serving the CBD if public transport does not provide a
viable travel mode for commuters. This will further result in increased operating costs for
freight vehicles as well as reduced productivity. Commercial vehicle impacts will also be felt
in the CBD where physical road network constraints mean that there is conflict for kerbside
allocation between buses and space allocated for deliveries to businesses.
Supply chains are also impacted by reduced labour productivity. As previously discussed
under the strategic problems above, achieving the benefits of agglomeration relies on good
accessibility and connectivity, especially for commuting journeys. With the highest population
growth occurring in the outer suburbs and increasing congestion, commuting journeys are
becoming longer in both distance and time and are also becoming less reliable.
26 Brisbane Metro Transport Model (2017)

BRISBANE CITY COUNCIL
Brisbane Metro Business Case (May 2017)
CHAPTER 4 – PROBLEM DEFINITION 24
4.6 Bus Problems
The Brisbane bus network is an important component of SEQ’s public transport system.
Two-thirds of public transport users are bus users with more than 76 million passenger trips
in 2015-2016. Brisbane’s bus network moves 24 million more customers each year than the
entire rail network in SEQ.
Brisbane’s busway network spans 25 kilometres of segregated busway and provides 20
high-frequency routes which operate on 15 minute frequencies or better from 6.00am to
11.30pm (7 days a week), with minimum 10 minute frequencies during peak times (7 to 9am
and 4 to 6pm), transporting customers throughout the major metropolitan area surrounding
Brisbane. In peak hour, 372 buses per hour (one every 10 seconds) pass the busway
network's busiest point at Woolloongabba.
Since the opening of the South East Busway to Eight Mile Plains in 2001, busway projects in
SEQ over the past 15 years have focused on linking key destinations such as UQ St Lucia
campus and the RBWH at Herston, and serving corridors that are not well serviced by rail,
such as the Old Cleveland Road and Lutwyche/Gympie Road corridors, thereby increasing
public transport accessibility. Consequently, the success in patronage confirms the busway
network as a prime example of best practice in Bus Rapid Transit (BRT).
In a high level benchmarking exercise using the database of the BRT Centre of Excellence27
in 2015, Brisbane’s South East Busway was ranked eighth in the world in terms of vehicle
frequency (buses per hour in the peak direction) and the highest frequency segregated
busway in the world. It was ranked 20th in the world for peak hour peak direction passenger
volumes.
Table 4.4 provides an overview of the identified bus problems, root causes and effects for
the SEQ region and the inner-city of Brisbane.
27 Bus Rapid Transit Centre of Excellence is a Centre of Excellence for Bus Rapid Transit Studies implemented in Santiago, Chile, and financed by the Volvo Research and Educational Foundations.

BRISBANE CITY COUNCIL
Brisbane Metro Business Case (May 2017)
CHAPTER 4 – PROBLEM DEFINITION 25
BUS PROBLEMS ROOT CAUSES EFFECTS
Role of bus is understated and multi-faceted
Historical development of Brisbane’s public transport network as a combination of radial rail and dedicated busway.
Land-use changes including densification within the inner suburbs.
Growth in the inner-city distribution role of bus due to expanding footprint of CBD and city frame.
Patterns of travel, demand and mode share in Brisbane are different to other capital cities. Elements of the bus network (particularly post Busway construction) provide a high order transport function within the integrated multi-modal public transport network.
Buses must serve some very significant travel generators and economic activity centres which are not directly served by rail (e.g. principal activity centres - Garden City, Chermside, Carindale; University of Queensland; Royal Brisbane Hospital).
Buses perform a complex and understated function within Brisbane’s public transport network serving many needs including direct suburban commuting, feeder role to rail nodes and inner-city distribution functions.
Need to meet community service obligations.
Social inclusion and equity of access considerations.
Obligations of government.
Bus network design includes coverage services to address social inclusion and equity of access for all members of the community.
Lack of understanding of differences between Brisbane’s rail and bus markets.
Perception that bus competes with rail:
o Buses feeding to rail philosophy is often adopted elsewhere, but not directly transferable to Brisbane due to strength of busway backbone in the integrated network
o Practicalities of implementing a ’hard’ bus feeding rail philosophy have not been considered
o Limited opportunities for good integration without infrastructure.
Integrated public transport system development can at times be overshadowed by the perception that buses compete with rail.
Sustained growth and demand
Increased pressure to serve public transport future demand for CBD access from growth in outer suburbs of Brisbane, to offer sustainable alternative to car travel.
Population growth in outer areas with limited employment self-sufficiency.
Rapidly growing need to serve future demand for inner-city distribution and business to business trips within the inner suburbs where car ownership is lower, parking constraints exist etc.
Population and employment growth in higher density inner areas.
Capacity constraints limit potential growth of bus services
Connections to and from the Victoria Bridge, Melbourne Street Portal, Allen Street and access to the Pacific Motorway constrained.
Pragmatic limitations of investing in future proofing during busway construction have left legacy issues for capacity.
River crossing capacity is a critical constraint.
Public resistance to implementing travel demand management measures.
One-way street system within CBD and inner-city limits available kerb space for bus stops and impacts legibility.
Infrastructure bottlenecks constrain growth.
Station capacity, in terms of platform lengths, operations and people movement, constrains growth.

BRISBANE CITY COUNCIL
Brisbane Metro Business Case (May 2017)
CHAPTER 4 – PROBLEM DEFINITION 26
BUS PROBLEMS ROOT CAUSES EFFECTS
Significant role of Adelaide Street and Elizabeth Street for bus movements.
Competition for kerbside space with delivery vehicles.
One-way street system limits available kerb space for bus stops.
Limited CBD kerbspace restricts ability to lengthen existing or create new stops.
Degrading journey times and reliability
As travel demand grows and capacity is exceeded in peaks, congestion will increase.
Unplanned incidents worsen existing peak congestion.
Buses must mix with general traffic on roads and at intersections with the busway.
Congestion results in bus bunching and late running buses for the start of services.
With predicted population and employment growth, congestion on the road network will continue to increase.
Congestion affects bus reliability and travel time performance, particularly for buses operating on roads.
Unreliable travel times for road based public transport and transport network congestion impact productivity with flow-on effects to the region's economy.
Increasing travel time impacts leisure time and lifestyle.
Increased journey times for workers impacts productivity and affects supply chains.
Network and operational inefficiencies impact capacity and dwell times
Customer demands occur via the CBD due to limited cross-town suburban connectivity.
Duplication and network complexity result in operational inefficiencies.
Inadequate space for bus depots and lack of inner-city layover results in inefficient route operations.
Service duplication occurs on the most critical parts of the network and at the most constrained stations.
Interaction of drivers with customers for fare collection and revenue protection and responding to customer enquiries.
Inefficient dwell times due to single-door boarding and on bus payment and validation.
Drivers wait for straggling customers.
Insufficient public transport information is available or it is not user-friendly.
Policy settings and other operational practices can lead to inefficiencies that impact adversely on servicing and infrastructure.
Lead stop arrangements create congestion for customers on station platforms and delays to buses accessing stops.
Stop layouts create boarding inefficiencies and platform congestion
Worsening amenity in the inner-city
Employment and population growth continues to drive demand for travel through and within the CBD and inner Brisbane.
Increasing traffic congestion in inner-city for both bus and other vehicles
Competing role of local streets to service transport demand and provide a pedestrian and public space function.
Large number of service stops in CBD, particularly along Adelaide and Elizabeth Streets.
Visual amenity impacts from congestion and large bus queues on Victoria Bridge, at Melbourne Street portal and in the CBD
Table 4.4 – Bus problems for SEQ and Brisbane

BRISBANE CITY COUNCIL
Brisbane Metro Business Case (May 2017)
CHAPTER 4 – PROBLEM DEFINITION 27
4.6.1 Bus Problem 1: Role of bus is understated and multi-faceted
The Brisbane public transport market is different to Sydney and Melbourne. The rail
networks in both these cities have greater geographical coverage than the rail network in
Brisbane, where the busway network, progressively developed since 2000, has
supplemented the traditional radial line haul role of rail within the public transport network.
Therefore, bus has a more significant role in the public transport network in Brisbane than in
other major cities.
National census statistics for the 15 year period (from 1996 to 2011) for the Greater
Brisbane Area (and extrapolation to 2016 using ticketing data) show that the volume of
people commuting by public transport has increased on average by 4.1per cent per annum
(82 per cent over 15 years), with bus patronage increasing more rapidly than rail since 2001
(6.2 per cent per annum for bus compared to 4.0 per cent per annum for rail).
Employment increased by 55 per cent over the same 15 year period, which accounts for a
large part of the growth in public transport trips. Other factors supporting this period of public
transport growth include increasing road congestion and parking charges, the new ticketing
and fare system introduced in the mid-2000s, improvements to public transport services and
changing trip patterns (i.e. longer peak period trips) associated with the growing metropolitan
fringe areas.
Figure 4.15 summarises the comparison in mode growth from 1996 to 2016.
Figure 4.15 – Observed growth in Greater Brisbane public transport use, 1996 to 201628
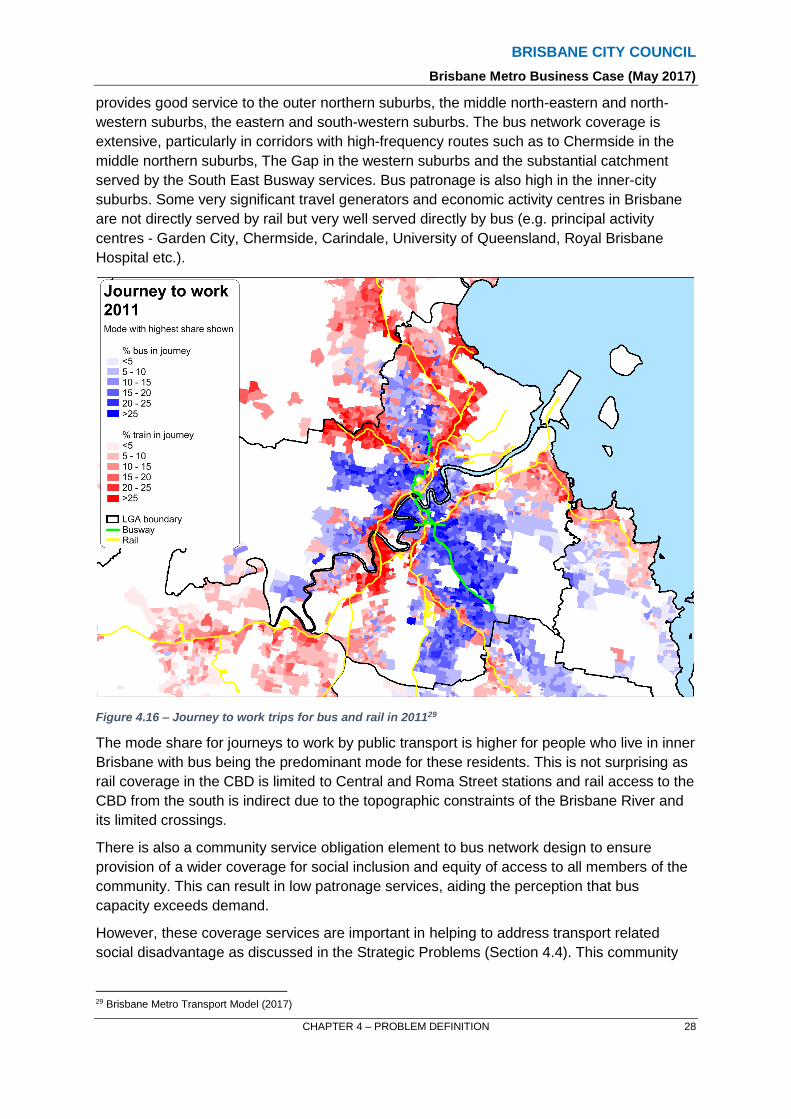
The bus network is vital for serving areas that do not have good access to rail, and the
busway offers a high-quality customer experience with dedicated public transport
infrastructure. Figure 4.16 shows the rail and bus catchments for journeys to work in
Brisbane. Rail trips are highly concentrated in a narrow band along the rail corridors. Rail
28 1996 to 2011, Australian Census; 2011 to 2016 – TransLink GoCard ticket data
BRISBANE CITY COUNCIL
Brisbane Metro Business Case (May 2017)
CHAPTER 4 – PROBLEM DEFINITION 28
provides good service to the outer northern suburbs, the middle north-eastern and north-
western suburbs, the eastern and south-western suburbs. The bus network coverage is
extensive, particularly in corridors with high-frequency routes such as to Chermside in the
middle northern suburbs, The Gap in the western suburbs and the substantial catchment
served by the South East Busway services. Bus patronage is also high in the inner-city
suburbs. Some very significant travel generators and economic activity centres in Brisbane
are not directly served by rail but very well served directly by bus (e.g. principal activity
centres - Garden City, Chermside, Carindale, University of Queensland, Royal Brisbane
Hospital etc.).
Figure 4.16 – Journey to work trips for bus and rail in 201129
The mode share for journeys to work by public transport is higher for people who live in inner
Brisbane with bus being the predominant mode for these residents. This is not surprising as
rail coverage in the CBD is limited to Central and Roma Street stations and rail access to the
CBD from the south is indirect due to the topographic constraints of the Brisbane River and
its limited crossings.
There is also a community service obligation element to bus network design to ensure
provision of a wider coverage for social inclusion and equity of access to all members of the
community. This can result in low patronage services, aiding the perception that bus
capacity exceeds demand.
However, these coverage services are important in helping to address transport related
social disadvantage as discussed in the Strategic Problems (Section 4.4). This community
29 Brisbane Metro Transport Model (2017)

BRISBANE CITY COUNCIL
Brisbane Metro Business Case (May 2017)
CHAPTER 4 – PROBLEM DEFINITION 29
service obligation comes at a cost. Low density development in much of suburban Brisbane
also leads to poor operating cost recovery for public transport due to low occupancy per
kilometre travelled, increasing the need for government subsidies for coverage services,
which, by their nature, provide at best an ‘adequate’ level of service.
Therefore, in Brisbane, bus transit performs a multi-faceted role within an integrated public
transport system. Key elements of this role include offering an inner-city distribution function
supplementing the active transport networks; performing a radial line haul role filling gaps in
the region’s public transport network for corridors that are not well served by rail, and also in
several key locations providing feeder service to rail from key economic activity centres not
located directly on the rail network (for example, University of Queensland to Indooroopilly
and Toowong rail stations).
4.6.2 Bus Problem 2: Sustained growth and demand
Increasing population growth and demand in Brisbane will require high-capacity public
transport. Due to the forecast increases in travel demand from population and employment
growth, the demand for bus travel is anticipated to grow. Table 4.5 shows the forecast
growth in bus patronage total boardings for the Brisbane Statistical Division.
TIME PERIOD
2016 2031 2041
Bus Users Bus Users Growth (from 2016)
Bus Users Growth (from 2031)
Morning 2 hour peak (7.00am-9.00am)
90,900 143,000 57% 177,300 24%
Morning 2 hour peak (4.00pm-6.00pm)
75,700 116,200 54% 148,700 28%
Daily 368,200 580,800 58% 736,800 27%
Table 4.5 – Growth in bus travel demand in the Brisbane Statistical Division30
This shows forecast bus patronage doubling from 2016 to 2041, growing to over 730,000
bus customers per day in 2041.
Many sections of the busway network are currently operating at capacity with access to the
inner-city restricted by bus station and kerbside capacity. Inner-city streets used by buses
are also congested during peak periods. These constraints are discussed in more detail in
the next section.
The anticipated growth in demand for bus transit cannot be accommodated without further
investment in the bus network such as:
Additional and/or larger bus fleet to meet the demand without serious overcrowding. Any increase in peak period fleet use would also require more drivers and additional depot space for stabling and maintenance.
Additional bus station and inner-city stop capacity where issues already exist.
Additional cross-river capacity to access the CBD from the south and east due to existing constraints.
Travel demand management and operational efficiency measures may provide short term
relief; however, the tipping point will soon be reached where the current system will not be
30 Brisbane Metro Transport Model (2017)

BRISBANE CITY COUNCIL
Brisbane Metro Business Case (May 2017)
CHAPTER 4 – PROBLEM DEFINITION 30
able to accommodate any more buses. Therefore, without infrastructure and fleet
investment, it would be very challenging to meet the future bus demand.
4.6.3 Bus Problem 3: Capacity constraints limit potential growth of bus services
Infrastructure constraints on critical sections of the busway and road network limit throughput
and control capacity. The majority of services from the south-east are required to pass
through the Woolloongabba merge and then cross the river for access to the CBD with the
majority of these services using the Victoria and Captain Cook Bridges.
Already the South East Busway at the Woolloongabba junction is carrying around 12,000
customers inbound per hour in the morning peak in 2016. This compares to around 6,500 on
the rail lines approaching from the south (namely Cleveland, Beenleigh and Gold Coast
lines), highlighting the critical line haul role that bus plays in this part of the public transport
network in particular. Figure 4.17 provides a graphical summary of the inbound customer
numbers on the critical bus and rail network lines.
Figure 4.17 – Inbound morning peak passenger volumes on key rail and bus routes
However, bus movements via Victoria Bridge are already constrained by the intersection
capacity at each end of the bridge (with North Quay and Grey Street), and by the capacity of
Cultural Centre station, while bus movements on the Captain Cook bridge are impacted by
general traffic congestion, in particular on the off ramps leading into the CBD itself.
Furthermore, inner sections of the South East Busway are constrained by station capacity at
peak times, which is influenced by bus dwell times, platform lengths and stopping
arrangements. Station capacity constraints are emerging at key busway stations such as

BRISBANE CITY COUNCIL
Brisbane Metro Business Case (May 2017)
CHAPTER 4 – PROBLEM DEFINITION 31
Cultural Centre, Mater Hill and South Bank stations. This causes undesirable bus queuing
on station approaches in the busway network and on the Victoria Bridge as buses wait for
platform space.
The Cultural Centre busway station, a key determinant of capacity across Victoria Bridge,
already operates over capacity in peak periods as shown in Figure 4.18 and Figure 4.19.
Figure 4.18 – Northbound daily bus volumes/capacity at Cultural Centre Busway Station

BRISBANE CITY COUNCIL
Brisbane Metro Business Case (May 2017)
CHAPTER 4 – PROBLEM DEFINITION 32
Figure 4.19 – Southbound daily bus volumes/capacity at Cultural Centre Busway Station
Overall, the approach to the CBD for buses from the south along with river crossing capacity
present as the most critical areas of constraint.
The Captain Cook Bridge is predominantly used by peak period services. However, since
the Victoria Bridge reached capacity around 2008, all bus service growth from the southern
and eastern suburbs has been accommodated on the Captain Cook Bridge, which is heavily
congested with car traffic.
Table 4.6 shows the volume of buses already exceeds capacity on key links in the morning
peak period which results in queueing and delays.
LINK VOLUME (BUSES/HOUR)*
2016
CAPACITY** VOLUME/ CAPCITY RATIO
South East Busway (between Woolloongabba junction and Allen Street exit)
375 300 125%
Captain Cook Bridge 220 250 88%
Elizabeth Street 220 120 183%
Victoria Bridge 225 180 125%
Adelaide Street (northbound) 155 120 128%
* All buses that have their final stop in CBD between 7.30am and 8.30am
** Per lane including capacity of stations/stops on corridors
Table 4.6 – Bus volume/capacity ratios on key links – AM peak one hour bus volumes in 2016
There are also significant issues, in terms of both space and congestion, on core CBD
streets such as Elizabeth streets, and new platform constraints are emerging at King George
Square and Roma Street busway stations.

BRISBANE CITY COUNCIL
Brisbane Metro Business Case (May 2017)
CHAPTER 4 – PROBLEM DEFINITION 33
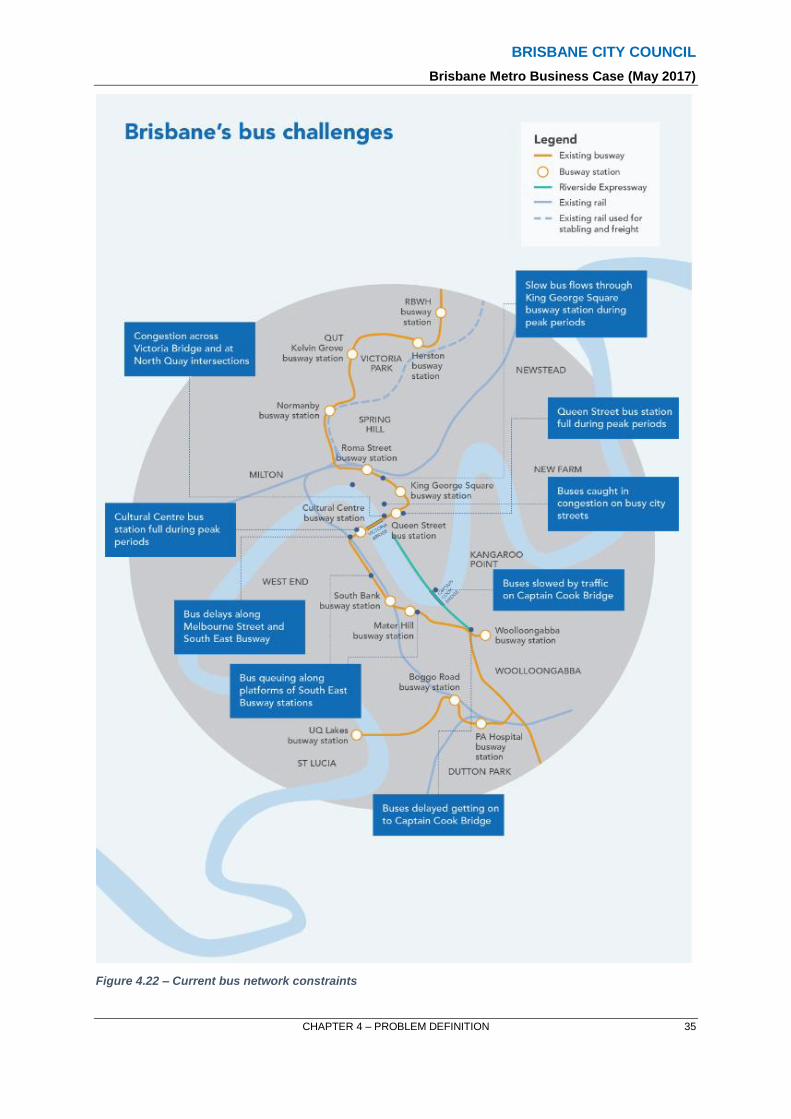
Images of current bus congestion at Cultural Centre station and queuing in the busway are
shown in Figure 4.20 and Figure 4.21. A plan of the current bus network constraints is
shown in Figure 4.22.

BRISBANE CITY COUNCIL
Brisbane Metro Business Case (May 2017)
CHAPTER 4 – PROBLEM DEFINITION 34
Figure 4.20 – Bus congestion at Cultural Centre busway station
Figure 4.21 – Buses queuing at the Melbourne Street busway portal
BRISBANE CITY COUNCIL
Brisbane Metro Business Case (May 2017)
CHAPTER 4 – PROBLEM DEFINITION 35
Figure 4.22 – Current bus network constraints

BRISBANE CITY COUNCIL
Brisbane Metro Business Case (May 2017)
CHAPTER 4 – PROBLEM DEFINITION 36
4.6.4 Bus Problem 4: Degrading journey times and reliability
Traffic congestion caused by unplanned incidents or by excessive demand relative to road
capacity is increasing, affecting bus reliability and travel time performance. With predicted
population and employment growth, congestion on the road network will continue to
increase, impacting on travel time for business and leisure time for residents and visitors,
with flow-on to the region's economy and lifestyle.
Variability in travel times is an indication of reducing reliability. A comparison of actual
boarding and alighting times from go card data and scheduled travel times for a key journey
between Buranda and King George Square busway stations for morning and evening peak
periods shows how highly variable actual travel times are. Figure 4.23 and Figure 4.24
provides a graphical summary of this comparison.
Figure 4.23 – 2016 Travel time between Buranda Busway Station and King George Square (peak
direction)
Figure 4.24 – 2016 travel time between Buranda busway station and King George Square (peak direction)
– peak 2 hour period

BRISBANE CITY COUNCIL
Brisbane Metro Business Case (May 2017)
CHAPTER 4 – PROBLEM DEFINITION 37
A range of detrimental outcomes are anticipated to result from these forecast deteriorating
operating conditions, including:
Uneven loading of services and inefficient use of capacity as a result of ‘bus bunching’, where services catch up to each other with the first bus overcrowded and following buses under-utilised.
Cumulative flow-through impacts for operations, such as buses being late for the start of their next service.
An increase in the relative cost of operating bus services. Degrading travel times mean more fleet and driver hours will be required to maintain the same service frequencies over time.
Degradation of customer experience, especially for standing customers in stop/start conditions.
4.6.5 Bus Problem 5: Network and operational inefficiencies impact capacity and dwell times
Some aspects of current network planning and operations have an impact on the efficient
running of the network.
The current single-seat network planning philosophy, coupled with the need to provide
coverage services to meet community service obligations, duplication of services using the
constrained inner parts of the busway network in peak hours add to congestion and
contribute to delays for all services.
Furthermore, the current complex arrangement of bus routes and stopping patterns including
multiple overlapping peak rocket and all day routes on the one corridor can result in uneven
loadings between services. This is particularly evident in the evening peak where different
bus services to the same corridor often leave from different CBD stops or stations.
Limited frequent and attractive cross-town connectivity can also result in increased reliance
on the CBD and the inner-city for transfers that might otherwise be possible at suburban or
regional centres. This impacts on the number of customers using critical and congested
inner-city corridors and stations contributing to capacity constraints.
Within the CBD, one-way streets also present challenges to efficient bus operations since
they preclude access to that part of the city from both directions, eliminate large sections of
kerb space from potential use as bus stops, and require return services to operate from
different streets, reducing legibility. Furthermore, a lack of inner-city layover is also
contributing to inefficient bus operations, resulting in increased dead running.
Lastly, at key stations such as Cultural Centre, a range of boarding and ticketing practices
impact on dwell times and ultimately the operational efficiency and hence capacity of the bus
network. For example, bus drivers are often involved in fare collection and revenue
protection and responding to customer enquiries, resulting in delays and reducing bus
throughput at stops. In addition, customers are generally required to board from one door
only, due to current revenue protection requirements, increasing the time taken to load a
bus. Lastly, buses stop at different points on the platform or kerb, requiring customers to
negotiate past other waiting or boarding customers, creating platform congestion and
reducing the capacity of stations.

BRISBANE CITY COUNCIL
Brisbane Metro Business Case (May 2017)
CHAPTER 4 – PROBLEM DEFINITION 38
4.6.6 Bus Problem 6: Worsening amenity in the inner-city
Bus services can face severe congestion in the inner-city, which not only impacts on travel
times and reliability (as discussed in Section 4.6.4) but also detracts from the amenity of the
CBD streets. Buses are not only impacted by this congestion, but due to their size and need
to service surface bus stops, are also major contributors to the congestion. In particular, bus
congestion is very evident along Adelaide and Elizabeth Streets in the morning peak period,
due to the high volumes of services travelling from northern and western suburbs, and over
Captain Cook Bridge.
Due to the high volume of buses along the busways, there are also substantial amenity
impacts at Cultural Centre, along Victoria Bridge and along Melbourne Street. The
movement of buses from the South East busway portal on Melbourne Street to and from the
station severely constrains pedestrian movement in the precinct, and detracts from the
important east-west connection between the CBD and West End.
As employment and population continues to grow within inner Brisbane, the demand for
travel through and within the CBD and inner Brisbane will increase, leading to increased
vehicular congestion and further impacts on amenity. However, as population and
employment density increases in the inner-city neighbourhoods, the importance of public
space and amenity also rises. Local streets need to serve both transport and public space
functions. Residents and workers will increasingly shop, walk, meet and relax in local streets
and spaces.
Widening roads and increasing traffic volumes will not be compatible with these aspirations
for vibrant neighbourhoods. New public transport infrastructure will need to integrate well
with surrounding streets and public spaces and respect the increasing importance of their
place functions.

BRISBANE CITY COUNCIL
Brisbane Metro Business Case (May 2017)
CHAPTER 4 – PROBLEM DEFINITION 39
4.7 Rail Problems
The SEQ rail network spans almost 810 kilometres of track, through 11 lines and over 150
stations that transport customers and freight traffic throughout the major metropolitan area
surrounding Brisbane. With the opening of the Redcliffe Peninsula line in 2016, a further six
stations have been added to the network.
Even with operational efficiencies such as timetable improvements and signalling upgrades,
and the introduction of New Generation Rollingstock, the current inner rail network is
approaching capacity for service volumes.
Rail projects in SEQ over the past 15 years have focused on extensions or modifications to
the network outside of the inner-city including the Redcliffe Peninsula Line, Keperra to Ferny
Grove duplication, Corinda to Darra upgrade, Caboolture to Beerburrum duplication, the new
Darra to Springfield line and the extension of the Gold Coast line from Robina to Varsity
Lakes, thereby increasing usage of the passenger rail network and adding more pressure to
the congested inner-city network including stations.
As discussed in Chapter 2, the proposed Cross River Rail (CRR) Project is being developed
by the Queensland Government to improve the capacity of the rail network.
Table 4.7 provides an overview of the identified rail problems, root causes and effects for the
SEQ region and the inner-city of Brisbane. Note that the analysis describes the rail network
problems as they exist today, without the implementation of Queensland Government
planned initiatives such as CRR and ETCS – Inner City.
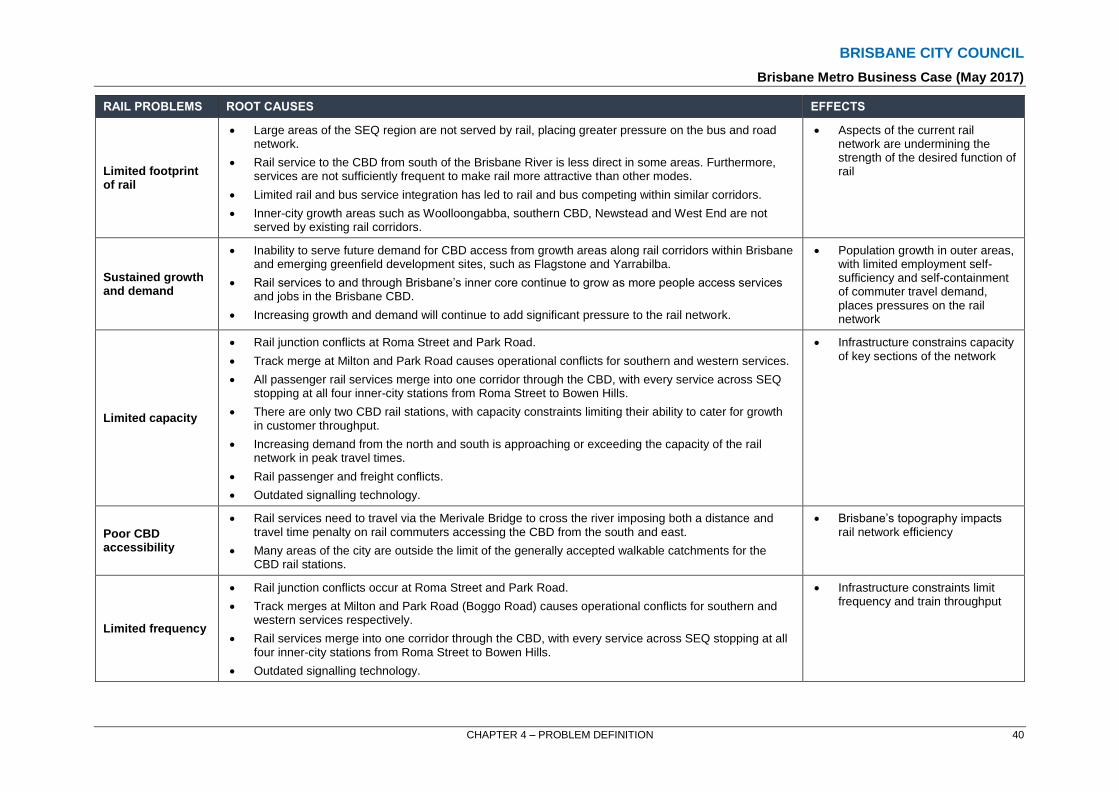
BRISBANE CITY COUNCIL
Brisbane Metro Business Case (May 2017)
CHAPTER 4 – PROBLEM DEFINITION 40
RAIL PROBLEMS ROOT CAUSES EFFECTS
Limited footprint of rail
Large areas of the SEQ region are not served by rail, placing greater pressure on the bus and road network.
Rail service to the CBD from south of the Brisbane River is less direct in some areas. Furthermore, services are not sufficiently frequent to make rail more attractive than other modes.
Limited rail and bus service integration has led to rail and bus competing within similar corridors.
Inner-city growth areas such as Woolloongabba, southern CBD, Newstead and West End are not served by existing rail corridors.
Aspects of the current rail network are undermining the strength of the desired function of rail
Sustained growth and demand
Inability to serve future demand for CBD access from growth areas along rail corridors within Brisbane and emerging greenfield development sites, such as Flagstone and Yarrabilba.
Rail services to and through Brisbane’s inner core continue to grow as more people access services and jobs in the Brisbane CBD.
Increasing growth and demand will continue to add significant pressure to the rail network.
Population growth in outer areas, with limited employment self-sufficiency and self-containment of commuter travel demand, places pressures on the rail network
Limited capacity
Rail junction conflicts at Roma Street and Park Road.
Track merge at Milton and Park Road causes operational conflicts for southern and western services.
All passenger rail services merge into one corridor through the CBD, with every service across SEQ stopping at all four inner-city stations from Roma Street to Bowen Hills.
There are only two CBD rail stations, with capacity constraints limiting their ability to cater for growth in customer throughput.
Increasing demand from the north and south is approaching or exceeding the capacity of the rail network in peak travel times.
Rail passenger and freight conflicts.
Outdated signalling technology.
Infrastructure constrains capacity of key sections of the network
Poor CBD accessibility
Rail services need to travel via the Merivale Bridge to cross the river imposing both a distance and travel time penalty on rail commuters accessing the CBD from the south and east.
Many areas of the city are outside the limit of the generally accepted walkable catchments for the CBD rail stations.
Brisbane’s topography impacts rail network efficiency
Limited frequency
Rail junction conflicts occur at Roma Street and Park Road.
Track merges at Milton and Park Road (Boggo Road) causes operational conflicts for southern and western services respectively.
Rail services merge into one corridor through the CBD, with every service across SEQ stopping at all four inner-city stations from Roma Street to Bowen Hills.
Outdated signalling technology.
Infrastructure constraints limit frequency and train throughput

BRISBANE CITY COUNCIL
Brisbane Metro Business Case (May 2017)
CHAPTER 4 – PROBLEM DEFINITION 41
RAIL PROBLEMS ROOT CAUSES EFFECTS
Reduced reliability and resilience
Despite mitigation measures (such as timetable refinement and dwell time management initiatives), as available capacity is utilised reliability will deteriorate, with minor delays, such as the increased dwell times required for boarding and alighting in overcrowded conditions having the potential to cumulatively escalate into significant network-wide impacts (i.e. limited and decreasing network resilience).
Without an infrastructure or rail systems solution (such as CRR or ETCS Level 2) to increase line capacity to allow higher frequency services, peak period service performance on the passenger rail network is forecast to decline, resulting in significant reductions in service reliability and increased overcrowding.
Network reliability is impacted by both planned and unplanned events, planned being scheduled track closures, and unplanned including adverse weather conditions such as storms and flooding.
Increasing service demand limits capacity with flow-on effects for reliability of services and resilience
Journey times and cost
Rail services into the Brisbane CBD from the east and south are indirect, due to routing via the Merivale Bridge to cross the river resulting in a distance and time disadvantage for rail commuters accessing the CBD.
Brisbane’s existing rail network does not fulfil a strong inner-city distributor function and must rely on transfers to bus or active modes to reach many inner-city areas and travel generators not served directly by existing rail stations.
Rail does not offer a competitive travel time alternative to road travel due to indirect CBD access from the south and east
Table 4.7 – Rail problems for SEQ and Brisbane

BRISBANE CITY COUNCIL
Brisbane Metro Business Case (May 2017)
CHAPTER 4 – PROBLEM DEFINITION 42
4.7.1 Rail Problem 1: Limited footprint of rail
Compared to other major Australian cities, Brisbane’s rail network has limited capacity and
coverage, particularly within the Brisbane CBD. In part, this is due to limited river crossings
and limited number of inner-city stations. Figure 4.25 compares the SEQ rail network to the
Melbourne and Sydney networks.
Figure 4.25 – SEQ Rail Network compared to Melbourne and Sydney
The fixed nature of the current rail network limits its ability to serve growth catchments for
public transport. Key growth areas not directly served by rail include densification in the
southern CBD, West End, Newstead/Teneriffe and Northshore Hamilton Priority
Development Area (PDA) as well as outer suburban growth such as at Flagstone and
Yarrabilba. This growth will place greater pressure on the bus and road network.
Furthermore, rail services to and from south of the Brisbane River offer a somewhat indirect
line of travel to the CBD via the Merivale Bridge.
4.7.2 Rail Problem 2: Sustained growth and demand
Despite densification within the inner-city, significant population growth is expected to occur
outside Brisbane’s inner-city, which, coupled with substantial growth in employment in the
inner-city and CBD is set to grow the transport task substantially. Public transport enables
economic growth by getting people to their place of employment, education or other activity
centres (as discussed in Section 4.4.2). Increasing growth and demand will continue to add
significant pressure to the rail network, and without major investment in the inner-city, there
will not be room for more trains and current trains will become increasingly crowded31.
Rail services to and through Brisbane’s inner core continue to grow as more people across
the region access services and jobs in the region’s primary activity centre. Based on current
forecasts, future demand for CBD access for rail from growth areas along rail corridors within
Brisbane and emerging greenfield development sites, such as Flagstone and Yarrabilba, will
be unable to be met.
4.7.3 Rail Problem 3: Limited capacity
Around 80 per cent of morning peak trips to work in the Brisbane CBD are made by public
transport32. Rail boardings occur on 36 per cent of the total 558,000 average weekday public
31 South East Queensland’s Rail Horizon, 2016 32 Household Travel Survey 2009-2011

BRISBANE CITY COUNCIL
Brisbane Metro Business Case (May 2017)
CHAPTER 4 – PROBLEM DEFINITION 43
transport trips in Greater Brisbane33. The Gold Coast – Brisbane corridor is Australia’s
busiest inter-city rail commuter corridor34. Long-distance trains from the Gold Coast all use a
single inbound line across the Merivale Bridge and through the CBD to Bowen Hills, which is
shared with suburban services from the Beenleigh and Cleveland lines.
The South East Queensland’s Rail Horizon report, released by the Queensland Government
in 2016, states that rail junction conflicts at Roma Street and Park Road and a track merge
at Milton and Park Road add extra constraints for southern and western services by causing
operational conflicts. Through the CBD, all rail services merge into one corridor, with every
service across SEQ stopping at all four inner-city stations from Roma Street to Bowen Hills.
The city centre is the most popular commuter destination on the regional public transport
network yet there are only two CBD rail stations. Figure 4.26 shows the key inner-city
capacity constraints inhibiting the rail network’s ability to meet the need for CBD access.
Figure 4.26 – Existing inner-city rail network constraints35
4.7.4 Rail Problem 4: Poor CBD accessibility
Beyond having an appropriate level of capacity (and other critical factors in meeting the
needs of the customer), rail stations need to be adequately located to ensure destinations
are easily accessible. Generally, a walking catchment of 400 metres around a quality public
transport station or stop is considered attractive for customers. Although customers’
preparedness to walk this distance may increase with the quality of the service (for example,
express rail) the walking distances start to become a limiting factor beyond 800 metres and
by one kilometre the service may be considered only marginally attractive. For Brisbane’s
CBD, the topography and the historical development of the public transport system results in
many areas of the city being outside the limit of the generally accepted walkable catchments.
33 Brisbane Metro Transport Model (2017) 34 The Gold Coast's seductive lifestyle underpins rise of extreme commuting, KPMG 2013 35 South East Queensland’s Rail Horizon, 2016
BRISBANE CITY COUNCIL
Brisbane Metro Business Case (May 2017)
CHAPTER 4 – PROBLEM DEFINITION 44
The Brisbane rail network passes across the northern end of the CBD, providing good
access to the northern areas, but there are considerable walking distances from major
activity centres such as the City Botanic Gardens, River Stage, and Queensland University
of Technology (Gardens Point campus) as well as new growth areas (1 William Street and
Queen’s Wharf Brisbane) in the southern areas of the CBD. Brisbane rail customers wishing
to travel to and from the southern end of the CBD must walk from either Central station (up
to 1.2 kilometres), or from South Brisbane or South Bank stations across the river.
4.7.5 Rail Problem 5: Limited frequency
The ability to improve rail service frequency levels is currently limited due to a range of
infrastructure constraints. As a result, the rail network cannot offer a true ‘turn-up-and-go’
level of service. Capacity assessments suggest the number of paths available during peak
times is limited to 20 trains per hour (tph) per direction on the main line (Caboolture–Ipswich
sector) and 24 tph per direction for suburban lines (Merivale Bridge sector). It is forecast that
by around 2021 demand for rail services in the peak periods will be at or beyond the
capacity of the existing key inner-city corridors.
As noted under the Capacity problem (Section 4.7.3), the rail system is also increasingly
constrained by inner-city track and platform capacity issues with continuing growth in travel
to the CBD.
4.7.6 Rail Problem 6: Reduced reliability and resilience
The complex nature of rail network operations causes rail network operators to consider the
concept of reliability when defining the capacity of the system. That is, once the minimum
acceptable level of reliability is defined, there will be a flow-on impact on the operational
capacity of the system under that adopted standard. This may be less than the absolute
capacity of the system that can be achieved when all factors are working towards an optimal
outcome for rail operations.
Once the reliability requirements are factored in, the number of services that can be
operated under that regime, during a defined period, will define rail track capacity. As such,
the key issues with future rail network capacity are as follows:
As service frequency increases towards maximum capacity, the reliability of services can deteriorate rapidly across the whole network, due to the way rail operations need to be managed. As the capacity is utilised, despite mitigation measures, reliability is expected to continue to deteriorate, with minor delays, such as the increased dwell times required for boarding and alighting in overcrowded conditions having the potential to cumulatively escalate into significant impacts.
Without an infrastructure or rail systems solution boosting line capacity to allow higher frequency services, peak period service performance on the passenger rail network is forecast to decline, resulting in significant reductions in service reliability and increased overcrowding.
Closely linked to network reliability is the concept of resilience – that is, the ability of the rail
system to maintain acceptable operational performance in the face of planned or unplanned
faults and challenges. It describes the adaptability of the network and its ability to recover
from an incident within a reasonable timeframe. For SEQ, it also relates to the resilience of
the system to adverse weather conditions such as storms and flooding.
Currently, all passenger rail services on the SEQ network are funnelled through four stations
in the inner-city namely Roma Street, Central, Fortitude Valley and Bowen Hills stations. As
such, incidents on this part of the network or at one of these four stations can have serious

BRISBANE CITY COUNCIL
Brisbane Metro Business Case (May 2017)
CHAPTER 4 – PROBLEM DEFINITION 45
flow-on impacts for the entire SEQ rail network. Because of the cascading effect across the
network, it can take significant time to recover to normal operations.
4.7.7 Rail Problem 7: Uncompetitive journey times and cost
As noted previously, the current rail network does not have good coverage over many areas
in Brisbane and beyond and is relatively indirect in many corridors. The overall impact of the
functional deficiencies and constraints in the SEQ rail network is that rail travel caters for
only around one third of morning peak transit travel into the CBD36. This is low compared to
Sydney and Melbourne, where rail accounts for around 50 per cent.
Given the deficiencies in the rail network in terms of geographic coverage, travel times,
service frequency, and potential for overcrowding, the relative ‘perceived cost’ of a journey
using the rail network in many areas is greater than that of private vehicle and bus travel.
This issue has likely been further exacerbated by increases in public transport fares (and
reductions in fuel price) in recent years.
4.8 Outcomes Sought
The previous sections outlined a number of key strategic, transport, bus and rail specific
problems for SEQ both in the short and longer term. To ensure that the outcomes sought for
the Brisbane Metro reflect the objectives of key strategic government plans and policies,
each problem was aligned to objectives and desired outcomes discussed in the Queensland
Government State Infrastructure Plan (SIP) and draft South East Queensland Regional Plan
(ShapingSEQ).
The SIP outlines the following four objectives to guide infrastructure priorities37:
Improving prosperity and liveability
Infrastructure that leads and supports growth and productivity
Infrastructure that connects communities and markets
Improving sustainability and resilience.
Specific to the transport infrastructure requirements in Queensland, the SIP outlines the
strategic responses and priorities to the key objectives. This is to enable Queensland
Government departments and industry to align their activities in response to these priorities.
The responses include the following38:
Focusing on maintenance and rehabilitation of existing infrastructure to reduce the long-term cost of repair and improve network resilience
Unlocking the potential of critical supply chains by identifying and improving the freight network
Seeking innovation and technology solutions to create a better performing and lower emissions transport system
Seeking public transport solutions, including demand management, to address the strong growth of SEQ.
Digitally connected smart infrastructure to improve capacity, safety and security
Connecting regional communities with access to essential services and opportunities.
36 South East Queensland’s Rail Horizon, 2016 37 Objectives are presented in the State Infrastructure Plan (Part A), p29 38 Transport outcomes are presented in the State Infrastructure Plan (Part B), p34

BRISBANE CITY COUNCIL
Brisbane Metro Business Case (May 2017)
CHAPTER 4 – PROBLEM DEFINITION 46
ShapingSEQ provides a framework for managing the region's growth over the next 25 years
and sets a vision for the next 50 years. Five key goals underpin the 50-year vision for SEQ’s
future: Grow, Prosper, Connect, Sustain, and Live. The goals are the strategic outcomes
sought to pursue the 50-year vision for SEQ. Each goal is supported by several elements
which provide more specific outcomes to achieve the goal. The elements under each goal
include:
Grow39:
o Efficient land use – Urban development uses land and infrastructure efficiently.
o Focusing density – Higher density development is located in areas with good access to high-frequency public transport, and employment and services.
o New communities – New communities support a consolidated urban settlement pattern, maximise the use of existing infrastructure and deliver high-quality communities.
o Housing diversity – Housing diversity meets the changing make-up of our regional population, community needs and lifestyle pursuits, and provides housing choice and affordability.
o Growing rural towns and villages – Rural towns and villages provide for growth and community development in a way that reinforces local identity.
Prosper40:
o High-performing outward focused economy – SEQ responds to its transitioning economy by increasing focus on facilitating export-oriented and business-to-business related transactions that drive productive and economy growth, while also continuing to enhance economic activities that support the needs of growing communities.
o Areas of regional economic significance – Economic opportunities and synergies within and between SEQ’s areas of regional economic significance are accelerated.
o Regional activity centres network – The regional activity centres network adapts to the demands of a transitioning economy, serves the current and future economic and social needs of the community and business, and drives productivity and economic growth.
o Knowledge and technology precincts – Knowledge and technology precincts are globally and nationally connected vibrant, collaborative places that drive innovation and creativity in the market, attract investment and enhance human capital.
o Major enterprise and industrial areas – Major enterprise and industrial areas, including their supply chain networks, grow and enhance national and global trade.
o Special uses – SEQ accommodates a range of special uses, including activities that are difficult to locate, and that support regional needs and economic growth.
o Rural prosperity – Rural areas leverage traditional primary industry strengths to expand, diversify and introduce value-adding activities which
39 ShapingSEQ (Draft South East Queensland Regional Plan) 2016, Queensland Government, p33 40 ShapingSEQ (Draft South East Queensland Regional Plan) 2016, Queensland Government, p43

BRISBANE CITY COUNCIL
Brisbane Metro Business Case (May 2017)
CHAPTER 4 – PROBLEM DEFINITION 47
enhance productivity, resilience and competitiveness in domestic and global markets.
Connect41:
o An efficient movement system – People and freight move efficiently around the region, maximising community and economic benefits.
o Integrated planning – Infrastructure and land use planning and delivery are integrated.
o Active transport – Active transport is a favoured, practical option for a range of trips.
o Prioritised infrastructure investment – Investment in the regional infrastructure network is prioritised to service social and economic needs in a way that integrates with the desired growth pattern.
o Regional infrastructure networks – Regional infrastructure networks are maintained and enhanced to support the region’s growth and needs sustainably, cost-effectively and in a timely manner.
o Digital infrastructure – SEQ has a robust digital infrastructure network to service business and social interaction.
Sustain42:
o Traditional Owners – Traditional Owners are engaged and their culture is respected in planning for the region.
o Biodiversity – The regional biodiversity network is protected and enhanced to support the natural environment and contribute to a sustainable region.
o Regional landscapes – Regional landscape values and functions are sustainably managed and provide social, environmental, cultural and economic benefits to the region.
o Natural resources – The region’s natural resources are managed sustainably and efficiently to meet the needs of the existing and future communities.
o Health and wellbeing – Communities are designed and supported by social infrastructure and natural assets to provide healthy, liveable places that promote mental and physical wellbeing.
o Fair – Communities are places where people can access transport, education, jobs, services, green space, and family and friends in a way that is fair and equitable to all.
o Climate change – The effects of climate change are managed to optimise safety and resilience both for communities and the natural environment.
o Safe – Communities are designed and equipped to be safe, hazard-resilient places.
o Affordable living – Communities have access to a choice of housing types, locations and affordability.
Live43:
o Valuing good design – Great subtropical design underpins SEQ urban places.
41 ShapingSEQ (Draft South East Queensland Regional Plan) 2016, Queensland Government, p57 42 ShapingSEQ (Draft South East Queensland Regional Plan) 2016, Queensland Government, p67 43 ShapingSEQ (Draft South East Queensland Regional Plan) 2016, Queensland Government, p77

BRISBANE CITY COUNCIL
Brisbane Metro Business Case (May 2017)
CHAPTER 4 – PROBLEM DEFINITION 48
o Working with the weather – SEQ’s climate-derived character delivers new models of subtropical, energy-efficient living.
o Inspiration from local character – The communities of SEQ demonstrate a strong respect for their heritage, distinct context and local character.
o Working with natural systems – Urban environments integrate urban greening networks to reshape our urban environments.
o Great places – Great place-making in SEQ creates and improves urban places and rural towns that successfully reinforce local and regional identity and create social and economic dividends for our communities.
Table 4.8 summarises all the problems presented in this chapter and links them to the
relevant objectives and outcomes from the State Infrastructure Plan and ShapingSEQ as
listed above. Based on these strategic objectives, a specific list of outcomes sought for each
problem is noted.

BRISBANE CITY COUNCIL
Brisbane Metro Business Case (May 2017)
CHAPTER 4 – PROBLEM DEFINITION 49
IDENTIFIED PROBLEM
SIP OBJECTIVES ALINGMENT SIP TRANSPORT OUTCOMES ALIGNMENT SHAPINGSEQ GOALAND ELEMENTS ALIGNMENT
OUTCOMES SOUGHT
Strategic Problems
Accessibility and connectivity
Infrastructure that leads and supports growth and productivity
Infrastructure that connects communities and markets
Seek public transport solutions including demand management to address the strong growth of SEQ
Digitally connected smart infrastructure to improve capacity, safety and security
Connect regional communities with access to essential services and opportunities
Grow:
o Focusing density
Prosper:
o High performing outward focused economy
o Knowledge and technology precincts
Sustain:
o Fair
Connect:
o An efficient movement system
o Integrated planning
Greater capacity and improved quality of service from Brisbane’s transport network to:
o provide connections between key areas
o support the transformation of the city to support agglomeration opportunities
o increase capacity during peak periods to service access to the job market
Provide efficient and effective connections to the surrounding region
Ensure residential growth areas are well connected with employment centres through efficient high-capacity transport modes
Provide better multimodal connectivity and interchange opportunities
Economic growth and productivity
Infrastructure that leads and supports growth and productivity
Infrastructure that connects communities and markets
Improving sustainability and resilience
Seek public transport solutions including demand management to address the strong growth of SEQ
Connect regional communities with access to essential services and opportunities
Grow:
o Efficient land use
o Focusing density
Prosper:
o High performing outward focused economy
o Areas of regional economic significance
o Regional activity centres network
o Knowledge and technology precincts
Connect:
o Integrated planning
Live:
o Great places
Greater capacity and improved quality of service from the transport system to:
o ensure sustainable outcomes for the transport system by providing the right choice of mode for each transport tasks
o increase capacity and reduce travel times during peak periods to service access to the job market
o support new urban development opportunities
o manage urban growth in a sustainable manner
o support city building outcomes
o support economic growth opportunities and provide connections between market hub areas
Transport Problems
Car dependency and road congestion
Improving prosperity and liveability
Infrastructure that leads and supports growth and productivity
Infrastructure that connects communities and markets
Focus on maintenance and rehabilitation of existing infrastructure to reduce the long term cost of repair and improve network resilience
Seek innovation and technology solutions to create a better performing and lower emissions transport system
Seek public transport solutions including demand management to address the strong growth of SEQ
Grow:
o Focusing density
Connect:
o An efficient movement system
More (increased capacity and frequency) inner-city public transport provision to support improved access to jobs and services.
Reduce reliance on private vehicle access to the CBD and other major activity centres
Inadequate capacity to meet future public transport demand
Improving prosperity and liveability
Infrastructure that leads and supports growth and productivity
Seek public transport solutions including demand management to address the strong growth of SEQ
Digitally connected smart infrastructure to improve capacity, safety and security
Grow:
o Focusing density
Connect:
o An efficient movement system
o Integrated planning
More (increased capacity and frequency) public transport services to support improved access to jobs and services into and within the inner-city.
Enhanced integration between bus and rail network
Brisbane’s topography and historic pattern of development impacts on network efficiency
Improving prosperity and liveability
Infrastructure that connects communities and markets
Focus on maintenance and rehabilitation of existing infrastructure to reduce the long term cost of repair and improve network resilience
Seek public transport solutions including demand management to address the strong growth of SEQ
Digitally connected smart infrastructure to improve capacity, safety and security
Grow:
o Efficient land use
o Focusing density
Prosper:
o Regional activity centres network
Connect:
o An efficient movement system
o Prioritised infrastructure investment
Improve efficiency and capacity of current river crossings between the CBD and the south-east
Provide more direct and timely access to the CBD by public transport from the south-east to provide attractive alternative to private vehicle travel
Encourage travel by the most sustainable and efficient modes

BRISBANE CITY COUNCIL
Brisbane Metro Business Case (May 2017)
CHAPTER 4 – PROBLEM DEFINITION 50
IDENTIFIED PROBLEM
SIP OBJECTIVES ALINGMENT SIP TRANSPORT OUTCOMES ALIGNMENT SHAPINGSEQ GOALAND ELEMENTS ALIGNMENT
OUTCOMES SOUGHT
Inefficient supply chains for freight
Infrastructure that leads and supports growth and productivity
Infrastructure that connects communities and markets
Unlock the potential of critical supply chains by identifying and improving the freight network
Seek public transport solutions including demand management to address the strong growth of SEQ
Connect regional communities with access to essential services and opportunities
Proposer:
o High-performing outward focused economy
Connect:
o An efficient movement system
Improved road conditions with reduced congestion
Reduced travel time for freight by road
Preserve sufficient freight capacity to meet projected freight task
Bus Problems
Role of bus is understated and multi-faceted
Improving prosperity and liveability
Infrastructure that leads and supports growth and productivity
Infrastructure that connects communities and markets
Focus on maintenance and rehabilitation of existing infrastructure to reduce the long term cost of repair and improve network resilience
Seek public transport solutions including demand management to address the strong growth of SEQ
Digitally connected smart infrastructure to improve capacity, safety and security
Grow:
o Focusing density
Connect:
o An efficient movement system
o Integrated planning
Integrated transport network where bus and rail are not seen as competing but are complementary and connected
Faster and more reliable trip times for public transport customers
Sustained growth and demand
Improving prosperity and liveability
Infrastructure that leads and supports growth and productivity
Seek public transport solutions including demand management to address the strong growth of SEQ
Digitally connected smart infrastructure to improve capacity, safety and security
Connect regional communities with access to essential services and opportunities
Grow:
o Focusing density
Prosper:
o Regional activity centres network
Connect:
o An efficient movement system
Sustain:
o Fair
Alleviate inner-city bus network constraints to unlock capacity
Provide public transport in outer growth areas
Capacity constraints limit potential growth of bus services
Improving prosperity and liveability
Improving sustainability and resilience
Focus on maintenance and rehabilitation of existing infrastructure to reduce the long term cost of repair and improve network resilience
Seek innovation and technology solutions to create a better performing and lower emissions transport system
Seek public transport solutions including demand management to address the strong growth of SEQ
Digitally connected smart infrastructure to improve capacity, safety and security
Grow:
o Focusing density
Connect:
o An efficient movement system
Bus route simplification and improved legibility
Improved travel times and capacity across key bottlenecks
Degrading journey times and reliability
Improving prosperity and liveability
Infrastructure that connects communities and markets
Improving sustainability and resilience
Seek innovation and technology solutions to create a better performing and lower emissions transport system
Seek public transport solutions including demand management to address the strong growth of SEQ
Digitally connected smart infrastructure to improve capacity, safety and security
Grow:
o Focusing density
Connect:
o An efficient movement system
Improved connectivity and capacity between north and south of the river
Greater resilience within the public transport network due to unplanned disruptions and incidents
Network and operational inefficiencies impact capacity and dwell times
Improving prosperity and liveability
Infrastructure that leads and supports growth and productivity
Infrastructure that connects communities and markets
Focus on maintenance and rehabilitation of existing infrastructure to reduce the long term cost of repair and improve network resilience
Seek innovation and technology solutions to create a better performing and lower emissions transport system
Seek public transport solutions including demand management to address the strong growth of SEQ
Digitally connected smart infrastructure to improve capacity, safety and security
Grow:
o Focusing density
Prosper:
o Regional activity centres network
Connect:
o An efficient movement system
o Integrated planning
Optimised bus network and more efficient busway operations
Improved connectivity
Worsening amenity in the inner-city
Improving prosperity and liveability
Improving sustainability and resilience
Focusing on maintenance and rehabilitation of existing infrastructure to reduce the long-term cost of repair and improve network resilience.
Seeking public transport solutions, including demand management, to address the strong growth of SEQ.
Digitally connected smart infrastructure to improve capacity, safety and security.
Prosper:
o Regional activity centres network
Connect:
o An efficient movement system
Live:
o Great places
Reduction of buses stopping on CBD streets
Reduced traffic congestion within inner-city due to buses
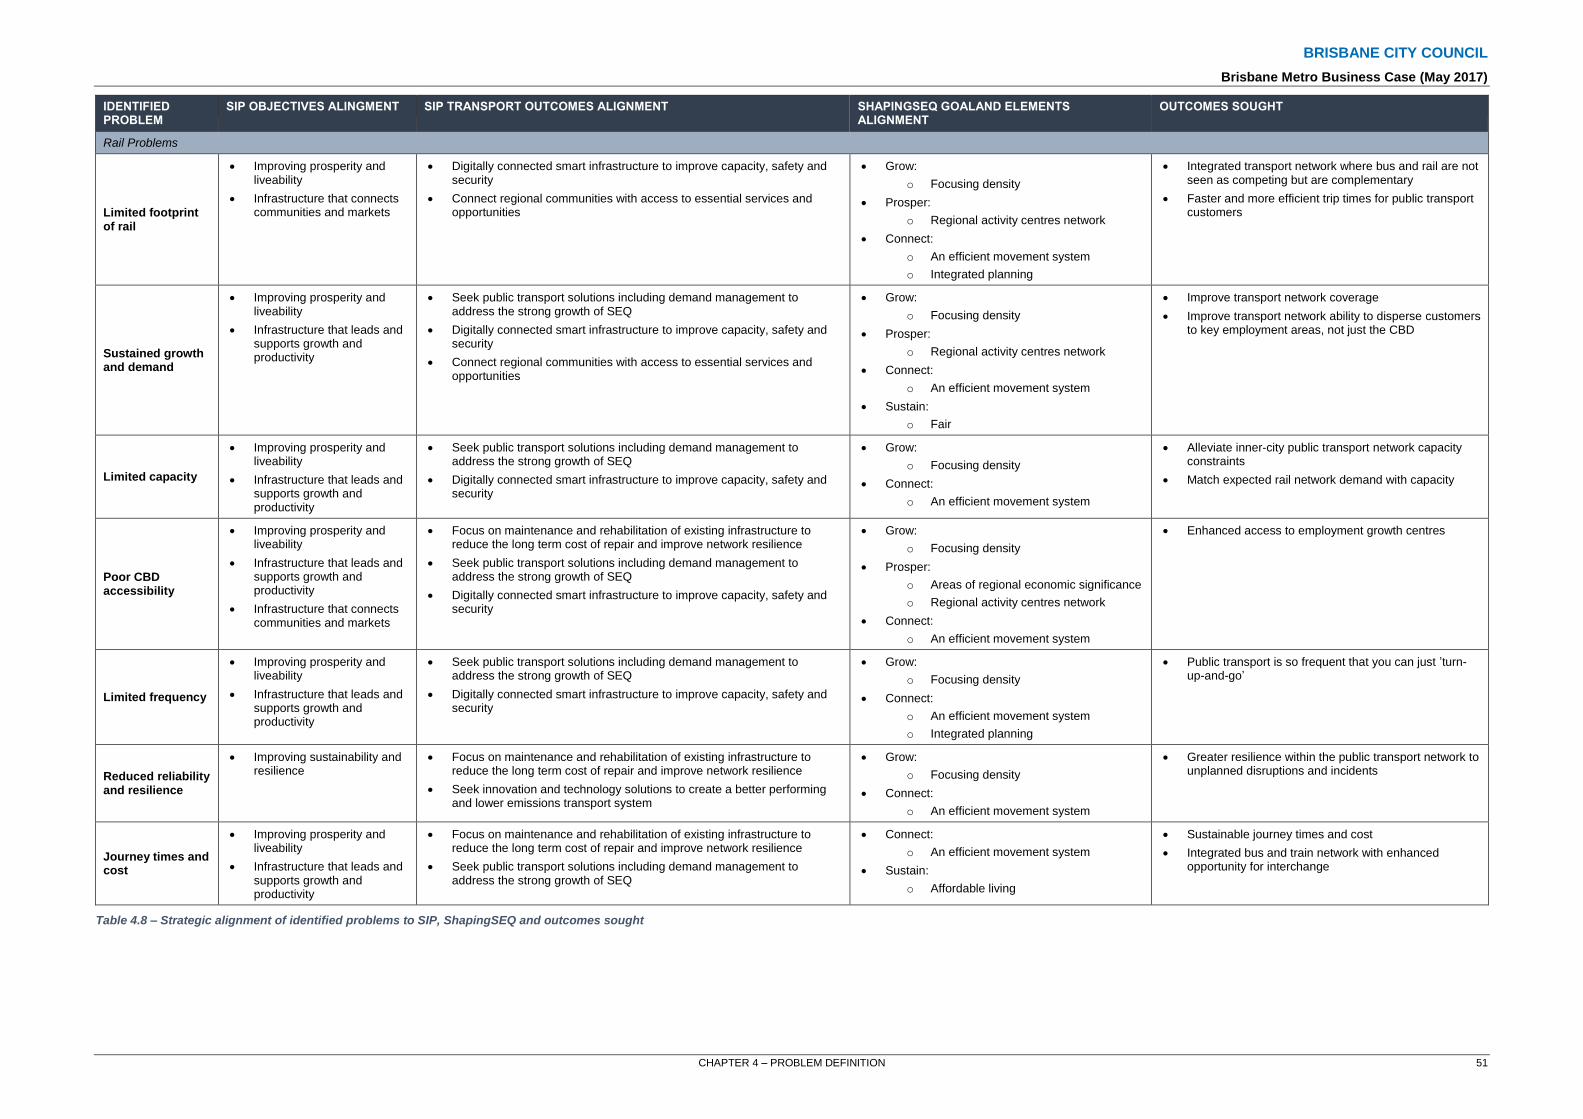
BRISBANE CITY COUNCIL
Brisbane Metro Business Case (May 2017)
CHAPTER 4 – PROBLEM DEFINITION 51
IDENTIFIED PROBLEM
SIP OBJECTIVES ALINGMENT SIP TRANSPORT OUTCOMES ALIGNMENT SHAPINGSEQ GOALAND ELEMENTS ALIGNMENT
OUTCOMES SOUGHT
Rail Problems
Limited footprint of rail
Improving prosperity and liveability
Infrastructure that connects communities and markets
Digitally connected smart infrastructure to improve capacity, safety and security
Connect regional communities with access to essential services and opportunities
Grow:
o Focusing density
Prosper:
o Regional activity centres network
Connect:
o An efficient movement system
o Integrated planning
Integrated transport network where bus and rail are not seen as competing but are complementary
Faster and more efficient trip times for public transport customers
Sustained growth and demand
Improving prosperity and liveability
Infrastructure that leads and supports growth and productivity
Seek public transport solutions including demand management to address the strong growth of SEQ
Digitally connected smart infrastructure to improve capacity, safety and security
Connect regional communities with access to essential services and opportunities
Grow:
o Focusing density
Prosper:
o Regional activity centres network
Connect:
o An efficient movement system
Sustain:
o Fair
Improve transport network coverage
Improve transport network ability to disperse customers to key employment areas, not just the CBD
Limited capacity
Improving prosperity and liveability
Infrastructure that leads and supports growth and productivity
Seek public transport solutions including demand management to address the strong growth of SEQ
Digitally connected smart infrastructure to improve capacity, safety and security
Grow:
o Focusing density
Connect:
o An efficient movement system
Alleviate inner-city public transport network capacity constraints
Match expected rail network demand with capacity
Poor CBD accessibility
Improving prosperity and liveability
Infrastructure that leads and supports growth and productivity
Infrastructure that connects communities and markets
Focus on maintenance and rehabilitation of existing infrastructure to reduce the long term cost of repair and improve network resilience
Seek public transport solutions including demand management to address the strong growth of SEQ
Digitally connected smart infrastructure to improve capacity, safety and security
Grow:
o Focusing density
Prosper:
o Areas of regional economic significance
o Regional activity centres network
Connect:
o An efficient movement system
Enhanced access to employment growth centres
Limited frequency
Improving prosperity and liveability
Infrastructure that leads and supports growth and productivity
Seek public transport solutions including demand management to address the strong growth of SEQ
Digitally connected smart infrastructure to improve capacity, safety and security
Grow:
o Focusing density
Connect:
o An efficient movement system
o Integrated planning
Public transport is so frequent that you can just ’turn-up-and-go’
Reduced reliability and resilience
Improving sustainability and resilience
Focus on maintenance and rehabilitation of existing infrastructure to reduce the long term cost of repair and improve network resilience
Seek innovation and technology solutions to create a better performing and lower emissions transport system
Grow:
o Focusing density
Connect:
o An efficient movement system
Greater resilience within the public transport network to unplanned disruptions and incidents
Journey times and cost
Improving prosperity and liveability
Infrastructure that leads and supports growth and productivity
Focus on maintenance and rehabilitation of existing infrastructure to reduce the long term cost of repair and improve network resilience
Seek public transport solutions including demand management to address the strong growth of SEQ
Connect:
o An efficient movement system
Sustain:
o Affordable living
Sustainable journey times and cost
Integrated bus and train network with enhanced opportunity for interchange
Table 4.8 – Strategic alignment of identified problems to SIP, ShapingSEQ and outcomes sought

BRISBANE CITY COUNCIL
Brisbane Metro Business Case (May 2017)
CHAPTER 4 – PROBLEM DEFINITION 52
4.9 Priority Problems and Service Needs
Using the findings from the problem identification process, each problem was assessed to determine the highest priority problems, within the context of the capacity for Council to influence.
Table 4.9 summarises the outcomes of this process.
IDENTIFIED PROBLEMS PRIORITY
Strategic Problems
Accessibility and connectivity High
Economic growth and productivity High
Transport Problems
Car dependency and road congestion Medium - High
Inadequate ability to meet public transport demand High
Brisbane’s topography and historic pattern of development impacts on network efficiency Medium - High
Inefficient supply chains for freight Low - Medium
Bus Problems
Role of bus is understated and multi-faceted Medium - High
Sustained growth and demand Medium - High
Capacity constraints limit potential growth of bus services High
Degrading journey times and reliability High
Operational inefficiencies impact capacity and dwell times Medium
Worsening amenity in the inner-city High
Rail Problems
Limited footprint of rail Medium - High
Sustained growth and demand Medium - High
Limited capacity Medium - High
Poor CBD accessibility Medium - High
Limited frequency Medium - High
Reduced reliability and resilience Medium - High
Uncompetitive journey times and cost Medium - High
Table 4.9 – Identified problems and their priority
The priority problems to be addressed by the Brisbane Metro are:
Strategic:
o limited accessibility and connectivity
o economic growth and productivity.
Transport network: inability to meet future public transport demand without infrastructure intervention and/or service redesign.
Bus network:
o capacity constraints limit potential growth of bus services
o degrading journey times and reliability
o worsening amenity in the inner-city.

BRISBANE CITY COUNCIL
Brisbane Metro Business Case (May 2017)
CHAPTER 4 – PROBLEM DEFINITION 53
As noted in Section 4.7 above, a number of projects are under development by the Queensland Government to address the identified rail problems.
Through this process outlined above, the following service needs for the Brisbane Metro
have been identified:
Strategic focus: Provide greater capacity and improved quality of service from Brisbane’s transport network to:
o provide enhanced connections between key areas
o support the transformation of the city to support agglomeration opportunities
o increase capacity during peak periods to service access to employment, education and other opportunities
o provide efficient and effective connections to the surrounding region
o ensure residential growth areas are well connected with employment centres through efficient high-capacity transport modes
o provide better multimodal connectivity and interchange opportunities.
Transport focus: Deliver higher capacity and frequency public transport services to
support improved access to jobs and services into and within the inner-city and other
major activity centres. This includes delivering enhanced integration between the bus
and rail network, where bus and rail are not seen as competing but are
complementary components of a connected network.
Bus network focus: Deliver improved travel times, capacity and connectivity across the bus network. Key focus areas include:
o simplification and rationalisation of bus routes to improve legibility and connectivity
o improving capacity and reliability across key network constraints
o ensuring greater resilience within the public transport network to unplanned disruptions and incidents
o reducing congestion within the inner-city by minimising the number of buses stopping on CBD streets.
These service needs will provide focus for the development and detailed analysis of the Brisbane Metro to ensure the ultimate project solution addresses all of the priority problems and supports all service needs.

BRISBANE CITY COUNCIL
Brisbane Metro Business Case (May 2017)
CHAPTER 4 – PROBLEM DEFINITION 54
4.10 Definition of the ‘Without Project’ Case
Drawing from the service needs outlined in the previous section, a project solution (through
options analysis, design analysis and operations planning) can be developed to address the
priority problems. In order to assess how well the project solution addresses the needs, it is
necessary to establish a ‘without project’ case to determine the impact on the strategic
project objectives without intervention.
The ‘without project’ case is forecast out to 2041, and there are a number of inputs (including
their specific forecast changes) that inform the development of ‘without project’ case,
including:
Changes in demographics inputs to 2041
Changes in transport infrastructure provisions to 2041 (inclusive of rail, bus and road infrastructure)
Changes in public transport service provisions to 2041 (inclusive of rail, bus and ferry)
Economic and pricing changes
The ‘without project’ case will also inform the customer and product analysis presented in
Chapter 7 to understand the impacts of the introduction of the Brisbane Metro to the
Brisbane transport network.
4.10.1 ‘Without Project’ Case inputs
4.10.1.1 Changes in demographic inputs to 2041
A set of common demographic input assumptions are used in the forecasting of future
transport conditions as well as forecasting the performance of any project solution.
Population, employment and education enrolment data by zone are the most influential
factors driving forecast travel demand. The forecasts for these key statistics were provided
by the Department of Transport and Main Roads (TMR) at the transport zone level for use in
the Brisbane Metro Project Model (supplied in November 2016).
For the Brisbane Statistical Division, the population is forecast to reach 3.4 million by 2041,
which equates to 1.7 per cent growth per annum. By 2041, total employment for the study
area is forecast to reach 1.8 million (1.7 per cent growth per annum) and total education
enrolments for the study area are forecast to reach 0.7 million (1.3 per cent growth per
annum)44.
These forecasts are disaggregated for inner Brisbane. Both population and employment in
inner Brisbane are forecast to grow at a faster rate than the entire region as a whole.
Employment growth in inner Brisbane is forecast at 2.0 per cent per annum between 2016
and 2021, 1.9 per cent per annum between 2021 and 2031 and 1.9 per cent per annum
between 2031 and 2041.
4.10.1.2 Changes in transport infrastructure provisions to 2041
The assumed changes in the rail, bus and road networks across the study area for future
years are based on current Council, TMR and local government project commitments and
were informed by documents including the Queensland Transport and Roads Investment
Program (QTRIP) 2015-16 to 2018-19.
44 Education enrolments encompass pre-primary, primary secondary and tertiary enrolments

BRISBANE CITY COUNCIL
Brisbane Metro Business Case (May 2017)
CHAPTER 4 – PROBLEM DEFINITION 55
Key changes to rail infrastructure assumed between 2016 and 2041 include:
Redcliffe Peninsula Line by 2016 (Queensland Government)
ETCS Level 2 on the core rail network from Northgate to Milton by 2031 (Queensland Government)
CRR tunnel and five new stations (Boggo Road, Woolloongabba, Albert Street, Roma Street and Exhibition) by 2031 (Queensland Government)45.
Key proposed changes to infrastructure that impact on bus operations assumed between
2016 and 2041 include:
widening of the Inner City Bypass (ICB) from Bowen Bridge Road to Legacy Way, as well as west facing ramps at Bowen Bridge Road to allow Legacy Way buses to access the Inner Northern Busway in both directions by 2021 (Council).
Northern Busway/Gympie Road:
o interim High Occupancy Vehicle (HOV) Lanes (Kedron to Chermside) by 2021 (Queensland Government)
o Gympie Road Bus Lanes (Chermside to Aspley) by 2021 (Queensland Government)
o Lutwyche Rd Bus Lanes (Federation Street to Truro Street) by 2031 (Queensland Government)
South East Busway - extension to Springwood by 2021 (Queensland Government)
Eastern Busway - bus lanes along Old Cleveland Road from Main Avenue to Carindale Shopping Centre by 2031 (Queensland Government)
Deebing Creek Connection - bus lanes (Kerners Road to Lakeview Drive) by 2031 (Queensland Government)
South Deebing Creek Road – bus lanes (Lakeview Drive to Centenary Highway) by 2031 (Queensland Government).
Widening of the ICB is included as per the announced project. The remaining changes are
projects that are assumed for CRR and other studies for the purposes of strategic transport
modelling.
4.10.1.3 Changes in public transport service provisions to 2041
While the infrastructure changes outlined above are a pre-agreed fixed modelling input,
public transport service changes are based on an initial set of service assumptions amended
where necessary to ensure capacity meets demand. Service changes are summarised
below for rail, bus and ferry.
Rail Service Changes
The most fundamental change to rail services between 2016 and 2041 is in relation to the
introduction of CRR and a new rail operating service pattern.
Both 2016 and 2041 morning peak hour inbound train frequencies are shown in Table 4.10.
This shows a significant change in services from the south (Gold Coast/Beenleigh corridors)
with more modest changes in the number of services from the north and west.
45 Note that 2031 is the first transport model in which CRR appears. The date of operations commencing is 2023, as indicated by Queensland Government materials.

BRISBANE CITY COUNCIL
Brisbane Metro Business Case (May 2017)
CHAPTER 4 – PROBLEM DEFINITION 56
CORRIDOR 2016 2041 BASE INCREASE
Gold Coast 5 11 6
Beenleigh/Kuraby/Loganlea (and Salisbury) 5 10 5
Cleveland (and Manly) 8 8 0
Shorncliffe (and Northgate) 4 4 0
Doomben 2 2 0
Airport 3 4 1
Ferny Grove 8 8 0
Kippa-Ring/Petrie 8 11 3
Caboolture (and Sunshine Coast) 9 14 5
Ipswich (and Rosewood) 9 13 4
Springfield 8 14 6
Total 69 99 30
Table 4.10 – Changes in rail service provision between 2016 and 2041 (morning peak hour inbound trains
per hour)
Bus Service Changes
Despite a major increase in rail services and rail patronage, changes to the bus network are
still required to meet a forecast doubling of bus users over the same period, from around
370,000 customers per weekday in 2016 to almost 740,000 per weekday in 2041. Changes
to the bus network and services (note these are not approved Council policy) are presented
for 2021, 2031 and 2041.
2021 bus service changes
The proposed network changes between 2016 and 2021 for the ‘without project’ case have
been informed by Council’s 10 Point Public Transport Plan. These changes are intended to
serve key residential, employment and education growth including:
Connections to new inner suburban growth – increased services to Hamilton Northshore, Coorparoo and UQ for example
Suburban commuting growth – increased services on radial corridors including Old Northern Road, Legacy Way, Old Cleveland Road, Sandgate Road,
Connections to new greenfield growth areas – serving new development in Upper Kedron, Pallara/ Doolandella and Belmont/ Gumdale.
2031 and 2041 Bus service changes
Due to critical network constraints in the inner-city it has been assumed that no new bus
routes will be implemented within Brisbane between 2021 and 2041. However changes to
fleet mix and modest increases in frequency have been assumed to provide additional
capacity for growth where possible.
Outside of Brisbane, major new development areas will require investment in additional
transport capacity. As such the following corridors have been assumed will require new or
additional services to connect development areas to key destinations including high-capacity
rail or bus nodes (note these are not approved TransLink policy):

BRISBANE CITY COUNCIL
Brisbane Metro Business Case (May 2017)
CHAPTER 4 – PROBLEM DEFINITION 57
Springfield to Browns Plains
Ripley to Springfield
Deebing Heights to University of Southern Queensland (Ipswich)
Swanbank to Redbank Plains and Springfield Rail.
Ferry Service Changes
Very minor changes to ferry services in Brisbane between 2016 and 2041 have been
modelled. The one change of note is a proposed new Davies Park CityCat terminal which
requires a minor diversion to existing CityCat services (note these are not approved Council
policy).
4.10.1.4 Pricing changes
The ‘without project’ case also requires assumptions relating to economic and pricing
changes. The increase in the cost of travel and user’s sensitivity to costs are important
drivers in travel behaviour. Compared to the base year (2016) prices, the ‘without project’
case assumes the following:
Inflation – to grow at 2.5 per cent per annum.
CBD parking charges – to grow at 2.88 per cent per annum above the rate of inflation (based on historical trends) (note these are not approved Council policy).
Toll road charges – to grow in line with the rate of inflation and escalation specified in the relevant concession deeds.
Public transport fares – ‘fairer fares’ implemented across the network with price and zone changes as per the publicly available information from 1 January 2017 and then to grow in line with the rate of inflation.
Vehicle operating costs (fuel) – to grow in line with the rate of inflation.
Value of time – to grow at 1.5 per cent per annum above the rate of inflation (in line with assumed average weekly earnings growth of 4.0 per cent per annum).
4.10.2 Implications of changes for transport demand
Future transport demand will be influenced by demographic changes as well as the
anticipated changes in both transport infrastructure provision and transport service provision.
The forecast changes in daily transport demand between 2016 and 2041 across the
Brisbane Statistical Division are shown in Table 4.11.
MODE
2016 2041 BASE
Trips (‘000) Trips (‘000) Growth
(from 2016 to 2041)
Car driver 4,588 6,584 44%
Car passenger 1,712 2,251 31%
Public transport 567 1,024 131%
Walk and cycle 900 1,053 37%
Total 7,767 11,375 46%
Table 4.11 – Overall changes in transport trips across the Brisbane Statistical Division46
46 Brisbane Metro Transport Model (2017)

BRISBANE CITY COUNCIL
Brisbane Metro Business Case (May 2017)
CHAPTER 4 – PROBLEM DEFINITION 58
Overall daily public transport mode share is expected to increase from 7.3 per cent of all
daily trips across the study area to 11.5 per cent.
4.10.3 Key changes in public transport network performance
As outlined in Section 4.9 above, the priority problems for the bus network as a result of
growth and in the absence of any intervention or solution are:
Capacity constraints caused by physical bottlenecks on the busway network,
including stations and intersections will lead to further worsening of travel times and
increasingly mean more variable (less reliable) journey times.
The overall efficiency of the bus network will continue to deteriorate, and more
drivers will be needed just to maintain current frequencies due to slower journey
times
The continuation of the ’single-seat to the city’ network operating paradigm
particularly for low patronage coverage services, coupled with complex route
structure, stopping patterns and overlapping peak and all day services will mean
increasing numbers of buses on CBD streets, affecting the amenity and liveability of
the inner-city.
4.11 Summary
Brisbane’s transport network is now at a critical juncture in its evolution as emerging issues
challenge the region’s growth aspirations. Promoting public transport as the preferred mode
for accessing Brisbane’s CBD and inner-city, especially during peak hours, will be essential
to addressing these issues.
Strong growth in private car use can incur significant infrastructure costs and restrict
economic activity. Continued growth in car travel will increase congestion and impact on
freight and commercial movements, increasing the cost of conducting business and
transporting goods.
Serving the anticipated growth in public transport demand across the region, particularly for
travel to and within Brisbane’s inner-city, will be impossible without additional infrastructure,
due to critical network constraints.
Based on the current operating profile, existing bus infrastructure is reaching capacity and
cannot accommodate significant growth. The reliability and operational efficiency of the bus
network is also reducing due to the constraints of the network, particularly within the CBD.
Brisbane’s rail network has limited capacity and coverage compared with other major
Australian cities, particularly across Brisbane’s inner-city and CBD. This is due, in part, to
limited Brisbane River crossings and the location of inner-city stations in relation to
commercial precincts. Rail services to and through Brisbane’s inner core also continue to
experience growth as people across SEQ seek to access services and jobs in the region’s
primary activity centre. However, the existing inner-city rail system has insufficient capacity
to serve the forecast demand for CBD access.
A solution is required to address the priority problems identified in this chapter. Future
investment should not only benefit the bus and wider transport network but also provide a
platform to ultimately secure Brisbane’s long term liveability and economic prosperity.