Embed Size (px)
Citation preview

Chapter 4 Health
Indonesia Public Expenditure Review 2007
Indonesia Public Expenditure Review 2007
Spending for Development: Making the Most of Indonesia’s New Opportunities 52
CHAPTER 4 Health
Key Findings
In general, health expenditures are low in Indonesia but public expenditure analysis shows that the main problem in the health sector is the unequal and inefficient allocation of the available resources.
Currently, public health spending generally benefits richer income groups more than the poor through regressive subsidies for secondary healthcare. The poor have very little access to public hospitals and, hence, do not make use of the vast majority of the spending that channels into secondary care.
The private sector’s role in the Indonesian healthcare system has grown dramatically over the past decade. Today, the majority of healthcare professionals engage in the delivery of both public and private services. Notwithstanding the progress made in expanding the public healthcare system, access to, and quality of, services remains low and the poor in particular rely heavily on private-sector provision.
Indonesia’s density of doctors and nurses by population is low compared with other countries in the region. The national average further masks significant regional disparities in terms of health personnel supply, which is not necessarily based on local needs.
Key Recommendations
The government should consider allocating more resources to the health sector, since expenditures are much lower than for other countries in the region. Indonesia currently spends less than one third of the Philippines’ level of health spending—the second-lowest spender in the region. However, the first focus should be on allocative efficiency and equality before considering an overall increase in health spending.
Inequalities should be reduced by increasing access to and quality of health services for the poor. This could be achieved by improving the targeting of DAK allocations to poor and under-served districts and by investing in demand-side activities, such as voucher programs, that improve poor people’s access to quality health services.
Priority should be given to identifying the right mix of investments in order to improve the effectiveness of the health sector in dealing with the double burden of diseases (communicable and non-communicable), as well as emerging diseases (HIV/AIDS and avian influenza).
The public sector should play a stronger role as steward of the entire health system through regulating, licensing and accreditation of private providers and services. This would help to ensure the quality of private healthcare.
It is important to identify the right combination of coordinated and reinforcing measures that will ensure a more equal distribution of health service providers and staff, especially doctors, and thereby improve the efficiency of the investments in the health sector workforce.
•
•
•
•
•
•
•
•
•

Indonesia Public Expenditure Review 2007
Spending for Development: Making the Most of Indonesia’s New Opportunities 53
CHAPTER 4 Health
Progress and Challenges in the Health Sector
Improving public health is central to Indonesia’s economic development challenge. Not only is better health a key dimension of poverty reduction, but it is also an essential ingredient to economic growth. Disease and poor health conditions mostly afflict the poor and, in turn, it is poverty that prevents them from receiving appropriate treatment, even if cures are known and available. For example, the main causes of infant mortality are respiratory diseases, typhus and diarrhea. For these diseases affordable interventions are known and should be made widely accessible. Improving the performance of health services is one of the most important factors for enhancing the quality of public health, especially for the poor.
The government has tried to tackle the health-poverty nexus by focusing its agenda on a number of key issues. These include (i) improving access to medical services for underprivileged population groups, (ii) preventing and eradicating communicable diseases, (iii) fighting malnutrition with a focus on children under five and pregnant women, and (iv) improving the availability of generic medicine (RPJM and RPK, 2006). Progress towards meeting these objectives is monitored through 12 specific targets that are to be met by 2007 (Box 4.1).
Box 4.1 Government targets for the improvement of health outcomes, 2007
• Free health services in Puskesmas and Class 3 treatment in hospitals for 100 percent of poor families.• Universal Child Immunization (UCI) reaches 92 percent in a higher percentage of villages.• TB case detection rate of over 70 percent.• 100 percent of dengue hemorrhagic fever (DBD) patients are treated.• 100 percent of malaria patients are treated.• Diarrhea case fatality rate during KLB (extraordinary event) is decreased to 1.3 percent.• 100 percent of people living with HIV/AIDS (ODHA) receive ART treatment.• 85 percent of pregnant women consume Fe tablets.• 60 percent of infants are exclusively fed with breast milk.• Improved percentage of children under five consuming Vitamin A to 80 percent.• Improved percentage of food product distribution meeting safety requirements of 70 percent.• Extended scope of production facility examination in the context of proper medicine production (CPOB) to 45 percent.
Source: GoI, RPK, 2006.
Over the years, the government’s commitment to the sector has led to significant progress in reducing infant and child mortality. For example, the infant mortality rate fell from 46 per 1,000 live births in 1997 (IDHS 1997) to 35 per 1,000 live births in 2003 (IDHS 2002-03) and Indonesia is close to reaching the MDG target for IMR54 (33 mortalities for every 1,000 live births by 2015).
The placement of midwives led to an improvement in child nutrition in the late 1990s, but recently malnutrition rates have been increasing. In the 1990s, 50,000 midwives were placed throughout the country to increase access to midwife services. These midwives had a significant positive effect on nutritional status; children born in villages with a midwife on average suffered from lower levels of malnutrition than children born in villages without one.55 Despite these achievements, malnutrition rates increased between 2002 and 2003 for unknown reasons.56
Given the current trend and unsuccessful interventions in the field of maternal health, Indonesia is unlikely to achieve the MDG for maternal mortality.57 Maternal mortality rates have not changed appreciably over time. The risk of death during child birth or shortly after delivery remains significant in Indonesia, with a rate of 307 mortalities
54 The MDG goal for reducing child mortality is measured by three indicators, namely: (i) the child under five mortality rate; (ii) the percentage of children aged below one year who are immunized for measles; and, (iii) the infant mortality rate. In terms of the infant mortality rate, this will need to be reduced by two thirds between 1990 and 2015 (Bappenas-Unicef, Indonesia Report on MDGs, 2004).55 Frankenberg, 2004.56 Abreu, 2005.57 The Millennium Development Goal for Maternal Health indicates that countries should reduce their maternal mortality ratios by three quarters. See: http://www.un.org/millenniumgoals/. Although MMR appears to be decreasing the estimates are not sufficiently reliable to say this with certainty. The MMR data estimates in the period 1990-94 are 390/100,000, 1994-98 are 334/100,000 and 1998-2002 are 307/100,000. But due to high sampling errors at the 95 percent confidence interval all three estimates overlap, there is even overlap at the 67 percent confidence interval. There could in fact have been a dramatic decline, an increase or no change. However a decrease is likely given the improvements in proxies of MMR – skilled birth attendance increase, maternal anemia decrease and increase in institutional delivery. A very steep decline is unlikely given the continued high rates of births at home.

Indonesia Public Expenditure Review 2007
Spending for Development: Making the Most of Indonesia’s New Opportunities 54
CHAPTER 4 Health
per 100,000 live births.58 This implies that a woman who decides to have four children has a probability of 1.23 percent of dying as a result of her pregnancies. Indonesia is even a true regional outlier when it comes to comparing maternal mortality, since its rate is more than six times higher than in China (50), and 10 and 15 times higher than Thailand and Malaysia (36 and 20), respectively (Table 4.1).
Indonesia compares poorly with its neighbors on most conventional measures of health outcomes. For instance, in terms of mortality and life expectancy, Indonesia ranks below the East Asian average and underperforms its neighbors (most notably Malaysia) by a significant margin. Indonesia also continues to have the lowest measles vaccination rate in the region, which demonstrates shortcomings in preventive care. The situation deteriorated especially in the aftermath of the economic crisis, with vaccination rates dropping from 80 percent to 70 percent in 2001. Rates have now stabilized at around 73 percent, a level still very low compared with Thailand, Vietnam and Malaysia. These differences in outcomes hold when per capita GDP is accounted for. Vietnam, despite having a lower GDP, fares better on all other measures, while the Philippines, a country with slightly higher GDP figures, does better on most measures (Table 4.1).
Table 4.1 Regional comparison of health outcomes, 2004
GNP per capita(US$)
Life expectancy
(years)
Crude death rate IMR U5MR DPT rate Measles MMR Births attended by
skilled health staff
Indonesia 906 67.4 7.3 34.7* 45.7* 70 72 307* 72Cambodia 350 56.6 11 95* 124.4* 85 80 437* 31.8*Malaysia 4,290 73.5 4.7 10.2 12.4 99 95 20** 97Vietnam 502 70.3 6.1 23.6* 66.7* 96 97 95 90Thailand 2,356 70.5 7.2 18.2 21.2 98 96 36 NaPhilippines 1,085 70.8 5 28.7* 39.9* 79 80 172** 60India 538 63.5 8.3 61.6 85.2 64 56 540 NaChina 1,323 71.4 6.4 26 31 91 84 50 96East Asia 1,254 70.3 6.6 29.2 36.8 86.6 82.5 Na 86.1
Source: WDI, UNDP and DHS.Note: IMR: Infant Mortality Rate; U5MR: Under Five Mortality Rate; and MMR: Maternal Mortality Rate. For estimates with * the data source is DHS. For estimates with ** data source is UNDP. The most recent MMR data available are for 2003 (World Bank, 2006g) and the most recent available data on birth attended by skilled health staff are for 2003 and 2004.
Indonesia’s under-five mortality rate has decreased over time, but it still remains high compared with the regional average for Asia, at 46 per 1,000. Moreover, the mortality rate among children under five in poor communities is almost four times higher compared with rates in richer population groups.
Figure 4.1 Regional comparison of infant mortality and under-five mortality rates, 2004
12 18,226 28,7 34,7
23,6
61,6
95
39,9
66,7
124,4
85,2
45,7
14,1
3121,2
0
20
40
60
80
100
120
140
Sri Lanka Thailand China Philippines Indonesia Vietnam India Cambodia
Mortality rate, infant (per 1,000 live births) Mortality rate, under-5 (per 1,000)
Source: WDI, DHS and UNDP.
58 This estimate is derived from the 2002 Indonesia Demographic and Health Survey (IDHS) and is based on reported deaths from 1998 to 2002.

Indonesia Public Expenditure Review 2007
Spending for Development: Making the Most of Indonesia’s New Opportunities 55
CHAPTER 4 Health
Box 4.2 The reoccurrence of polio in Indonesia in 2005
In March 2005, a 20-month-old boy in Sukabumi district, West Java, was paralyzed as a result of being infected by the polio virus. Since March 2005, a total of 303 children have been paralyzed by wild polio virus in Indonesia. Based on service statistics, the immunization coverage for infants has been consistently high, but this masks pockets where coverage was considerably lower. However, the Indonesia Demographic and Health Survey shows that immunization rates are much lower than reported in service statistics. The decrease in general immunization coverage (including polio) as a result of decentralization is the underlying cause of the reoccurrence of polio in Indonesia.
The Response: Two emergency vaccination campaigns and three rounds of National Immunization Days (NID) were started in May 2005; the latest round was carried out in November 2005. Since new wild virus cases were also detected at this time, a special NID was conducted on 30 January 2006 in 57 districts, with a target of 4.5 million children under five, a fourth and a fifth NID were carried out in February and April 2006.
Challenge for the government:1. Improve and maintain general immunization coverage and surveillance of the main indicator for polio2. Improve the accuracy of the service statistics to reflect actual coverage so that areas where extra efforts are needed
can be identified
Source: Unicef, 2005.
National data hide wide variations within the country. For instance, the poorer provinces of Gorontalo and West Nusa Tenggara have post-neonatal mortality rates that are five times higher than the best performing provinces in Indonesia. Similar regional discrepancies are shown in under-five mortality rates (infant and child). While most provinces are below, or only slightly above, the 40 deaths for every 1,000 live births mark, nine provinces have rates of over 60. West Nusa Tenggara, Southeast Sulawesi, and Gorontalo rates are as high as 90 or 100 (Figure 4.2).
Figure 4.2 Infant and child mortality rates by province, 2002-03
0
20
40
60
80
100
120
ilaBygoY
kara
at
NorthaluSw
sei
KDI aJ
aktr a
Ctne
laraJ
av
kgnaB
a
tileB
gnu
Centra
lmilaK
tnana
South
uSm
taar
Wset
aJav
aJm
ib
East
milaK
tnana
aEtsJ va
atnaB
ne
South
milaK
tnana
NorthuSm
taar
Wes
t S mutaar iR
ua
Wes
t K mila
tnana
maL
gnup kgneB
lu u
Centra
laluSw
sei
South
aluSw
sei
East
Nusa Te
nggara
South
East
aluSw
sei
tnoroG
la o
Wes
t Nusa
Tenggara
Infant mortality Child mortality
Source: 2002-03, Indonesian Demographic and Health Survey.
Over the past decade, the burden of disease has shifted, signaling that Indonesia is experiencing an epidemiological transition. Most diseases contracted are diseases such as tuberculosis, acute respiratory infections, malaria and diarrhea. Nevertheless, non-communicable diseases, especially cardiovascular diseases, are gradually replacing these communicable and ‘traditional’ diseases as the foremost causes of death. Between 1992 and 2001, the share of total deaths resulting from cardiovascular causes increased by 10 percentage points from 16 to 26.4 percent. Respiratory infections and TB are the next most important causes of death (15 and 11 percent, respectively) (National Institute of Health Research and Development and the National Health Survey, 1992, 1995, 2001). Indonesia faces a double burden of disease, which, along with population growth and aging, will affect the quantity and types of health services that will be required in the future.
In addition, Indonesia is seeing the emergence of ‘new’ epidemics with diseases such as avian influenza and HIV/AIDS. The HIV/AIDS epidemic is at a crossroads with rising prevalence among high-risk groups (e.g. sex workers and injecting drug-users) and the population in Papua, while limited attention is being paid to preventing transmission.

Indonesia Public Expenditure Review 2007
Spending for Development: Making the Most of Indonesia’s New Opportunities 56
CHAPTER 4 Health
With respect to avian flu, the data show an increasing number of confirmed cases and fatalities. Therefore, mitigation and prevention efforts must be improved in a coordinated manner. Overall, these epidemics present new challenges for the sector with regard to disease surveillance, control and immunization.
Public Health Expenditures in Indonesia
Public expenditures in the health sector have significantly increased since 2001,61 from Rp 9.3 trillion to Rp 16.7 trillion in 2004, which represents a 44 percent increase in real terms (Table 4.2). Moreover, the budget allocations for 2006 show a further 25 percent increase compared with 2005, when expenditures were around Rp 22 trillion. Health expenditures also increased relative to overall national spending, from 2.6 percent in 2001 to 3.8 percent in 2004. However, health spending as a share of GDP remains low and increased from only 0.55 percent to 0.73 percent over the same period.
Table 4.2 Trends in Indonesian health expenditures, 2001-07
(Rp trillion) 2001 2002 2003 2004 2005 2006* 2007**
National Nominal Health Expenditures 9.3 10.6 16.0 16.7 22.0 31.5 38.6Real National Health Expenditures (2001=100) 9.3 9.8 13.4 13.2 15.6 19.8 22.8 Annual Rate Growth Real National Health Expenditures (%) 28.1 2.7 41.4 -1.8 19.4 26.7 15.4Health Expenditures as % of National Total Expenditures 2.6 3.1 4.0 3.8 4.1 4.5 4.9National Health Expenditures as % of GDP 0.55 0.57 0.78 0.73 0.81 0.95 1.09Overall National Nominal Expenditures 353.6 337.6 405.4 445.3 535.8 698.2 785.4Overall Real National Expenditures (2001=100) 353.6 301.8 339.9 351.6 382.9 442.4 468.3Source: World Bank staff calculations based on MoF and SIKD data.Note: * Budget Figures for 2006 and ** estimates for 2007.
Figure 4.3 Trend in health expenditures, 1997-2007
-
5.0
10.0
15.0
20.0
25.0
1995 1996 1997 1998 1999 2000 2001 2002 2003 2004 2005 2006 2007
ecirp 100 2 tnatsn oc .p R .rTs
0.0
0.2
0.4
0.6
0.8
1.0
1.2
PD
G fo %
Real National Health Expenditures (100=2001) National Health Expenditures as % of GDP
Source: World Bank staff calculations, based on data from MoF.
Regional comparisons between levels of health expenditures show that Indonesia’s spending levels are far below those of its East Asian neighbors, with less than 1 percent of GDP and only 4.5 percent of total expenditures spent on the health sector. Other countries, even those with similar and lower per capita incomes such as the Philippines, spend about 3 percent of their GDP on public health. In terms of health expenditures as a share of total expenditures, Indonesia again lags behind the Philippines, where close to 6 percent of total government resources are
61 Before the crisis, health expenditures have not increased at similar rates and from 1994 to 2001 only grew by 5 percent a year on average. The expenditures trend we see since 2001 is hence a relatively new phenomenon.

Indonesia Public Expenditure Review 2007
Spending for Development: Making the Most of Indonesia’s New Opportunities 57
CHAPTER 4 Health
spent on health. These figures are even more striking when taking the respective infant mortality rates into account. Indonesia has a relatively high mortality rate per 1,000 live births, while spending extremely little compared with countries with lower rates.62 Spending levels coupled with health outcome indicators show that Indonesia is not yet prioritizing health spending, nor achieving the results that are needed to achieve its MDG targets.
Figure 4.4 Regional comparison of health expenditures, 2004 (budget 2006) and IMR
0 .7 3 0 .9 5
3 .23 .8 4 .5
5 .9
3 .83 .3
6 .9
13 .634 .6
28 .7
10 .2
18 .2
0
2
4
6
8
1 0
1 2
1 4
1 6
I ndon es i a 2004 I ndones i a 2006(budg et)
Philipp i n e s Thailan d M al a y s i a0
5
1 0
1 5
2 0
2 5
3 0
3 5
4 0
To ta l h e a l th e xpe nd i tu re a s % G D PG en eral government h e a l th expendi ture as % to ta l government expe nd i tu r e
% o
fN
atio
nal E
xpen
ditu
res
Infa
nt
Mor
talit
yR
ate
Source: World Development Indicators 2006 and World Bank staff calculations.
Economic composition and levels of government
The recent increase in overall public spending on health was driven almost exclusively by development expenditure. Expenditures at the central, provincial and local levels grew at 42, 36 and 46 percent, respectively. Development expenditures shot up after 2001, while routine expenditures stayed essentially the same in absolute terms; a small decrease at central and provincial level is balanced by an increase at the district level and routine spending even decreased in terms of spending shares per level (Table 4.3). Consequently, the increase in health expenditures is attributed mainly to an increase in development expenditures.
Table 4.3 Levels and shares of health expenditures at different levels of government
(Rp trillion) 2001 % 2002 % 2003 % 2004 % 2005* % 2006* %
Central 2.8 34 2.3 27 4.3 36 4.0 33 5.7 41 7.3 41Development 2.1 74 2.0 84 4.0 92 3.5 89 -- -- -- --Routine 0.7 26 0.4 16 0.3 8 0.4 11 -- -- -- -- Provincial 1.6 19 1.9 22 2.1 18 2.1 18 2.3 16 2.8 16Development 0.5 33 0.7 39 1.1 52 1.2 58 -- -- -- --Routine 1.1 67 1.2 61 1.0 48 0.9 42 -- -- -- -- District 3.9 47 4.3 50 5.6 47 5.7 49 6.1 43 7.6 43Development 1.1 28 1.1 25 2.2 39 2.2 39 -- -- -- --Routine 2.8 72 3.2 75 3.4 61 3.5 61 -- -- -- -- Total National Expenditures 8.3 100 8.5 100 12.0 100 11.8 100 14.1 100 17.7 100Source: World Bank staff calculations based on data from MoF.Note: * provincial and district spending based on transfers and revenues and estimated on the basis of previous years. In constant 2004 prices.
62 There is recent, yet limited, literature that demonstrates evidence of a positive correlation between government health expenditures and health outcomes as IMR and MMR (see Gottret, Gai and Bokhari, 2006). Until recently, however, the relationship was not proven and the missing link can be explained by three factors: (i) an increase in public health expenditures may result in a decrease in private health expenditures (a household may divert funds to other expenses than health once the government provides basic health care); (ii) incremental government expenditures may be employed on intensive rather than extensive margin; and (iii) even if extra funds are applied to healthcare (more services, staff and supplies) if complementary services (roads for example) are not provided the impact may be little or none). (See Musgrove 1996 for review of evidence; Wagstaff, 2002, for impact of complementary services; Jalal and Ravallion, 2003, for use of incremental health expenditures; and Anand and Ravallion, 1993; Bidani and Ravallion, 1997, Filmer and Pritchett, 1999; and Wagstaff, 2004.)

Indonesia Public Expenditure Review 2007
Spending for Development: Making the Most of Indonesia’s New Opportunities 58
CHAPTER 4 Health
In 2004, the majority of health expenditures, around 70 percent, were spent at the sub-national level, mostly by district governments. At the sub-national level, districts account for 73 percent of total spending, while provinces account for only 27 percent. Shares of spending by the different levels of government have remained largely unchanged since decentralization. Districts spend roughly half of all public health expenditure, while one third is spent by the central government and the remainder by the provinces (Table 4.3 and Figure 4.5).
Figure 4.5 Trends in health expenditure by level of government
0
5.000
10.000
15.000
20.000
25.000
1994 1995 1996 1997 1998 1999 2000 2001 2002 2003 2004 2005 2006* 2007*
Billi
on R
p.
Central Government Health Expenditures
District Government Health Expenditures
Provincial Government Health Expenditures
Although districts spend about half of the total budget, these expenditures are for the most part non-discretionary routine expenditures. Hence, although decentralization formally devolved the responsibilities for health from the central level to the sub-national level, the majority of the development budget is still directly spent by the central government, while since 2001 districts only cover about one third (Table 4.3). Local governments appear to have surprisingly little discretion in managing their public health funds.
Table 4.4 Share of health expenditures - development vs routine by level of government
2001 (%) 2002 (%) 2003 (%) 2004 (%)
Total Development Expenditures (Rp trillion) 3.7 3.8 7.2 7.0
Central 56 52 55 50
Province 14 20 15 18
District 30 29 30 32
Total Routine Expenditures (Rp trillion) 4.6 4.7 4.8 4.8
Central 16 8 7 9
Province 23 24 21 18
District 61 68 72 73
Source: World Bank staff calculations based on data from MoF.
Figure 4.6 Health spending and district revenue, 2004
12
13
14
15
16
Hea
lthex
pend
it ure
(log,
pc)
12 13 14 15 16District revenues (log, pc)
District spending on health seems to be determined by total revenues, not health needs. Decentralization can improve the allocative efficiency of health spending, since district governments have the opportunity to tailor services and expenditures to better fit the preferences and needs of the local community. Analysis of health expenditure patterns among districts in Indonesia, however, shows a clear positive relationship between the level of district revenue and health expenditures; the higher the district revenue the higher the health expenditures. There is hardly any variation in the share of district spending on health, despite significant regional variations in health outcomes. In theory, districts have the authority to improve the allocative efficiency of health spending. However, in reality health institutions
and local governments often wait for instructions from the central government on how to spend their resources.

Indonesia Public Expenditure Review 2007
Spending for Development: Making the Most of Indonesia’s New Opportunities 59
CHAPTER 4 Health
Spending can improve healthcare outcomes but it is equally important to improve the quality of health policy-making and health institutions. In a study covering 57 countries, Wagstaff et al. concluded that the quality of policy and institutions as measured by the Country Policy and Institutional Assessment (CPIA) Index highly influences the impact of increased spending on health outcomes. For countries with a low score of 1 or 2, improvements in health outcomes are not significant. For a country such as Indonesia with a score of 3.6, increasing the health budget by 10 percent of GDP could reduce the MMR by 7 percent, while changes in U5MR, TB and immunization would be insignificant. Further support in order to improve: (1) allocation of spending; (2) geographic, project, population and bottleneck targeting and; (3) provider accountability, would help to improve the efficiency of spending, which is a necessary first step to enable spending to actually affect health outcomes.
Economic allocation of health expenditures
The majority of routine expenditures at the sub-national level, in particular personnel spending, have increasingly crowded out expenditures on goods, operational spending and maintenance (Table 4.5). Districts and provinces spend a significant share of their routine expenditures on personnel, 82 and 66 percent, respectively, and most of the remaining funds are allocated to goods expenditures. Expenditures on goods have, however, decreased both as a share as well as nominally. District expenditures on goods decreased by 12 percent, whereas provincial expenditures on goods decreased by almost one third. Analyzing the economic classification of the routine budget demonstrates that neither provinces nor districts allocate significant funds to operational and maintenance expenditures. This may in part explain the low levels of maintenance and problems with adequate supervision, especially at the community level where most preventive health interventions are carried out. Although sub-national governments account for a significant share of expenditure in the health sector, they have actually very little fiscal space and most of their routine expenditures, 82 percent, are spent on personnel.
Table 4.5 Routine expenditure distribution by level of government
(Rp billion)District Province
2002 % 2003 % 2004 % 2002 % 2003 % 2004 %
Personnel 3,182 70 3,850 79 4,081 82 847 52 887 61 818 66Goods 779 17 640 13 683 14 515 31 334 23 353 28
Operation and Maintenance 119 3 116 2 115 2 62 4 64 4 59 5
Travel 28 1 47 1 49 1 8 1 12 1 14 1
Miscellaneous 421 9 215 4 56 1 207 13 147 10 5 0
Total Routine Expenditure 4,528 100 4,869 100 4,984 100 1,639 100 1,444 100 1,248 100
Source: World Bank staff calculations based on data from MoF.Note: Constant 2004 prices.
Functional allocation of expenditures
In terms of the functional allocation of health expenditures, the programs that constitute the majority of the budget are the ‘public health’ and ‘individual or personal health’ programs. These categories cover the central government’s main health programs but there is little detailed information on what these programs are. Generally, it appears as if the ‘public health’ program is focused on the provision of public health centers and their networks, including community health centers (Puskesmas), mobile public health centers and village midwives, whereas the ‘personal health program’ is focused on providing hospital care in particular. These two categories together constitute 50 percent of the central government’s health programs. Other substantial categories are related to management and administration. Prevention only makes up about 12 percent, and hygiene and sanitation only about 3.2 percent of the budget. Nutrition and medicine supply comprise a mere 4 percent of the central government’s health budget.

Indonesia Public Expenditure Review 2007
Spending for Development: Making the Most of Indonesia’s New Opportunities 60
CHAPTER 4 Health
The various programs are mostly classified as preventive health interventions. The budget distinguishes between three main categories: curative, preventive and operational. Most programs are in the preventive category, although they still appear to contain curative components, given that at 20 percent the share of curative interventions seems low. The two largest programs focused on public health centers and hospitals appear to have curative components: as described in the government’s Medium-Term Development Strategy (RPJM 2004-09), they have key sub-components related to the construction of health center facilities, maintenance of facilities, as well as the supply of medical instruments and supplies, including generic medicines.63
Table 4.6 Functional allocation of the central government health budget, 2006
Program (Rp billion) Curative Preventive Operational Total %Health Promotion & Community Empowerment -- 132 -- 132 1Hygiene & Sanitation -- 433 -- 433 3Public Health -- 2,465 -- 2,465 18Individual Health 2,649 1,697 -- 4,346 32Prevention & Disease Control -- 1,620 -- 1,620 12Nutrition -- 582 -- 582 4Health Resources -- -- 906 906 7Medicine & Medicine Supply -- -- 628 628 5Health Management & Policy -- -- 1,126 1,126 8Research & Development -- -- 1,74 174 1Improving and Monitoring Accountability -- -- 43 43 0Managing Human Resources -- -- 27 27 0Administration -- -- 1,026 1,026 8Training -- -- 15 15 0Total 2,649 6,928 3,946 13,524 100% 20 51 29 100
Source: Bappenas, 2006.
The ambiguity of the central government’s health budget indicates the need for improved programmatic budgeting. In order for the government to link its expenditure allocation to outputs and outcomes, health information systems should be improved to ensure adequate monitoring and evaluation. However, in addition to this, the budget also needs more complete information in order to allow for analysis by health programs. At present these programs are described only in a very general manner, allowing for little insight into how to reallocate expenditures towards more efficient categories.
Household expenditures on healthcare and insurance
Figure 4.7 Composition of total health expenditure
15%
8%
22%55%
Central Provincial District Private household
Source: Data from MoF and Susenas 2004.
Household out-of-pocket expenses continue to constitute the majority of total health expenditures. In 2004, Indonesian households spent around Rp 20 trillion on health, contributing to 55 percent of total health expenditures (Figure 4.7). This is comparable to the average for lower-middle-income countries (50 percent). Between 2003 and 2005, household health expenses increased by 12 percent, slightly more than the increase in provincial and district spending (8 percent) over the same period.
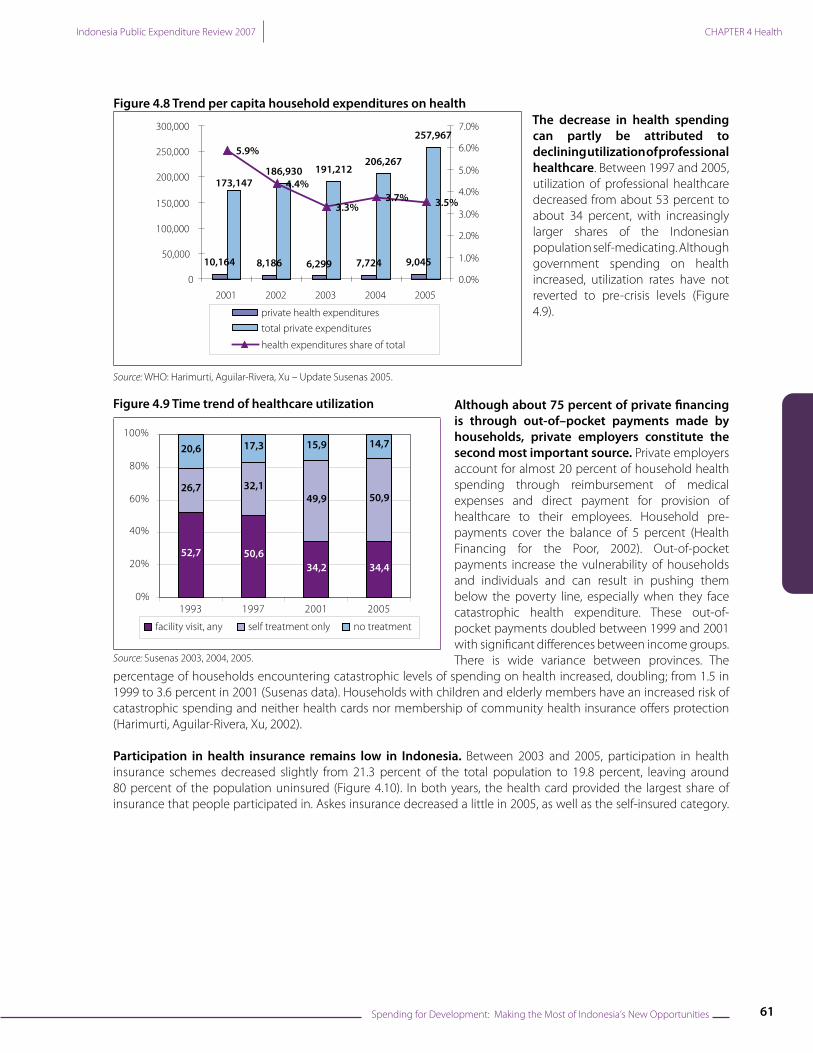
In Indonesia, 3.5 percent of total household expenditures are currently spent on health, but the trend shows a decline (Figure 4.8). Over the past four years, out-of-pocket expenses have decreased
significantly from about 6 percent of total household expenditures to the current 3.5 percent. This decrease resulted from an absolute decrease in per capita health spending with increasing total household expenditures per capita, rather than a substitution due to increased government spending.
63 See Annex Section F1 for a description of the Central Government’s health programs for ‘Public Health’ and ‘Personal Health Services’.
Indonesia Public Expenditure Review 2007
Spending for Development: Making the Most of Indonesia’s New Opportunities 61
CHAPTER 4 Health
Figure 4.8 Trend per capita household expenditures on health
10,164 8,186 6,299 9,045
186,930 191,212206,267
257,967
7,724
173,147
5.9%
4.4%
3.3%3.7% 3.5%
0
50,000
100,000
150,000
200,000
250,000
300,000
2001 2002 2003 2004 20050.0%
1.0%
2.0%
3.0%
4.0%
5.0%
6.0%
7.0%
private health expenditurestotal private expenditures
health expenditures share of total
Source: WHO: Harimurti, Aguilar-Rivera, Xu – Update Susenas 2005.
The decrease in health spending can partly be attributed to declining utilization of professional healthcare. Between 1997 and 2005, utilization of professional healthcare decreased from about 53 percent to about 34 percent, with increasingly larger shares of the Indonesian population self-medicating. Although government spending on health increased, utilization rates have not reverted to pre-crisis levels (Figure 4.9).
Figure 4.9 Time trend of healthcare utilization
52,7 50,634,2 34,4
26,7 32,149,9 50,9
20,6 17,3 15,9 14,7
0%
20%
40%
60%
80%
100%
1993 1997 2001 2005
facility visit, any self treatment only no treatment
Source: Susenas 2003, 2004, 2005.
Although about 75 percent of private financing is through out-of–pocket payments made by households, private employers constitute the second most important source. Private employers account for almost 20 percent of household health spending through reimbursement of medical expenses and direct payment for provision of healthcare to their employees. Household pre-payments cover the balance of 5 percent (Health Financing for the Poor, 2002). Out-of-pocket payments increase the vulnerability of households and individuals and can result in pushing them below the poverty line, especially when they face catastrophic health expenditure. These out-of-pocket payments doubled between 1999 and 2001 with significant differences between income groups. There is wide variance between provinces. The
percentage of households encountering catastrophic levels of spending on health increased, doubling; from 1.5 in 1999 to 3.6 percent in 2001 (Susenas data). Households with children and elderly members have an increased risk of catastrophic spending and neither health cards nor membership of community health insurance offers protection (Harimurti, Aguilar-Rivera, Xu, 2002).
Participation in health insurance remains low in Indonesia. Between 2003 and 2005, participation in health insurance schemes decreased slightly from 21.3 percent of the total population to 19.8 percent, leaving around 80 percent of the population uninsured (Figure 4.10). In both years, the health card provided the largest share of insurance that people participated in. Askes insurance decreased a little in 2005, as well as the self-insured category.

Indonesia Public Expenditure Review 2007
Spending for Development: Making the Most of Indonesia’s New Opportunities 62
CHAPTER 4 Health
Little inequality exists in access to health insurance (Figure 4.11). The pro-poor distribution of the health card has decreased inequality in access to other types of insurance, such as private insurance, Jamsostek, and Askes.
Figure 4.10 Percentage of participation in health insurance
Figure 4.11 Insurance participation by quintile, 2005
8.6% 8.5%5.1%
2.5%
3.5% 3.9%
3.0%
2.7% 2.7%
6.0% 5.7%
8.5%
0.5% 0.8%
0.7%
0%
5%
10%
15%
20%
25%
2003 2004 2005
ASKES Jamsostek Self insured and others JPKM Health Card
4.3 5.4 5.1 5.2 5.3
1.32.3 2.9 3.2 2.91.8
2.8 3.3 3.7 3.4
0.7
0.60.7
0.6 0.7
11.58.3
8.1 7.1 7.7
0
5
10
15
20
25
Poorest 2 3 4 Richest
askes jamsostek self and others jpkm health card
Source: Susenas 2003, 2004 and 2005. Source: Susenas 2005.
Having various types of health insurance mechanisms reduces the risk of catastrophic expenditure, but does not necessarily imply adequate protection. Households that have one of the two forms of social health insurance (Askes and Jamsostek) and those who are covered by a company and receive certain health benefits (self-insured), face less risk. However, neither health cards and the health fund, nor community health insurance schemes (JPKM) has reduced the risk of catastrophic expenditures. This can be partly explained by the limited benefits offered by the schemes and by the fact that on average only 21 percent of the people covered by JPKM and 27 percent of those covered by health card were poor.
Private sector provision of healthcare
Notwithstanding the progress made in expanding the public healthcare system, access and quality of healthcare remain low and the poor in particular rely heavily on private sector provision. The utilization of public health facilities remains low; when seeking healthcare, less than half of Indonesians receive treatment at a public health facility. The reasons for not using public facilities include poor access, low quality of treatment and restricted opening hours. Persistently low government spending on healthcare is at the root of these problems. In the 1990s and especially after the economic crisis, utilization of private health services increased, even though public services were widely available. While the trend has now reversed to an increase in use of public services, the rate is still well below pre-crisis levels (World Bank, forthcoming paper on private health sector, Susenas data). Even the poorest often prefer private providers over highly subsidized public health centers. At present, only in about 45 percent of the occasions that people seek health services do they use public service providers, mostly public primary care and at times public hospitals (World Bank, 2006g).

Indonesia Public Expenditure Review 2007
Spending for Development: Making the Most of Indonesia’s New Opportunities 63
CHAPTER 4 Health
Figure 4.12 Time trend utilization public and private services
Figure 4.13 Number of hospitals by type of provider/owner
62,1 73,7 64,5
11,711,9 14,7
98,9 99,1 93,6
8,3 3,5 4,7
0%
20%
40%
60%
80%
100%
2003 2004 2005
Annu
al U
tiliz
atio
n (p
er 1
00)
Public primary Public hospital Private Traditional
0
200
400
600
800
1000
1200
1400
1998 1999 2000 2001 2002 2003 2004
Nu
mbe
r of
Hos
pita
ls
Minis try of Health Province/Dis trict/MunicipalityArmy/Police State-Owned Enterprise/Other Minis triesPrivate
Source: Susenas 2003, 2004, 2005.Note: Annual utilization rates per 100 and shares of total are reported
Source: MoH, 2004.
Figure 4.14 Specialized vs general care in public and private hospitals, 2003
534432
83185
0
100
200
300
400
500
600
700
Government Hospitals Private Hospitals
Nu
mb
er
of
Ho
spit
als
General Care Provided
Source: MoH, 2004.
More than half of Indonesian hospitals belong to the private sector and ownership has not changed significantly over time. About 51 percent of all hospitals in Indonesia can be classified as public hospitals and, since decentralization, most belong to provinces and districts and to a lesser extent to the army and police, state-owned enterprises and ministries (Figure 4.13). Of those ‘government’ hospitals, the majority provides general care and only about 30 percent of all the specialized health interventions are performed in these public hospitals. For specialized care, Indonesians need to use private healthcare providers (Figure 4.14).
Today, the majority of healthcare professionals in Indonesia engage in the delivery of both public and
private services. In the 1980s, when relatively low salaries of government health workers made it difficult for them to keep practicing their profession, the government—rather than restricting levels of employment and raising salaries—allowed its staff to maintain private practices outside of their normal working hours. While this dual position of public health providers created perverse incentives and lowered the quality of services in the public health system (mainly due to the reduced number of hours these doctors put into public practices), it also allowed the private provision of services to develop and the average number of hours served by trained physicians and paramedics to increase (Figure 4.15). Arguably, the service gap in areas where public provision has been inadequate in supply or quality has to some extent been filled by the private sector. In this situation, private providers are very much part of health service delivery in Indonesia and their training and the contracting and monitoring of services need to be an integral part of government health policy (World Bank, 2006f ).

Indonesia Public Expenditure Review 2007
Spending for Development: Making the Most of Indonesia’s New Opportunities 64
CHAPTER 4 Health
Figure 4.15 Dual practice in Puskesmas
Head of Puskesmas has a Private Practiceoutside of Puskesmas
No19%
NotApplicable
6%
Yes75%
0
12
3
4
56
7
8
Mean # of Hours/dayworking in Puskesmas
Mean # of hours/dayworking outside
puskesmas
Yes
No
Source: GDS1+Puskesmas Survey.
Equity: Inequality in Public Spending, Benefit Incidence and Utilization of Health Services
Inequality in public health expenditures
There are major regional differentials in per capita public health expenditures at the local level, illustrating local disparities and inequalities. Average per capita public expenditures on health are similar across most provinces, with Papua, Gorontalo, East and Central Kalimantan being the main exceptions. However, disparities within provinces and across districts are more common, as there are wide variations around the mean.
Figure 4.16 Per capita public expenditure on health by province, maximum, minimum and mean
0
50
100
150
200
250
300
350
Maluku U
tara
Banten
Lampung
Sulawesi Tenggara
Jawa Barat
Sulawesi U
tara
Nusa Tenggara Bat
Jawa Tim
ur
Sumatra Selatan
Jawa Tengah
Kalimantan Barat
Bengkulu
Yogyakarta
Bangka Belitung
Sulawesi Selatan
Nanggroe Aceh D
arussalam
Sumatra U
tar a
Jambi
Kalimantan Selat
Riau
Maluku
Nusa Tenggara Tim
ur
Bali
Sulawesi Tenga h
Sumatra Bara t
Kalimantan Tenga h
Papua
Gorontalo
Kalimantan Tim
ur
Thou
sand
Rp.
Maximum Minimum Mean
Source: Susenas, 2004.

Indonesia Public Expenditure Review 2007
Spending for Development: Making the Most of Indonesia’s New Opportunities 65
CHAPTER 4 Health
At the district level, there is considerable inequity in public spending, driven in particular by regressively targeted deconcentrated central government expenditures.64 Health expenditures from the central government in the form of deconcentrated spending are ineffective in terms of targeting poorer districts. This is especially important as these public transfers constitute nearly half of central government development expenditures and are therefore crucial resources for policy interventions. Also, in 2004, deconcentrated health expenditures made up about 29 percent of total national health expenditures. Public health expenditures made through the sub-national budget (APBD), at the province as well as the district level, are also higher for richer local authorities than for poorer ones. This is partly explained by the fact that these expenditures are determined not only by DAU allocations, but also by own-source revenues, which tend to be higher in districts with higher per capita expenditures. DAK contributions at the district level are at present not used as a pro-poor tool to improve health service delivery in lagging districts, shown by the weak response of DAK per capita spending or access to health facilities (USAID, 2006).
Benefit incidence of public health spending and utilization of services
Currently, public health spending generally benefits richer income groups more than the poor through regressive subsidies for secondary care. The benefit incidence of public spending on primary healthcare is not pro-poor but neutrally distributed among quintiles. However, spending on secondary healthcare is certainly not pro-poor, with most of the benefits accruing to the richer quintiles. While the public health services most utilized by the poor are basic healthcare facilities, Indonesia spends about 40 percent of public healthcare resources on regressively targeted subsidies to public hospitals. (World Bank, 2006g).
The poor have very little access to public hospitals and, hence, do not make use of the vast majority of the spending that is channeled into secondary care. Of the funding that is spent on hospital care, the benefits that accrue to the poorest quintile of the population are about 10 percent, while those that accrue to the richest quintile are about 38 percent. Spending on secondary care is a highly regressive way of allocating limited resources in healthcare at a time when Indonesia is struggling to meet its medium-term development targets in health.
Figure 4.17 Private/public healthcare utilization Figure 4.18 Type of healthcare utilization
31.0%39.7%
46.2%
53.5%
71.7%
55.5%
0
50.000
100.000
150.000
200.000
250.000
300.000
350.000
400.000
1 (Poor) 2 3 4 5 TOTAL
Per c
apita
Spe
ndin
g in
hea
lth
(Rp.
200
3 pr
ices
)
Private spending Public spending in hospital carePublic spending in primary care
0
5
10
15
20
25
30
35
40
45
Publichealth
centers
Hospitals PrimaryHealthCare
Hospitals PrimaryHealthCare
Hospitals
1987 1998 2005
Poorest quintile Quintile 2 Quintile 3 Quintile 4 Richest quintile
Source: Susenas 2005 Source: World Bank, 2006f, updated with Susenas, 2005.
Government efforts to improve the utilization of health services by the poor and their capture of health spending have had little effect since 1998. The fuel subsidy reduction compensation healthcare program (PKPS-BBM) is aimed at increasing access to both basic and secondary healthcare for the poor in a targeted way. This program, if effectively targeted and implemented, could be the key in expanding health services for the poor (see Box 4.3 on PKPS-BBM below). Nevertheless, for the poor to be able to utilize private healthcare facilities through the program, incentives need to be provided for these providers in order to enable them to participate.
64 See Annex Figure F2 on the relationships between (1a) sub-national health expenditures, (1b) DAK and (1c) Deconcentrated health expenditures and (2) mean per capita household expenditures.

Indonesia Public Expenditure Review 2007
Spending for Development: Making the Most of Indonesia’s New Opportunities 66
CHAPTER 4 Health
Figure 4.19 Utilization of outpatient care, 2005
0
0,5
1
1,5
2
2,5
Poorest 2 3 4 LeastPoor
Annu
al u
tiliza
tion
rate
s out
patie
nt tr
eatm
ent
Private traditional care
Private paramedic
Private Doctor
Private Hospital
Public Hospital
Public Puskesmas
Source: Susenas, 2005.
When the poor seek treatment, they choose private providers in 57 percent of cases. Of those private providers, the poor make most use of private paramedics (nurses, midwives etc) and doctors. With increasing income there is a move away from paramedics towards doctors. The average-odds ratio of participation is highest for the poor in public Puskesmas, private doctors and private paramedics (nurses, midwives etc). This means that investments in these areas, if participation rates remain the same across quintiles, are more likely to benefit the poor than the richer quintiles.65 In contrast, investments in public and private hospitals are among the most pro-rich investments in Indonesia given the underlying utilization rates for health services (World Bank 2006f ). They will remain so unless investments are targeted to make these services more accessible to the poor. The high utilization of private providers by the poor also calls for improvements in stewardship (regulation, accreditation, licensing) of the public health sector in order to control quality and improve equity.
Box 4.3 The PKPS-BBM 2005 health program
In 2005, the government introduced a massive program to counter-balance the negative impact on the poor of the reduced fuel subsidies. This included a Rp 3.875 trillion provision to improve access and quality of health services for the poor. The program provided free access to local health centers, outpatient visits at hospitals and Class 3 ward inpatient services at previously assigned private and public centers. The intervention sought to increase demand for health services by providing health insurance for the 60 million poor and at the same time ensure adequate supply by supporting Puskesmas, mobile health clinics and Posyandu services. An assessment was recently carried out and led to several important findings:
1. Demand-side interventions proved to be an efficient way of improving utilization by the poor, as opposed to classic supply-side interventions.
2. Since formal fees are only part of total expenses faced by those seeking health services, waiving these may only still result in excluding the poor who may be unable to cover transportation and maintenance costs.
3. Supply-side interventions (particularly the provision of medications, physical facilities and medical instruments) had an impact on the quality of services provided by the Puskesmas.
4. Increase in in-patient services (Class 3 wards) resulted in higher income for hospitals.5. Targeting the poor proved to be more difficult than anticipated, in particular as non-poor could not easily be excluded
from program benefits.Areas of improvement highlighted in the report include targeting, public information about the program, funds allocation, complaint resolution system, monitoring and evaluation.
Source: Rapid Assessment of PKPS-BBM 2005 Health Program, 2006.
65 The average-odds ratio of participation, which is given by the ratio of the quintile-specific average participation rate to the overall average, provide a useful tool for understanding the current utilization of services and highlighting those quintiles the services are likely to benefit most.

Indonesia Public Expenditure Review 2007
Spending for Development: Making the Most of Indonesia’s New Opportunities 67
CHAPTER 4 Health
Quality of Health Services and the Health Workforce
Indonesia’s density of doctors and nurses by population is low compared with other countries in the region. While Cambodia’s number of all health personnel distribution per 1,000 is also low, a country such as the Philippines, which has a similar per capita income to Indonesia, performs much better on this indicator. Most provinces have only about 13 public doctors per 100,000 inhabitants, which implies that, on average, a doctor will need to facilitate health services for about 7,600 people who might seek public healthcare.
Table 4.7 International comparison of health workforce
Physicians Nurses Midwives
Country NumberDensity
per 100,000
Year NumberDensity
per 100,000
Year NumberDensity
per 100,000
Year
Indonesia 29,499 130 2003 135,705 620 2003 44,254 200 2003Cambodia 2,047 160 2000 8,085 610 2000 3,040 230 2000Thailand 22,435 370 2000 171,605 282 2000 872 10 2000Viet Nam 42,327 530 2001 44,539 560 2001 14,662 190 2001Philippines 44,287 580 2000 127,595 1,690 2000 33,963 450 2000India 645,825 600 2005 865,135 800 2004 506,924 470 2004Malaysia 16,146 700 2000 31,129 1,350 2000 7,711 340 2000
Source: WHR, 2006, Annex Table 4 ‘Global Distribution of Health Workers in WHO Member States’
The national averages mask significant regional disparities in terms of health personnel supply not necessarily based on needs. Provider per population rates differ greatly across regions, with only six public doctors per 100,000 population in Lampung and East Java, as opposed to ratios as high as 30 and 40 per 100,000 in North Sulawesi and Bali, respectively. In many provinces these ratios improve when the private doctors are included but, even then, service areas remain large. For example, in West Kalimantan, on average, a doctor will have to serve an area of about 300km² and the service area doubles for people who can only afford services from public doctors. On average, there are about 36 health workers per 100,000 population in Indonesia.
Figure 4.20 Ratio midwives (bidan) and service area in km2
0
2
4
6
8
10
12
AN
D aupaP
luk gneBu uk u la
M
uk ul aM
sewa luS
i
TN
T sewa luS
i retam uS
a na tn am il aK
sew alu S
i r etamuS
a n a tn am il aK
bma J
i r etamu S
a la tnoroG
o na tn amil aK
sewa lu S
i laBi na tna
m il aKa kg n aB
gn upm aL
aw aJ
Ju
m iT awa
r u aiR
TN
B ID
tara B aw aJ
net na B
0
50
100
150
200
250
bidan ratio area serviced
Source: Podes, 2005.
Ratios of nurses and midwives per population are far higher than those of physicians, but again regional distribution issues exist. The midwives’ service areas for public midwives are generally smaller than those of doctors (depending on the number of private service personnel in any given province). Aceh has a particularly high figure, with around 111 midwives per 100,000 population, whereas Banten only has 20 midwives per 100,000. Ratios for nurses per population are high, which implies that, given the low doctor density, most people (particularly the poor)

Indonesia Public Expenditure Review 2007
Spending for Development: Making the Most of Indonesia’s New Opportunities 68
CHAPTER 4 Health
will be serviced by nurses and other assisting health personnel rather than by doctors. When analyzing the figures for more skilled and specialized personnel, such as public dentists (national average 2.9), pharmacists (national average 0.6) and nutritionists (national average 3.2), density in most remote provinces is close to zero.
Figure 4.21 Distribution doctors and midwives
3.14.1
3.6
0.60
1
2
3
4
5
bidan urban bidan rural doctorurban
doctor rural
Source: Podes, 2005.
Differences within provinces are particularly characterized by health providers favoring urban over rural and remote areas, although more midwives are found in rural areas. Incentives should be increased, particularly for skilled health personnel, in order to encourage them to relocate to rural and remote areas.
The number of doctors per health center is mostly insufficient, particularly given that the average health center facility serves around 23,000 people (Figure 4.22). The poor, who are largely dependent on these health centers, need to travel large distances to reach the facilities (the average Puskesmas serves those within an area of 242km²). In the province of Aceh, for
example, the distance to a Puskesmas is about 10km on average, but in some districts it comes close to 26km. The availability of a doctor at each Puskesmas is also not guaranteed; overall, 18 out of Indonesia’s 33 provinces have, on average, less than one doctor per Puskesmas. Consequently, people are dependent on less equipped and smaller integrated health posts (Posyandu) or possibly private nurse practitioners, midwives, or traditional care.
Figure 4.22 Population per Puskesmas
0
10000
20000
30000
40000
50000
60000
Bant
en
Jaw
a Ba
rat
Jaw
a Ti
mur
Jaw
a Te
ngah
Lam
pung NTB Bali
Riau
Sum
ut
Indo
nesia DIY
Sum
sel
Kepu
laua
n Ri
au
Sum
bar
Sula
wes
i Sel
atan
Gor
onta
lo
Kalim
anta
n Ba
rat
Jam
bi
NTT
Sula
wes
i Bar
at
Kalim
anta
n Se
lata
n
Mal
uku
Uta
ra
Sulw
asi U
tara
NAD
Kepu
laua
n B
Belit
ung
Sula
wes
i Ten
gah
Kalim
anta
n Te
ngah
Kalim
anta
n Ti
mur
Beng
kulu
Sula
wes
i Ten
ggar
a
Mal
uku
Irian
Jaya
Bar
at
Papu
a
Population per Puskesmas
Source: Health Profile 2004, Ministry of Health.
The Ministry of Health is making an effort to improve the distribution of health personnel by encouraging contractual temporary doctors (PTT) to serve in remote areas by providing additional financial incentives and shortening their service periods in particular areas. There are various wage categories for these contract doctors based on their location. Salaries in ordinary areas are about Rp 1 million a month for three years. Those in areas classified as very remote, earn about Rp 5 million a month and are required to work there for only six months. This higher level of remuneration in remote areas is part of a new regulation that came into effect in June 2006 and signals the government’s commitment to improving the distribution of health personnel across the country. Nevertheless, this regulation only covers contractual doctors and the government may wish to consider encouraging districts to provide similar incentives for other medical personnel contracted at the local level. This will require an assessment of civil service laws and regulations that may constrain policy changes.

Indonesia Public Expenditure Review 2007
Spending for Development: Making the Most of Indonesia’s New Opportunities 69
CHAPTER 4 Health
Figure 4.23 Doctors per Puskesmas
0,0
0,2
0,4
0,6
0,8
1,0
1,2
1,4
1,6
1,8
Kepu
laua
n Ri
au
Sum
ut
Bali
DIY
Lam
pung
Jaw
a Te
ngah
Kalim
anta
n Ti
mur
Kalim
anta
n Te
ngah
Gor
onta
lo
Beng
kulu
Bant
en
Jaw
a Ti
mur
Jam
bi
Mal
uku
Uta
ra
Indo
nesia
NTB
Kalim
anta
n Se
lata
n
Riau
Sula
wes
i Sel
atan
Sula
wes
i Ten
gah
Sula
wes
i Bar
at
Sum
sel
Jaw
a Ba
rat
Kepu
laua
n B
Belit
ung
Sula
wes
i Ten
ggar
a
Sulw
asi U
tara
Sum
bar
Kalim
anta
n Ba
rat
NAD NTT
Mal
uku
Irian
Jaya
Bar
at
Papu
a
Doctors per Puskesmas
Source: Health Profile 2004, Ministry of Health.
Figure 4.24 Puskesmas - sources of medication
Most puskesmas do not get medication other than those provided by the dinas
Yes, from other
sources9%
No58%
Yes, from own
budget33%
Source: GDS1+ Survey.
Monthly and hourly salaries of public doctors, midwives and nurses appear to compare favorably with those of other workers of similar education,66 but incentives are needed for them to provide quality services to the poor. Given that public doctors can significantly complement their public salaries by practicing privately, it is hard to determine whether current public wage levels are adequate. A 1994 review of the health sector workforce estimated that private practice accounted for about 79 percent of total income for specialists in urban areas and varied from 25 to 70 percent for rural general practitioners in outer islands (non-Java/Bali). Given that the poor also use private sector healthcare, albeit less than the rich, doctors (private and public) need incentives to provide quality services to the poor.
Overall, the quality of healthcare services in Indonesia is low, with low availability of medication, inadequate infrastructure and often an insufficient supply of healthcare personnel. Service
delivery is further reduced by high absentee rates of health personnel. A recent study has shown that Indonesian health workers are absent about 40 percent of the time.67 Low quality facilities, the lack of water and low living standards appear to provide too few incentives for health workers to stay at their assigned posts. Puskesmas indicators from the GDS+1 survey further indicate that the average Puskesmas only has between 75 and 80 percent of the basic drugs and medication that such a health facility should have,68 and there are also shortages (around 7 to 9 percent) in terms of essential vaccines. Most Puskesmas only receive medication from the local Dinas. If the local government does not supply them adequately, their own budgets tend to be insufficient to compensate for shortages.
66 Based on econometric analysis performed with the Sakernas labor force survey, 2004, from BPS Indonesia. See Annex Table F.3 for the regression outputs. 67 Providers were counted as absent if they could not be found in the facility for any reason at the time of a random unannounced spot check. Source: Chaudhury, et. al (2006). 68 Calculated by taking the mean number of missing drugs in each Puskesmas and dividing by the number of basic drugs the Puskesmas should have (12 basic). Dataset: GDS33 Puskemas. The twelve basic medicines and their availability rates are: Amoxixilin 500mg (73 percent), Amoxixilin Syrup (75 percent), Antalgin 500mg (89 percent), CTM (84 percent), Paracetamol 500mg (90 percent), Paracetamol syrup (77 percent), OBH (77 percent), Oralit (84 percent), Cotrimoxaxol 480 (78 percent), Antacid tables (87 percent), Anti TBC med (71 percent), and OAT for children (67 percent).

Indonesia Public Expenditure Review 2007
Spending for Development: Making the Most of Indonesia’s New Opportunities 70
CHAPTER 4 Health
Policy Recommendations
In the longer term, the government should consider allocating more resources to health expenditure, as Indonesia currently spends less than one third on health compared with other countries in the region and has the lowest health spending in the region. However, the government should first focus on allocation efficiency and equality before considering an overall increase in health spending. In general, health expenditures are low in Indonesia, but as this PER clearly shows the main problem is the inefficient and unequal allocation of the available resources. Given the challenges the health sector is facing, and considering the government’s increased fiscal space and the low levels of spending compared with other countries in the region, a logical recommendation would be to raise the level of public health spending to around 3 percent of GDP. This would achieve a level similar to that of the second-lowest spender in the region, the Philippines. However, this review also shows clear inefficiencies and inequalities in the allocation of funds across income groups and districts. Government policies in the sector have not been properly reflected in the budgetary allocation, with more resources going to services predominantly used by richer income quintiles. It is therefore strongly recommended to focus first on equity and allocative efficiency before considering an overall increase in health spending.
Inequalities should be reduced by increasing access to and quality of health services for the poor. This can be achieved by better targeting DAK allocations to poor and under-served districts and by investing in demand-side activities that improve poor people’s access to quality health services.
Targeting of DAK allocations should be improved in order to ensure that these funds can be used to increase access to health services especially in poorer, under-served districts. Currently, public health spending generally benefits richer income groups more than the poor through regressive subsidies for secondary care. Specialized intergovernmental funding allocations (DAK) for the health sector from the center to local governments are badly targeted, as the transfers are not related to the mean per capita expenditures at the district level. The DAK should be better used as a central government instrument to target those districts that have shortcomings in terms of access to health service delivery, particularly as these funds can be spent on health infrastructure. Investing in demand-side activities that increase the access of the poor to quality healthcare. Pro-poor financing for hospital care is being implemented through targeted vouchers (health cards) and should be expanded. The system provides free healthcare for the poor and is intended to improve the quality of care accessible to the poor. In order to improve the poverty reduction impact of health financing, all other subsidies to secondary care facilities should be channeled into primary care. There may be special merit in subsidizing ambulatory care, especially in remote regions. Allowing the poor to claim health-card benefits when using private providers could be an additional policy option. Investing in improvements in the quality of private-sector providers giving healthcare to the poor would further improve the situation.
Priority should be given to identifying the right mix of investment to improve the effectiveness of the health sector in dealing with the double burden of common communicable and non-communicable diseases, as well as emerging diseases, such as HIV/AIDS and avian influenza.
Persistent communicable diseases and low performance on the main MDG outcome indicators reiterate the continued importance of investment in preventive care. On MDG indicators such as infant and under-five mortality rates, as well as for maternal mortality, Indonesia’s performance is still lagging behind. These rates can be improved by strengthening preventive care and intensifying programs that tackle communicable diseases, particularly in remote and less developed areas of Indonesia. In response to the re-emergence of polio, additional rounds of campaigns and adequate funding are urgently needed. As non-communicable health interventions are becoming increasingly important, the public health sector will need to be adequately equipped to address these challenges. Although Indonesia has a strong private health sector, which provides the majority of specialized care, addressing the rising number of non-communicable diseases, particularly among the poorer segments of the population, will require general hospitals to provide similar services to accommodate the higher (as well as more specialized) demand. In order to tackle emerging diseases such as HIV/AIDS and avian influenza, health information and surveillance systems will need to be improved. Building an evidence base, strengthening a weak
•
•
•
•
•

Indonesia Public Expenditure Review 2007
Spending for Development: Making the Most of Indonesia’s New Opportunities 71
CHAPTER 4 Health
surveillance system and programming for preventing transmissions are priority areas. Improved data on health spending and disbursements at the district and provider level are also required in order to ensure policy is guided by efficiency principles and equitable utilization. Especially since decentralization, there has been a lack of transparency in budget flows and expenditures. At the district level, there is particularly limited information about programmatic and development expenditures. Greater information on functional expenditure allocations would further enable unit-cost analysis that could provide insights in determining adequate levels of spending for the health sector.
The public sector should take a larger role as steward of the entire health system through regulation, licensing and accreditation of private providers and services to ensure the quality of these services. The private sector in Indonesia’s health system has grown dramatically over the past decade. Despite the importance of the private providers, little is known about who they are, where they are and what services they provide. Almost 40 percent of the poor who seek healthcare treatment do so from private providers. Moreover, determining the ‘right’ level of spending for the public sector requires better insights into the level and scope of private provision of healthcare.
The right combination of coordinated and reinforcing measures to ensure a more equal distribution of health service providers, especially doctors, needs to be identified to improve effectiveness of investments. Given persisting inefficiencies and inequalities in the distribution of the health sector work force and considering that the majority of public routine expenditures at provincial and district level are allocated to pay for the salaries of health providers, there is an urgent need to look into how these funds can be spent more efficient and equally. A number of policies and incentive structures have already been tried in Indonesia but have not proved sustainable. To help in identifying the right combination of coordinated and reinforcing measures, two important questions need to be answered: (i) what is the nature of the current health workforce, including both public and private providers, and is it adequate to achieve the current priority outcomes in terms of quantity and quality; and (ii) what would keep doctors and other health providers, whether public or private, in remote areas for a sufficient period of time to meet healthcare needs in those areas?

Indonesia Public Expenditure Review 2007
Spending for Development: Making the Most of Indonesia’s New Opportunities 72
CHAPTER 4 Health