Embed Size (px)
Citation preview

Chapter 4Experiences of industrial policy in the past and the present
57
Transformative Industrial Policy for Africa

I n Chapter 3, we discussed the theoretical arguments for and against industrial policy. We have seen that there are a lot more justifications for industrial policy than is recognised by the mainstream of economics. We also reviewed various theoretical criticisms of
industrial policy and pointed out that many of them are on shaky grounds while even the valid criticisms are often exaggerated.
However, the reader may still ask: theoretical arguments are all very well, but how about the practice? Didn’t all the rich countries, with only a couple of exceptions like Japan and Korea, develop their economies through free-market and free-trade policies? Moreover, didn’t the developing countries mess up their economy when they tried to use industrial policy before the 1980s? Whatever their records of industrial policy are before the 1980s may have been, haven’t the developing countries seen the error of their old ways and stopped using industrial policy since then? The answers to these questions, this chapter will show, are all basically in the negative.
In section 4.1 we will show how today’s rich countries – starting from 18th century Britain down to late 20th century Korea, Taiwan, and Singapore – have used an extensive range of industrial policy measures, with exact mix of policies depending on the country and the time. The focus will be on policies for the manufacturing sector, but we will also look at ‘industrial policy’ for other sectors – agriculture, natural resource-based industries (e.g. mining, logging), and services (e.g. finance, shipping). We also look at policies for infrastructure, skills, R&D, and physical investments, which are not industrial policies as we have defined it in this report but are closely related to industrial policy and need to be closely coordinated with it.
Section 4.2 will discuss how it isn’t just today’s rich countries that have had successfully used industrial policy. We will review the industrial experiences of the more advanced developing countries and show how they have had industrial policy successes in at least some sectors. We look at China, Brazil, Chile, United Arab Emirates (UAE), and Malaysia. Except for China, whose industrial policy success has been very broad-based, we provide a discussion of industrial policy experiences in individual sectors, as well as an overview of industrial policy, for each country: Brazil (agro-industry), Chile (salmon and other agro-industries), the UAE (aluminium), and Malaysia (palm oil-related industries as well as electrical and electronics).
In section 4.3 we look at the industrial policy experiences of the poorer developing countries today and show how even some of the poorest countries have had some success in industrial policy, albeit usually in a limited number of sectors and to a modest degree. We look at the overall industrial policy experiences and some sectoral experiences (not all of them necessarily clear success stories) in Vietnam (apparel, shipbuilding), Uzbekistan (automobile), Ethiopia (leather, textile and garments, flowers, and cement), and Rwanda (ICT-based services, tourism).
Before moving on to the presentation of the cases, let us first make it clear that, in presenting these cases, we openly reject the view of some sceptics who believe that no country can
Economic Commission for Africa
58

learn lessons from another, because they all face different conditions. It is true that no two cases are exactly the same, but that does not mean that you cannot learn any lesson from another country. You can always draw some lessons from all cases, although some cases may be more relevant than others for you. Indeed, learning lessons from the more economically advanced countries, which you are trying to catch up with, is at the heart of the history of economic development.26
Even while we firmly believe that any country can learn something from all countries, we do not present the cases in this chapter as ‘models’ to emulate.
First, we present them partly as illustrations of general theoretical principles involved in industrial policy, which we discussed in Chapter 3 and elsewhere in the report: some deviation from comparative advantage is absolutely essential for the economic development of developing countries; R&D supports, skills development, infrastructural investments, and other supposedly ‘horizontal’ policies often need to be designed with sector-specific considerations in mind; regulation of FDI in some form is required, if the host country is to maximise the positive impacts of FDI on local productive capabilities; and so on.
Second, these cases are also presented as parts of a ‘treasury’ of case knowledge, which industrial policy-makers can utilise in drawing lessons that they think are helpful for their own countries. Even from the same case, different countries may be able to learn different things, depending on the differences between their conditions (e.g. country size, natural resource endowment, political conditions, and the global economic environment). Even when two countries are similar, they may want to learn different things from the same case, if they have different goals (e.g. one country may be more concerned about regional inequality than another, one may want to be more open to the outside world than another).
Last but not least, we deliberately present a wide range of cases – from Britain in the 18th century to today’s Rwanda, from the electronics industry to the salmon industry – in order to free the policy imagination of developing country (especially African) industrial policy-makers. Real-life policy experiences are based on policy options that simply cannot be imagined purely on theoretical bases, as our case material will clearly show. We believe that knowing a wide range of different cases, especially the ones with the least promising conditions (e.g. Korea in the 1960s or Ethiopia today) or the most audacious goals (e.g. Japan in the 1950s), liberates policy-makers from the tyranny of conventional wisdom, in which only a narrow range of policy possibilities – and at that in very simplified and sometimes even misleading forms – that fit with the dominant economic theory are considered.
26 In this regard, it is interesting to note that those who are sceptical about learning lessons from other countries tend to employ a double standard in that they believe that every country can – and indeed should – learn the free-market, free-trade model of Britain and the US.
Transformative Industrial Policy for Africa
59

4.1. INDUSTRIAL POLICY EXPERIENCES OF TODAY’S RICH COUNTRIES
4.1.1. Industrial policy experiences of today’s rich countries after World War II
Even though there was a lot of denial about the very existence of industrial policy in the East Asian ‘miracle’ economies in the earlier phase of the debate on industrial policy, these days few people dispute that industrial policy was the key to the East Asian economic ‘miracle’ (see Chang, 2011, for a comprehensive criticism of those studies that accept the existence of industrial policy in those countries but deny its positive contributions).
East Asian industrial policy was more than simple infant industry protection through trade protectionism (through tariffs, quotas, and other quantitative restrictions) and subsidies (often in the form of ‘directed credits’) for strategic industries. It included a wide range of policy measures, used in different proportions and with different intensities in different countries.
They included: (i) coordination of complementary investments (the so-called Big Push); (ii) coordination of competing investments through entry regulation, ‘investment cartels’, and (in declining industries) negotiated capacity cuts; (iii) policies to ensure scale economies (e.g. licensing conditional upon production scale, emphasis on the infant industries starting to export from early on, state-mediated mergers and acquisitions); (iv) measures to promote technology transfer and absorption (e.g. the screening of technology imports, caps on licensing royalties, and lax intellectual property rights laws); (v) regulation on FDI (e.g. entry and ownership restrictions, local contents requirements, technology transfer requirements, export requirements); (vi) the use of SOEs to promote strategic industries, especially in the case of Taiwan; (vii) the state acting as a venture capitalist and incubating high-tech firms; (viii) mandatory worker training for firms above a certain size, in order to resolve the problem of under-investment in the training of skilled workers due to the possibility of poaching ; (ix) export promotion (e.g. export subsidies, export loan guarantees, marketing help from the state trading agency); (x) government allocation of foreign exchanges, with top priority going to capital goods imports (especially for export industries) and the bottom priority to luxury consumption good imports.
Many people believe that these policies were unique to the East Asian economies. They believe that the East Asian countries could deviate from the best-practice policies – of free trade and free market – but still economically succeed only because they had a lot of ‘countervailing forces’ that cancelled out the negative effects of industrial policy. Unfortunately, no convincing arguments as to the nature of these countervailing forces have been made. Culture (allegedly leading to high savings rate, strict work ethic,
Economic Commission for Africa
60

high-quality bureaucracy), the legacy of Japanese colonialism (supposedly leading to exceptionally high literacy and broad industrial base), and Cold War politics (which is argued to have led to exceptionally high foreign aid and special access to the US market) are frequently cited candidates, but none of them even pass the minimum factual tests (Chang 2007, Ch. 9, on culture; Chang 2006, on Japanese colonialism and the Cold War).27
However, many of the ‘East Asian’ industrial policy measures mentioned above were used by other rich countries between the 1950s and the 1980s, the period of ‘East Asian Miracle’.
As we briefly mentioned above and as it is rather well known, between the 1950s and the 1980s, France implemented industrial policy that is very similar to that of the East Asian countries, even including the use of indicative planning of the kind used actively in Japan and Korea (Cohen, 1977; Hall, 1986). France actively used SOEs to spearhead industrial upgrading. It had an SOE sector that was, accounting for around 15 per cent of GDP, one of the largest in the capitalist world at the time (except for the oil states, most of whose oil is owned by SOEs). It also extensively used directed credit programmes through the banks, most of which were owned by the state, as it was in the case of Korea and Taiwan (Japan’s commercial banks were privately owned, although they were strictly controlled by the state until the 1980s).
Finland, Norway, and Austria, also pursued (selective) industrial policy, often with even greater successes than France, during this period (Katzenstein 1985). All three countries extensively used SOEs and especially Austria had an SOE sector that was one of the largest in the capitalist world. Finland restricted FDI heavily until recently – between the 1930s and 1980s, it used to classify all firms with more than 20 per cent foreign ownership as ‘dangerous enterprises’ (Chang, 2004).
In some countries, there was relatively little national level industrial policy, but there was (and still is) a lot of industrial policy at the level of the regional government – Italy and Germany are such examples (Piore and Sabel 1984; Chang et al., 2013). Local governments in these countries promoted particular ‘industrial districts’, specialising in a few sophisticated products, through directed credits (from local banks, often owned by the local government), R&D support, and export marketing help.
27 Let us provide some basic factual refutation of these ‘countervailing forces’ arguments, a full treatment of which is beyond the scope of this report. Before their economic development, the East Asians were typically described as lazy, un-enterprising, individualistic people; ‘living for today’ (see Chang, 2007 b, Ch. 9). Korea’s savings rate (savings as a proportion of GDP) on the eve of its economic miracle was barely 5 per cent and started rising after growth took off. At the end of the Japanese colonial rule, literacy ratio in Korea was only 22 per cent and its industrial base was smaller than that of Ghana (Chang, 2006b). It was only in the 1950s that Korea and Taiwan got an exceptionally high amount of foreign aid in per capita terms (Chang 2006). As far as I know, no one has provided any concrete evidence for the “special market access” story. Until the 1980s, Korea and Taiwan were buying up textile quotas from other developing countries that could not even fill their MFA (multi-fibre agreement) quotas for the US, showing that, even if it was there, the special market access could not provide big enough export markets to these two countries.
...many of the ‘East Asian’ industrial policy measures were used by other rich countries between the 1950s and the 1980s, the period of ‘East Asian Miracle’.
Transformative Industrial Policy for Africa
61

While being the standard-bearer of the free-market ideology since the 1950s (although not before that – see below), the US government also ran a huge (if somewhat wasteful) industrial policy programme under the guise of R&D supports and government procurement for defence and public health (Block 2008; Mazuccato, 2013). Between the 1950s and the 1980s, the US federal government financed anywhere between 47 per cent and 65 per cent of national R&D spending, as against around 20 per cent in Japan and Korea and less than 40 per cent in several European countries (e.g. Belgium, Finland, Germany, Sweden) (Mowery and Rosenberg 1993, p. 41, table 2.3 for the US; the OECD data set for the other countries).28 It is extremely telling that most of the industries in which the US still has international technological leadership are industries that were set up and nurtured by the government through public funding of R&D and procurement (often at inflated prices) – aircraft, computer, semiconductor, internet, and genetic engineering, just to name the most important ones.
Our discussion in this section shows that, even though it was its use by the East Asian ‘miracle’ countries that has stimulated the post-WWII debate on industrial policy, it wasn’t just these countries that used industrial policy during this period. Industrial policy has been present in almost all of today’s rich countries during much of this period far more extensively and intensively than most people, including some proponents of industrial policy, think, with the exact mix of policies depending on the country and the time.
4.1.2. Industrial policy experiences of today’s rich countries at the earlier stages of their economic development
Even more relevant for today’s developing countries than the industrial policy experiences of today’s rich countries in the post-war period are the industrial policy experiences in the earlier stages of their economic development, when they were facing similar problems with those faced by today’s developing countries (see Bairoch 1993; Chang 2002, 2004, and, 2007, for further details).
Contrary to the popular myth, in the earlier days of their industrialisation between the late 18th century and the early 20th centuries, all of today’s rich countries, with notable exceptions of the Netherlands and (until WWI) Switzerland, provided significant degrees of tariff protection for ‘infant’ producers for substantial periods (see figure 4.1). During most of the period, most countries had average manufacturing tariff rates well above the level found in developing countries today, which is around 10 per cent.
Moreover, the average rate of tariffs do not give us the full picture of the extent to which tariff protection was a key part of the development strategy of today’s rich countries in the earlier period. Germany and Sweden provided targeted protection to their nascent
28 The share of federal government in total R&D spending was 5.36 per cent in 1953, 56.8 per cent in 1955, 64.6 per cent in 1960, 64.9 per cent in 1965, 57.1 per cent in 1970, 51.7 per cent in 1975, 47.2 per cent in 1980, 47.9 per cent in 1985, and 47.3 per cent in 1989 (estimated).
Economic Commission for Africa
62
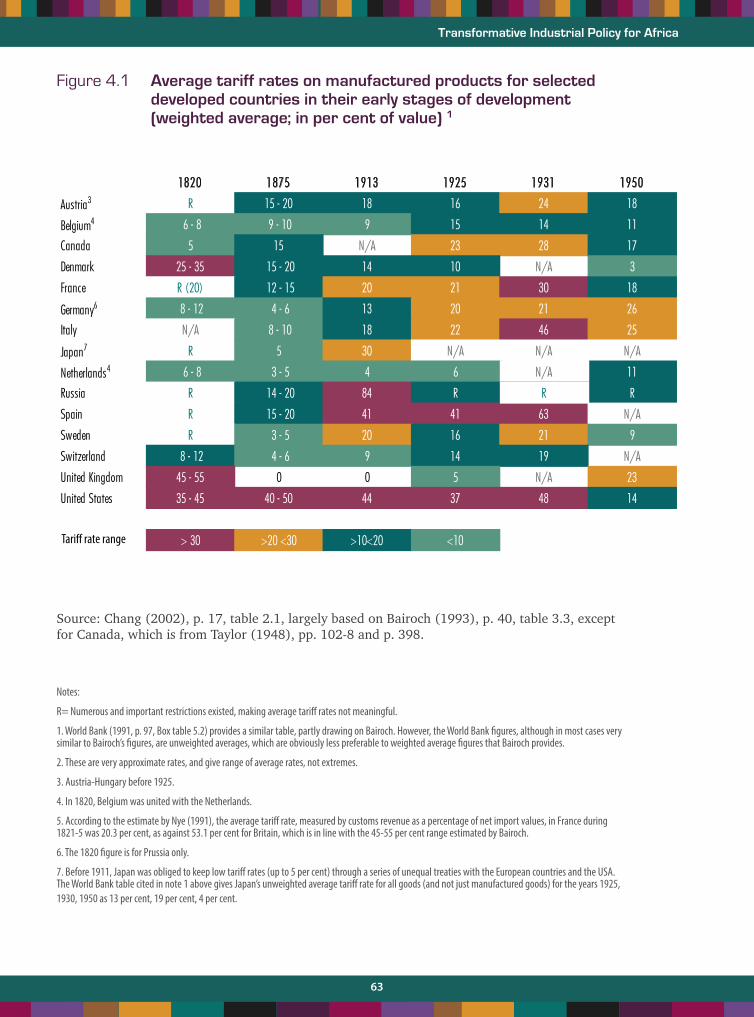
Figure 4.1 Average tariff rates on manufactured products for selected developed countries in their early stages of development (weighted average; in per cent of value) 1
Source: Chang (2002), p. 17, table 2.1, largely based on Bairoch (1993), p. 40, table 3.3, except for Canada, which is from Taylor (1948), pp. 102-8 and p. 398.
Notes:
R= Numerous and important restrictions existed, making average tariff rates not meaningful.
1. World Bank (1991, p. 97, Box table 5.2) provides a similar table, partly drawing on Bairoch. However, the World Bank figures, although in most cases very similar to Bairoch’s figures, are unweighted averages, which are obviously less preferable to weighted average figures that Bairoch provides.
2. These are very approximate rates, and give range of average rates, not extremes.
3. Austria-Hungary before 1925.
4. In 1820, Belgium was united with the Netherlands.
5. According to the estimate by Nye (1991), the average tariff rate, measured by customs revenue as a percentage of net import values, in France during 1821-5 was 20.3 per cent, as against 53.1 per cent for Britain, which is in line with the 45-55 per cent range estimated by Bairoch.
6. The 1820 figure is for Prussia only.
7. Before 1911, Japan was obliged to keep low tariff rates (up to 5 per cent) through a series of unequal treaties with the European countries and the USA. The World Bank table cited in note 1 above gives Japan’s unweighted average tariff rate for all goods (and not just manufactured goods) for the years 1925, 1930, 1950 as 13 per cent, 19 per cent, 4 per cent.
Contrary to the popular myth, in the earlier days of their industrialisation between the late 18th century and the early 20th centuries, all of today’s rich countries,
with notable exceptions of the Netherlands and (until WWI) Switzerland, provid-ed signi�cant degrees of tariff protection for ‘infant’ producers for substantial
periods (see table 4.1). During most of the period, most countries had average manufacturing tariff rates well above the level found in developing countries
today, which is around 10 per cent.
0
10
20
30
40
50
60
70
80
90
1820 1875 1913 1925 1931 1950Austria3 Belgium4
Canada
Denmark
France
Germany
Italy Japan7
Netherlands
Russia Spain Sweden
Switzerland
United Kingdom
United States
1820 1875 1913 1925 1931 1950
Austria3 R 15 - 20 18 16 24 18
Belgium4 6 - 8 9 - 10 9 15 14 11
Canada 5 15 N/A 23 28 17
Denmark 25 - 35 15 - 20 14 10 N/A 3
France R (20) 12 - 15 20 21 30 18
Germany6 8 - 12 4 - 6 13 20 21 26
Italy N/A 8 - 10 18 22 46 25
Japan7 R 5 30 N/A N/A N/A
Netherlands4 6 - 8 3 - 5 4 6 N/A 11
Russia R 14 - 20 84 R RR
Spain R 15 - 20 41 41 63 N/A
Sweden R 3 - 5 20 16 21 9
Switzerland 8 - 12 4 - 6 9 14 19 N/A
United Kingdom 45 - 55 0 0 5 N/A 23
United States 35 - 45 40 - 50 44 37 48 14
> 30 >20 <30 >10<20 <10
World’s highest levels of tariff protection
Tariff rate range
Transformative Industrial Policy for Africa
63

heavy and chemical industries in the late 19th and the early 20th centuries. Belgium may have been one of the least protected economies in the 19th century, but it provided much targeted protection during the period. In the mid-19th century, when the country’s average industrial tariff was around 10 per cent, tariffs reached 30-60 per cent for cotton, woollen, and linen yarn, and 85 per cent on iron (Milward and Saul, 1977 p. 174).
Interestingly, the most protectionist among today’s rich countries in the past were not countries like France, Germany, and Japan, which people these days most frequently associate with protectionism. It was actually Britain and the US – the supposed homes of free trade. During most of their respective catch-up periods – from the mid-18th to the mid-19th century for Britain and from the mid-19th century to the mid-20th century for the US – they had the world’s highest levels of tariff protection (45-55 per cent) (figure 4.1).
From the 14th century, Britain had used aggressive industrial policy vis-à-vis the woollen manufacturing industry, the hi-tech industry of Europe until the 18th century, which was then centred in the Low Countries (what are the Netherlands and Belgium today). British producers were given tariff protection and subsidies, while export taxes and occasionally export bans on raw wool were deployed to maximise the availability of raw materials to British producers. These measures were intended to transform Britain from a supplier of the raw material (raw wool), into a manufacturing centre of woollen textile. In large part thanks to these measures, by the 18th century, woollen textile accounted for at least half of Britain’s export revenue, enabling it to import the vast quantity of raw materials (e.g. cotton) and food needed for the Industrial Revolution.29
Britain’s industrial policy moved into a higher gear when Robert Walpole, the so-called first British Prime Minister, came to power in 1721. Upon coming to power, Walpole introduced a wide range of industrial policy measures across industries, and not just for the woollen manufacturing industry. Introducing the new law, Walpole stated, through the King’s address to the Parliament: “it is evident that nothing so much contributes to promote the public well-being as the exportation of manufactured goods and the importation of foreign raw material” (as cited in List, 1885, p. 40).30 Walpole’s policies were very similar to (and indeed the templates for) what subsequently came to be known as the East Asian industrial policy – infant industry protection, export subsidies, import tariff rebates on inputs used for exporting, export quality control by the state (Brisco 1907). And between Robert Walpole’s industrial policy reform and the country’s transition to full free trade in the 1860s (and not in 1846 by the repeal of the Corn Laws, as it is commonly believed), Britain implemented a most aggressive industrial policy regime, centred around high tariff protection.
If Britain was the first country to have successfully launched a large-scale infant industry promotion strategy, its most ardent user was the US – Paul Bairoch once called it “the mother country and bastion of modern protectionism” (Bairoch, 1993, p. 30). Indeed, the theory (although not the practice) of infant industry promotion was developed by Alexander Hamilton, the country’s first Treasury Secretary, who advocated protectionism for the US
29 Cloth exports (mostly woollen) accounted for around 70 per cent of English exports in 1700 and was still over 50 per cent of total exports until the 1770s (Musson, 1978, p. 85).
30 In List’s view, this “for centuries had been the ruling maxim of English commercial policy, as formerly it had been that of the commercial policy of the Venetian Republic” (List, 1885, p. 40).
Economic Commission for Africa
64

against advice from Adam Smith and other European economists, like Jean Baptiste Say.31 Between 1816 and the end of WWII, the US had one of the highest average tariff rates on manufacturing imports in the world (see figure 4.1). Given that the country enjoyed an exceptionally high degree of ‘natural’ protection due to high transportation costs at least until the 1870s, we can say that the US industries were literally the most protected in the world until 1945.
It wasn’t just trade protectionism and subsidies for the strategic industries that today’s rich countries used during the earlier stages of their economic development. A wide range of industrial policy measure was deployed.
First, in relation to SOEs, some of today’s rich countries set up SOEs in new industries, in order to kick-start their industrialisation. In (pre-unified) Germany - King Frederick the Great (1740-86), started the industrialization process in Prussia by setting up ‘model factories’ in the steel and the linen industries. In the late 19th and the early 20 centuries, Japan did the same in a number of industries – notably in shipbuilding, mining, textiles (cotton, wool, and silk), and steel industries.
Second, in the 19th century, the US, the then main destination of European FDI, heavily regulated FDI. Between 1817 and 1914, coastal shipping was completely closed for FDI, while only American citizens could become directors in a national (as opposed to state) bank and foreign shareholders were not even allowed to vote in AGMs. In relation to natural resources, federal mining laws in 1866, 1870, and 1872 restricted mining rights to US citizens and companies incorporated in the US, while the 1878 timber law permitted only US residents to log on public land. Restrictions on foreign investment in manufacturing were relatively rare, as such investment was not very important until the late 19th century, but the 1885 contract labour law prohibited the import of foreign workers.
Third, today’s rich countries used the intellectual property rights (IPRs) regime as a tool of industrial policy. They deliberately provided very weak protection for foreigners’ intellectual property rights IPRs in an attempt to maximize technology (and other knowledge) transfer from the economically more advanced nations. So, many countries – Britain, the Netherlands, the US, France, and Austria – explicitly allowed patenting of foreigners’ inventions. The US didn’t protect foreigners copyright until 1891. Most interestingly, the Netherlands and Switzerland refused to protect patents until the early 20th century. Switzerland introduced the first patent law only in 1888 but it protected only mechanical inventions in a deliberate attempt to allow its chemical and pharmaceutical companies to ‘borrow’ technologies freely from their German counterparts – a full-blown patent law was introduced only in 1907 (even then it only granted process, as opposed to product, patents in chemicals and pharmaceuticals until the 1978). The Netherlands had abolished its early patent law (introduced in 1817) in 1869 and didn’t re-introduce it until 1912. It was thanks to the absence of the patent law that Philips could establish itself successfully – it started out in 1899 by manufacturing light bulbs, the technologies necessary for whose production was all patented either by Thomas Edison or by his company, General Electric.
31 In his Wealth of Nations, Adam Smith wrote: “Were the Americans, either by combination or by any other sort of violence, to stop the importation of European manufactures, and, by thus giving a monopoly to such of their own countrymen as could manufacture the like goods, divert any considerable part of their capital into this employment, they would retard instead of accelerating the further increase in the value of their annual produce, and would obstruct instead of promoting the progress of their country towards real wealth and greatness” (Smith, 1973 [1776], pp. 347-8).
Transformative Industrial Policy for Africa
65

Fourth, many of today’s rich country governments invested in – or subsidised the investments by the private sector in – infrastructure, education, and R&D. The German government financed road building (especially in the Ruhr, the centre of German manufacturing), the Swedish government built the main train lines, and the US government provided free public land and subsidies to railway companies. Many governments invested in education – not just in primary education (the US, Sweden) but also in vocational education (Germany). The government of these countries also invested in industrial R&D. Germany, Sweden, the US, and Japan are the best examples. The governments of the US the Netherlands, and Japan heavily invested in R&D in agriculture (Chang, 2009).
Our discussion in this section shows that today’s rich countries used industrial policy actively in the earlier stages of economic development. Compared to the post-WWII period, most of them, especially Britain and the US, had a much higher degree of protectionism. SOEs were not as widely used as in the post-WWII period, but Germany and Japan set up SOEs to spearhead the development of strategic industries, like steel, shipbuilding, and textile. FDI was also regulated, especially in natural resources and services, as these were the areas in which FDI was focused before WWII. Intellectual property right laws were lax maximise the opportunity and minimise the cost of importing foreign technologies; countries like Switzerland and the Netherlands didn’t even have a patent law until the early 20th century. Governments invested in – or subsidised the investments by the private sector in – infrastructure, education (including technical education), and R&D (including R&D in agriculture), although these are not industrial policy as we define it in this report.
Economic Commission for Africa
66

4.2. INDUSTRIAL POLICY EXPERIENCES OF TODAY’S MORE ADVANCED DEVELOPING COUNTRIES
4.2.1. China32
Even though the term ‘industrial policy’ was rarely used before the 1990s, China’s history of industrial policy goes back to the late 19th century. However, the earlier attempts at industrial policy – by the Qing dynasty, by the Nationalist government, and by the Communist Party under Mao Zedong – were all rather sporadic, poorly designed, and had chequered records, especially the disaster of the Great Leap Forward under Mao.33 In contrast, China’s industrial policy since the economic reform in the late 1970s has been much more effective, producing some impressive results.
In the early days of the transition towards a market economy in the 1980s and the 1990s, industrial policy continued to weigh heavily on the minds of Chinese state planners. Many industrial policy initiatives during the period were inspired by the experiences of Japan and Korea. In 1987, an Industrial Policy Department was established under the State Planning Commission. However, it was only in March 1989 that the concept of industrial policy was explicitly mentioned for the first time in an official document, that is, the State Council’s paper Decision on Current Industrial Policy Priorities.
This was followed by the more comprehensive and integrated Outline of State Industrial Policies for the 1990s in March 1994. The document highlighted the need to accelerate the development of the so-called ‘pillar’ industries and high-technology industries, while changing the composition of foreign trade by strengthening international manufacturing competitiveness. The June 1995 Provisional Regulations of Guidance on Foreign Direct Investment and the subsequent December 1997 revision mapped out guidelines for high-technology sectors, where foreign investments were variously encouraged, restricted or prohibited (see Zhang and Long, 1997; Yu, 1999, pp. 75-6; Liu, 2005, pp. 34-43, for further details).
China’s industrial policy has been embedded within its Five-Year Plans. The Sixth Plan (1981-1985) marked a departure from past plans in terms of industrial policy by being more comprehensive and outward-oriented. It explicitly encouraged foreign trade and foreign direct investment in an attempt to facilitate the importation of advanced technology into the country. Promotion of high-technology industries and, more broadly, of R&D was recurring themes in subsequent Five-Year Plans. Strategic industries, or ‘pillar’ industries,
32 This section draws heavily on Chang et al. (2013).
33 Written archives of industrial planning in China generally date back to Sun Yat-sen’s (1922) Shiye Jihua (Industrial Plan), which emphasised the state’s key role in creating “socialism” and developing basic heavy industries (Kirby, 1990).
Transformative Industrial Policy for Africa
67

were identified. Some were chosen because they are important for the country’s economic security – these included defence, coal, electric power and grid, telecommunications, petroleum and petrochemical, civil aviation, and shipping. Others were chosen for their growth potentials – they include alternative fuel cars, biotechnology, environmental and energy-saving technologies, alternative energy, advanced materials, new-generation information technology, and high-end equipment manufacturing.
As China undertook economic reform, it drew heavily on the experiences of the other East Asian countries – Japan, Korea, Taiwan, and Singapore – but didn’t slavishly imitate any of them. China learnt from Japan and Korea that it needs to develop large domestic enterprises and, especially, diversified enterprise groups. In pursuing an export strategy based on active cooperation with TNCs, China was adapting the Singapore model, rather than the Japanese or the Korean ones, which were rather hostile to TNCs. In reducing the relative importance of SOEs through the encouragement of growth of the private sector rather than through the privatisation of SOEs, China was pursuing a strategy that is similar to what Taiwan did in the early days of its economic development.34
China’s industrial policy has gone well beyond tariff protection and subsidies, as it was the case with the earlier developers in East Asia – that is, Japan, Korea, Taiwan, and Singapore. The other key measures of China’s industrial policy are as follows.
First, the strategic industries identified in the Five-Year Plans for development have been given targeted supports. They have been protected from foreign competition through tariffs and non-tariff barriers, such as local contents requirements. They have been supplied with subsidised loans from state-owned ‘policy banks’ – such as the Export-Import (EXIM) Bank of China, the Agricultural Development Bank of China (ADBC) and China Development Bank (CDB). Local governments also provided key industries with subsidised credits. These ‘state credits’ have played a critical role – for example, in the automobile industry, Chery expanded into overseas markets with financial support from the China EXIM Bank, while Geely borrowed funds from local governments to finance the acquisition of Volvo Cars in 2010 (Marukawa, 2011). As in the case of ‘directed credit’ programmes of Japan and Korea, commercial bank loans were also made in line with industrial policy goals.35 According to Ferri and Liu (2010), SOEs received 65 per cent of the loans from commercial banks between 1998 and 2003, despite accounting for only 25 per cent of China’s economy. Imputed interest rates on debts offered to private enterprises were also found to be 25 per cent to 33 per cent higher than those offered to SOEs.
34 Taiwan also started out with a huge SOE sector, accounting for 57 per cent of industrial production in 1952 (Amsden, 1985) and gradually shrinking its importance (although it still accounts for 16 per cent of GDP) by letting the private sector grow rather than through privatisation.
35 Chapter IV, Article 34 of the 1995 Law of the People’s Republic of China on Commercial Banks highlights that “A commercial bank shall conduct its loan business in accordance with the need for the development of the national economy and social progress and under the guidance of the state industrial policy”.
Economic Commission for Africa
68

Second, through the licensing system, investments were directed into strategic ways. For example, even though on the whole it was much friendlier to FDI than its Japanese or Korean counterparts, the Chinese government classified FDI into four categories of (i) encouraged, (ii) permitted, (iii) restricted, and (iv) prohibited. It channelled different types of FDI into different targeted sectors. For another example, the government also controlled the geographical distribution of investments. This policy goes back to the 1960s, when the government located new industries in inland areas so as to distribute industrial development away from the concentrated coastal areas.36 In the early days of the open-door policy, coastal areas were reprioritised for government investments in order to maximise their growth impacts and the access to foreign markets.37 More recently, the growing concern with regional disparities has once again compelled the government to shift the focus of its investments (especially infrastructural investments) to the inland areas.
Third, in order to develop what Nolan (2001) described as a ‘national team’ of enterprises in strategic sectors, the Chinese state has initiated many mergers and acquisition (M&A) by administrative decree, as its Japanese or Korean counterparts did during their ‘miracle’ years. For example, state-mediated consolidation of smaller, uncompetitive firms in the electronics industry led to the formation of larger companies, such as China Electronics Corporation (1989) and SVA Group (1995). China Electronics Corporation, in turn, recently (in 2013) acquired the Irico Group, SOE manufacturing photovoltaic equipment. According to the Ministry of Industry and Information Technology (MIIT)’s Guidance on Corporate Mergers and Acquisitions to Accelerate the Growth of Key Industries, issued in January 2013, the Chinese government at the moment aims to grow global champions in the automotive, iron and steel, cement, shipbuilding, aluminium, rare earth metals, electronics and pharmaceutical industries (MIIT, 2013). And state-mediated M&A remains a key policy lever in this regard.
Fourth, industrial clusters were promoted in order to harness the benefits of agglomeration effects, such as closer integration between suppliers, producers and customers, on the one hand, and more rapid innovation, on the other hand (OECD, 1999; Arvanitis and Qiu, 2008; Barbieri et al., 2012). Emphasis was placed on developing clusters in different towns and cities with unique pillar industries. Prominent examples of industrial clusters include
36 In the early 1950s, the coastal area contributed 70 per cent of China’s industrial output, despite making up less than 20 per cent of total land area (Zhang and Long, 1997).
37 Between 1993 and 2003, the average annual FDI inflows as a percentage of the provincial GDP was significantly higher in eastern coastal provinces such as Guangdong (13 per cent) and Fujian (11 per cent) compared to the national average (4 per cent) (Poncet, 2010, p. 115).
As China undertook economic reform, it drew heavily on the experiences of the other East Asian countries – Japan, Korea, Taiwan, and Singapore – but didn’t slavishly imitate any of them. China learnt from Japan and Korea that it needs to develop large domestic enterprises and, especially, diversified enterprise groups.
Transformative Industrial Policy for Africa
69

Shunde, Guangdong (electrical goods), Xiaolan (locks and electronic acoustics), and Guzhen (lighting fittings), the latter two both being in the city of Zhongshan, Guangdong.
Fifth, policies were deployed with the aim of facilitating the transfers of technologies from more economically advanced economies. There were regulations on technology imports. TNCs were made to form joint ventures with Chinese companies, most of them being SOEs or enterprises that are associated with the government.38 Through joint ventures, the state retained effective control over foreign affiliates so as to advance Chinese interests (Roehrig, 1994). Majority-stake acquisitions of, and mergers with, foreign companies from advanced countries were engineered, often with a view to gaining access to more advanced technologies – prominent examples include Sweden (Volvo), the UK (MG Rover), the US (IBM’s personal computer business, which is now called Lenovo), Austria (Fischer Advanced Composite Components), France (Adisseo) and Korea (Ssangyong Motors).39 Incentives were provided to entice foreign companies to set up R&D centres in China.
Finally, export subsidies and currency under-valuations have been used in order to enhance China’s export
competitiveness in international markets. China’s export restraints, such as the one on rare earth used by industries, have been significant enough to affect global prices and thus supplies. With export subsidies and restraints prohibited under the World Trade Organization (WTO), trade disputes against China’s alleged practices remain commonplace (USTR, 2010, 2012a, 2012b).
Despite all these industrial policy measures, China’s industries still have some way to go before they attain leaderships in the higher segments of their international markets. However, they are now major contenders in many key industries. China is already the largest producer of ships, steel, and solar cells, while making inroads into the lower ends of the international markets in ICT products, consumer electronics, mobile phones, and automobiles. Although not all of China’s industrial policy attempts have been successful, the continued effort that the country is making with its industrial policy means that it will become a major player in many more industries in the coming years.
38 While explicit technology transfer conditions are curtailed under China’s WTO obligations, implicit measures are not forbidden. In China’s 2011 Catalogue for the Guidance of Foreign Invested Industries, ownership restrictions are listed in most manufacturing industries.
39 Ssangyong, acquired by SAIC in 2004, was sold on to Mahindra Motors of India in 2011.
Despite all these industrial policy measures, China’s industries still have some way to go before they attain leaderships in the higher segments of their international markets. However, they are now major contenders in many key industries. China is already the largest producer of ships, steel, and solar cells, while making inroads into the lower ends of the international markets in ICT products, consumer electronics, mobile phones, and automobiles.
Economic Commission for Africa
70
4.2.2. Brazil
(a) Overview40
The period of 1950-1980 in Brazil was a period of state-led industrialisation (Ocampo, 2006). Public sector indicative planning was the norm in Brazil as well as in the rest of the Latin American region during those days. Industrial policy was mainly aimed at creating new industrial sectors, changing the prevalent pattern of specialisation in primary commodities and promoting technology-intensive activities.
At the centre of Brazil’s industrial policy during this period was a protectionist regime based on ad valorem tariffs. The Federal Government had the discretionary power to control the level and the types of imports. The Law of Similarities (Lei do Similar Nacional) stated that a product could only be imported if it could be proved that a similar product was not produced in Brazil. These measures were intensified during the 1960-80 period.
Thanks to these industrial policy measures, Brazil successfully entered many new industries, such as petrochemical and renewable fuels, especially ethanol, and established the bases for the development of new technologies. Brazil’s industrial policy was sometimes very successful, as in the case of the aircraft industry and the agro-industry (more on the latter in section 4.2.2(b) below). Industrial policy was less successful in industries like the computer industry (Evans, 1995), textiles, and automobile.
The Third World Debt Crisis of 1982 induced the Brazilian government to introduce the more liberal ‘New Industrial Policy’ package (1985-1988). The total number of special trade regimes was reduced and the average manufacturing tariff rates went down from 90 per cent to 43 per cent. However, given the opposition from politically influential domestic manufacturing industry, reforms were not as radical as those in other developing countries at the time. Non-tariffs barriers and the Law of Similarities were maintained, and these, together with the remaining tariffs, allowed many marginal producers to survive (Kume, 1989; Hay, 2001; Figueiredo, 2008).
The 2000s signaled the return of selective (sector-specific) industrial policy in Brazil. In November 2003, the first Lula government announced the Guidelines for Industrial, Technology and Foreign Trade Policy (PITCE), whose goals were twofold: (i) increasing industrial competitiveness by boosting technological development in key sectors, thereby promoting the export of higher value-added products; (ii) developing the scientific and technological system, especially in sectors like oil and gas, agriculture and pharmaceuticals. The Brazilian Industrial Development Agency (ABDI) and the Council for Industrial Development (CNDI) were created for the purposes of coordinating and implementing the PITCE package and for facilitating the dialogue between the public and the private sectors.41 Four strategic sectors were targeted: semi-conductors, software, pharmaceuticals, and capital goods.
40 This section draws heavily from Chang et al. (2013).
41 CNDI is made up of 23 Government Ministers, the president of the BNDES (the national development bank), and 14 industry representatives.
Transformative Industrial Policy for Africa
71

These sectors were supported by sector-specific financing programmes, such as the Profarma (pharmaceutical) and the Prosoft (software), and by two super-sectoral programmes, called Strong Industry and Innovate Brazil. These programmes were aimed at developing the country’s innovation capacity by promoting various forms of cooperation and partnerships among private companies, universities and research institutes, government agencies and labour unions.
For the 2008-10 period, the second Lula government launched an ambitious industrial policy package, called, Productive Development Policy: Innovate and
Invest to Sustain Growth (PDP), aimed at addressing for main challenges: (i) to maintain the rate of growth in investment (GFCF: Gross Fixed Capital Formation) above that of the GDP; (ii) to upgrade and diversify the export basket; (iii) to boost the innovation capacity of Brazilian companies; and (iv) to broaden access to credit for micro- and small enterprises.
The PDP is a complex policy package structured along three main axes. First, there are programmes promoting new strategic sectors (healthcare, ICT, nuclear energy, defence, nanotech and biotech), managed by the Ministry of Science and Technology (Bothelo, 2011). Second, there are programmes to consolidate and expand existing international market positions with the help of BNDES. The targets of these programmes are: aeronautics, oil, natural gas and petro-chemicals, bio-ethanol, mining, steel, pulp and paper, and meat. Third, there are programmes to strengthen industrial competitiveness under the direct control of the Ministry for Development, Industry and Foreign Trade (MDIC). (Government of Brazil, 2008; Ferraz et al., 2009).
Since the 2008 global financial crisis, the Brazilian government has tried to soften the negative effects of exchange rate appreciation and of the worldwide economic slowdown through financial supports from the BNDES, exemption of payroll taxes, and preferences in government procurement. In the last few years, the Brazilian government has also finally changed its restrictive macroeconomic policies, implemented since 1996, which contributed hugely to the dramatic premature de-industrialisation of Brazil – the share of manufacturing in GDP fell from the peak of 27.2 per cent in the mid-1980s to 14.6 per cent in 2011. First, initially tentatively following the 2008 crisis and then aggressively since 2012, it has abandoned the high interest policy (for much of the time since 1996, Brazil had literally the highest real interest in the world). The lowering of interest rates has naturally led to the depreciation of (the very overvalued) Real, the local currency. These macroeconomic changes have significantly relieved pressure on the manufacturing industry as a whole and especially the export-oriented firms.
The latest phase of Brazil’s industrial policy is Plano Brasil Maior (PBM), issued by the Roussef government in August 2011. It embraces a broader scope and concentrates more on infrastructure than the PDP. PBM also focuses on strengthening production chains (‘value chains’) and diversifying/upgrading exports (especially for SMEs) through tax
Over the last thirty years Brazil has been among the most active countries in terms of their use of policies designed to expand natural-resource-processing industries and food production.
Economic Commission for Africa
72

reliefs, trade remedies (e.g. anti-dumping measures), and financing and loan guarantees for exporters. Since April 2012 the PBM has entered the second phase in which emphasis is given to public-private collaboration – for example, through sectoral competitiveness councils (Kupfer, 2012).
(b) The Agro-industry42
Over the last thirty years Brazil has been among the most active countries in terms of their use of policies designed to expand natural-resource-processing industries and food production. Brazil is today among the top three producers and exporters of orange juice, sugar, coffee, soybean, beef, pork, and chickens. It has also caught up with the traditional big five grain exporters (US, Canada, Australia, Argentina and European Union).
This success has been enabled by the most well-developed and well-funded agricultural research system in the developing world (in terms of public investment in agricultural research, Brazil is below only China and India). And at the centre of that system is EMBRAPA (Empresa Brasileira de Pesquisa Agropecuária), a public corporation under the Ministry of Agriculture, Livestock, and Food Supply (MAPA), which has fostered technological change, diversification and upgrading in agriculture.
Brazil’s agricultural research system involves federal and state governments as well as an enormous number of agricultural universities (around 80). There are also a very large number of agricultural research centres, some of which have been in existence since the early 19th century. This makes Brazil’s agricultural research system extremely complex and characterised by overlapping networks (17 state research networks in 2011). And Embrapa is the main player in this complex system. With its 47 research centres throughout the country, employing 9,284 people and with an annual budget of over $ 1 billion in 2011, it is the largest R&D agency of any kind, not just in agriculture, in Latin America by staff and budget. The research centres are organised along three main axes of specialisation: commodities, resources and themes. In 2011 Embrapa counted 15 national ‘thematic’ centres, 16 national ‘commodity’ centres and 16 regional ‘resource’ centres.
Embrapa was founded back in 1972 as a response to the main weaknesses of the then national agricultural research agency, DNPEA (National Agricultural Research and Experiment Department). These included “researchers’ lack of awareness of the basic needs of agriculture and the lack of intradepartmental and external interaction among researchers, extension workers, and farmers (which had led to instances of unproductive duplication of research efforts)” (Beintema et al., 2001, p. 16). Other weaknesses involved “the lack of incentives for researchers (particularly indicated by low salaries), the low level of postgraduate training (12 percent [of] the scientific staff at the time), and finally the insufficient, and often irregular financial resources available” (Beintema et al., 2001, p. 16).
42 This section draws heavily on Chang et al. (2014).
Transformative Industrial Policy for Africa
73
During its first decades, Embrapa created its network of national commodity centres and regional centres, which focused on major crop and animal production systems and on eco-regional and national themes. It also increased its internal capabilities by signing partnerships with US universities, such as Purdue and Wisconsin, which allowed Embrapa’s staff to receive postgraduate training.
Since the late 1980s, Embrapa’s research has become increasingly more cross-pollinated with research in advanced manufacturing. A good example of this is the satellite monitoring services for the acquisition and processing of remote sensor images and field data. The Satellite Monitoring Centre was created in 1989 in an area in Campinas (Sao Paulo state), given to Embrapa by the Brazilian Army for the development of a special unit focused on territorial management systems and electronic networks for modern agriculture.
Throughout the 1990s, “Embrapa was involved in a wide range of activities related to agricultural research and technology including plant breeding, pest management, food safety, satellite monitoring, sustainable agricultural development, and hunger relief” (Matthey et al., 2004, p. 10). These efforts continued into the new millennium, and in 2005 and 2006, Embrapa made a serious effort to improve and renovate its infrastructure (labs, equipment, tractors, vehicles), to the tune of R$90 million (Brazilian reais). Included among these investments, at the interface between agriculture, biotechnologies and advanced manufacturing were: (i) facilities for quality improvement in the meat production chain; (ii) an aquaculture lab, prioritising water quality control, fish feeding, and fish health; (iii) a new Oenology Lab to boost wine production in the semi-arid Northeastern region; (iv) the construction of one of the world’s first National Agribusiness Nanotechnology Lab, focused on the developments of sensors and biosensors for food quality control, certification and traceability, on the one hand, and of new materials for smart packages (e.g. polymers and nanostructured materials), on the other hand; (v) six new walk-in freezers to increase the storage and preservation capacity of the Embrapa Germplasm Bank.
According to information provided by the Brazilian government, Embrapa has generated and recommended more than 9,000 technologies for Brazilian farmers since its inception in 1973. But probably the most remarkable achievement of Embrapa has been the claiming of the cerrado (the Brazilian savannah) for modern agriculture. It introduced “new varieties, cultural practices, zoning, tillage, biological fixation of nitrogen, development of livestock for both meat and milk, vegetables, fruit, irrigation and knowledge of the cerrado natural resource basis” (Alves, 2010, p. 70). Embrapa’s strategy to make the cerrado land productive was fourfold.
First, during the 1990s and increasingly in the early and mid-2000s, the acidity of the cerrano soil was reduced by pouring in industrial quantities of pulverised limestone and chalk. At the same time, Embrapa developed a bacterium that encouraged nitrogen-fixing in legumes, which reduced the need for fertilisers in the cerrado’s nutrient-poor soil (Hosono and Hongo, 2012).
Economic Commission for Africa
74

Second, Embrapa imported a new variety of grass created through crossbreeding, called brachiaria, from Africa. The higher productivity of this new variety (20-25 tonnes of grass feed per hectare) increased the amount of forage produced and thus allowed farmers to increase beef production.
Third, soybean, a temperate-climate crop, was transformed into a tropical crop through crossbreeding and by introducing genetically modified soya seeds. The new varieties of soybeans require a shorter biological production cycle, allowing farmers to grow two crops a year.
Last but not least, Embrapa introduced new technologies for soil preparation and for the integration of agriculture and husbandry. The new ‘no-till agriculture’ technique harvests the crop at a higher level, leaving part of the crop in the ground to become a mat of organic material, into which the new crop is planted (Hosono and Hongo, 2012). Embrapa also promoted a rotation scheme in which fields are used alternately for crops, livestock and then tree-planting. Although possible only thanks to the use of fertilisers, this rotation scheme remains a cost-effective way of rescuing pasture lands.
The success of Brazil’s industrial policy for the agricultural sector, orchestrated by Embrapa, is testified to by the fact that, despite accounting for less than one quarter of Brazil’s land mass (about 2.05 million km2 out of 8.52 million km2) and despite being naturally being very inhospitable to agriculture, cerrado accounted for 70per cent of Brazil’s farm output in 2010.
Transformative Industrial Policy for Africa
75

4.2.3. Chile
(a) Overview43
Over the last century, Chile has witnessed two distinct industrialisation phases characterised by two apparently opposite approaches to industrial development and policy. Between 1938 and 1973, governments played a critical developmental role and deployed many industrial policy instruments. These go from import-substitution to direct control of key industrial sectors including steel, electricity, telecommunication, resource extraction and processing (Agosin et al., 2010). In the case of copper, the most important export commodity for Chile, the centre-right Frei government initiated a nationalisation programme of the sector in the 1960s, later completed by the centre-left Allende government in 1971.
During this phase, Chile also developed a number of institutions for industrial policy design and implementation, including a development bank, Banco Estado, and a development agency, Corporación de Fomento (CORFO). CORFO was assigned multiple responsibilities, such as coordination of public financial resources (including copper-rents), provision of technical assistance for infant industry development and long-term investments in technology innovation. Industrial indicative planning reached its highest point with the Allende government in 1971 and, in particular, the nationalisation of many manufacturing industries and commercial banks.
The economic programme introduced by the Pinochet regime in 1973 represented a transition from a state-led industrialisation model to a market-led neoliberal model. The military regime rapidly managed to reverse Allende’s reforms and to privatise most of the industrial and financial sectors. It also opened the Chilean economy by removing any form of restrictions on FDIs, credit controls and tariffs. By the end of the 1970s, trade protection
was mostly dismantled and Chile reached a uniform 10 per cent tariff regime.
This conventional historical account of the Chilean industrial policy experience is, however, simplistic or at least partial. In fact, while the military regime implemented a neoliberal transformation of the Chilean economy and social structure (Akram, 2015), the post-Allende governments continued to use various forms of selective industrial policies, not to speak of horizontal measures such as SMEs support. Interestingly, the effective implementation of these policies was made possible by both guaranteeing institutional continuity – CORFO remained the main development agency – and institutional innovation – Fundacion Chile emerged as a new model of PPP (public-private partnership) (Andreoni and Chang, 2014; see section 4.2.3(b) below on Fundacion Chile).
43 We thank Antonio Andreoni for drafting this section.
Chile’s copper industry has not just brought in government revenue but enabled its industrial policy-makers to promote innovation by providing – through the so-called mining royalty, which is a 3 per cent tax on mining profits – funding for institutions devoted to technology innovation and intermediation
Economic Commission for Africa
76

The success of these interventions is proven by the fact that todays’ most important export products (e.g. copper, salmon, wine, and wood/pulp/paper) are exactly those that various Chilean governments ‘picked’ and ‘nurtured’ over the last forty years. In many cases, the Chilean governments built on the industrial capabilities developed and cumulated during the pre-Pinochet period. In others, the selective industrial policies focused on upgrading of the primary sectors – food and forestry in particular – rather than low- and medium-tech manufacturing products.
The creation of a new forestry industry in Chile was made possible by a systematic approach, combining a package of measures (Rossi, 1995). This included a number of land ownership and guarantee reforms (DL 701), the introduction of massive cash subsidies (up to 75 per cent) for planting and forestry management, subsidised credit lines managed by Banco Estado. While the government failed to develop complementary sectors, such as furniture, the wood/pulp/paper sector has become one of the main export products, accounting for almost 10 per cent of the Chilean export basket.
Another striking example of successful state-led sector development is the copper industry. Despite the neoliberal policy regime starting with Pinochet and continuing during the Concertation period, the industrial policy towards the copper industry showed remarkable continuity over the last century. While in other mining countries in Latin America (such as Peru, Bolivia and Brazil), governments implemented a number of neoliberal reforms, including privatisation of SOEs and deregulation of FDI, the Chilean government decided to maintain a direct presence in the copper sector with the establishment of a unified SOE called Corporación Nacional del Cobre de Chile (CODELCO) in 1976.44 Even while the Chilean governments introduced a number of measures in support of private sector development in the mining sectors (such as tax rebates for imported capital goods used in mining operations and delays in tax payments) in the 1980s and the 1990s, CODELCO remained in public ownership.
CODELCO has made continuous strategic investments in its production equipment, technologies and labour capabilities. It also played a critical role in nurturing small private engineering and technology companies. As a result of this industrial policy strategy, CODELCO is still today a leader in the world and, together with ENAMI (Empresa Nacional de Mineria or the National Mining Corporation), contribute to roughly one third of the total copper production in Chile. Given the enormous size of the Chilean copper industry (almost
44 Initially, the military forces were put in charge of CODELCO. The military received 10 per cent of CODELCO’s profits for arms and purchases until 2009 (Nem Singh, 2010).
During the 1990s, Chile managed to become the largest exporter of farmed salmon in the world. It also became one of the main exporters of fresh and processed fruit and tomatoes. Most people interpret these successes as the proof that Chile’s laissez-faire policy stance allowed it to exploit its ‘natural’ comparative advantage, given its high potential for agriculture. However, this is a very misleading interpretation. In fact, the success of these industries was actually a success story of industrial policy – especially through Fundación Chile.
Transformative Industrial Policy for Africa
77
one third of the world production), copper is the main source of government revenue, earning it the sobriquet of el sueldo de Chile (‘Chile’s wage’).
Chile’s copper industry has not just brought in government revenue but enabled its industrial policy-makers to promote innovation by providing – through the so-called mining royalty, which is a 3 per cent tax on mining profits – funding for institutions devoted to technology innovation and intermediation, such as CORFO (especially its Innova Chile programme), Fundacion Chile (Andreoni and Chang, 2014), and CONICYT (Consejo Nacional de Investigación en Ciencia y Tecnología or the National Council on Innovation, Science and Technology).
Chile is typically known as a neo-liberal success story based on confirmation to ‘natural’ comparative advantage. However, our discussion above show that it has used quite a wide range of industrial policy, even though its targeted areas of intervention (natural resource industries) and policy measures (e.g. emphasis on public-private partnership) have been rather different from what we find in the most typical cases of industrial policy success. We will show this in greater detail by examining Chile’s industrial policy regarding the salmon and other agricultural industries.
(b) Salmon and Other Agro-industries45
During the 1990s, Chile managed to become the largest exporter of farmed salmon in the world. It also became one of the main exporters of fresh and processed fruit and tomatoes. Most people interpret these successes as the proof that Chile’s laissez-faire policy stance allowed it to exploit its ‘natural’ comparative advantage, given its high potential for agriculture. However, this is a very misleading interpretation. In fact, the success of these industries was actually a success story of industrial policy – especially through Fundación Chile.
Fundación Chile (FCh) is a non-profit semi-public institution created in 1976 with a $50 million endowment donated in equal parts by the Government of Chile and ITT (International Telephone and Telegraph) of the US. It was established when ITT was compensated for the nationalization of its Chilean subsidiary by the Allende government on the condition that it invests part of the compensation in Chile for the “joint creation of a scientific and technological research foundation” (Meissner, 1988).46 Initially, it was meant to focus on three areas – food technology, nutrition, and electronics.
FCh began to introduce new business and organisational practices from 1977. Three main departments were created: ‘Commercialisation and Economic Studies’, ‘Food’ and ‘Electronics and Telecommunications’. It increasingly adopted strategies to promote dialogue with the business sector, raising awareness about the services it offered. In the early years, FCh provided free consultation to the private sector, only later adopting innovative marketing strategies (e.g. the organisation of ‘work luncheon’ at which potential clients and diplomats were invited).
45 This section heavily draws on Chang et al. (2014).
46 In the course of its existence FCh has undergone various phases of transformation with respect to its organisational model, partners, sectors, and areas of intervention. However, it has managed to maintain its main mission as “a public-private partnership for innovation” with “business orientation” (Fundación Chile, 2005, p. 3). Specifically, it focuses on “the identification, adaptation and development of technologies and the diffusion and transfer of these technologies through the creation of innovative companies” (p. 3).
Economic Commission for Africa
78
In 1980, five central work areas were selected and Chilean professionals were nominated to head them, with foreign experts being asked to provide advisory services. The selected areas were agro-industry (especially fruits and vegetables), marine resources, product development, laboratory, and pilot plant. For each of them, FCh implemented a number of so-called demonstration projects, aimed at transferring foreign technologies and the adoption of industrial technologies and science-based innovations by agriculture (including aquaculture).47 Reflecting the growing emphasis on agricultural technologies, even the research in electronics, another of FCh’s initial focuses, was re-oriented toward the design of microprocessors for process control, which eventually resulted in the application of ICT technologies to quality control and process control in agro-industries.
In 1982, following a major economic crisis, FCh decided to introduce a new strategy for technology transfer, consisting of direct investment in ‘pilot firms’. These firms had to demonstrate the feasibility and applicability of their use of internationally available technologies in the Chilean context. These innovative companies were supposed to attract other Chilean companies, spreading the innovative technologies across the country. They would also become a new source of finance for FCh after their sale in the market. Often, these companies were jointly created by FCh and existing private companies, which had mastered the relevant technologies and had experience in marketing the new products. The most successful of this new strategy was the salmon industry.
In 1982, FCh acquired a company, Domsea Farms (a subsidiary of Campbell Soup), which specialised in aquaculture techniques. It was later transformed into Salmones Antártica S.A. and became the first fully-integrated company in the Chilean salmon farming industry. When the original company was acquired, Chile’s total national salmon exports were around 300 tons per annum. In 1988, when Salmones Antártica S.A. was sold for $22 million, Chile exported more than 250,000 tons. By 2002, it had a world market share of 35 per cent (the export value was of $1.2 billion in 2003).
The success of the salmon industry, like most other successful projects of FCh, was not a single company success. The success of Salmones Antártica S.A. was the result of collaboration between the government, public sector agencies, private sector firms and their associations, and even a foreign aid agency (Andreoni, 2013 a). It was the joint venture between the Chile’s National Fisheries Service (SERNAP) and Japan International Cooperation Agency (JICA) that initially introduced salmon (a non-native fish) to the country. Furthermore, the acquisition of the first facilities for salmon farming by FCh was financed by the regional governmental planning institution of the XI Region (SERPLAC). The first commercial farming venture in Chile capable of exporting to Europe was partly financed by a public agency (CORFO) and was founded by professionals who had worked in government institutions such as IFOP (Fisheries Development Institute). The development of the salmon industry helped the development of firms manufacturing cages, producing refrigerating containers, and providing transport services, giving rise to a salmon industry cluster.
47 Among the projects selected in 1980 was a feasibility study on the production of vegetable seeds for export. They also did an experimental test on freezing blackberries, strawberries, and vegetables for future export, a study of potato processing and an assessment of green asparagus cultivation. They also studied sanitary improvements of milk handling in industrial dairies; technical post-harvest consulting in the fruit industry and quality control of fruit for export (and the utilisation of apple rejects). Research was also done on plant design for the production of dietetic rice-flour. Technical assistance was given to canning plants and an aquaculture centre was established in Coquimbo. Finally, technical assistance was given on the refining of fish oil for edible and industrial uses (Fundación Chile, 2005; Bell and Juma, 2007).
Transformative Industrial Policy for Africa
79
One of the main difficulties that firms in the salmon industry faced in the first stages of cluster development was the difficulty of achieving operational scale, international reputation, and quality certification. The establishment of a ‘Chilean brand’ occurred through the constitution of an institution specialised in quality control and certification (the Salmon Technology Institute or Intesal). This was established in 1994 thanks to the creation of a producer association (Association of Salmon and Trout Producers of Chile) supported by the government.
The successful emergence of agro-technological clusters engineered by FCh is not limited to the case of the salmon industry. FCh’s involvements in the asparagus, grape/wine, and tomato-processing industries also produced impressive results.
The asparagus cultivation programme, launched in 1979, resulted in massive market successes. After having identified the market opportunity represented by green asparagus (for which there was a high demand in US and Europe), FCh provided technical assistance to farmers to introduce a new variety of asparagus. With this assistance, the area planted grew by 40 per cent. FCh also made huge contributions to the development of the grape/wine industries in Chile. It improved grape varieties through genetic engineering and thereby facilitated the emergence of a wine cluster. The project also enhanced Chile’s ability to genetically engineer crops – GM varieties of maize, soybeans, and cotton from Chile have been adopted all over the world.
The tomato processing industry was developed through the collaboration between FCh and CORFO. CORFO adopted the world’s best industrial tomato varieties and transferred the technologies of major established competitors (California, Italy and Portugal) to Chile. The main adaptation consisted in the creation of the ‘Malloa model’, which is a network enterprise system that allowed the diffusion of crop-rotation and cultivation-scheduling techniques among SMEs. Joint ventures were developed for exporting processed tomato. These ventures were financed by the government, starting in 1982 through another public agency (PROCHILE, the Export Promotion Bureau of Chile, created in 1975 under the Ministry of Foreign Affairs). Company associations and export committees were financed through a 50/50 scheme with the aim of improving quality to meet international standards and develop new products.
During the 1990s and the early 2000s, FCh continued to promote new industries, such as the cultivation of abalone and the production of extra virgin olive oil. It also carried on diversifying its investment portfolio, by investing in innovative new companies such as Oleotop (2004), the country’s first canola oil producer, replacing fish oil in the feed for salmon.
Economic Commission for Africa
80
4.2.4. United Arab Emirates48
(a) Overview
Significant amounts of oil were first discovered in Abu Dhabi in 1958 and in Dubai in 1966, with exports beginning in 1962 and 1970 respectively, a few years before the constitution of the UAE federation in 1971. Before these discoveries, countries in the federation were mainly relying on fishing, pearling and trading (Ghanem, 2001). Oil production and exports expanded rapidly, growing by almost 300 per cent per year at some points. By 1992, crude oil exports were worth $14.1 billion (Shihab, 2001, p. 252). With the increasing price of oil in the early 21st century, exports of petroleum products in 2012 were valued at $118.1 billion (OPEC, 2013, p. 11).
Not long after the beginning of oil extraction, the UAE realised that, in order to make its economic development sustainable, it was necessary to start developing its industrial base and investing its oil wealth in industry-related infrastructures. The government’s industrial vision was encapsulated in various policy documents. For example, a Ministry of Planning (1983) publication from around the start of industrialisation states: “Industrialization is a main aim of the state for the correction of the structure of production in which the crude oil sector accounts for about two thirds of the GDP. The industrial sector, according to economic criteria, is the sector “on which economic efforts should be concentrated” (p. 58). Industrialisation was also seen as a way to support (and capture/retain value from) the booming infrastructure and construction sectors, the latter being led by the rapid population growth.
In order to take advantage of Dubai’s position in the Persian Gulf on the main trade routes between Europe and Asia, the UAE government constructed the first deep water port facility in the region in Dubai – Port Rashid (in only three years, between 1969 and 1972). It also built a new airport. A few years later, in 1979, the port was expanded to become the largest port in the Middle East and the world’s largest man-made harbour.
The structural transformation policy adopted by the government of UAE was not confined to infrastructural development. In 1985, the first free zone in Dubai, Jebel-Ali Free Zone, was created in order to attract foreign companies. Companies moving into the free zone were offered, among other things, 100 per cent foreign ownership, zero corporate tax, no customs duties, unlimited repatriation of funds, and exemptions from certain labour laws. The UAE government also promoted a number of manufacturing industries through industrial policy – fertilizer, oil refining, and cement.
A large number of these projects were under the control of two bodies established in Abu Dhabi, the largest emirate: the Abu Dhabi National Oil Company (ADNOC), which was established in 1971 and focused on the implementation and developmental management of oil49, and the General Industries Corporation (GIC), which was in charge of non-oil
48 This section draws heavily on Chang et al. (2014).
49 Instead of limiting itself to the extraction and export of crude oil, ADNOC has operated along all stages of the value chain in the oil and gas industry – from upstream operations such as exploration, production and refinement of petroleum and liquefied natural gas to downstream ones such as marketing and distribution. It has also operated in complementary operations, such as drilling, construction, marine services, shipping and distributions.
Transformative Industrial Policy for Africa
81
related projects (Ghanem, 2001). In 1982, the UAE also created a financial arm to promote industrial development, called Emirates Industrial Bank (EIB). Since its foundation EIB adopted a selective financing policy: only industrial projects owned by nationals (51 per cent at least) were considered; particular favour was given to technologically advanced and capital-intensive projects, those relying on local raw materials, and those producing import-substitution goods.
Thanks to its industrial policy, by 2010, manufacturing in the UAE accounted for around 10 per cent of GDP, a significant jump from the 0.9 per cent share in 1975 (World Bank, 2013). Another way to see the success of the UAE’s industrial diversification strategy is to note that the number of companies in the Jebel-Ali free zone rose from just 19 in 1985 to over 6,400 by 2010. The country has diversified into many different branches of manufacturing, including fertilizer and aluminium (which we are going to examine in detail below), and is continuing with its diversification effort, solar energy being the most recent prominent example.
(b) Aluminium
As a part of the attempt to diversify production away from oil and gas industries, the aluminium smelting industry was promoted. Given its low electricity prices (aluminium smelting requires a vast amount of electrical power) and its good port facility (given the bulky nature of the raw material, i.e., bauxite, which had to be imported via sea from places like Australia and Jamaica), Dubai was considered a good location for aluminium smelting.
Dubal, the aluminium-smelting company, was created in 1975 as an SOE and started production in 1979. It was located next to the Jebel-Ali port, which had special facilities for the importation of raw materials and also made it convenient to export the aluminium produced. The adjacent natural gas plant, Dugas, was dedicated to the provision of electricity for Dubal’s smelting operations. Between 1979 and 2000, Dubal’s production capacity was continuously expanded from 135,000 tonnes per year to over 1 million tonnes per year.
In line with the overall industrial strategy of the UAE, Dubal did not simply increase its production volumes but also invested significant resources in technological upgrading. Dubal developed a proprietary DX and DX+ technologies, which allowed operation at higher amperages and, thus, led to increased efficiency and purity (the company is capable of producing some of the world’s purest aluminium ingots at 99.8per cent purity). These technologies were so successful that aluminium from Dubal is today used by the London Metal Exchange as the benchmark for the high purity (99.7per cent) aluminium (Dubal, 2009).
The structural transformation policy adopted by the government of UAE was not confined to infrastructural development. In 1985, the first free zone in Dubai, Jebel-Ali Free Zone, was created in order to attract foreign companies.
Economic Commission for Africa
82

The most recent turning point in Dubal’s history was in 2007, when the company entered into a joint venture with Mubadala Development Company (MUBADALA), the Abu Dhabi investment vehicle, to create EMAL (Emirates Aluminium). Like Dubal, EMAL also remains fundamentally a SOE. The $5.7 billion Phase I of the project involved construction of a smelter with a capacity of 800,000 tonnes per year, adopting Dubal’s DX technology and thus able to produce at the same high standard of aluminium purity. With the completion of the project’s Phase II in 2014, valued at $4.5 billion, EMAL’s total capacity will reach 1.3 million tonnes per year, giving the site the title of the world’s largest aluminium smelter.
The visionary idea of ‘transforming oil into aluminium was not only successful in itself but it also allowed the UAE to trigger the developments of productive capabilities transformation in other related sectors, thereby making its natural resource-led industrialisation process increasingly more sustainable. The industrial cluster that developed around aluminium includes major enterprises, such as Gulf Extrusions, which processes raw aluminium into a variety of products for the construction and marine industries, and Dubai Cable (DUCAB), which manufactures cables for industry. Dubal is also trying to develop the solar energy industry by investing in the Mohammed bin Rashid Solar Park, which is set to produce 1,000 MW of electricity by 2030. This is partly to cut its own energy costs (possibly by up to 30per cent) but also to reduce its carbon emission (currently the plant produces the same amount of CO2 as Mongolia does: Oxford Business Group, 2008) and to further diversify the economy of the UAE.
Transformative Industrial Policy for Africa
83

4.2.5. Malaysia
(a) Overview
Since independence in 1957, Malaysia has successfully transformed its economy from a poor, primary-commodity-based one into an upper middle-income industrialized one.50 The Malaysian economy is highly dependent on trade, with the ratio of exports (of goods and services) to GDP standing at 87 per cent. Furthermore, Malaysia’s trade is driven largely by the manufacturing sector, contributing 60 per cent of all merchandise exports in 2012 (down from almost 70 per cent in 2009) (WTO, 2014). Fourty five per cent of all its manufactured exports are high-technology products. A very large part of the country’s manufacturing base is occupied by the electric and electronic (E&E) goods sector, which accounted for 33 per cent of all merchandise exports in 2012, having declined only recently from 42 per cent in 2009 (WTO, 2014).
Malaysia’s immense success through international trade and foreign direct investment has led mainstream analyses to erroneously associate the Malaysian industrial
success with market-friendly, laissez-faire type economic policies (World Bank, 1993, is a classic example). However, subsequent research showed that active industrial policy – in the form of careful industrial targeting with numerous incentives for exports, R&D, skills development, and FDI – was a primary feature of Malaysian success (Rasiah and Shari, 2001; Lall, 1995).
The period between 1957 and early 1990s is generally considered as one where the Malaysian economy achieved substantive economic transformation with the share of manufacturing in GDP rising from 14 per cent in 1971 to 30 per cent in 1993 (Lall, 1995). Malaysia’s export to GDP ratio increased from 46 per cent in 1970 to 95 per cent in 1995 (Athukorala and Menon, 1999) and the share of manufactures in total exports of Malaysia rose from 12 per cent to 71 per cent between 1970 and 1993 (Lall, 1995). This period had three distinct phases of industrial expansion.
Policies in the first phase (1957-1970), immediately following independence, were largely aimed at import substitution. The Malaysian Industrial Development Authority (MIDA), which was set up in the late 1960s, identified and targeted sectors for government support and played a key role in coordinating various policy interventions. The economy’s driver during this phase
50 According to the World Bank, Malaysia’s per capita GDP (at current prices) in 2013, reached $10,500. Its industrial sector in the same year accounted for 41 per cent of its GDP, and services almost 50 per cent.
Malaysia’s immense success through international trade and foreign direct investment has led mainstream analyses to erroneously associate the Malaysian industrial success with market-friendly, laissez-faire type economic policies. However, subsequent research showed that active industrial policy – in the form of careful industrial targeting with numerous incentives for exports, R&D, skills development, and FDI – was a primary feature of Malaysian success.
Economic Commission for Africa
84
was the traditional natural resource sector, such as rubber, palm oil, and tin. Industrial policy during this period was structurally limited and not very well coordinated, yielding only modest success (Hui and Canak, 1981).
The second phase (1970-85) began with the launching of the New Economic Policy (NEP) in 1970, mainly in response to the racial disturbances in 1969, triggered by high levels of poverty and inequality, concentrated in the Malay population. Thus, between 1971 and 1985, the NEP focused on generating wealth and employment in the economy to improving the economic situation of indigenous Malays (Bumiputera), including the establishment of SOEs, which were to be later transferred to Malay private ownership.51
At the same time, the Second Malaysia Plan (SMP), 1971-75, emphasised export promotion through regulated FDI in the manufacturing sector. This assumed the form of granting tax incentives and holidays, while establishing export processing zones and industrial areas. Growing export orientation, however, did not mean a retraction of state intervention. Public sector financing of investments, which had been around 3.4 per cent before 1970, was targeted in the SMP to be 9.5 per cent. The actual amount went up to 27.5 per cent in the implemented plan. Moreover, Malaysia continued to prioritise industries for import substitution alongside the export incentives for certain industries. Certain products such as chemical and photographic supplies, transport equipment, electrical machinery, mineral products, precious stones and some other manufactured items were subject to discretionary import licensing (WTO, 1997).
The third phase, after 1986, saw the NEP replaced with the New Development Policy (NDP), which moved the country’s industrial policy closer to the type practised by the East Asian NIEs. In addition to the now-established E&E industries, attempts were made to develop heavy industries, such as chemicals and automobile. Industrial Master Plans (IMP-1 1986-95, IMP2 1995-2006 and IMP3 2006-2020) were drawn up during this time, with varying emphases both in terms of the sectors promoted and in terms of the policy measures used. Along with targeted import protection for strategic sectors, emphasis was put on promoting factors critical for technological advancement, such as skills training, technical support, and quality awareness. The infrastructure of science and technology institutions was strengthened through a technology action plan, which stimulated R&D in private enterprises.
Policies were introduced to help the restructuring of SMEs in various manufacturing industries. In 1993, for example, a soft loan policy for quality enhancement was introduced for Bumiputra-owned SMEs in the furniture and food-based industries. This was later extended to the automotive, electrical and electronics, plastics, machinery, engineering, and textiles sectors. Cluster-based industrial development programmes – such as the Industrial Linkage Programme (ILP) under the Small and Medium Industrial Development Corporation (SMIDEC) and the Vendor Development Programmes under the Ministry of Entrepreneur Development (MED) – were introduced in order to promote the use of locally made intermediate inputs through financial and technical assistance.
51 There were only 10 SOEs in 1957, but by 1974 the number of SOEs went up to 82, while there were 185 joint ventures with the private sector (Hui and Canak, 1981).
Transformative Industrial Policy for Africa
85

During this time, incentives were also introduced to increase local contents in the export-oriented manufactures. Foreign suppliers that had invested in Malaysian EPZs to supply their principals were to be denied the full privileges they used to receive as wholly export-oriented firms, and were to be treated as local firms. In its first Trade Policy Review at the WTO, it was revealed that “Malaysia has no local content laws or regulations. However, the Government encourages the use of local materials in the manufacturing sector and the use of local content is taken into account in the granting of investment incentives provided by the Government”.52
Industrial Master Plan 3 (IMP3, 2006-2020), which is currently in operation, seeks to further broaden the scope of industrial policy by including services and by introducing more ‘horizontal’ policies, such as SME development, human resource development, technology, logistics, marketing, and so on. The stated objective is to guide the country towards a high level of global competitiveness and becoming a higher-value-added and knowledge-based economy. In 2010, Economic Transformation Programme was launched, targeting the National Key Economic Areas (NKEAs), identified on the bases of their potentials to contribute to output growth and their multiplier effects. They include the greater Kuala Lumpur/Klang Valley; oil, gas energy; palm oil and rubber; wholesale and retail trade; financial services; tourism; electronics and electrical industries; business services; communication content and infrastructure; education; agriculture; and healthcare.
(b) Palm-oil-related industries53
As of 2012, Malaysia was the world’s second largest producer of palm oil (behind Indonesia) (UN, 2013). Between 2000 and 2012, Malaysia accounted for over 55 per cent of world exports of palm oil (UN, 2013). Given Malaysia’s climate, it is easy to believe that such an achievement is the result of the country’s adherence to ‘natural’ comparative advantage. However, oil palm is not native to Malaysia and the industry has been deliberately promoted through industrial policy.54
Palm oil was one of the first industries picked by Malaysia’s government – and is still one of the priority industries55 – as a sector with strong linkages to the manufacturing sector – productions of crude palm oil, refined palm oil, and palm kernel oil. The sector helped Malaysia diversify into non-resource-based industries, such as electronics by providing the foreign exchanges need for the imports of machines and parts. In the words of Rock and Sheridan (2007), “the government’s selective intervention in promoting smallholder palm oil production and the processing of crude palm oil may be the single most successful selective intervention in Malaysia” (p. 191).
Malaysia’s industrial policy for the palm oil industry started in the 1960s, when the government tried to diversify its traditional commodity export base (tin and rubber) (Pletcher, 1991). A number of measures were used for its promotion.
52 WTO document G/TRIMS/N/1/MYS/1, dated 12 April 1995
53 This section draws heavily on Chang et al. (2014)
54 Oil palm, native to West Africa, was first introduced to Malaysia as an ornamental plant in 1875. Although commercial planting (in Selangor) started in 1917, large-scale planting failed to attract the attention of private investors until the 1960s.
55 Even in the Tenth Malaysia Plan (2011-2015) and the Third Industrial Master Plan (2006-2020), the palm oil industry remains a key sector prioritised by the government in the medium term (EPU, 2010; MITI, 2006)
Economic Commission for Africa
86

First of all, measures were introduced to encourage oil palm planting. Grants were offered from 1962 to finance the replanting of old rubber trees with oil palm. Moreover, foreign-owned plantation companies were required to form subsidiaries domiciled in Malaysia and then majority ownership of these subsidiaries was then taken over by the economic development corporation – Permodalan Nasional (PERNAS) and subsequently Permodalan Nasional Berhad (PNB). By the mid-1980s, the government had gained control of all the major plantations in Malaysia (Pletcher, 1991, p. 630). Oil palm acreage grew from 40,064 hectares in 1960 to 5.08 million hectares in 2012 (MPOB, 2013).
The government also set up the Palm Oil Registration and Licensing Authority (PORLA), the Palm Oil Research Institute of Malaysia (PORIM), and the Malaysian Palm Oil Promotion Council (MPOPC). PORLA, PORIM and MPOPC were respectively responsible for regulation and licensing, specialised training and public sector R&D, and export promotion. In 2000, to harness synergies between related functions, PORLA and PORIM were merged to form the Malaysian Palm Oil Board (MPOB).
Not merely content with the direct economic contributions of palm oil, the government actively sought to develop targeted downstream industries, such as the palm oil processing, oleo-chemicals56, biotechnology, biodiesel and biomass industries (see Malaysia’s industrial master plans – MITI, 1986, 1996 and 2006). Defying earlier arguments that Malaysia lacked a comparative advantage in palm oil processing (see Little and Tipping, 1972, for example), the government undertook a slew of targeted measures in order to develop the palm oil processing industry.
First, fiscal incentives were used to attract investments in strategic areas related to palm oil. Under the 1968 Investment Incentives Act, qualifying oil palm firms enjoyed two years of (renewable) corporate tax exemptions, and eight years of excess profit and development tax exemptions (see Rasiah, 2006). Pioneer status awards, offered before 1974, and granted palm oil refineries tax exemptions for seven years. Tax exemptions were also offered on the basis of export performance and capital investments.
Second, higher duties on crude palm oil exports and tax exemptions on processed palm oil exports (the extent of exemption depending on the degree of processing) greatly skewed producers’ incentives towards the latter. By 1994, Malaysia refined 99 per cent of crude palm oil, a significant jump from 10 per cent in 1975 (Gopal, 1999, p. 363). According to Jomo and Rock (1998), the export tax spurred the industry to upgrade its industrial and technological capabilities, and to eventually define the global technological frontier in palm oil refining.
Third, bleaching earth, a key ingredient in the palm-oil processing industry, was initially subjected to tariffs and import quotas until internal production capabilities were built. However, to cap the costs during the import substitution phase, subsidies were provided such that the price of bleaching earth purchased by domestic industries, were similar to world prices.
56 The oleo-chemicals industry includes basic oleo-chemicals (e.g. fatty acids and glycerin), oleo-chemical derivatives (e.g. fatty esters and metallic stearates), oleo-chemical preparations (e.g. soap and cosmetics) and other palm oil-based products (e.g. printing ink and polyols).
Transformative Industrial Policy for Africa
87

Fourth, various policies were used to promote the development of downstream industries. For instance, the 2006 Malaysian Biofuel policy aimed to facilitate the gradual substitution of diesel fuel with palm oil.
Fifth, the Palm Oil Credit and Payment Arrangement (POCPA) scheme was introduced in 1992 to provide a two-year credit facility for countries purchasing palm oil from Malaysia. Even though the IMF ruled in 1994 that trade credits should not be given for more than three months, Malaysia continued to use this scheme – for example, in 2002 $500 million were still allocated to the POCPA scheme, with $227 million of credit extended to nine countries including Cuba and Pakistan (see Gustafsson, 2007, pp. 47-48).
Sixth, R&D was encouraged to enhance the competitiveness of Malaysia’s palm oil industry, especially through PORIM, which was established in 1979. By 2005, the Malaysian government had developed 302 products (e.g. pourable margarine, non-dairy ice-cream, palm oil-based printing ink) and technologies (e.g. trans-fat-free margarine, nutraceuticals such as extracting minor components of health food supplements), of which 100 had achieved industrial commercialisation (MITI, 2006, p. 475).
(c) Electrical and electronics Industry
The Electrical and Electronics (E&E) industry is one of the leading industries of Malaysia, accounting for 24.5 per cent of MVA (manufacturing value-added). In 2014, Malaysia’s exports of E&E products were valued at $63 billion, accounting for 49.2 per cent of manufactured goods exports and 32.9 per cent of total exports. Major export destinations are China, the US, Singapore, Hong Kong and Japan. Reflecting Malaysia’s role in the global value chains (GVCs) in the industry, E&E products were also the largest imports, amounting to $47 billion, representing 37.8 per cent of manufactured goods imports and 28.8 per cent of total imports. Malaysia’s top import sources for E&E products are China, Singapore, the US, Japan and Taiwan (MATRADE, 2015).
The E&E industry in Malaysia can be classified into four sub-sectors, namely, electronic components, consumer electronics, industrial electronics, and electrical products. Table 4.1 gives a breakdown of all categories in detail.
The E&E industry commenced in Malaysia in 1965, with Matsushita Electric seeking to supply the domestic market with final consumer goods, under the government programme that encouraged import substitution for products like household appliances, electrical fittings, wires and cables, and automotive batteries. However, by 1972, the government had embarked on an export-orientated programme of industrialisation to generate more jobs. Initiatives such as the Investment Incentives Act of 1968 and the launching of the New Economic Policy in 1971 led to the setting up of Export Processing Zones in 1971. MIDA, established only a few years earlier, immediately spotted an opportunity in the semiconductor assembly business, where Singapore was trying to move into more complex activities and potentially vacating its place as an assembly hub. MIDA targeted TNCs in the US, directly approaching them to invest in Malaysia offering tariff- and tax-free zone locations and profit repatriation guarantees.
Economic Commission for Africa
88

Clarion and National Semiconductor started the first operations in the electronics sector in Malaysia in 1972, when the Bayan Lepas Export Processing Zone was opened in Penang. The government continued to establish EPZs and attracted foreign firms with low wages and safe tax exemptions. This led to a wave of export-oriented E&E firms from developed countries relocating their plants in Malaysia (Rasiah, 2010). By 1992, almost 90 per cent of manufacturing of electronic products was being conducted by TNC affiliates (Athurkorala and Menon, 1999). According to Lall (1995), a largely literate and English-speaking labour force along with the fiscal incentives helped Malaysia successfully lure TNCs from the US.
Export-oriented firms were particularly favoured by the government. They enjoyed various government subsidies for training, exporting, and R&D activities. They were also the main beneficiaries of duty drawbacks along with export incentives offering double deduction benefits on corporate tax. The government also targeted the E&E sector by concluding Technology Transfer Agreements (TTAs) to enable firms to obtain the necessary technologies for state-of-the-art manufacturing. During the period 1989-96 a total of 1,124 TTAs were approved by the MITI. Royalty payments were made in 467 of these agreements, most of which concerned the E&E sector (WTO, 1997). This suggests that advanced technology was transferred mainly to this sector by active intervention and support by the state.
The E &E sector (see figure 4.2) showed a dramatic leap in its contribution to manufactured exports. By 2000, the sector was contributing 72 per cent of Malaysia’s manufactured exports.
Table 4.1 The structure of Malaysia’s E&E industry
Sectors Sub-Sectors Products
Electronics
Components Semiconductors, passive components, printed circuit boards, metal stamped parts and precision plastic parts
Consumer Audio visual products such as television receivers, portable multimedia players (PMP), speakers, cameras and electronic games
Industrial Multimedia and information technology products such as computers and computer peripherals, telecommunications equipment and office equipment.
Electrical Electrical Boards, panels and consoles, switching apparatus, lamps, air conditioners, vacuum cleaners, ov-ens, transformers, cables and wires, primary cells and batteries, solar cells and modules
Source: Malaysian Investment Development Authority (MIDA)
Transformative Industrial Policy for Africa
89

The Malaysian experience with manufacturing for exports is quite interesting in comparison with those of the East Asian NIEs. While those countries started with relatively low-technology exports like garments, footwear and toys, Malaysia directly entered into relatively high-skill and technologically complex products, like electronics. Beginning in the 1970s as a primary product exporter, by 1990 Malaysia had emerged as the world’s largest exporter of semiconductors, and among the largest exporters of disk drives, telecommunications apparatus, audio equipment, room air-conditioners, calculators, colour televisions, and various household electrical appliances. According to Lall (1995), 73 per cent of its manufactured exports in 1980, and 84 per cent in 1990, were in the high-skill category.
However, it must be remembered that Malaysia’s initial entry into electronics was highly labour intensive, based on the manual assembly of semiconductors, followed by assembly of parts in audio and other electronic and electrical products. Over the years, however, Malaysian companies have been able to develop significant capabilities and skills in manufacturing a wide range of electronic products across all significant sub-sectors of the industry. The firms also began to produce higher-technology and higher value-added products through continuous intensification of research and development (R&D) activities.
Even though it has not achieved the level of sophistication of its counterparts in Korea or Taiwan and even though its progress has recently slowed down, it is undeniable that Malaysia’s E&E sector has been catching up and developing local capabilities. Ariffin and Figueredo (2004) have argued that in terms of capability level, 81 per cent of the leading
Figure 4.2 E&E Share in manufacturing exports, 1968–2007 (per cent)
0
10
20
30
40
50
60
70
80
1968 1973 1979 1985 1990 1997 2000 2007
0.7 2.1 28.4 52.1
56.6 66.5 72.5 60.7
1968 1973 1979 1985
1990 1997 2000 2007
Source: Rasiah (2010)
Economic Commission for Africa
90

electronics firms in Penang and the Klang Valley have attained intermediate or advanced level of innovative technological capability. All firms in the region have mastered basic process and production organization, product engineering, and capital equipment, tooling and moulding. And in achieving all of this, the role of industrial policy was crucial, as we discussed above.
To sum up, contrary to the neo-liberal orthodoxy, Malaysia’s growth and restructuring policies have been marked with state intervention. Even in the so-called export-oriented industrialisation led by the E&E sector, the state distorted relative prices by exempting the EPZ firms from taxes and tariffs and offered subsidised infrastructural support services. It even modified policies over time to include local content requirements and concluded technology transfer agreements to ensure that local technological capabilities were enhanced. Moreover, R&D, training, and skills development remained targeted and subsidised activities of the government.
...contrary to the neo-liberal orthodoxy, Malaysia’s growth and restructuring policies have been marked with state intervention.
Transformative Industrial Policy for Africa
91

4.3. INDUSTRIAL POLICY EXPERIENCES OF TODAY’S POORER DEVELOPING COUNTRIES
4.3.1. Vietnam
(a) Overview
For many people, Vietnam is best known for its devastating 20-year proxy war from 1955 to 1975, in which communist backed forces of North Vietnam fought the government of South Vietnam, who were supported by the United States and other anti-communist forces.57 The North came out victorious, and eventually the North and South were merged into the Socialist Republic of Vietnam. Socialist reforms ensued, most importantly mass collectivization of farms and factories. In the following years, people died in the hundreds of thousands in prison camps and labour camps or through extrajudicial executions. This led to economic chaos and an international humanitarian crisis – millions of people fled the country by sea (the ‘boat people’), many of them drowning because of crudely built boats.
In 1986, reformist politicians replaced the old guard and introduced a series of reforms (known as the Doi Moi reforms), with the aim of transitioning from a centrally planned economy to a socialist market-oriented economy. These reforms marked the start of unprecedented economic growth and structural transformation in Vietnam. Vietnam’s trajectory of structural change has not been as impressive as, for example, that of China, which has grown substantially faster and expanded into medium and high-technology products far more successfully than Vietnam has (Dinh, 2013). However, Vietnam stands as an impressive example of overall economic growth and manufacturing success in the low-technology segments. Its GDP per capita has increased from a low of $97 in 1989 to $1,903 in 2013 (IMF, 2015). MVA as a share of GDP has increased from a low of 12.3 per cent in 1990 to 17.5 per cent in 2013 (WDI, 2015). Manufacturing exports grew from $4,037 m in 199758 to $92,980m in 2013. During the same period, the share of manufacturing in total merchandise exports increased from 46 per cent to 70 per cent (WTO, 2015).
Industrial policy has taken the centre stage in the reformist government’s development plans. Initially, it was emphasised as a means to deal with the ballooning current account deficit. As a result, industrial policy focused heavily on promoting exports, at first petroleum and agricultural products (particularly coffee). But Vietnam early on recognised that it would need to expand and diversify its manufacturing production to increase its pace of catch-up. In the late 1980s, domestic enterprises were nowhere near having the capabilities needed to be internationally competitive, so after the embargo on Vietnam was lifted by all countries other than the United States, Vietnam heavily attracted FDI towards labour-
57 The death toll of the war stands between 800,000 and 3.1 million.
58 Earliest data available.
Economic Commission for Africa
92

intensive manufacturing industries (Perkins and Anh, 2009). Net FDI inflows increased from $180 m in 1990 to $2,400 m in 2006. After that, it made a massive leap to $6,981m in 2007, and has been between $7,600m and $9,600m per year until 2013 (UNCTAD STAT, 2015). The fastest growing export sectors have been garments, agro-processing and electronics (WTO, 2015).
Vietnam has steadily been removing barriers to trade and investment from abroad and withdrawing privileges to SOE’s since 2000. The signing of a bilateral trade agreement with the United States (2001) the passing of the Enterprise Laws of 2000 and 2005 gave critical impetuses to these efforts. However, the primary reason for Vietnam’s surge in FDI in 2007 was the country’s WTO accession in the same year. Vietnam’s industrialisation after 2007 has been driven mainly by TNCs and private-sector firms.
(b) Apparel
The largest manufacturing industry in Vietnam is apparel production. It is a massive industry on a global scale, valued at over $1 trillion, and is by far the most important traded light manufacturing sector among low-income and lower-middle income countries. Vietnam’s apparel exports have been the fastest growing in the world between 199959 and 2013, increasing from $1622 m to a staggering $17230 m (WTO, 2015). This currently makes Vietnam the world’s fifth largest apparel exporter, after China, Italy, Bangladesh and Hong Kong.
The development of Vietnam’s apparel industry has been part of a wider strategy of promoting labour-intensive manufacturing industries. But a change in the state bureaucracy towards a tighter consolidation in the mid-1990s – when apparel exports slowly started to rise – is believed to have had a particularly significant impact on the apparel industry (see Angie, 2004).
First, in late 1995, state responsibilities and procedures in the apparel industry were more efficiently streamlined. For example, the Ministry of Industry received the responsibility of approving general development strategies, the Ministry of Finance received the responsibility for allocating subsidised loans to SOEs and negotiating with foreign sources for funds, and the Ministry of Trade received the responsibility for allocating export quotas.
Second, in that same year, the prime minister created the Vietnam National Textile and Garment Group (VINATEX), which exists to date, as an ‘umbrella’ SOE. VINATEX has, in following years, worked to integrate and coordinate all state-owned textile and apparel firms, while providing with skills and technological knowhow by setting up research institutes and vocational schools.
59 Earliest data available.
Transformative Industrial Policy for Africa
93

Third, the streamlining of bureaucracy allowed the Ministry of Trade to more easily implement measures to attract FDI to the sector. Starting in 1995 and becoming more pronounced in 1998, export licences were eliminated, customs procedures were made less cumbersome, export tax exemptions on final goods were applied, and local trade and customs departments were allowed to directly manage and oversee trading activities of domestic firms.
Over the years, export revenues have been growing fast, but Vietnam has largely failed to incentivise foreign firms to use domestic inputs in production. The industry performs mainly cut, make and trim (CMT) functions on imported inputs that are specified by foreign buyers. There is little free on board (FOB) garment production, whereby the apparel manufacturer is responsible for all production activities, including the procurement of raw materials. In 2013, 80-90 per cent of apparel production in Vietnam relied on imported inputs, primarily from China, Korea and Taiwan (Dinh, 2013). More investments in cotton production, spinning and weaving would be needed if the country is to reduce its import dependence. Reducing import dependence will also ease the constraint on growth in real wages – without input linkages to the domestic economy, buyers can more easily move their factories abroad, and should wages increase.
In the upstream segment, because buyers provide all the product engineering specifications, production equipment and in-house design engineering capabilities, Vietnamese apparel manufacturers have been unable to develop product or brand developing capabilities or knowledge of supply chain networks. Better links need to be established between domestic producers and foreign markets to especially adapt production designs. This can be done for example by increasing social networking through the diaspora community and/or by establishing trading companies.
(c) Shipbuilding
Although Vietnam’s industrial development trajectory has most prominently featured growth of light manufacturing industries, the country has also managed to become internationally competitive in some heavy industries, most notably shipbuilding. Shipbuilding has been an important industry for many successful industrialisers – starting in Japan in the 1950s and 1960s, Korea in the 1970s, and China today, which has become the world’s largest shipbuilding nation (measured by gross tonnage – or gt – produced), recently surpassing Korea. Vietnam is aspiring to follow in the footsteps of these countries.
Vietnam coordinates policies to develop its shipbuilding industry largely though the SOE Vinashin – established in 1996 – which owns around 70 per cent of the shipbuilding capacity (Senturk, 2011), although foreign investors – such as MAN Diesel and Turbo, Hyundai Mipo Dockyard, Aalborg Industries, and Mitsubishi Heavy Industries – have also played an important role.
In 2001, Vinashin outlined a detailed plan to develop the shipbuilding industry in the “Shipbuilding Industry Development Programme 2001-2010”. It was recognised that, with a coastline of 3,200 km, improved facilities for domestic water transportation and a
Economic Commission for Africa
94

cheap (but literate) labour force, Vietnam has a great potential to compete with the largest shipbuilding nations. The growth of the industry in Vietnam since the early 2000s signifies that this potential is close to being realised. From producing practically no ships in 2002, Vietnam completed ships with a combined gt of 375,000 in 2014 This makes Vietnam the world’s 7th largest shipbuilding nation, after China (23 m gt), Korea (22 m gt), Japan (13 m gt), the Philippines (1.9 m gt), Taiwan (600,000 gt) and Germany (520,000 gt).
The Vietnamese government has been supporting the shipbuilding industry in various ways, including: (i) provision of subsidised loans to Vinashin; (ii) allowing firms in the industry to retain corporate income tax for reinvestment; (iii) exemption of export taxes and land rent; and (iv) 2 years’ grace period on loans for infrastructure costs of new shipyard projects (Senturk, 2011). Additionally, industrial and economic zones that feature shipbuilding facilities have been developed.60
The Vietnamese shipbuilding industry is not only important as a source of employment generation and of foreign currency, but also due to the linkages it creates, especially downstream. Currently, these linkages are limited, as a majority of the materials and machinery that are needed to build the ships are imported. However, industrial policy efforts have been made to increase the local contents in the shipbuilding industry. For example, Vietnam has for a long time been putting efforts into expanding steel production in order to help the shipbuilding industry, as steel represents roughly 20 per cent of the total costs of building a typical tanker.61 As a result, steel production has been growing quite rapidly in the recent years – from 2.0 m tons of crude steel in in 2007 (Thang, 2013) to 5.6m tons in 2013 (World Steel, 2014).62
60 Economic zones target foreign investors, providing them with a range of fiscal incentives, subject to 100 per cent exporting of the output. Industrial zones, in contrast, target both foreign and domestic investors that produce for both domestic and export markets, and are designed to provide better infrastructure and easier routes for procedural approvals. But given that the fiscal incentives initially reserved for economic zones have been extended to companies in industrial zones that export at least 80 per cent of production, industrial zones are by far the most common ‘special zone’ in Vietnam.
61 Needless to say, the shipbuilding industry is not the only source of growing demand for steel in Vietnam, as demands from other emerging industries and infrastructure projects have been rising fast too.
62 Similarly to the shipbuilding industry (and partly the apparel industry), the development of the steel industry has followed a model of initially establishing an ‘umbrella’ SOE for the industry that sets up production facilities and coordinates domestic firms – the Vietnam Steel Corporation (VSC) in the case of the steel industry – and later opening up to FDI and setting up joint ventures through the umbrella SOE. Some of the largest steel mill investments have come from China (CSVC Sumikin) and South Korea (POSCO).
The Vietnamese shipbuilding industry is not only important as a source of employment generation and of foreign currency, but also due to the linkages it creates, especially downstream. Currently, these linkages are limited, as a majority of the materials and machinery that are needed to build the ships are imported. However, industrial policy efforts have been made to increase the local contents in the shipbuilding industry.
Transformative Industrial Policy for Africa
95

4.3.2. Uzbekistan
(a) Overview
Since independence from the Soviet Union in 1989, Uzbekistan has become well known for its heterodox economic policies, unlike other former Soviet countries. In the early 1990s, the IMF had stepped in to offer the country its standard policy recommendations; quick liberalisation of markets and prices, opening up to external trade and finance, rapid privatisation, freeing of the economy from state control, and the tightening of fiscal and monetary policies. However, rejecting these recommendations, Uzbekistan opted for a more gradual transformation of its economy. The country’s President, Islam Karimov openly criticised neoliberal policies, claiming that “the model of reforming and modernization adopted in Uzbekistan […] has meant from the onset the denial of the methods of shock therapy, which were persistently imposed on us, as well as naïve and deceptive conceptions about the self-regulating nature of market economy” (Karimov, 2009).
This has led to a barrage of criticisms from international financial institutions and mainstream economists, with predictions of impending failure. In 2001, the IMF withdrew its permanent representative in the country after Tashkent failed to meet its obligations as a member of the Fund. In April 2004, the European Bank for Reconstruction and Development (EBRD) also suspended most of its assistance as a result of the country’s failure to implement meaningful market economy reforms.
Despite going against the advice of the international policy establishment and despite the fact that it is double-landlocked (that is, it is surrounded by landlocked countries), the country has performed very well. Post-independence Uzbekistan’s GDP faced only a moderate decline between 1991 and 1995, compared to those of other transition economies in the region. By 2001, it had recovered to 103 per cent of its 1989 level, making it the first former Soviet Republic to regain its pre-transition level. The GDP growth rate continued to average at about 4 per cent during the early 2000s, accelerating to over 7 per cent by 2004 and exceeding 9 per cent in 2007 and 2008. This has confounded leading mainstream analysts, who have labelled it a puzzling case (Pomfret, 2000; McKinley, 2010).
Most of the rapid growth in Uzbekistan since 2001 has been on the back of the industrial sector leading to considerable structural transformation of its economy. The industrial sector had declined from 33 per cent of GDP in 1990 to 23 per cent in 2001, but has recovered to 33 per cent again, with the share of agriculture falling from 34 per cent in 2001 to 19 per cent in 2011 (Bendini, 2013).
The economic development strategy implemented so far by Uzbekistan is largely based on a combination of import substitution and targeted export promotion. Both of these practices are generally inconsistent with the WTO rules, but Uzbekistan is not yet a member of the organisation and has only observer status. Despite making an early application for accession in 1994, talks on Uzbek accession have been suspended since 2005 mainly because of its commitment to unorthodox policies. Uzbekistan’s average applied tariff around 12 per cent is closer to that of other developing countries, but is twice as high as the regional average in Europe and Central Asia (6.7 per cent). So-called peaks can also be seen in its tariff profile in certain sectors.
Economic Commission for Africa
96

As figure 4.3 indicates, both average tariffs and peaks have shown an increasing trend since 2011. The country does not formally apply any import quotas but does have a number of behind-the-border non-tariff barriers that favour local products over imported ones. Figure 4.4 shows a list of products that face excise taxes (on top of tariffs) only when imported. In the case of automobiles, there is also a road fund tax (6 per cent for automobiles and 20 per cent for trucks) for imported vehicles, except for those produced in Russia and Ukraine. Tariffs, excise taxes, and road fund tax often add up to over 100 per cent of the world market price of an imported vehicle.
Uzbekistan is pursuing an active industrial policy designed to provide sustainable, high rates of economic growth and a shift of focus from the production of raw materials to finished products with higher added value. It follows an import substitution regime with tight controls on imports of strategic products and export promotion of others. It uses domestic taxation to compensate for low external tariffs and uses other forms of controls, such as border entry fees. The government further aims to create spill-over effects through industrial expansion and gives priority to the sectors that are capable of creating and extending the multiplier effects to the whole economy. The automobile industry, which we now turn to, is a particularly successful example in this regard.
Figure 4.3 Average tariff rates and share of tariff peaks in tariff schedule in Uzbekistan, 2001-2009 (per cent)
10.6 11.3 10.8 11.9 11.8
31.0 35.4 32.0 34.0 33.6
Table 4.3. Average tariff rates and share of tariff peaks in tariff schedule in
Simple average applied tari� rate
Share of tari� peaks in the tari�
schedule
2001 2006 2007 2008 2009
Source: Anderson and Klimov (2012)
Transformative Industrial Policy for Africa
97

Certain categories of automobiles
5*
Certain categories of automobiles
Fresh meat
Refrigerators
Audio, video recorders, players
Sausages
Furniture
Certain types of clothing accessories
Frozen meat
Cheese
Juice (except citrus juice)
Certain jewellery
Fresh apples pears and quince
CarpetsSugar
10
30
30
45
50
50
50
70
70
70
90
Certain jewellery
100
120
29**
25
On Imported Goods On Domestically Produced Goods
$2.5-7.2 per cubic centimetre of
engine displacement or
Figure 4.4. Rates of select excise taxes in Uzbekistan, 2012 (per cent unless otherwise indicated)
Source: Anderson and Klimov (2012)
* The rate of the excise tax on automobiles that are similar to those produced by GM Uzbekistan but are manufactured and/or imported from countries other than Russia and Ukraine varies from $2.5 to $7.2 per cubic centimeter of engine displacement depending on the total volume of engine displacement and on when the automobile was produced. The rate of the excise tax on new vehicles manufactured in, and imported from, Russia or Ukraine (except specialized vehicles used for medical purposes) is 5 per cent.
** This is the rate of the excise tax on automobiles produced by GM Uzbekistan.
Economic Commission for Africa
98

(b) The Automobile Industry
Uzbekistan is the only central Asian country that produces motor vehicles on a large scale. In 2012, its car production rose by 13 per cent on the back of growing consumer demand in neighbouring countries, primarily in Russia. In that year, Uzbekistan concluded a series of cooperation agreements with China, making experts optimistic about its prospects for sustaining production growth in the coming years (Ernst and Young, 2013 a). Between 85 per cent and 95 per cent of all light vehicles sold are assembled domestically.
The seeds of the modern automobile industry were sown soon after independence. Following a visit of President Karimov to Korea, a joint venture between Uzbekistan and Daewoo, the then second largest Korean carmaker, was realised in the form of the UzDaewoo plant set up in Asaka in 1993. Soon after, the Association of Enterprises of Automobile Manufacturing was transformed into a presently state-controlled joint stock company, Uzavtosanoat. Since 2004, Uzavtosanoat has 51 per cent government participation.
The Uzbek automobile industry is generally made up of joint ventures of Uzavtosanoat with a foreign partner, in line with the government’s policy of localization of manufactured vehicles and active attraction of investors. At present, Uzavtosanoat includes around 51 automobile-related enterprises with the total staff numbering 21,000 people (Autobusiness, 2013). It produces passenger cars, commercial vehicles (trucks, buses) as well as many vehicle components for them. Manufacturing of vehicles is carried out by GM Uzbekistan (cars), SamAuto (trucks and buses), and MANAuto (trucks).
In its first year of production (1996), the UzDaewooAuto’s output was 25,000 cars. By the end of 2011, this figure had reached 230,000. Throughout this time, new models were added to the production line, along with modernised versions of existing ones. Apart from high volume production of vehicles the UzDaewooAuto plant also started component manufacturing for Daewoo vehicles.
In 2008, following the change of ownership of Daewoo to GM Daewoo, UzDaewoo was replaced by GMUzbekistan – a new joint venture between Uzavtosanoat and General Motors Corporation. It began production on 27 November 2008, with its first assembled car marking the millionth assembled vehicle from UzAvtosanoat (UZA, 2008).
One of the main objectives of the Uzbek government’s industrial policy in relation to the automobile industry is to activate its potential and transform the industry into a driver of growth for other priority sectors in manufacturing. It has already taken the initial steps towards achieving these objectives. The automobile industry has managed to become a driver of growth for enterprises inside the auto-making cluster. The industry complex today has more than 200 enterprises supplying locally manufactured parts and components, and has the ability to produce more than 260 types of
One of the main objectives of the Uzbek government’s industrial policy in relation to the automobile industry is to activate its potential and transform the industry into a driver of growth for other priority sectors in manufacturing.
Transformative Industrial Policy for Africa
99

components. The level of localization exceeds 50 per cent for some of the new models and 80 per cent for the older ones (UNDP, 2013).
The Uzbek government’s industrial policy towards the automobile industry have been aimed at: increase in vehicle production; modernization and technological re-equipment of enterprises; establishment of manufacturing capabilities of component parts; rendering of information services to the enterprises; arrangement of advanced training to prepare skilled employees and specialists for the industry; and professional development and re-training of senior executives. This has been possible firstly due to the government’s direct involvement and business stakes in the industry, which makes it possible to channel resources to particular activities. It has also been helped by incentivised foreign investments.
In a similar recent development, the joint venture, GM Powertrain Uzbekistan, opened an engine plant in Tashkent, which started work in 2011. GM owns 52 per cent and UzAvtosanoat has a 48 per cent stake in the Powertrain joint venture. It is GM’s first engine plant in Uzbekistan. It will produce more than 225,000 1.2 L and 1.5 L engines a year for use in GM small passenger cars around the world (GM Media, 2011).
While cars manufactured in Uzbekistan are largely intended to satisfy internal demands, they are increasingly exported to Russia and other Central Asia countries. Some of the models produced are intended only for export. Figure 4.5 shows the export of vehicles from Uzbekistan, which declined slightly after 2008 due to the global crisis and declining demand in Russia, but has reportedly picked up again since 2012.
Figure 4.5 Exports of vehicles from Uzbekistan
Source: Anderson and Klimov (2012)
Global crisis and declining demand in Russia
67,451 83,792 70,894101,743
203,904
328,132
551,749
773,502722,957
244,762
487,175
0
100,000
200,000
300,000
400,000
500,000
600,000
700,000
800,000
2000 2001 2002 2003 2004 2005 2006 2007 2008 2009 2010
Economic Commission for Africa
100

Following the government’s aim of developing local capabilities in parts manufacturing, the country has started exporting components as well. The Uzbek-South Korean joint venture UzChasis was the first among Uzavtosanoat enterprises to export spare parts to Brazil. In May 2014, it signed a contract for $4.5 million. Specializing in the manufacture of automobile headlights and lamps made of polymeric materials, the joint venture is capable of producing up to 250,000 sets per year. The company is unique in this regard and has no counterparts in Central Asia. Similarly, another Uzbek-South Korean joint venture of UzSungWoo is engaged in production of stamped parts for new cars made by GM Uzbekistan and has entered into an agreement for the supply of its products to Brazil since August 2014.
Transformative Industrial Policy for Africa
101

4.3.3. Ethiopia
(a) Overview
Except for Rwanda, Ethiopia is the only country in Africa whose GDP growth has been consistently high for over a decade without relying on a natural resource boom. The other high-growing African economies, such as Angola, Mozambique and Nigeria, have relied heavily on natural resources.
Between 2004 and 201363, per capita GDP growth in Ethiopia was 8.1 per cent per annum (WDI, 2015), the highest on the continent during this period and very high by any standard. Also during this period MVA has grown at a rate of 11 per cent per annum, by far outperforming Rwanda (WDI, 2015). Manufacturing exports have grown more than 11-fold, from $21 m to $237 m, largely thanks to the increasing export earnings of the leather, the textile, and the apparel industries. This represents more than a doubling of manufactured exports’ share in total merchandise exports, which itself more than quintupled during the period, from $922 to $4786m (WTO, 2015).
Nevertheless, MVA as a share of GDP in Ethiopia remains 5 per cent (WDI, 2015), well below the African average of 10 per cent (ECA, 2015). The country scores below the ACET 15 average64 on most structural transformation indicators, including diversification, export competitiveness, productivity, and technological upgrading (ACET, 2014).
Despite the meagreness of its structural transformation and catch-up so far, it is probably not unreasonable to believe that Ethiopia will be able to catch up with China and Vietnam in the light manufacturing industries in the near future. These are industries for which labour costs are very important, and Ethiopia has a labour cost advantage over both China and Vietnam. However, there are reasons to believe that Ethiopia’s catch-up may continue beyond these ‘obvious’ industries.
One is the country’s developmental orientation. While being based on specific conditions of the country,
in many ways it resembles that of successful catch-up experiences in East Asia, such as Korea and Taiwan, with a relatively ‘authoritarian corporatist’ structure (Wade, 1990)
63 2004 marks a turnaround for the Ethiopian economy. In this year, results from policies of the first development plan that covered 2002-2005, the Sustainable Development and Poverty Reduction Program (SDPRP), started to materialise. This plan was followed by the first 5-year development plan, the Plan for Accelerated and Sustained Development to End Poverty (PASDEP), covering 2005-2010. Since then, 5-year development plans have become a hallmark of Ethiopian development policy, with the Growth and Transformation Plan (GTP) covering 2010-2015, and the Growth and Transformation Plan 2 (GTP2) covering 2015-2020.
64 A group of 15 countries in Africa (excluding North Africa) that make up a majority of the region’s GDP, manufacturing and agricultural production. They are: Burkina Faso, Ghana, Nigeria and Senegal in West Africa; Ethiopia, Kenya, Rwanda, Tanzania and Uganda in East Africa; and Botswana, Mauritius, Mozambique, South Africa and Zambia in Southern Africa.
...it is probably not unreasonable to believe that Ethiopia will be able to catch up with China and Vietnam in the light manufacturing industries in the near future. These are industries for which labour costs are very important, and Ethiopia has a labour cost advantage over both China and Vietnam.
Economic Commission for Africa
102

and centralised economic planning. Meles Zenawi, Ethiopia’s recently deceased prime minister, who ruled the country from 1995 to 2012, repeatedly expressed admiration for the East Asian experience. He stressed that the East Asian success was based on a prudent combination of market forces and state intervention, in which the state not only provided basic infrastructure and services but also a conducive environment for the private sector to develop productive capabilities (Zenawi, 2011). Oqubay (2015) characterises the Ethiopian state as one clearly aspiring to become developmental – a state characterised by its exclusive focus on development, public mobilization around a grand vision, the commitment to improving state capability, and embedded autonomy.
The second reason to be optimistic about Ethiopia’s future prospect for catch-up is the impressive industrial policy-making capability that it has accumulated since the Ethiopian People’s Revolutionary Democratic Front (EPRDF) government came to power in 1991.
The quality of its industrial policy-making is represented by The Growth and Transformation Plan covering 2010-2015, which is, according to Ohno (2011), unusual in its brevity, coherence and strategic direction. Priority manufacturing industries were designated in the plans, based on considerations of resource availability, labour intensity, linkages to agriculture, export potential, and (relatively) low technological entry barriers. They include garments and textiles, agro-processing, meat processing, leather and leather products, and construction. For each of these industries, the state has set up supporting institutes to coordinate the value chains effectively (for example, ensuring efficient supply of inputs to manufacturers) and assist firms with technological upgrading in any capacity needed.
Two state-owned banks, the Commercial Bank of Ethiopia (CBE) and the Development Bank of Ethiopia (DBE), provide most credit to firms in these industries. CBE provides working capital and international banking services, while DBE provides long-term loans at subsidised rates. Foreign banks are simply not allowed to operate in Ethiopia. And the understanding is that they will be allowed in only when domestic banks have developed the financial, managerial and technological capacity to compete against international banks. Another reason for closing its capital markets to foreign banks is to avoid intrinsic financial instability, vulnerability, and shocks that have in many instances plagued LDCs with high dependence on foreign capital (see UNCTAD, 2011).
While the Ethiopian government is looking to intensify efforts to develop priority industries through selective (or vertical) industrial policy in the coming years, most of the federal budget has for the past 20 years focused on horizontal industrial policies, such as education and infrastructure. Results so far are impressive.
Enrolment in primary schools has increased from below 20 per cent in the early 1990s to about 94 per cent (22 million students) in 2012, and gross school enrolment rose from 23 per cent in 1993 to 106 per cent in 2011 (MOFED, 2012). The number of universities has increased from 1 in 1990 to more than 30 today.
Transformative Industrial Policy for Africa
103
Additionally, the government has invested massively in infrastructure development, focusing particularly on power generation and transport65. According to the Ethiopian Road Authority, the road network expanded from 26,550 km to 53,997 km between 1997 and 2011. The country is also set to quadruple its power generation capacity when the Grand Renaissance Dam on the Nile is finished in 2017. By itself the Dam will be able to generate 10,000 MW (EIU, 2012), standing as one of the largest hydroelectric power stations in the world and generating twice as much power as Nigeria’s current capacity, a country with over 170 m people.66
(b) Sectoral stories: leather, textile and garment, cement, and floriculture
80 per cent of Ethiopia’s population is dependent on agriculture for their livelihoods, so naturally, industrial policy in Ethiopia has focused heavily on promoting manufacturing industries that provide linkages to the agricultural sector. The leather industry and the textile and garments industry are the best examples.
Both the leather products sector and the textile and garments sector have been designated as top priority manufacturing industries in the recently released 5-year development plan that covers 2015 to 2020 (The Growth and Transformation Plan 2). This is not only because they have strong linkages with the agricultural sector (they use inputs from the livestock and the cotton sectors) but also as they both are labour-intensive in nature (thus absorbing labour from the agricultural sector), have major export potential, and have low entry barriers.
To become internationally competitive in these two sectors, the Ethiopian government has invited foreign investors to provide much needed investment capital and technological capabilities. A slew of incentives has been created to induce these firms (as well as domestic ones that can meet international standards) to export, including: (i) subsidised land rent in industrial zones; (ii) generous credit schemes; (iii) 100 per cent exemption from the payment of duties on import of all capital goods and raw materials that can’t be provided domestically but are necessary for the production of export goods; and (iv) five-year tax holidays on profits (Gebreeyesus, 2011).
65 Lack of proper infrastructure (especially electricity and roads) has been identified as a key bottleneck for structural transformation in Africa (excluding North Africa) (Page, 2013). Africa (excluding North Africa) generated 90GW in 2012 (IEA, 2014), which is roughly the same amount of power as Spain. Furthermore, only one-third of Africans living in rural areas are within two kilometers of an all-season road, compared with two-thirds of the population in other developing regions (Ernst and Young, 2013b).
66 The Grand Renaissance Dam is financed almost purely domestically, as the World Bank and even the Chinese government pulled out because of ‘hydro-political’ sensitivities with Egypt. Seeing the lack of foreign investment in the project, many public workers and union members in Ethiopia have pledged a month’s salary towards the project, which stands as the prime example of the Ethiopian government’s devotion to maintaining high rates of public investment.
To become internationally competitive in these two sectors, the Ethiopian government has invited foreign investors to provide much needed investment capital and technological capabilities. A slew of incentives has been created to induce these firms to export
Economic Commission for Africa
104

Although export figures from the last two years indicate positive trends for both industries, the results are not yet near where they need to be in order to make a significant contribution to structural change.67
In contrast, the less obvious industries of cement and floriculture have shown tremendous growth (see Oqubay (2015) for detailed analyses).
Feeding on the boom in construction, cement production has grown from 800,000 tons in 1999 to 10 million tons in 2012, making Ethiopia the third largest cement producer in Africa. The average annual growth of cement production was more than twice that of the world during this period. Its direct contribution to employment has been limited, as it is largely a capital-intensive industry; employment in cement factories increased only from 1,648 in 1992 to 7,233 in 2012 (Oqubay, 2015). But it has created significant employment through forward linkages to downstream cement product manufacturers (concrete products and ready-mix cement).
The state has provided support to the cement industry through both direct and indirect measures. Direct measures most importantly include entry incentives for domestic firms, such as long-term loans made available for capital investments; easy access to mining resources for firms; and the allocation of foreign currency on preferential basis. Additionally, government provision of transport and energy has been crucial, including import of over 1,000 trucks and supplies of heavy-oil fuel, coal, pet coke and electricity. More indirectly, the government’s large-scale housing and infrastructure programmes, when combined with the expansion of private sector construction, have provided an important demand stimulus for cement.
Like the cement industry, the Ethiopian floriculture sector has made important contributions to the country’s overall economic development through linkage effects, but additionally through its ability to earn foreign exchanges and directly generate employment.
Cut flower exports increased from three tons in 2003-04 to more than 50,000 tons in 2011-12, with export earnings rising from $0.32 million to about $200 million. From 2007 to 2012, the sector’s employment grew from 25,000 to 50,484 (Oqubay, 2015). The industry grew from a single firm in 2000 to about 100 firms in 2014 (World Bank, 2014). The industry has also created indirect jobs through the associated expansion of horticulture. Linkage effects have included backward linkages to packaging products and forward linkages to cold chain logistics and air transport (Ethiopian Airlines). Ethiopian Airlines has now become the
67 From 2009 to 2012, export revenues increased from $57m to $123m in the leather and leather products sector, while for the textiles and garments sector, earnings increased from $23m to $99m (MOI, 2015).
FDI has played a key role in contributing to technological development and market access in this industry. According to most foreign investors, Ethiopia was an attractive investment location because of its appropriate natural endowments (such as land and altitude), cheap labour, and government investment incentives.
Transformative Industrial Policy for Africa
105

biggest foreign exchange earner of the country – bringing in approximately $2 bn in 2013 (World Bank, 2014) – and was recently rated the 6th most dependable airline in the world by CBS News (2013)
While Ethiopian firms initially kicked off the industry, foreign firms have increased their investment in the sector, accounting for 63 per cent of all firms operating in the sector in 2012 (Oqubay, 2015).68 FDI has played a key role in contributing to technological development and market access in this industry. According to most foreign investors, Ethiopia was an attractive investment location because of its appropriate natural endowments (such as land and altitude), cheap labour, and government investment incentives. These investment incentives include tax holidays on profits for up to five years, duty free privileges on all capital goods, and the provision of construction material. Moreover, subsidised loans by the DBE have been the prime source of long-term investment financing for firms in the floriculture industry – almost two-third of firms in the industry have relied on loans from the DBE. And seeing the success of DBE loans to the floricultural industry, private banks have now also started lending to the industry.
68 It is also said that the sharp currency devaluation of 2010 was a major boost for floriculture firms, as all of them export 100 per cent of their outputs.
Economic Commission for Africa
106

4.3.4. Rwanda
(a) Overview
Just like Ethiopia, Rwanda has yet to experience a significant change of its productive structure and growth of incomes. GDP per capita was $696 in 2013 and between 80 per cent and 90 per cent of the population is still engaged in subsistence agriculture (IMF, 2015).
However, also like Ethiopia, Rwanda is one of the few African countries that have a clearly defined set of national development goals and targets. Its Vision 2020 sets out to particularly strengthen education, infrastructure, privatisation, international integration and agribusiness (MOFEP, 2000). Medium-term plans are stated in the country’s Economic Development and Poverty Reduction Strategy (EDPRS) 2008-2012 and EDPRS 2013-2018. It is also serious about industrial policy. The core of industrial policy planning is carried out by the Ministry of Trade and Industry. Other important industrial policy bodies mostly include initiatives to support private sector development, such as the Rwanda Development Board (RDB), established in 2008 to provide current and potential exporting firms and the government with advice to stimulate exports, and the Private Sector Federation of Rwanda (PSF), mandated to strengthen private companies and to build human capacity for the private sector.
But despite all these initiatives to boost economic development, structural change is happening at a slow pace. Between 2004 and 201369, MVA growth was only 6.6 per cent per annum and the manufacturing sector’s share in GDP declined from 7 per cent to 5 per cent (WDI, 2015). The manufacturing sector’s share of merchandise exports increased by two percentage points from 5 per cent to 7 per cent. The share of agriculture, fuel and mining products in merchandise exports remained more or less unchanged, only a shade down from 56 per cent to 55 per cent (WTO, 2015).
Plans to develop specific manufacturing sectors don’t seem to feature prominently in the country’s overall development plan. The word manufacturing is mentioned twice in Rwanda’s Vision 2020 plan, neither of which is indicative of any significant manufacturing development policy70 (MOFEP, 2000, p. 9, p. 20). While the Ministry of Trade and Industry’s Industrial Master Plan for 2009-2020 and National Industrial Policy in 2011 list prioritised manufacturing sectors – including agro-processing, textiles, mineral processing and construction materials – they do not outline specific supports to develop the targeted sectors, apart from horizontal industrial policy measures such as making the business environment more conducive, developing infrastructure, facilitating trade, and promoting human
69 2004 has been chosen as a starting point as GDP growth has been consistently high from this year.
70 Once in capacity insignificant to manufacturing development, and once as brief bullet point in relation to agro-processing.
Structural change might be happening at a slow pace, but Rwanda has been one of Africa’s fastest growing economies in the last 10 years, with an annual per capita GDP growth rate of 5.0 per cent from 2004 to 2013 (WDI, 2015)
Transformative Industrial Policy for Africa
107

resources (notwithstanding, these are important measures71) (MOTAI, 2009; 2001).
Rwanda aims for industry to make up 26 per cent of GDP in 2020, an increase from 16 per cent in 2012 (EPDRS, 2013). But given that manufacturing currently makes up only 43 per cent of industry in Rwanda (MOTAI, 2011), this puts the 2020 target of manufacturing as a share of GDP at a meagre 11 per cent. By contrast, Ethiopia’s target for manufacturing as share of GDP in 2020 is 20 per cent (GTP2, 2015).
Structural change might be happening at a slow pace, but Rwanda has been one of Africa’s fastest growing economies in the last 10 years, with an annual per capita GDP growth rate of 5.0 per cent from 2004 to 2013 (WDI, 2015). Key features of Rwanda’s development policy have been mentioned above, but many see the government’s pro-business reforms – including privatisation, investment facilitation and trade liberalisation – as the ultimate driver of growth. The number of formally registered firms has skyrocketed since the government simplified business registration procedures in 2006. In 2008, more than
3000 firms registered, up from an average of 700 in previous years. In 2009, this number rose to 6,905 firms, and in 2010, the government managed to register an impressive 18,447 new businesses (World Bank, 2013). Out of 144 economies, Rwanda ranks 62 in the World Economic Forum’s Global Competitiveness Index and third in Africa after Mauritius and South Africa. FDI inflows have also soared, from $8 m in 2004 to a peak of $160 m in 2012 (UNCTAD STAT, 2015).
(b) Sectoral stories: ICT-based services and tourism
Growth of the Rwandan economy so far can mainly be attributed to growth of the services sector.
The ICT-based services sector has been an important driver of that growth. The government initiated its national ICT plan in 2000 with the hope of making Rwanda into the ‘Singapore of Africa’ (Singapore is the second most network-ready country in the world). In 2011, the Rwanda Technology Authority announced the completion of a 2,300 km nationwide fibre optic cable, providing faster internet access to a wider range of broadband services. Additionally, financing from the government, private sector and international organisations have spurred progress in the use of telecommunications services and the adaptation of a range of innovative applications such as e-banking, e-agriculture and e-trade (UNCTAD, 2014a). Mobile phone subscriptions rose from 333,762 in 2006 to 5,690,751 in 2012 (UNCTAD, 2014 a).
71 Rwanda’s per capita power generation capacity, for example, stands low even compared to other LDC’s.
Rwanda’s industrial policy towards the tourism industry has been quite a success, contributing in a major way to the generation of employment and foreign exchanges. However, it is unlikely that Rwanda can sustain its economic development with significant improvements in its manufacturing sector, which has higher productivity, greater scope for innovation, greater ability to offer high-quality jobs, and greater tradability than the service sector does.
Economic Commission for Africa
108

The tourism sector has, however, been the strongest driver of growth, ranking first in investment attraction out of all sectors in the country (UNCTAD, 2014a). According to the RDB, its export revenues amounted to $293 m in 2013, making up a whopping 30 per cent of the country’s total export earnings. It has also been important for employment generation, contributing to over 135,000 jobs in 2012, or 6.4 per cent of total employment. Compared to other countries in the region, Rwanda has had by far the largest surge in tourist arrivals, from 12.8 per 100,000 people in 2000 to 85.4 per 100,000 people in 2011 (UNCTAD, 2014a).
Gorilla viewing has been the most significant contributor to the surge of tourism in Rwanda. The country is home of the Virunga mountain gorilla, a highly endangered ape subspecies, with a total estimated population of only 380 in Rwanda, Democratic Republic of Congo and Uganda. Only in Rwanda and Uganda can these gorillas be visited safely. But Rwanda has an advantage over Uganda in that the gorillas can be reached in only two hours from Kigali, compared to six hours from Kampala. In addition, road infrastructure is better in Rwanda. In 2008, about 17,000 people visited the Volcanoes National Park (where most of Rwanda’s gorillas reside), an impressive increase from only 417 tourists in 1999 after the reopening of the park (Nielsen and Spenceley, 2010). Aside from bringing in significant export earnings, gorilla tourism has generated plenty of jobs for guides, trackers and anti-poachers. Some private sector tour operators also offer community-based tourism activates, such as stays with a local family, banana beer production, and village walks (Nielsen and Spenceley, 2010).
Several industrial policy initiatives underpin the tourism sector’s success in Rwanda.
First, the government has aggressively been promoting its attractions internationally ever since the 2003 World Travel Market in London. Rwanda, whose delegation is normally led by the CEO of the RDB, has won the award of Best Exhibitor from Africa in the International Tourism Bourse in Berlin five times since 200 (ETN, 2014). 72 To achieve increased media visibility, Rwanda has contracted international public relations and marketing agencies from the UK and the US. The websites of various government institutes are now impressively well developed and maintained, and the country has increasingly been featured in documentaries on international television channels such as Al-Jazeera, CNN, Animal Planet, and Discovery Channel (Nielsen and Spenceley, 2010).
Second, the government has worked meticulously to develop skills of employees in the tourism sector. The Rwanda Tourism University College was established in 2006, offering bachelor’s degrees in hotel and restaurant management and in travel and tourism management. The college also offers many tourism-related certificates, including tour guiding, cabin crew training, housekeeping, and exhibition and event management. In 2009, the Work Force Development Authority of Rwanda expanded on tourism courses offered in TVET institutions to provide more training in culinary art, housekeeping, front desk operations, and table waiting.
72 2007, 2008, 2009, 2010 and 2014.
Transformative Industrial Policy for Africa
109

Third, in addition to a range of fiscal and non-fiscal incentives made available to investors across all sectors, investors in the tourism and the hotel industries are exempt from import duties on certain equipment. The list is long but mostly includes machines for house maintenance (e.g. generators, air conditioning shafts, fire detectors), outdoor leisure equipment (e.g. playground equipment, tennis court equipment), and bedroom fittings (e.g. carpets, beds, televisions) (UNCTAD, 2014 a).
Rwanda’s industrial policy towards the tourism industry has been quite a success, contributing in a major way to the generation of employment and foreign exchanges. However, it is unlikely that Rwanda can sustain its economic development without significant improvements in its manufacturing sector, which has higher productivity, greater scope for innovation, greater ability to offer high-quality jobs, and greater tradability than the service sector does. In short, without diversifying its economy towards more manufacturing, there are limits to how much the country can develop.
4.4. CONCLUSION
In this Chapter, we have discussed a wide range of industrial policy experiences, spanning the globe over the last three centuries, starting from 18th century Britain to today’s Ethiopia. Despite the scope, there are some general lessons that can be drawn.
First of all, all the cases that we have discussed show that long-run economic success critically depends on the development of productive capabilities. In this regard, it is important to note that successful countries did not just create, through protectionism and subsidies, the space in which infant industries can grow but also ensured that investments intended to enhance the productive capabilities of the infant producers are made – some by the government and others by the infant producers themselves.
Second, for countries at earlier stages of economic development, the development of these capabilities requires that the country defies comparative advantage and promotes infant industries. The greater the deviance from comparative advantage is, the greater will be the risk, but so will the returns. However, it is important to note that, while they were busy deviating from comparative advantage in certain sectors, the successful countries made it sure that they exploit to the full their comparative-advantage-conforming industries for exports and employment creation. Cases like Japan, Korea, and Taiwan are the best examples.
Third, the experiences of the successful economies show that there are many different paths towards developing productive capabilities. A country may pursue high protectionism (as in Britain or the US) or low but targeted protectionism (Belgium). It may focus on import substitution (the US) or export promotion (Korea, Taiwan). It may engage in near-total
Economic Commission for Africa
110
prohibition on FDI (Japan, Finland), heavy regulations mixed with active engagements in limited areas (Korea, Taiwan), or active but strategic courting of them (Singapore, China, Malaysia). It may focus on upgrading from its natural resource bases (Chile), start completely new industries (Japan and Korean), or do both (Malaysian palm oil and electronics). It may give the leading role to SOEs (France, Singapore, Taiwan), large private-sector firms (Japan, Korea, the US), or SMEs (Italy, Switzerland, or Germany). The permutation is mind-bogglingly large.
Fourth, history shows that there are many different industrial policy tools that can be, and have been, used. These are too numerous to list, but the main ones include: (i) tariff and other trade restrictions to promote infant industries, such as (explicit and implicit) quantitative restrictions or excise taxes targeted at particular imports; (ii) subsidies (including subsidized loans from state-owned banks or from regulated private sector banks) or tax breaks targeted at particular industries or at activities that promote the development of productive capabilities, such as exports, investments, R&D, and training (of managers as well as workers); (iii) coordination of complementary or competing investments, through measures such as indicative planning, government-mediated inter-sectoral dialogues, sanctioning of special purpose cartels, and state-mediated mergers and acquisitions; (iv) licensing policies aimed at increasing productive capabilities (e.g. realisation of scale economies, importation of the right technologies at the right prices); (v) formal and informal regulation of FDI aimed at maximizing knowledge transfer and spill-over, such as requirements for joint venture, technology transfer, local R&D, and worker training; (vi) use of SOEs, state-run venture capital, or state equity participation in private sector firms for various purposes (e.g. entry into high-risk industry, provision of cheap inputs to the private sector); (vii) use of government procurement policies to help strategic industries, especially in the early stages of development; (viii) establishment of public agency or public-private partnership to provide infrastructure, R&D, technical assistance, information services, export marketing, and other productive inputs that cannot be provided by the relevant producers, especially but not exclusively SMEs; (ix) promotion of industrial clusters, private sector joint ventures, industry associations, and cooperatives, in order to help sharing of risk, exchange of information, and mutual learning among firms; (x) strategic use of patent laws and other IPR laws to maximize technological absorption and innovation.
In this report, we do not offer one ‘best practice’ development strategy or a particular set of policy tools that every country should adopt. Exactly what lessons each country draws from our case studies will depend on the environment it faces, the capabilities that it possesses, and the ambitions it has.
In this report, we do not offer one ‘best practice’ development strategy or a particular set of policy tools that every country should adopt. Exactly what lessons each country draws from our case studies will depend on the environment it faces, the capabilities that it possesses, and the ambitions it has.
Transformative Industrial Policy for Africa
111

112
Economic Commission for Africa