Embed Size (px)
Citation preview

Chapter 3Chapter 3Chapter 3Chapter 3 Materials and MethodsMaterials and MethodsMaterials and MethodsMaterials and Methods

Materials and Methods
A Genomic Study on the Sub-Structured Chaudhari Tribe of Southern Gujarat 62
MATERIALS AND METHODS
After identifying the objectives of the study, it is important to have a strategically
designed research plan to achieve coherent and methodological accomplishment of the
goals of the study. The present section outlines step by step the conception, planning
and underlying reasoning followed for methodological execution of the study to obtain
meaningful and reliable inferences.
3.1. Selection of the Study Population and Field Area
Prior to the pilot survey, information on various tribal populations of India from
different sources such as books, journals and the internet was collected. Since
population sub-structuring in Indian populations is a unique feature and not many
populations have been investigated to observe the patterns of micro-differentiation
among the subdivided populations (where each subdivision constitutes a Mendelian
unit), the search was initiated for identification of populations bearing this distinct
characteristic. After going through literature review it was found that Chaudhari tribe
from Gujarat (Bhatt, 1985) fulfilled this criterion. Moreover, keeping in view the dearth
of molecular genetics work on tribal populations of Gujarat, Chaudhari tribe from South
Gujarat appeared to be an apt choice. Chaudhari tribe constitutes 3.80% of the total
schedule tribe population of Gujarat (Census of India, 2001) and is mainly restricted to
the Surat district of Gujarat as per 2001 census data which led to selection of the Surat
district as study area. However, talukas for the collection of blood samples and
ethnographic information were finalized after the pilot survey.
3.2. Pilot Survey
A pilot study, also called feasibility study, is a small scale survey designed to test
logistics, gather preliminary information and to establish rapport with the people prior
to a larger, full fledged study, in order to improve the latter’s quality and efficiency. A
pilot survey can reveal loopholes in the design of the proposed research that failed to
meet the empirical field work conditions, thereby giving the opportunity to the
3
Materials and Methods
A Genomic Study on the Sub-Structured Chaudhari Tribe of Southern Gujarat 63
researcher to modify the methodology accordingly and to achieve successful fieldwork.
A pilot study may address a number of logistic issues. As a part of research strategy the
following information can be gathered prior to the main study.
1. Distribution of study populations
2. Adequacy of sampling frame
3. Climatic conditions of the area
4. Probability estimation of expenditure and duration of subsequent field work
5. Rapport establishment
6. The response rate and cooperation from the locals including study populations and
officials
7. The suitability and adequacy of the methodology to be followed.
A pilot study is normally small in comparison with the main study and therefore can
provide only limited information on the source and magnitude of troubles that one
might face during the main field work. But, it provides vital information on the
efficiency of the proposed procedure and results in improvements of the research design
prior to the main survey.
For the present work, pilot survey was undertaken from 5th
September to 22nd
September, 2008 for getting an overview of the population distribution, to check field
conditions and for assessing the feasibility of research and data collection in the area.
During the pilot survey sincere attempts were made to collect information on primary
health centers (PHCs) and hospitals, tribal community centers, educational institutes,
tribal welfare centers, missionaries and non government organizations (NGOs),
museums and science centers. Several government offices were also visited to appraise
them about the purpose of the visit and to seek help required during the data collection.
The various officers contacted were the Collector, District Development Officer, Chief
District Health Officer, Tribal Development Officer, Taluka Development Officers,
Principals of the various schools and colleges.
Valsad Raktdan Kendra, a Voluntary Blood Bank and Haematology Research Centre,
working in the health sector in the area was also approached for help. The blood bank
has all the facilities for the collection of blood, its storage and processing. The bank

Materials and Methods
A Genomic Study on the Sub-Structured Chaudhari Tribe of Southern Gujarat 64
also has the laboratory facilities for carrying out biochemical analysis of the blood.
Consent and permission for procuring help necessary for the collection of blood
samples in the subsequent field trips was taken from Dr. Y. Italia, Honorary Secretary
of the blood bank and also the Honorary Director of Sickle Cell Anemia Control
Program in Gujarat. Dr. Y. Italia, laboratory in-charge Mr. Bhavesh and other
laboratory members were cooperative and extended their full support for the proposed
research problem.
Few people were also interviewed during the pilot survey to inquire about the existence
of population sub-structuring among the Chaudhari tribe of Surat district. Some of the
knowledgeable people from the area were contacted and informed about the research
work. Prominent names among them were Dr. Bharat Desai, Girish Bhai Chaudhari,
Ashok Bhai Chaudhari, Manoj Bhai Chaudhari and Dr. Arvind Bhatt.
Dr. Arvind Bhatt is a retired professor in Anthropology from Gujarat Vidyapith,
Ahmedabad. Dr. Bhatt has also worked on the Chaudhari tribe of Surat and found the
existence of population subdivision as a result of adherence to the rule of strict
endogamy by the community members. Girish Bhai, Ashok Bhai and Manoj Bhai
Chaudhari belong to the same community and are involved in the social welfare of
tribal communities in Gujarat. They also told about the existence of division among the
Chaudhari tribe. Dr. Bharat Desai who is an eminent sociologist and a renowned social
worker also provided some valuable literature to support the presence of population
sub-structuring among the Chaudhari tribe of Surat district, Gujarat.
Secondary information on demographic aspects such as population distribution and
population size was also collected during the pilot survey. Census data of the Surat
district was collected to understand the distribution and preponderance of the Chaudhari
tribal population in the region. Ethnographic information on culture, food habits, and
social practices especially, mating system was collected from various libraries,
museums and local people.
From the pilot survey it was gathered that the Chaudhari population is widespread
throughout the Surat district especially in its Mandvi, Vyara, Umarwada and Mahuva
talukas. It was also established that the Chaudhari tribe has four major subdivisions
namely Pavagadhi Chaudhari, Mota Chaudhari, Valvi Chaudhari and Nana Chaudhari.

Materials and Methods
A Genomic Study on the Sub-Structured Chaudhari Tribe of Southern Gujarat 65
Since during the pilot survey it was found that the Chaudhari tribe is subdivided into
four major subgroups, the present study was designed to attempt and apportion genetic
diversity and differentiation among the sub-structured groups of Chaudhari. This can
also be seen as a model of population structure where the subgroups are nested inside
the total population of Chaudhari.
3.3. Collection of the Data
After the initial pilot survey and rapport establishment, the field area was revisited in
the subsequent years to collect both ethnographic details and blood samples from
people of the Chaudhari tribe.
3.3.1. Blood Sample Collection
3.3.1.1. Ethical Clearance
Ethical clearance was obtained from the Ethical Review Committee of the Department
of Anthropology, University of Delhi. The certificate of clearance by ethical committee
is attached as Appendix I.
3.3.1.2. Sampling Procedure
The blood samples were collected from the individuals unrelated up to at least second
cousin level, belonging to the four Chaudhari groups. Three generation pedigree charts
were also prepared to ascertain un-relatedness in all the samples and to reduce the
chances of any kind of bias in sampling. Prior to the blood collection, the purpose and
procedure involved in the study were elaborately explained in groups as well as
individually to the participants. Written informed consents were obtained before the
collection and the blood was collected by a trained medical practitioner. The consent
form used for the study is attached as Appendix II. It was made as informative as
possible for the subject. For collection of blood samples sterilized disposable syringes
were used which were properly disposed after single use with the help of syringe
crusher. 9 ml vacutainers coated with anti-coagulant Ethylenediaminetetraacetic acid
(EDTA) were used to collect 5 ml blood. On each tube serial number, date, person’s
name, age and sex were neatly written to avoid the mixing of samples.

Materials and Methods
A Genomic Study on the Sub-Structured Chaudhari Tribe of Southern Gujarat 66
3.3.1.3. Field Visits for Data Collection
Once the rapport was established, the collection of data was initiated. Both primary and
secondary ethnographic data were collected during all the field works to meet the
objectives of the study. While collecting the blood samples all the necessary precautions
were taken. 5 ml intravenous blood samples were collected by a trained medical
practitioner from randomly chosen individuals, unrelated up to second cousin level,
from the study populations with prior informed written consent.
� First Phase of Field Work (10th
February to 10th
March, 2009)
During the first field work, 27 samples from Nana Chaudhari, 22 samples from Mota
Chaudhari divisions were collected with prior informed written consent. The collected
blood samples were sent to the Biochemical and Molecular Genetics Laboratory of
Department of Anthropology, University of Delhi for the purpose of DNA extraction.
Along with the samples secondary information on social aspects such as mating pattern,
cultural practices, food habits and other rituals was also collected.
� Second Phase of Field Work (21st June to 11
th July, 2009)
The second field trip was conducted from 21st June, 2009 to 11
th July, 2009. During this
period attempts were made to achieve the targeted sample size (50 each) for both Nana
and Mota Chaudhari. Apart from random blood sampling special emphasis was given
on collection of ethnographic account of the tribe. By the end of second field work 52
Nana Chaudhari and 50 Mota Chaudhari samples had been collected. This time the
work of DNA isolation was undertaken in the sickle cell unit of Valsad Raktdan
Kendra, Gujarat.
� Third Phase of Field Work (6th
April to 27th
April, 2010)
The third field work was undertaken in the month of April from 6th
to 27th
April, 2010.
During this field trip Pavagadh region of Panchmahal district was visited to inquire
about the migration of Pavagadhi Chaudhari. Going by the information obtained,
Materials and Methods
A Genomic Study on the Sub-Structured Chaudhari Tribe of Southern Gujarat 67
Mahuva taluka of Surat district was visited to collect blood samples from Pavagadhi
Chaudhari. By the end of the field work, 41 samples had been collected.
� Fourth Phase of Field Work (8th
January to 25th
January, 2011)
The fourth field work was undertaken between 8th
to 25th
January, 2011. In this field
work 50 blood samples were collected from Valvi Chaudhari along with their
ethnographic details.
3.3.1.4. Sample Size
A total of 193 Samples were collected for the present study. 50 blood samples from
Mota Chaudhari, 52 from Nana Chaudhari, 41 from Pavagadhi Chaudhari and 50 from
Valvi Chaudhari were collected randomly from 29 villages of 3 talukas namely
Mahuva, Mandvi and Umarwada of Surat district Gujarat and 4 villages of Vyara taluka
of Tapi district. Table 3.1 presents the distribution of samples according to the area of
sample collection.
3.3.2. Ethnographic Details
Deliberate sampling, which is also called purposive sampling, was used to gather
ethnographical facts from the population under study. Besides the basic information
such as name, gender, age, current residence, ethnicity of the subject, information on
Chaudhari subgroup affiliation was also collected. Census of India, State Gazetteers or
any other local enumeration project has never collected subdivision based data on the
Chaudhari population. These surveys have always addressed the Chaudhari population
as a single unit. Except few studies such as Shah (1964) and Bhatt (1985), no written
record of the existence of internal population subdivision and their adherence to group
endogamy is available. Along with group affiliation, information was also collected on
mating pattern and other social practices. The detailed schedule used for the study is
attached as Appendix III.

Materials and Methods
A Genomic Study on the Sub-Structured Chaudhari Tribe of Southern Gujarat 68
Table 3.1. Distribution of samples according to the area of sample collection
Population Village Taluka District
Pavagadhi Chaudhari
Dungari
Mahuva
Surat
Naladhara
Karchiliya
Mahuva
Nana Chaudhari
Muritha
Mandvi
Kharoli
Satvaov
Kamal Kua
Gantholi
Gordha
Andhatari
Damodia
Utewa
Simbariamba
Ghasiyameda
Naren
Ghotadav
Vyara Tapi Gordha
Kada
Mota Chaudhari
Bilwan Umarwada
Surat
Kimdungara
Mandvi
Luharwad
Isher
Balathi
Peeperwad
Regama
Kamalkua
Devgadh
Amba padi
Vadh
Ladkua
Gharbadar
Valvi Chaudhari Nanicher Vyara Tapi
3.4. Laboratory Analysis
The collected blood samples were subjected to molecular analysis. Three different sets of
markers namely, Autosomal, Mitochondrial and Y chromosomal were screened. The
autosomal markers were analyzed at Biochemical and Molecular Genetics Laboratory of

Materials and Methods
A Genomic Study on the Sub-Structured Chaudhari Tribe of Southern Gujarat 69
Department of Anthropology, Delhi University, whereas mtDNA and Y chromosomal
markers were analyzed at the Anthropological Survey of India, Southern Regional Centre
at Mysore, Karnataka. Techniques used to assess the variation in the above mentioned
genomic sites and the work flow involved are given in Figure 3.1.
Figure 3.1. General overview of laboratory work

Materials and Methods
A Genomic Study on the Sub-Structured Chaudhari Tribe of Southern Gujarat 70
3.4.1. Extraction of Genomic DNA
The first step in the molecular analysis of the collected blood samples was the
extraction of DNA. DNA was extracted using salting-out method (Miller et al., 1988).
The salting-out method is a rapid, safe, inexpensive method that gives high yields of
good quality DNA. The detailed procedure followed for the extraction of DNA has
been given in Appendix IV.
3.4.2. Quantification of DNA
Following extraction, DNA was quantified using NanoDrop instrument, ND-1000. It is
based on the same principle as spectrophotometer but requires much less quantity of
DNA sample to measure nucleic acid concentrations. NanoDrop can measure nucleic
acid concentration and purity of nucleic acid samples up to 3700 ng/ul using 2 µl of
sample. In the present study the DNA concentration of the samples was found within
the range of 250-350 ng/µl.
3.4.3. Polymerase Chain Reaction (PCR)
The targeted genomic regions were amplified using the PCR technique. PCR is an in
vitro method for the enzymatic synthesis of specific DNA sequence using
oligonucleotide primers that hybridize to opposite strands at the regions flanking the
target DNA sequence. It carries out the exponential amplification of target DNA
sequence through repeated cycles of DNA synthesis. Each newly synthesized molecule
of target DNA acts as a template for the synthesis of new target molecules in the next
cycle. The final number of copies of amplicons (amplified targeted DNA) generated is
2n
, where n = number of cycles. The detailed technique of Polymerase Chain Reaction
is given in Appendix V.
3.4.4. Agarose Gel Electrophoresis
Prior to carrying out any further analysis, it was confirmed that the amplification has
taken place and ensured that the amplicons generated were indeed the required ones.
This task was done by comparing the molecular size of the amplified DNA with a
standard DNA ladder using electrophoresis and visualizing the results under UV ray

Materials and Methods
A Genomic Study on the Sub-Structured Chaudhari Tribe of Southern Gujarat 71
transilluminator (Figure 3.2). Depending upon the size of the PCR product
concentration of the gel used was decided. In case of the Alu markers, the genotypes
were analyzed at this stage whereas for RFLPs, PCR products were first digested with
restriction enzymes, followed by gel electrophoresis.
Figure 3.2. Agarose gel showing amplified PCR products
3.4.5. Restriction Digestion
In case of Restriction Fragment Length Polymorphism (RFLP) markers, the amplified
DNA was subjected to restriction digestion. Restriction Digestion is the process in
which a class of enzyme known as Restriction Enzymes (REs) are used to cut DNA into
smaller restriction fragments. These enzymes identify specific sequences (4-6 base pair
long) in the DNA molecule known as restriction sequences (i.e. the site where the
enzyme actually cuts the DNA molecule). On the basis of the presence or absence of the
specific sequence, restriction sites vary and so the fragment lengths of the digested PCR
product are generated which are identified by variable banding patterns. Each enzyme
has its specific temperature of activity.
3.4.6. Genotyping by Agarose Gel Electrophoresis
The genotypes of the digested target regions were determined using Agarose gel
electrophoresis. Gel electrophoresis refers to the technique in which macromolecules-

Materials and Methods
A Genomic Study on the Sub-Structured Chaudhari Tribe of Southern Gujarat 72
either nucleic acids or proteins, are forced across a span of gel, acted upon by an
electrical current. The macromolecules are separated on the basis of size and electric
charge under the influence of an electric field. Their rate of migration through the
electric field depends on the strength of the field, size and shape of the molecules,
relative hydrophobicity of the samples, and on the ionic strength and temperature of the
buffer in which the molecules are moving. Agarose is a natural colloid extracted from
seaweed. It is very fragile and easily destroyed by handling. Agarose gels have very
large "pore" size and are used primarily to separate very large molecules up to 10,000
base pairs. The higher is the concentration of the gel, lower is the porosity, which is
suitable for movement of low molecular weight substances and vice versa. Depending
upon the digested product size, Agarose gels of various concentrations were formed by
suspending dry agarose in aqueous Tris Acetate EDTA (TAE) buffer (composition
given in Appendix VI), then boiling the mixture until a homogenous solution is formed.
Ethidium bromide used in the gel gives fluorescence under UV rays, permitting
visualization of the series of DNA bands spread across the gel according to their size
and viewed against a commercially available ladder which contains DNA fragments of
known size.
3.4.7. DNA Sequencing
There are various methods available for DNA sequencing like chemical degradation,
chain termination method, sequencing by ligation etc. Advances in automation have
opened gates for faster and more reliable automated DNA sequencing technologies.
Owing to its greater efficiency and speed, dye-terminator sequencing is now the
mainstay of automated sequencing. Dye-terminator sequencing is a slight modification
of the Sanger’s chain termination method. It utilizes labeling of the chain terminator
ddNTPs, which permits sequencing in a single reaction. In dye-terminator sequencing,
each of the four dideoxynucleotide chain terminators is labeled with fluorescent dyes,
each with different wavelengths of fluorescence and emission. The dye labeled DNA
fragments are then capillary electrophoresed and a detection system identifies the
labeled bases when they pass through a laser that activates the dye.
Materials and Methods
A Genomic Study on the Sub-Structured Chaudhari Tribe of Southern Gujarat 73
3.4.7.1. Cycle Sequencing
Cycle sequencing is similar to PCR except that only one primer is used in each cycle
sequencing reaction so that the amplification of product is linear not exponential; and
the addition of dideoxynucleotides which interrupt the extension of the DNA strands
when incorporated.
Following usual PCR and gel electrophoresis, 0.5µl of the generated PCR amplicons
were subjected to cycle sequencing reaction with one primer and fluorescent dye
labeled ddNTPs using ABI Prism® BigDyeTM
terminator v3.1 cycle sequencing ready
reaction kits (Applied Biosystems, USA) following the manufacturer’s guidelines.
3.4.7.2. Sequencing Cleanup
One of the most important factors in automated DNA sequencing is clean and pure
templates. For a sequencing reaction to be successful all excess primers, dNTPs, salts
and residual DNA must be removed from the sample. The detailed procedure for
processing the plates prior to sequencing is given in Appendix VII.
3.4.7.3. Sequencing Run
10 µl of Hi-Di formamide was added to each well of the sample plate. The samples were
heated to 96°C and immediately cooled to 4
°C to denature the DNA. Sample information
sheets which contain analysis protocol along with the sample details were prepared and
imported into the data collection software. Prepared samples were analyzed on ABI 3730
genetic analyzer (Applied Biosystems, USA) to generate DNA sequences.
3.4.7.4. Sequence Quality Check
After completion of the sequencing reaction, quality of the generated sequences was
checked by using Sequencing Analysis version 5.2 software (Applied Biosystems,
USA). The Applied Biosystems Sequencing Analysis Software version 5.2 is designed
to analyze, display, edit, save, and print sample files generated using ABI genetic
analyzers. The program has a basecaller algorithm that performs basecalling for pure
and mixed base calls. It provides quality values (QV) for every single base and sample
scores for the assessment of the average quality value of the bases in the clear range
A Genomic Study on the Sub
sequence for the sample. The QV is a per
QVs are calibrated on a scale corresponding to:
Where, Pe is the probability of error.
set to 20 to 50 and typical
samples which didn’t
amplification.
3.4.7.5. Sequence Alignment, Editing and Recording of V
The generated sequences were aligned to
use of SeqScape version
of high quality, characterized by sharp peaks and little to no background
matched against the reference seq
(Figure 3.3). The electropherogram
peak colour. The sequences having a different base and peak
sequence at a given position were considered to
mtDNA, variants were reported in terms of the
Reference Sequence (rCRS
for diverse Y chromosomal sites by
sequence obtained from NCBI,
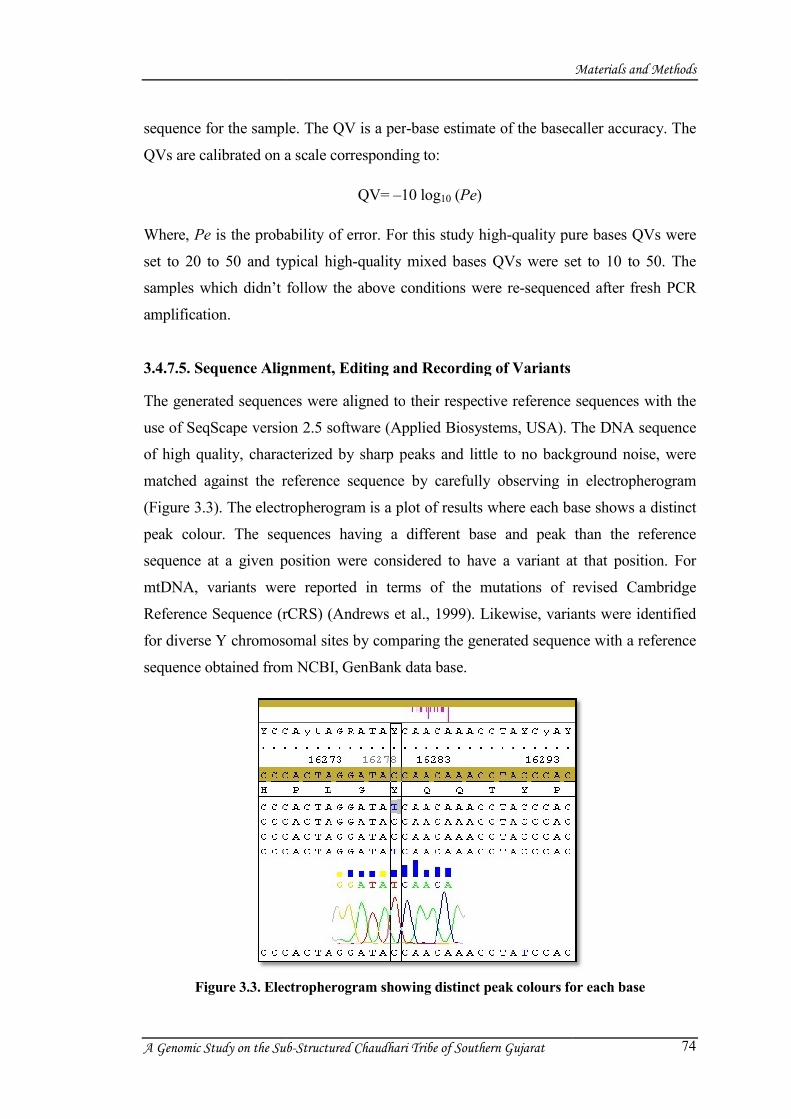
Figure 3.3. Electrophe
A Genomic Study on the Sub-Structured Chaudhari Tribe of Southern Gujarat
e sample. The QV is a per-base estimate of the basecaller accuracy. The
QVs are calibrated on a scale corresponding to:
QV= –10 log10 (Pe)
is the probability of error. For this study high-quality pure bases QVs were
set to 20 to 50 and typical high-quality mixed bases QVs were set to 10 to 50
samples which didn’t follow the above conditions were re-sequenced after fresh PCR
Alignment, Editing and Recording of Variants
The generated sequences were aligned to their respective reference sequences with the
ersion 2.5 software (Applied Biosystems, USA). The DNA sequence
of high quality, characterized by sharp peaks and little to no background
matched against the reference sequence by carefully observing in
electropherogram is a plot of results where each base
. The sequences having a different base and peak
sequence at a given position were considered to have a variant at that position
variants were reported in terms of the mutations of revised Cambridge
(rCRS) (Andrews et al., 1999). Likewise, variants were identified
for diverse Y chromosomal sites by comparing the generated sequence with
obtained from NCBI, GenBank data base.
Electropherogram showing distinct peak colours for each base
Materials and Methods
74
base estimate of the basecaller accuracy. The
quality pure bases QVs were
quality mixed bases QVs were set to 10 to 50. The
sequenced after fresh PCR
their respective reference sequences with the
The DNA sequence
of high quality, characterized by sharp peaks and little to no background noise, were
carefully observing in electropherogram
each base shows a distinct
. The sequences having a different base and peak than the reference
variant at that position. For
mutations of revised Cambridge
variants were identified
d sequence with a reference
for each base

Materials and Methods
A Genomic Study on the Sub-Structured Chaudhari Tribe of Southern Gujarat 75
3.5. Genomic Regions Analyzed
3.5.1. Autosomal Markers
14 autosomal markers, which included seven Alu Insertion-Deletion (InDel) markers
and seven Restriction Fragment Length Polymorphisms (RFLPs), were screened. The
details pertaining to the technique of PCR such as PCR components, concentrations and
temperature conditions for autosomal markers are given in Appendix VIII and IX.
3.5.1.1. Alu Insertion-Deletion (InDel) Markers
All the Alu InDels considered in the present study were human specific and biallelic
codominant loci. Except for CD4, all other Alu loci were insertion polymorphisms. The
protocols for amplification of the Alu InDel markers were taken up from Majumder et
al. (1999).
3.5.1.1.1. Predicted Variant 92 (PV92)
PV92 Alu insertion belongs to Alu Ya5 subfamily, part of the youngest subfamily Alu Y
of Alu insertions. It is present on chromosome 16.
3.5.1.1.2. Coagulation Factor XIII B (FXIIIB)
This Alu insertion polymorphism is located in intron 10 of FXIIIB gene on chromosome
1 at position 1q31-q32.1. This gene encodes coagulation factor XIII B subunit. Factor
XIII deficiency can result in a lifelong bleeding tendency, defective wound healing, and
habitual abortion.
3.5.1.1.3. D1
D1 belongs to Sb2 Alu family. This Alu insertion polymorphism is located on
chromosome 3 at 3q26.32.
3.5.1.1.4. Apolipoprotein (APO)
This site is adjacent to the APOA1, APOC3 and APOA4 gene cluster and is located at
11q23.3. It is present 4.3 kb upstream of the APOA1 gene.

Materials and Methods
A Genomic Study on the Sub-Structured Chaudhari Tribe of Southern Gujarat 76
3.5.1.1.5. Angiotensin I Converting Enzyme (ACE)
InDel ACE is located in intron 16 of the gene Angiotensin I Converting Enzyme (ACE)
positioned on chromosome 17q23 (Mattei et al., 1989). The gene is also known as
Dipeptidyl carboxypeptidase I (DCPI). The gene plays an important role in the
regulation of blood pressure via the renin-angiotensin-aldosterone system (RAAS).
3.5.1.1.6. Cluster of Differentiation 4 (CD4)
The deletion allele ends 1.665 kb upstream of the CD4 start codon. A cluster of
Differentiation (CD4) gene encodes the T4/leu3 antigen, expressed on the surface of
helper T lymphocytes. The gene is located on chromosome 12 and is composed of 10
exons and spans at least 33 kb (Maddon et al., 1987). CD4 also serves as a receptor for
human immunodeficiency virus (HIV) (Lyerly et al., 1987).
3.5.1.1.7. Plasminogen Activator Tissue (PLAT)
This Alu polymorphism belonging to PV subfamily is present in intron 8 of the
Plasminogen Activator Tissue (PLAT) gene. The gene is also known as Tissue type
Plasminogen Activator (TPA). It is located on chromosome 8 at 8p11.2, spans 36,594
bp and comprises of 14 exons (Degen et al., 1986). In the adult brain, t-PA is highly
expressed in the hippocampus, amygdala, cerebellum, and hypothalamus; regions
regulating biological functions such as learning and memory, emotions, motor
coordination, endocrine function among others. It also plays a role in neuronal
degeneration (Alzheimer's disease) and seizure (Tsirka et al., 1995).
3.5.1.2. Restriction Fragment Length Polymorphisms (RFLPs)
Seven unlinked RFLPs were considered in the present investigation. Their expected
band sizes and protocols for amplification were taken from Eccles Institute of Human
Genetics website (http://www.genetics.utah.edu/~swatkins/pub/RSP_links.html) as
described in Jorde et al. (1995) and Watkins et al. (2001).
3.5.1.2.1. Estrogen Receptor (ESR)
The RFLP under study, a C→T single nucleotide polymorphism (SNP) altering a PvuII
restriction site, is located in intron 1 of the gene ESR1, 0.4 kb upstream of exon 2 on

Materials and Methods
A Genomic Study on the Sub-Structured Chaudhari Tribe of Southern Gujarat 77
chromosome 6. The gene encodes the estrogen receptor (ER) which is a member of a
superfamily of transcription factors. Several RFLPs such as XbaI (exon 2), BstUI (exon
1) and PvuII (intron 1) have been used to report an association between the gene and
breast cancer (Andersen et al., 1994).
3.5.1.2.2. N-acetyltransferase 2 (NAT)
Arylamine N-acetyltransferase 2 or N-acetyltransferase 2 gene encodes a drug-
metabolizing enzyme. The enzyme is found in liver (Jenne, 1965) and intestinal
epithelium (Hickman et al., 1998) and functions to both activate and deactivate
arylamine and hydrazine drugs and carcinogens. The NAT2 locus is located on
chromosome 8p23.1-p21.3 (Hickman et al., 1994). The locus is highly polymorphic and
more than 20 alleles have been reported (Hein et al., 2000). Polymorphisms in this gene
are also associated with higher incidences of cancer and drug toxicity. The
polymorphism under study is a C→T SNP altering KpnI restriction site.
3.5.1.2.3. PSCR
PSCR or D21S13E locus has been localized to 21q11.1-q21. RFLPs such as TaqI
(Stinissen et al., 1990), EcoRI (Stinissen et al., 1990; Pulst et al., 1990a) and HaeIII
(Pulst et al., 1990b) have been identified in the PSCR locus. The site under
consideration in the present study is the TaqI polymorphism.
3.5.1.2.4. 5-Hydroxytryptamine Receptor 2A (T2)
The RFLP under study, a synonymous C→T SNP altering an MspI restriction site, is
located at nucleotide position 102 in the T2 gene (Warren et al., 1993). T2 or HTR2A
gene encodes one of the seven surface subtype receptors, 5-hydroxytryptamine 2A,
which mediates the functioning of the hormone and neurotransmitter Serotonin or 5-
hydroxytryptamine (Frazer et al., 1990). The neurotransmitter serotonin has been
implicated in a wide range of psychiatric conditions (Lucki, 1998). The HTR2A gene
has been assigned to chromosomal region 13q14-q21 (Sparkes et al., 1991).

Materials and Methods
A Genomic Study on the Sub-Structured Chaudhari Tribe of Southern Gujarat 78
3.5.1.2.5. Lipo Protein Lipase (LPL)
Lipoprotein Lipase (LPL) gene encodes lipoprotein lipase, which plays a major role in
lipoprotein metabolism by hydrolyzing core triglycerides of circulating chylomicrons
and very low density lipoprotein (VLDL). Human LPL locus is present on chromosome
8, localized to 8p22 (Sparkes et al., 1987), and comprises of 10 exons. Eighty-eight
variable sites have been identified across the 9.7 kb region by the 3′ end of the LPL
gene in three different populations: African-American, European, and European-
American (Nickerson et al., 1998; Templeton et al., 2000). The most extensively
studied polymorphism sites are HindIII in the 3′ flanking region (Heinzmann et al.,
1987) and PvuII in intron 6 (Oka et al., 1989). The PvuII site is altered by a C→T SNP
and has been considered in the present study.
3.5.1.2.6. Alcohol Dehydrogenase (ADH2)
The Class I Alcohol Dehydrogenase gene ADH1B, previously known as ADH2 is
located in chromosomal region 4q21-q23. The protein encoded by this gene is a
member of the alcohol dehydrogenase family. Members of this enzyme family
metabolize a wide variety of substrates, including ethanol, retinol, other aliphatic
alcohols, hydroxysteroids, and lipid peroxidation products. A C→T SNP in intron 3 of
the gene results in a variable RsaI restriction site that has been taken up in the present
investigation.
3.5.1.2.7. Aminolevulinate, delta-, Dehydratase (ALAD)
ALAD locus located in 9q34 region, encodes the ALAD enzyme that catalyzes the second
step in the porphyrin and heme biosynthetic pathway. Its activity is inhibited by lead and
a defect in the ALAD structural gene can cause increased sensitivity to lead poisoning and
acute hepatic porphyria.A T→C polymorphism altering RsaI restriction site is located 3.4
Kb upstream of the polyadenylation signal and is the RFLP under study.
3.5.2. Y Chromosomal Markers
Y-chromosome is a powerful tool to study genealogies. It is inherited paternally (Jobling
and Smith, 1995), lacks recombination, and carries a wide range of polymorphisms

Materials and Methods
A Genomic Study on the Sub-Structured Chaudhari Tribe of Southern Gujarat 79
(Underhill et al., 2000). It is a large linear molecule (approximately 60 Mb), and
preserves a unique record of mutational events (Hammer, 1994). Y-chromosome
haplotype’s combination has been used as a tool to study human migrations (Hammer et
al., 1998). It contains a simple record of the past that helps elaborate the evolutionary
relationships of modern Y-chromosome (Jobling and Smith, 1995). Two types of
markers are studied in the Y-chromosome, microsatellites and biallelic polymorphic
sites. Microsatellite markers demonstrate high levels of heterozygosity due to the high
mutation rate that allows for the inference of phylogenies among populations (Shriver et
al., 1997; White et al., 1999). Binary markers on the other hand, have a lower mutation
rate, which allows reconstruction of the ancestral state and can preserve the population
specific haplotype information that spans the human population history (Underhill et al.,
1997). Binary markers represent unique event polymorphisms (UEPs) in human
evolution; these events could be single nucleotide polymorphisms (SNPs) or insertion
/deletions at specific sites on the Y-chromosome. They allow identification of deep splits
in the Y-chromosome genealogy. The Y-chromosomal classification and nomenclature
system is maintained and updated periodically (Y Chromosome Consortium, 2002;
Karafet et al., 2008).
In the present study 54 Y UEPs namely, M9, M89, M201, P91, M427, P96, P254, M69,
M52, M82, M36, M97, M39, APT, M145, P143, M216, M356, P92, M45, M207,
M242, P36.2, M346, M173, SRY10831.2, M174, M56, M157, M87, PK5, P98, M124,
M343, M11, M27, P123, M170, M304, M172, M12, M205, M241, M99, M280, M321,
P84, M410, M147, P60, P79, P261, M214, M175 were examined. Their details such as
primer sequence, PCR conditions, position on the Y chromosome and the cycle
sequencing protocol has been given in Appendices X and XI. The phylogeny of these
markers is a perfect tree whose hierarchical structure corresponds to the historical
accumulation of mutations. The hierarchical trees having standardized nomenclature
systems of haplogroups which in turn have haplotype groups carrying specific motifs of
UEPs is given in Figure 3.4. Currently there are 20 haplogroups (A-T) divided into a
number of subhaplogroups (Karafet et al., 2008).

A Genomic Study on the Sub
Figure 3.4. The global Y Chromosome phylogenetic tree illustrating topology of major
Y chromosome haplogroup
A Genomic Study on the Sub-Structured Chaudhari Tribe of Southern Gujarat
The global Y Chromosome phylogenetic tree illustrating topology of major
Y chromosome haplogroups (Source: Karafet et al., 2008)
Materials and Methods
80
The global Y Chromosome phylogenetic tree illustrating topology of major

Materials and Methods
A Genomic Study on the Sub-Structured Chaudhari Tribe of Southern Gujarat 81
3.5.3. Mitochondrial DNA Regions
Mitochondrial DNA (mtDNA) is maternally inherited and lacks recombination which
makes it an ideal tool to study populations through maternal line. The haploid, circular
mitochondrial genome consists of 16,569 base pairs containing 37 densely packed
intronless genes and a short regulatory region, the D-loop. mtDNA accumulates
mutations faster than the nuclear genome. There are no major repetitive elements,
insertions or deletions. The control region of the mitochondrial genome is highly variable,
and it is used to determine the genetic structure and origin of populations (Parsons et al.,
1997). The high rate of base substitution in the control region of the mitochondrial
genome, and the fact that the effective population size of this region is one-fourth of the
nuclear genome (leading to increased genetic drift) allows maternal genealogy to be
constructed with high specificity (Richards et al., 1996; Macaulay et al., 1999). Similar to
Y Chromosome, the ease of reconstructing the phylogeny is the main advantage of
mtDNA. Figure 3.5 presents the simplified mtDNA phylogenetic tree, displaying the
major mtDNA haplogroups identified on the basis of mtDNA variation on both coding
and control regions. The root of the tree is indicated by a star representing the most recent
common matrilineal ancestor of all humans. The L haplogroups are the most deep-rooting
lineages and are African specific indicating the African origin of modern humans.
Haplogroup L3 gave rise to macrohaplogroups M, N and R (the latter itself a subclade of
N), which encompass all variations observed outside Africa. Haplogroup symbols
followed by a star represent all other descendant lineages (besides the ones shown) of a
particular clade, for which no unique alphabetical letters have been reserved.
The mtDNA control region is divided into 2 regions: Hyper Variable Region-I and II
(HVR-I and HVR-II). The numbering of the sequence data was done according to
revised Cambridge Reference Sequence (rCRS) for human mtDNA by Andrew et al.
(1999). In the present study HVR I corresponding to mtDNA sequence 15904 to 16540
and HVR II corresponding to nucleotide positions 70 to 300 were screened using 23
forward (F), reverse (R) and 24 F, R primer sets (Rieder et al., 1998). In addition to
HVR I and II regions, nucleotide position 10400, diagnostic for “M” haplogroup was
also screened using 15F and R primer sets (Rieder et al., 1998). Samples having T
mutation in place of C at 10400 were classified under haplogroup M while others were

Materials and Methods
A Genomic Study on the Sub-Structured Chaudhari Tribe of Southern Gujarat 82
classified under haplogroup N. The detailed protocol followed for the amplification of
mtDNA regions is given in Appendix XII. Its cycle sequencing protocol has been given
along with the cycle sequencing protocol for Y SNPs in Appendix XI.
Figure 3.5. The global mtDNA phylogeny illustrating topology of major mtDNA
haplogroups (Source: van Oven and Kayser, 2008)
3.6. Statistical Analysis
In the field of population genetics the data generated following varied number of
methodologies (Classical or Molecular markers) itself do not make any sense unless
submitted to appropriate statistical analysis. Statistical methods include a battery of
analytical measures required for describing, comparing, interpreting and finally
concluding the data with some generalization about the larger data set. Various
parameters used to assess population variability, structure, affinities or disparities and to
examine what evolutionary forces most significantly contributed in maintaining the
amount of genetic variation in the present investigation have been described below.
3.6.1. Allele Frequency
An allele is defined as one of the two or more alternative forms of a gene or DNA
sequence at specific chromosomal location. Allele frequency is the frequency of an
Materials and Methods
A Genomic Study on the Sub-Structured Chaudhari Tribe of Southern Gujarat 83
allele within a population. Allele frequencies were calculated from the genotype data by
direct gene counting at each locus separately for each population.
3.6.2. Hardy-Weinberg Equilibrium and Bonferroni’s Correction
The allele frequencies were subjected to Chi-square goodness-of-fit test to determine if
they were in Hardy-Weinberg equilibrium within the population.
Bonferroni’s correction was applied to correct for multiple comparisons. It is the
simplest correction of individual p-values for multiple hypotheses testing in order to
maintain an overall significance level α. It was estimated as:
pcorrected = �����������
Where n is the number of Chi square tests performed.
3.6.3. Heterozygosity
Heterozygosity is a measure of the diversity of a polymorphic locus Nei (1973). In other
words it can be defined as the proportion of heterozygotes per locus in a randomly
mating population. The unbiased estimate of heterozygosity for a single locus was
computed using the following formula:
� � 2��1 � � ��
��/�2� � 1�
Where, n is the number of individuals sampled and xi is the population frequency of the
ith
allele at a locus. Average heterozygosity (H) is the average of this quantity over all
loci.
3.6.4. Haplotype Diversity or Gene Diversity
Haplotype diversity is equivalent to the expected heterozygosity for diploid data. It is
defined as the probability that two randomly chosen haplotypes are different in the
sample. It is also denoted as Gene diversity. It was computed using the same formula as
employed for the calculation of heterozygosity (given above). For haploid markers such
as mtDNA or Y chromosomal haplogroups, this measure was calculated by replacing

Materials and Methods
A Genomic Study on the Sub-Structured Chaudhari Tribe of Southern Gujarat 84
2n with n. The method for estimating sampling variance was also same as that for
heterozygosity.
3.6.5. Estimates of Gene Diversity (GST and NST)
One of the methods for apportionment of gene diversity in the total population into its
components is Nei’s (1973) method.
Genetic differentiation is defined as the accumulation of differences in allele
frequencies between completely or partially isolated populations. This differentiation
between populations could be due to operation of diverse evolutionary forces.
Coefficient of gene differentiation denoted as GST, is a very good measure of gene
differentiation. It may be defined as the ratio of the inter-population gene diversity
(DST) to the total gene diversity (HT) among the populations i.e.
GST = DST / HT
Where, DST = HT - HS
HS represents the average expected heterozygosity of subpopulations assuming random
mating within each subpopulation and is calculated as following:
HS=2n (1-∑ ���)/(2n-1)
And HT denotes the expected heterozygosity of the total population assuming random
mating within. It is calculated as follows:
��� 1‐ � ���� � ��/�2� �
NST is an analogue to GST at the nucleotide level (Lynch and Crease, 1990). It is
calculated as the ratio of the average genetic distance between genes from different
populations relative to that among genes in the population at large.
!�� � ∑ "#$ %#$#$ &'
Where, πij are defined as distances between the haplotypes i and j, cij denotes the
covariance between them. νT is the total diversity in population and is defined as:
Materials and Methods
A Genomic Study on the Sub-Structured Chaudhari Tribe of Southern Gujarat 85
(� � ∑ )�*+�+*�*
Where, pi and pj are the frequency of the ith
and jth
haplotypes in population.
Extreme NsT estimates of 0 and 1 indicate zero and complete population subdivision,
respectively.
3.6.6. Wright’s F– Statistics
Hartl and Clark (1989) have illustrated the Wright’s (1921) method to quantify the
inbreeding effect of population sub-structure. Wright (1921) had formulated fixation
index which is defined as the reduction in heterozygosity expected with random mating
at any one level of a population hierarchy relative to another, more inclusive level of the
hierarchy. At the first level, FIS is estimated which is defined as the average difference
between observed and Hardy–Weinberg expected heterozygosity within each
subpopulation due to non-random mating. It can also be interpreted as the correlation
between the states of two alleles in a genotype sampled at random from any
subpopulation.
FIS = �� � �,---/ HS
Where, HS is the average expected heterozygosity of subpopulations assuming random
mating within each subpopulation and HI is the average observed heterozygosity within
each subpopulation.
The next level in the hierarchy is FST which represents the average expected
heterozygosity for subpopulations compared with expected heterozygosity for the total
population.
FST = �� � ��/ HT
Where, HT is the expected heterozygosity of the total population assuming random mating
within subpopulations and no divergence of allele frequencies among subpopulations.
The final level in the hierarchy is FIT, the comparison of the average observed
heterozygosity for subpopulations with the heterozygosity expected for the total
population. This gives the departure from Hardy–Weinberg expected genotype frequencies

Materials and Methods
A Genomic Study on the Sub-Structured Chaudhari Tribe of Southern Gujarat 86
due to the combination of non-random mating within sub populations and divergence of
allele frequencies among subpopulations.
FIT = �� � �,/ HT
3.6.7. Genetic Distance
Genetic distance is the extent of gene differences between populations or species that is
measured by some numerical quantity. Thus, the number of nucleotide substitutions per
nucleotide site or the number of gene substitutions per locus is the measure of genetic
distance. Various measures of genetic distances have been proposed by many scholars.
Nei (1972) proposed a genetic distance measure to estimate the number of genes or
codon substitution per locus between two populations. Using this method pairwise
genetic distance among the populations is estimated as,
D= -ln I
Where,
. � ∑ ��/�0∑ ��� ∑ /��
And xi and yi are the frequencies of ith
allele at a locus in the two populations X and Y
respectively. Standard errors of the genetic distances were computed using Nei and
Roychoudhury’s 1974 method.
3.6.8. Pairwise FST and Slatkin’s Linearization
As mentioned earlier, Wright’s FST is a statistic for measuring genetic differentiation of
populations. This statistic can also be applied to quantify the genetic distance for a pair
of populations. Latter (1972) formulated a better estimate of FST for the case of two
populations and multiple alleles at many loci. The measure denoted by 12 and
equivalent to FST is calculated as following:
12 � ∑ ∑ �3#4�5#4 �67
84�79
2 :1 � ∑ ∑ 3#4;4# 5#4�47 <

Materials and Methods
A Genomic Study on the Sub-Structured Chaudhari Tribe of Southern Gujarat 87
Where mk is the number of alleles at the kth
locus and r is the number of loci examined.
xik and yik are the frequencies of k allele at ith
locus in population X and Y.
To incorporate the population divergence attribute to the pairwise FST, slight
transformation to linearize the distance with population divergence time was suggested
by Slatkin (1995). Slatkin considered a simple demographic model, where two haploid
populations of size N have diverged generations ago from a population of identical size.
These two populations have remained isolated ever since, without exchanging any
migrants. Under such conditions, FST can be expressed in terms of the coalescence
times, which are the mean coalescence time of two genes drawn from two different
populations, and which is the mean coalescence time of two genes drawn from the same
population.
3.6.9. Neighbor Joining Tree
The neighbor-joining (Saitou and Nei, 1987) is a method for reconstructing
phylogenetic trees from evolutionary distance data. The principle of this method is to
find pairs of operational taxonomic units (OTUs [= neighbors]) that minimize the total
branch length at each stage of clustering of OTUs starting with a star like tree. The raw
data is provided as a distance matrix and the initial tree is a star tree. Then a modified
distance matrix is constructed in which the separation between each pair of nodes is
adjusted on the basis of their average divergence from all other nodes. The tree is
constructed by linking the least-distant pair of nodes in this modified matrix. When two
nodes are linked, their common ancestral node is added to the tree and the terminal
nodes with their respective branches are removed from the tree. This pruning process
converts the newly added common ancestor into a terminal node on a tree of reduced
size. At each stage in the process two terminal nodes are replaced by one new node. The
process is complete when two nodes remain, separated by a single branch.
3.6.10. Y Chromosome Haplogroup Assignment
A haplogroup is a group of related lineages defined by single nucleotide polymorphisms
which have accumulated along different lineages. The Y Chromosome Consortium
(YCC) has assigned hierarchical alphanumeric labels, which can be presented

Materials and Methods
A Genomic Study on the Sub-Structured Chaudhari Tribe of Southern Gujarat 88
graphically in the form of a phylogenetic or haplogroup tree (Y Chromosome
Consortium, 2002). In the present study, all the male samples were assigned specific
haplogroups following revised Y chromosomal tree nomenclature system (Karafet et
al., 2008).
3.6.11. Exact Test of Population Differentiation
In order to test the hypothesis of a random distribution of k different haplotypes or
genotypes among r populations, Exact test of population differentiation, as described in
Raymond and Rousset (1995) was carried out. This test is analogous to Fisher’s exact
test on a 2x2 contingency table extended to a r x k contingency table. All potential states
of the contingency table are explored with a Markov chain. A Markov chain is used to
explore the space of all possible tables instead of enumerating all possible contingency
tables. This Markov chain consists of a random walk in the space of all contingency
tables. It is done is such a way that the probability to visit a particular table corresponds
to its actual probability under the null hypothesis of linkage equilibrium. During this
random walk between the states of the Markov chain, the probability of observing a
table less or equally likely than the observed sample configuration, under the null
hypothesis of panmixia is estimated.
3.6.12. mtDNA Haplogroup Assignment
Based on the variations observed in mitochondrial DNA, putative haplogroups were
assigned to the samples using HaploGrep software (Kloss-Brandstaetter et al., 2011).
HaploGrep is a web application based on Phylotree, a periodically updated phylogenetic
tree of global human mitochondrial DNA variation. The tree is based on both coding
and control region mutations and provides haplogroup nomenclature for designation of
haplogroups (van Oven and Kayser, 2008).
3.6.13. Number of Polymorphic Sites
The number of polymorphic sites, also denoted as the number of segregating sites is
defined as any of the n nucleotide sites that maintain two or more nucleotides within the
population.

Materials and Methods
A Genomic Study on the Sub-Structured Chaudhari Tribe of Southern Gujarat 89
3.6.14. Nucleotide Diversity
Nucleotide diversity, also known as the average pairwise differences in a sample of
DNA sequences, is defined as the probability that two randomly chosen homologous
sites are different.
It is the average number of nucleotide differences per site between two sequences (Nei,
1987). ) � �
� � 1 � �� �*
�* )�*
Where, n equals the number of sampled sequences, xi and xj are the frequencies of ith
and jth
sequences and πij is the proportion of nucleotide differences between them.
3.6.15. Tajima’s Test of Selective Neutrality
Tajima’s D is one of the common measures of selective neutrality. The statistic is
applied for distinguishing population expansion from constant population size. The null
hypothesis of the test is that the sample of DNA sequences was taken from a population
with constant effective population size and selective neutrality of all mutations. Natural
selection operating on DNA sequences as well as changes in effective population size
through time lead to the rejection of this null hypothesis. The test uses the nucleotide
diversity and the number of segregating sites observed in a sample of DNA sequences
to make two estimates of the mutation parameter θ, both of which are expected to be
approximately equal under the standard coalescent model where all mutations are
selectively neutral and the population maintains a constant size through time (Tajima,
1989). The test statistic D is estimated as:
D = =>�=?
@&A7�=>�=?�
Where, θπ is equivalent to the mean number of pairwise differences between sequences
(π) and θS is based on the number of nucleotide variant sites. Negative and statistically
significant score is indicative of larger values for θS relative to θπ signifying the potential
effects of population expansion and balancing selection. Positive or statistically non-
significant negative scores may indicate the effects of shrinking of the effective
population size or population bottlenecks as well as strong directional selection.

Materials and Methods
A Genomic Study on the Sub-Structured Chaudhari Tribe of Southern Gujarat 90
Differences in the shape of genealogies are the basis of Tajima’s D test. The coalescent
process with neutral alleles and constant effective population size results in
approximately the same total length along interior and exterior branches in a genealogy.
Longer external branches in a genealogy can also be caused by population structure if
the DNA sequences compared are sampled from different demes. Shrinking effective
population size or population bottlenecks as well as strong directional selection lead to
increasing probabilities of coalescence towards the present time and shorter external
branches. Substantial changes to the genealogical branching pattern lead to differences
in π and S that cause Tajima’s D to differ from zero.
3.6.16. Fu’s FS
Another test for measuring the selective neutrality and changes in the population size
over time is Fu’s Fs (1997). Like Tajima’s D, the test is also based on the infinite-site
model without recombination but utilizes data from the haplotype distribution. This test
statistic is based on the equation:
FS = B� C �DE��DF
Where, S′ is the probability of observing a random neutral sample and defined as
GH � IJ�K L KMNO|Q � Q"�
Where, K is equal to the number of alleles similar or smaller than the observed value
given θπ and Fs is the logit of S′. Statistically significant negative scores indicate an
excess of alleles, a signature of population expansion. This test is considered less
conservative than Tajima’s D and is more sensitive to large population expansions
expressed as large negative numbers whereas positive numbers indicate populations
impacted by genetic drift.
3.6.17. Mean Number of Mismatch, Mismatch Distribution and Raggedness Statistic
Mean number of mismatch is defined as the average number of nucleotide sites that
differ between unique pairs of DNA sequences (Tajima, 1983). Mismatch distribution,
also known as distribution of pairwise differences, is defined as the frequency
distribution of the number of nucleotide sites that differ between all unique pairs of

Materials and Methods
A Genomic Study on the Sub-Structured Chaudhari Tribe of Southern Gujarat 91
DNA sequences in a sample from a single species. The mismatch distribution is
constructed by counting the number of differences between each pair of subjects and
then using histograms or scatter plots to display the frequencies of sites that differ. The
mismatch distribution has distinct patterns depending on the demographic history of the
population (Slatkin and Hudson, 1991; Rogers and Harpending, 1992). A smooth,
unimodal distribution is indicative of population expansion whereas a ragged,
multimodal distribution indicates constant population size over a long time period. To
distinguish between these two types of distributions another measure, raggedness
statistic (r) is used (Harpending, 1994). Raggedness statistics is sum of the squared
difference between neighboring peaks, and is estimated by the equation below:
R � ���� � ���E��STE
�UE
Where, d is the greatest number of differences between alleles, xi is the relative
frequency of i pairwise differences.
3.6.18. Median Joining Tree
An important method for visualization of haplotype data is the construction of a
phylogenetic network of haplotypes, which allows inspection of their population and
allele frequency distributions. For haplotypes without recombination or recurrent
mutations, the analysis produces a perfect tree. In this study, median-joining networks
of mtDNA based on both HVR I and II, were constructed with the NETWORK
software (fluxus-engineering.com, Bandelt et al., 1999).
3.6.19. Principal Component Analysis (PCA) and Multidimensional Scaling (MDS)
PCA and MDS are methods for displaying complex data sets in fewer dimensions in
order to extract and visualize the most important trends. The first principal component
(PC) is an eigenvector fitted to the correlation or covariance matrix of the data (e.g.
allele frequencies of populations) that explains most of the observed variation. The
following PCs are always perpendicular to the preceding component. The eigenvalues
of the PCs express how much of the variation they account for. Another method for
visualizing complex data, classical MDS, takes the data as a matrix of dissimilarities,
Materials and Methods
A Genomic Study on the Sub-Structured Chaudhari Tribe of Southern Gujarat 92
such as genetic distances between individuals or populations, and produces an output of
distances in the desired number of dimensions so that the deviations from the original
distances are minimized.
3.6.20. Population Structure and Gene Flow
To determine the population structure, a regression analysis of heterozygosity on
genetic distance was carried out with the method described by Harpending and Ward
(1982). The model estimates the relative roles of genetic drift versus gene flow in
causing population differentiation. The model assumes that the islands exchange genes
among themselves and each receives in addition, a small constant input of genes from a
continent, the same proportion to each island. In this model, genetic heterozygosity is
negatively correlated with genetic distances from the gene frequency centroid (the
overall mean gene frequencies of the population system). If the linearity between
genetic distance of an island from the gene frequency centroid and the relative
homozygosity of the islands holds then the exchange with populations outside the
region is same for each island. If the gene flow from outside the region varies in
amount from island to island, this linear relationship no longer holds. Those populations
that have undergone systematic migrations will show greater heterozygosity than
predicted by the regression line, while those groups that are more isolated will exhibit
lower than predicted heterozygosity.
3.6.21. Analysis of Molecular Variance
Analysis of molecular Variance (Excoffier et al., 1992) is a method of estimating
population differentiation directly from molecular data and testing hypothesis about such
differentiation. Variety of molecular data such as restriction fragment length
polymorphism data, direct sequence data, haplotype or haplogroup frequency data can be
analyzed using this method. The analysis is based on analyses of variance of gene
frequencies, but it also takes into account the number of mutations between molecular
haplotypes (which first needs to be evaluated). Populations are first grouped into different
clusters in order to define a particular genetic structure that will be tested. A hierarchical
analysis of variance partitions the total variance into covariance components due to intra-
individual differences, inter-individual differences, and/or inter-population differences.

Materials and Methods
A Genomic Study on the Sub-Structured Chaudhari Tribe of Southern Gujarat 93
3.7. List of Softwares used
1. DISPAN (Ota, 1993)
2. POPGENE version 1.31 (Yeh et al., 1997)
3. ARLEQUIN version 3.5 (Excoffier et al., 2005)
4. DnaSP version 5.0 (Rozas and Rozas, 1999)
5. MEGA version 4.0 (Tamura et al., 2007)
6. HaploGrep (Kloss-Brandstaetter et al., 2011)
7. NETWORK version 4.1.0. Available at www.fluxus-engineering.com
8. SPSS version 16.0
3.8. Limitations of the Study
As with any investigation one is bound to encounter some difficulties that cannot be
completely overcome in the short course of the research being conducted. Some of the
problems faced during the study were:
1. One of the problems faced during the field work was that of transportation. Both
private and public transport services were very infrequent, therefore, the time period
for working in the field was restricted.
2. Scattered settlement of the villages visited was another factor that posed a serious
problem during the fieldwork.