Embed Size (px)
Citation preview

Chapter 3 Transformations of Graphs and Data
3.1 Graphs of Parent Functions
Parent Function – the simplest equation of a particular type of function
o Ex: Quadratic Function: 𝑦 = 𝑥2
There are EIGHT important parent functions:
Choosing a window while graphing functions on a calculator
The window allows you to zoom in or zoom out to see your graphs differently
It also allows you to view graphs that have been shifted left, right, up or down on the coordinate plane
You always want to choose a window that is going to allow you to see the most important aspects of each
function!!!!!
Ex 1:
a. Graph 𝑔(𝑥) = |𝑥 + 25| − 10 on your graphing calculators. Determine an appropriate window that allows you
to see what the graph looks like.
b. What do you notice about how the graph is being shifted?
c. What is the domain and range of the function 𝑔?
Ex 2:
a. Graph the real function 𝑔 with the equation 𝑔(𝑥) = √𝑥 − 8 + 5 on your graphing calculators. Determine an
appropriate window that allows you to see the important features of the graph.
b. What do you notice about how the graph is being shifted?
c. State the domain and range of the function 𝑔.
Ex 3: Stephen, who is 1.7 m tall, dives off a 3 m springboard. An equation modeling his height ℎ(𝑥) in meters above the
water at time 𝑥 in seconds is
ℎ(𝑥) = −4.9𝑥2 + 4.5𝑥 + 4.7
a. Create a graph that would be helpful for determining the maximum height of his dive and how long it lasts.
State the window that would be appropriate.
b. What is the domain and range of ℎ within the context of this situation?
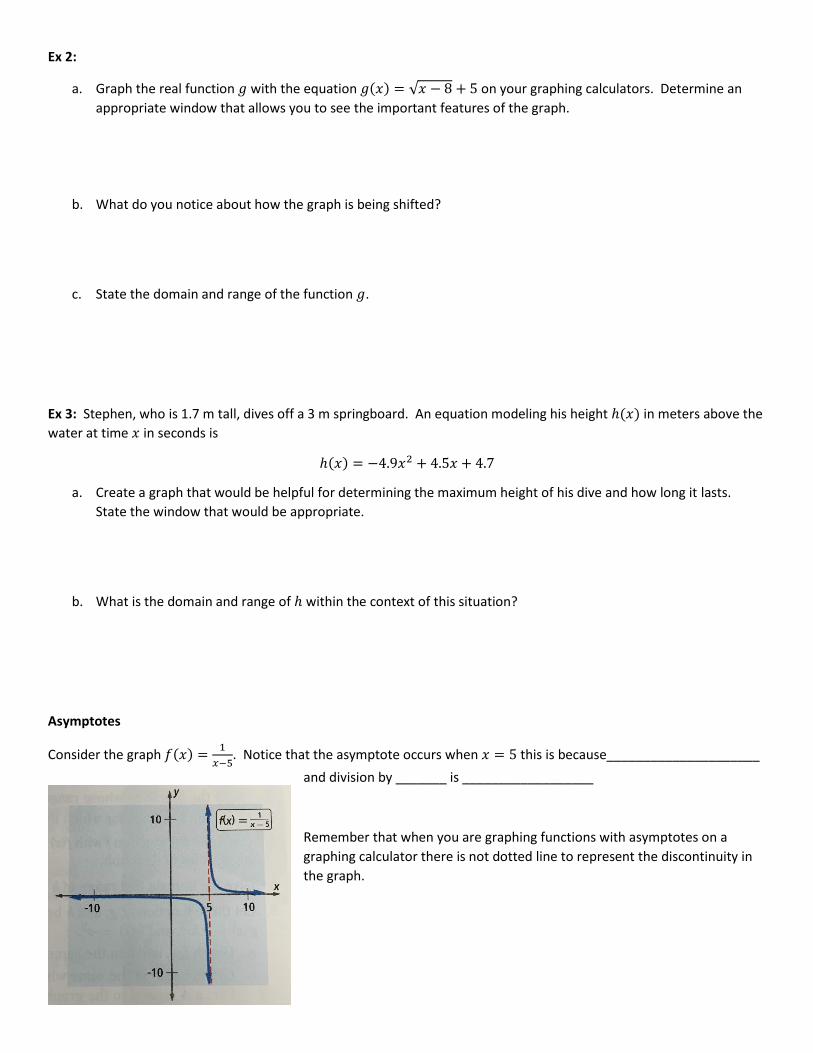
Asymptotes
Consider the graph 𝑓(𝑥) =1
𝑥−5. Notice that the asymptote occurs when 𝑥 = 5 this is because_____________________
and division by _______ is __________________
Remember that when you are graphing functions with asymptotes on a
graphing calculator there is not dotted line to represent the discontinuity in
the graph.
Ex 4: Graph 𝑦 = 1
3𝑥+2 by hand. Be sure to label your axes and graph your asymptote.
3.2 The Graph-Translation Theorem
Transformation – a one-to-one correspondence between sets of points
o Ex:
Preimage – the set of points before the transformation
Image – the mapping of a set of points pot transformation
Translation – a shifting of the graph horizontally, vertically or both.
o Ex:
Translation
A translation in the plane is a transformation that maps each point (x, y) onto (x + h, y + k), where h and k are constant.
Up =
Down =
Right =
Left =
Ex: Write a rule for the above translation

Ex 1: The graph of 𝑦 = 𝑥2 is shown to the right, together with its image under a translation T. The point (0, 0), which is
the vertex of the preimage, maps onto the vertex (-3, 1) of the image.
a. Find a rule for the translation T
b. Find the image of (2, 4) under this translation.
Ex 2: The graph of a triangle and its image under translation T is the to right.
a. Find a rule for the translation T
b. Find the image of (3, -1) under this translation
The Graph-Translation Theorem
The graph below shows a circle in BLUE with equation _________________________
It is being translated _________ units ___________ and _________ units ___________
The graph of the translated circle has equation _________________________________
The rule for the translation is ______________________________
What do you notice about the relationship between the equation of the image and the rule of the translation?
Can you give me an example of a different graph that has a specific translation and how it would effect the equation of
the graph?

Ex 3: At the
right are graphs of the function 𝑦 = 𝐶(𝑥) = √25 − 𝑥2 and its image 𝑦 =
𝐷(𝑥) under the translation (𝑥, 𝑦) → (𝑥 + 5, 𝑦 − 4). Both are semicircles.
Find an equation for the image.
Ex 3: Use the graph of 𝑦 = 1
𝑥2 to sketch the graph of 𝑦 =1
(𝑥+1)2 − 4

3.3 Translations of Data
Centers of Translated Data
Adding h to each number in a data set ___________________ to each of the mean, median and mode.
Spread of Translated Data
Adding h to each number in a data set ____________________________ the range, interquartile range, variance, or
standard deviation of the data.
Because the measures of spread of a data set _____________________ under a translation, they are said to be
______________________ under a translation
Ex 1: In a local produce store, cantaloupes sell for 99 cents per pound. A clerk weighed 30 melons and computed the
following statistics:
Mean = 3.5 lbs., Standard Deviation = 8 oz., median = 3.4 lbs., and IQR = 1 lb.
After finishing his task, the clerk noticed that the scales were not correctly calibrated. The scale was set at 3 oz. as its
starting weight, not 0. Fins the correct values for the mean, standard deviation, median and IQR for the 30 melons.
3.4 Symmetries of Graphs
Reflection-symmetric figure – when a figure can be mapped onto itself by a reflection over some ____________
o Ex:

Axis/Line of Symmtery – the reflecting line l
Point Symmetry – when a figure can be mapped onto itself under a rotation of 180° around ______________
o Ex:
Center of Symmetry – the point at which the figure is being rotated about
Ex 1: The diagram at the right shows half of a graph.
a. Copy the diagram. Draw the other
half of the graph so that the result
is point-symmetric about the origin.
Label this half A
b. Draw the other half of the original
graph so that the result is
symmetric with respect to the y-
axis. Label this half B
c. Draw the other half of the original
graph so that it is symmetric over
the x-axis. Label the graph C.
d. What symmetries does the union of graphs A, B and C and the
original graph possess?
Symmetry over y-axis Symmetry over x-axis Symmetry about the origin

Proving Symmetry
Ex 2: Prove that the graph of 𝑓(𝑥) =1
𝑥2+1
Even and Odd Functions
Any function whose graph is symmetric with respect to the ______________ is called an ___________________
o A function is _________________________ iff for all values of x in its domain ______________________
Any function whose graph is symmetric about the ______________ is called an ___________________
o A function is _________________________ iff for all values of x in its domain ______________________
Any other function is said to be ________________
Ex 3: Use your graphing calculator to graph the function 𝑓(𝑥) = 4𝑥 − 2𝑥3. Determine whether the function is odd,
even or neither. If it appears to be odd or even, prove it.
Ex 4: Graph the function F with 𝑦 = 𝑓(𝑥) =1
(𝑥+3)− 7
a. Give equations for the asymptotes of the graph
b. Describe any lines or points of symmetry
3.5 The Graph Scale-Change Theorem
The graph of a function can be scaled ________________________, ___________________________ or
____________________________________
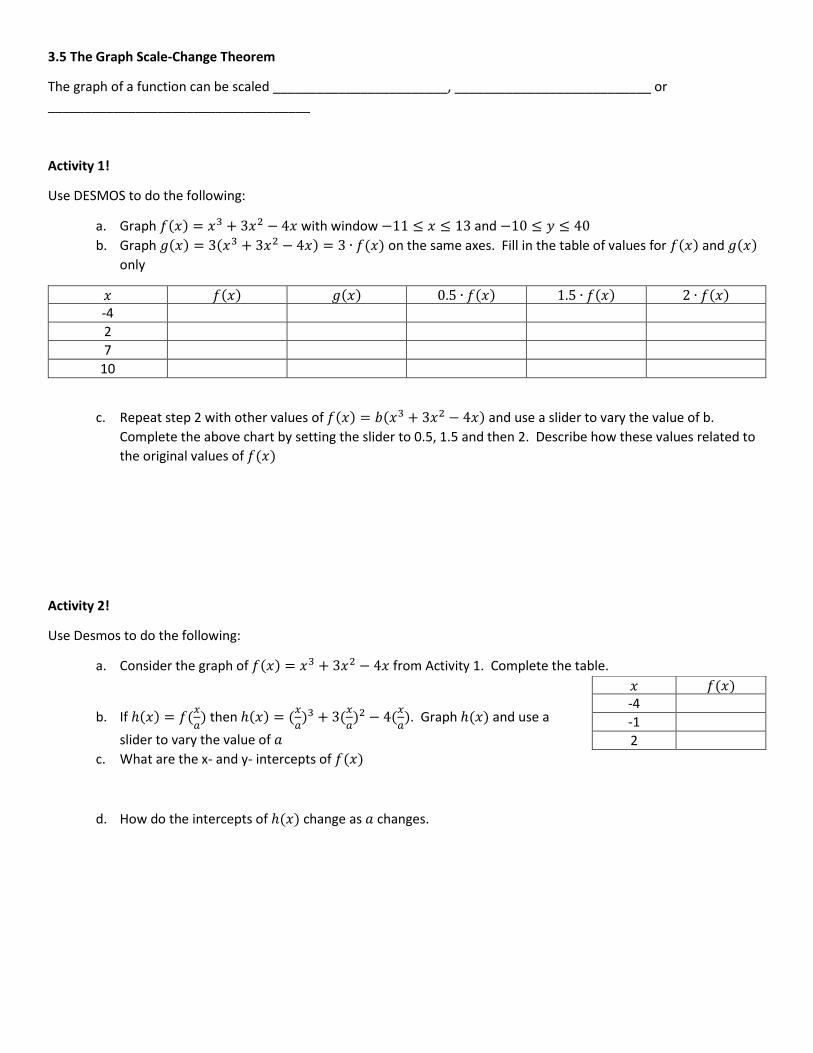
Activity 1!
Use DESMOS to do the following:
a. Graph 𝑓(𝑥) = 𝑥3 + 3𝑥2 − 4𝑥 with window −11 ≤ 𝑥 ≤ 13 and −10 ≤ 𝑦 ≤ 40
b. Graph 𝑔(𝑥) = 3(𝑥3 + 3𝑥2 − 4𝑥) = 3 ∙ 𝑓(𝑥) on the same axes. Fill in the table of values for 𝑓(𝑥) and 𝑔(𝑥)
only
𝑥 𝑓(𝑥) 𝑔(𝑥) 0.5 ∙ 𝑓(𝑥) 1.5 ∙ 𝑓(𝑥) 2 ∙ 𝑓(𝑥) -4
2
7
10
c. Repeat step 2 with other values of 𝑓(𝑥) = 𝑏(𝑥3 + 3𝑥2 − 4𝑥) and use a slider to vary the value of b.
Complete the above chart by setting the slider to 0.5, 1.5 and then 2. Describe how these values related to
the original values of 𝑓(𝑥)
Activity 2!
Use Desmos to do the following:
a. Consider the graph of 𝑓(𝑥) = 𝑥3 + 3𝑥2 − 4𝑥 from Activity 1. Complete the table.
b. If ℎ(𝑥) = 𝑓(𝑥
𝑎) then ℎ(𝑥) = (
𝑥
𝑎)3 + 3(
𝑥
𝑎)2 − 4(
𝑥
𝑎). Graph ℎ(𝑥) and use a
slider to vary the value of 𝑎
c. What are the x- and y- intercepts of 𝑓(𝑥)
d. How do the intercepts of ℎ(𝑥) change as 𝑎 changes.
𝑥 𝑓(𝑥) -4
-1
2
The Graph Scale-Change Theorem
Scale change – a transformation that maps _________ → ______________, where _______ and ________ are
constants
o Vertical scale change –
o Horizontal scale change –
o Size change –
Example:
Given a primage graph described by a sentence in x and y, the following two processes yield the same image graph:
1.
2.
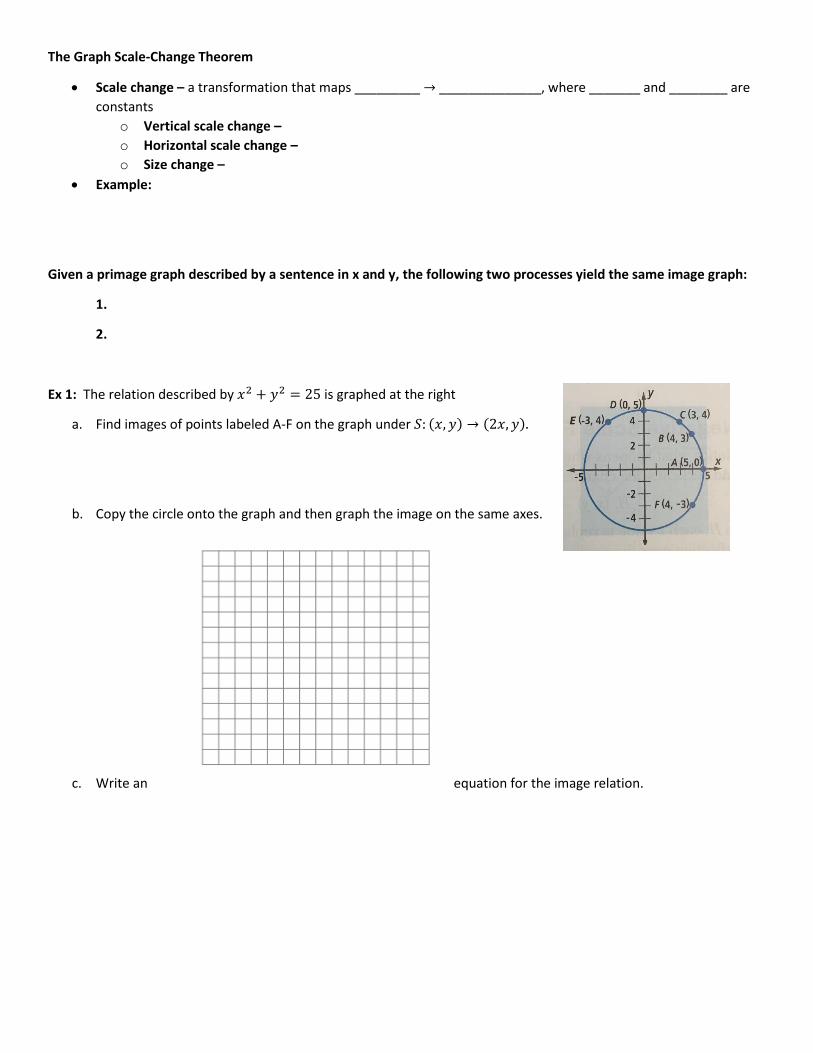
Ex 1: The relation described by 𝑥2 + 𝑦2 = 25 is graphed at the right
a. Find images of points labeled A-F on the graph under 𝑆: (𝑥, 𝑦) → (2𝑥, 𝑦).
b. Copy the circle onto the graph and then graph the image on the same axes.
c. Write an equation for the image relation.

3.6 Scale Changes of Data
Ex 1: Suppose a refrigerator cost $800 in 1995. What might you expect the cost of a similar
refrigerator to be in June 2008.
Ex 2: As a fund-raiser, club members sell candy for $2.50 per box. The number of boxes each of the 17 members sold is
given below.
a. Compute the mean, median, standard deviation, and IQR of the numbers of boxes sold.
b. Find the amount of money each member collected.
c. Compute the mean, median, standard deviation and IQR of the amount of money collected by scaling the values
in part a.
Multiplying every number in a data set by k multiplies all measures of _______________ and the_________________
____________________ and _________________ by ________, while the ____________ is multiplied by ___________
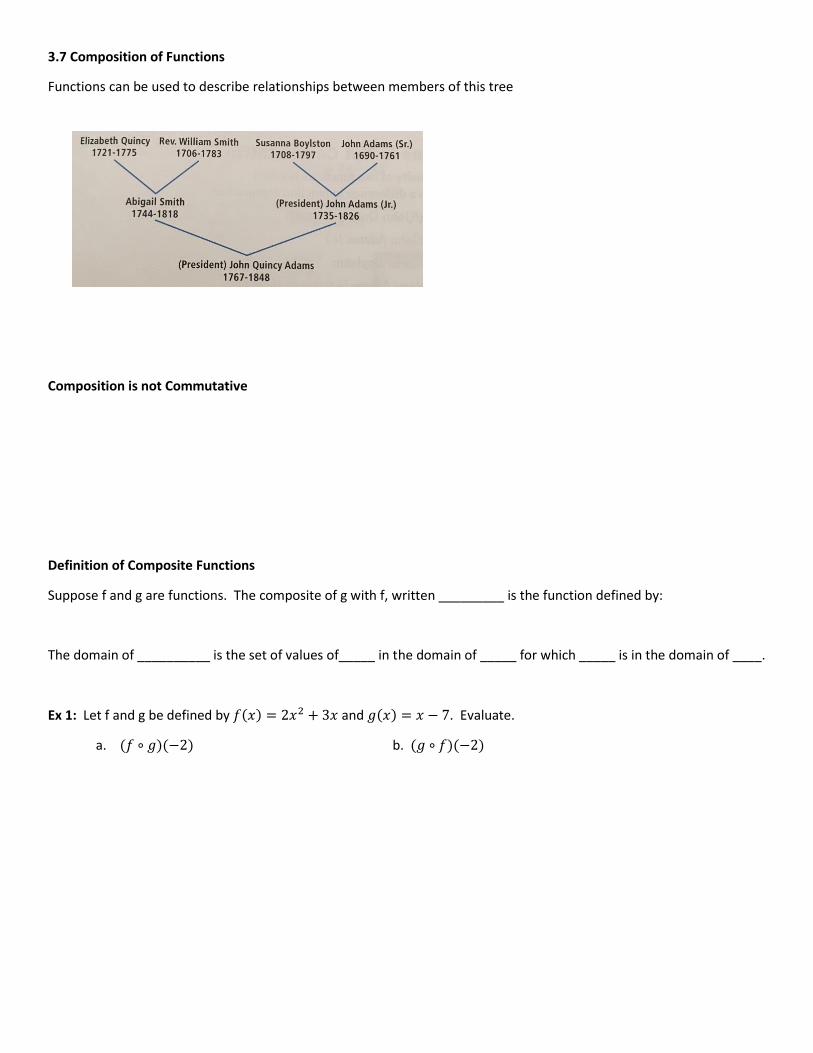
3.7 Composition of Functions
Functions can be used to describe relationships between members of this tree
Composition is not Commutative
Definition of Composite Functions
Suppose f and g are functions. The composite of g with f, written _________ is the function defined by:
The domain of __________ is the set of values of_____ in the domain of _____ for which _____ is in the domain of ____.
Ex 1: Let f and g be defined by 𝑓(𝑥) = 2𝑥2 + 3𝑥 and 𝑔(𝑥) = 𝑥 − 7. Evaluate.
a. (𝑓 ∘ 𝑔)(−2) b. (𝑔 ∘ 𝑓)(−2)

Ex 2: Let 𝑓(𝑥) = 2𝑥2 + 3𝑥 and 𝑔(𝑥) = 𝑥 − 7.
a. Derive a formula for (𝑓 ∘ 𝑔)(𝑥)
b. Derive a formula for (𝑔 ∘ 𝑓)(𝑥)
Ex 3: Let f and g be real functions defined by 𝑓(𝑚) = √𝑚 and 𝑔(𝑚) =2
𝑚−3.
Composition of Transformations
Ex 4: Let 𝑆: (𝑥, 𝑦) → (2𝑥, 𝑦) and let 𝑇: (𝑥, 𝑦) → (𝑥 + 4, 𝑦 − 3)
a. Describe S and T in words
b. Write a formula for the composite (𝑇 ∘ 𝑆)(𝑥, 𝑦) and describe it in words
c. Write a formula for the composite (𝑆 ∘ 𝑇)(𝑥, 𝑦) and describe it in words

3.8 Inverses of Functions
Remember that a function can be considered as a set of _______________________________ in which each first
element is paired with exactly one second element.
o The __________________________________________ is found by switching the coordinates of the pairs
Ex 1: Let f = {(-3, -5), (-2, 0), (-1, 3), (0, 4), (1, 3), (2, 0), (3, -5)}. Describe the inverse of f. Is the inverse a function?
If the original function is described by an __________________ then _____________________________________ in the
equation gives an equation its ___________________.
Ex 2:
a. Give an equation for the inverse of the function described by 𝑦 = −𝑥2 + 4
b. Sketch a graph of 𝑦 = −𝑥2 + 4 and the inverse on the same set of axes
c. Is the inverse a function?

Ex 3:
a. Give an equation for the inverse of the function described by 𝑓(𝑥) =1
𝑥−3+ 4
b. Graph f and its inverse on the same axes
Inverse Functions Theorem
Given any two functions f and g, f and f are inverse functions iff _____________________ for all x in the domain of g,
and _____________________ for all x in the domain of f.
o Identity function –
Ex 4: Use the inverse functions theorem to determine whether f and g are, defined by 𝑓(𝑥) =2𝑥−4
𝑥+1 and 𝑔(𝑥) =
𝑥−1
2𝑥+4
Ex 5: Use the inverse functions theorem to determine whether f and g are, defined by 𝑓(𝑥) = 3𝑥 − 2 and 𝑔(𝑥) =𝑥+2
3

3.9 Z-Scores
Sometimes a person wants to know how his or her score or salary compares to a group as a whole
o One way is to analyze how many ___________________________________ the score or salary is
________________ or ________________ the mean.
Z-Score
Suppose a data set has mean _____ and standard deviation _____. The z-score for a member x of this data set is…
A _________________ z-score tells how many standard deviations the score is __________ the mean. A
_________________ z-score tells how many standard deviations the score is __________ the mean.
Ex 1: Nancy scored 87 on a math quiz on which the mean score was 70 and the standard deviation of the scores was 8.
Find her z-score and tell how far her score was from the mean.
Original data = ______________________ or ___________________
Data resulting from transformations _________________________________
Properties of Z-scores
If a data set has mean ______ and standard deviation ______, the mean of its z-scores (if each score is converted to a z-
score) will be ________ and the standard deviation of its z-scored will be ________
Ex 2: Mark scored 78 a history test on which the mean was 71 and the standard deviation was 10. He scored 68 on a
chemistry test on which the mean was 62 and the standard deviation was 6. Use z-scores to determine on which test he
performed better compared to his classmates.