Embed Size (px)
Citation preview

3 1
Chapter 3
Social Infrastructure Demand A Macro Approach
1. Introduction
In this chapter, we would like to construct an explicit model to estimate and
forecast the Social Infrastructure Demand in Thailand up to 2030 We would apply
both the database of international institutions as well as those from Thai
government s publications The social infrastructure comprises 1 Education schools,
university and laboratory facility , 2 Healthcare medical services facility , 3
Low income housing, and 4 Government service building and facility respectively
The model would be an example of how the task can be attempted explicitly and
would be a lesson learned by other Asian developing countries
In this chapter, we report the macro approach in demand estimation
applying both the panel data analysis as well as model simulation The latter is a
counterfactual model simulation with A Computable General Equilibrium Model
2. Panel Regression Model
ADB 2009 1 has released method of multiple regression model by Fay and
Yepes2 2003 in the infrastructure, estimation using multiple regression model, The
multiple regression model of is based on the least squares method OLS with the
explanatory variable of infrastructure stock of each country year as the explanatory
variable, per capita income, a ratio of agriculture and manufacturing industry to
GDP Its validity is verified by an F test
IJ (i, t) = 𝛼0 + 𝛼1 IJ(I, t − 1) + 𝛼2 y (i, t) + 𝛼3 A(i, t) +
𝛼4 M(i, t) + 𝛼5 D(i) + 𝛼6 D(t) + ξ(i, t)
1 ADB 2009 , Seamless Asia 2 Fay and Yepes Investing in infrastructure what is needed from 2000 to 2010?”,
World Bank Policy Research Working Paper 3102, July 2003
http elibrary worldbank org doi pdf 10 1596 1813 9450 3102

3 2
IJ i,t demand for infrastructure stock of type j th in country i th at time t;
IJ i, t 1 the lagged value of the infrastructure stock,
y i,t income per capita of country i th;
A i,t share of agriculture value added in GDP of country i th;
M i,t the share of manufacturing value added in GDP of country i th,
D i a country fixed effect,
D t a time dummy;
ξ i,t error term
It is worth a trial to add the population density and the ratio of urbanization
proportion of the urban resident population in the total population as an explanatory
variable to the above regression model to replace the country fixed effect D i
Furthermore, if we can collect standard price deflator of construction materials and
equipment it may be feasible to estimate the monetary value of social infrastructure
investment overtime to 2030
In our study, we have elaborated the ADB model above to for further
analysis with a panel regression Our model has a left hand variable as gross fixed
capital formation I (i, t) the need for total investment of the i th economy over the
period of study 1990 2015 for further capital accumulation and growth It is assumed
to be inclusive both of physical and social investment which we are interested The
explanatory variables are real GDP, y (i, t) representing the size of the economy
i th The urbanization of the i th economy, U(i, t) in economic development The
level of industrialization of an economy, M(i, t) shown by value added share of
manufacture in total GDP We may hypothesize also that the trend factor, D(t)
represents the level of exogenous shift in technology over time The stochastic
movement around the trend of the residual component or disturbance termξ(i, t).
The policy variable HDI(t) non parametric indices of human capital
development It is a composite index of human capital components and wellbeing of
economy i th Human Development Index HDI 3 emphasizes human ultimate
capabilities for assessing the development of a country, not economic growth alone
The Human Development Index HDI is a summary measure of average
achievement in critical dimensions of human development a long and healthy life,
being knowledgeable and have a decent standard of living The HDI is, therefore,
scores of a composite index of a geometric mean of three normalized indexes
3 http hdr undp org en content human development index hdi
3 3
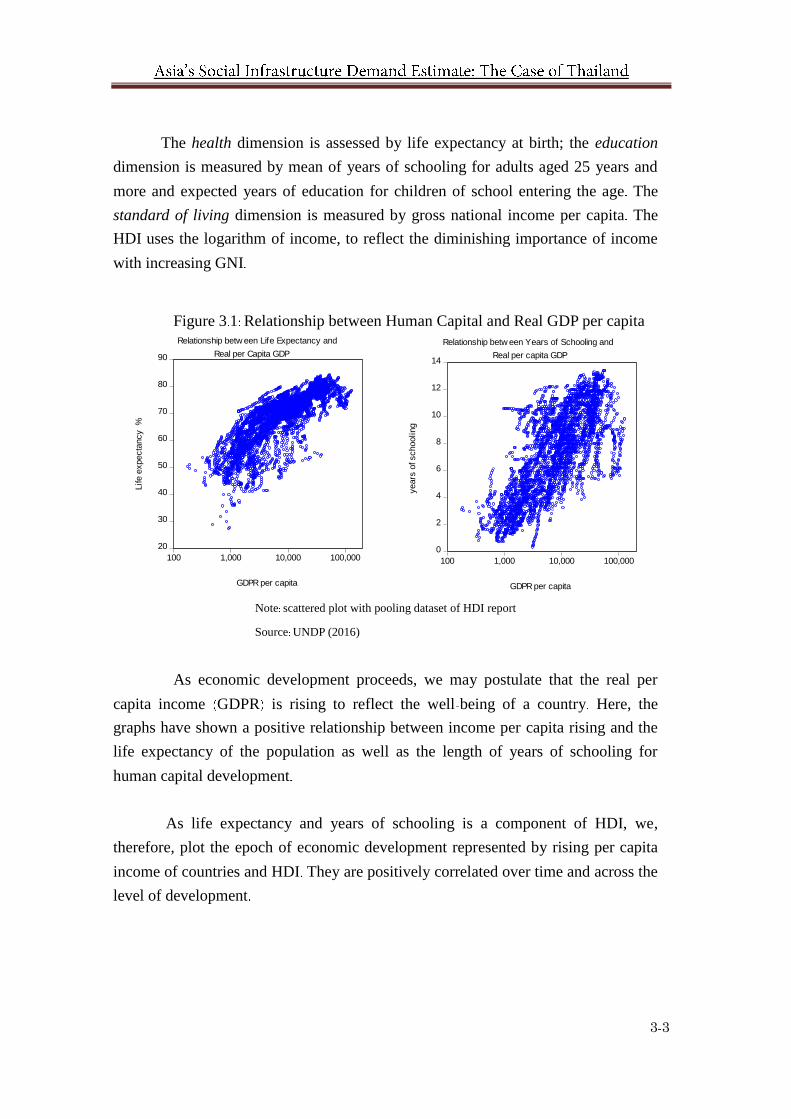
The health dimension is assessed by life expectancy at birth; the education
dimension is measured by mean of years of schooling for adults aged 25 years and
more and expected years of education for children of school entering the age The
standard of living dimension is measured by gross national income per capita The
HDI uses the logarithm of income, to reflect the diminishing importance of income
with increasing GNI
Figure 3 1 Relationship between Human Capital and Real GDP per capita
20
30
40
50
60
70
80
90
100,00010,0001,000100
GDPR per capita
Life e
xpecta
ncy %
Relationship betw een Life Expectancy and
Real per Capita GDP
0
2
4
6
8
10
12
14
100,00010,0001,000100
GDPR per capita
years
of schooling
Relationship betw een Years of Schooling and
Real per capita GDP
Note scattered plot with pooling dataset of HDI report
Source UNDP (2016)
As economic development proceeds, we may postulate that the real per
capita income GDPR is rising to reflect the well being of a country Here, the
graphs have shown a positive relationship between income per capita rising and the
life expectancy of the population as well as the length of years of schooling for
human capital development
As life expectancy and years of schooling is a component of HDI, we,
therefore, plot the epoch of economic development represented by rising per capita
income of countries and HDI They are positively correlated over time and across the
level of development

3 4
Figure 3.2: Schematic Presentation of the Dimension of Human Development
Source UNDP (2016)
Figure 3 3 Relationship between HDI and Real GDP per capita
0.2
0.3
0.4
0.5
0.6
0.7
0.8
0.9
1.0
200,00020,0002,000200
Per capita GDP (in US$, PPP of 2011)
HD
I
Economic Development and Human Development, 1990 2015
Note scattered plot with pooling dataset of HDI report
Source UNDP (2016)
Thus, as any government s policy is to improve country s welfare, they can
measure ex post the score of the HDI index The government has to put her effort,
ex ante in the social investment of human capital such as lengthen the years of
schooling and training in education, improve access to health services to lengthen the
life expectancy with healthy lifespan, and to improve the urban welfare
3 5
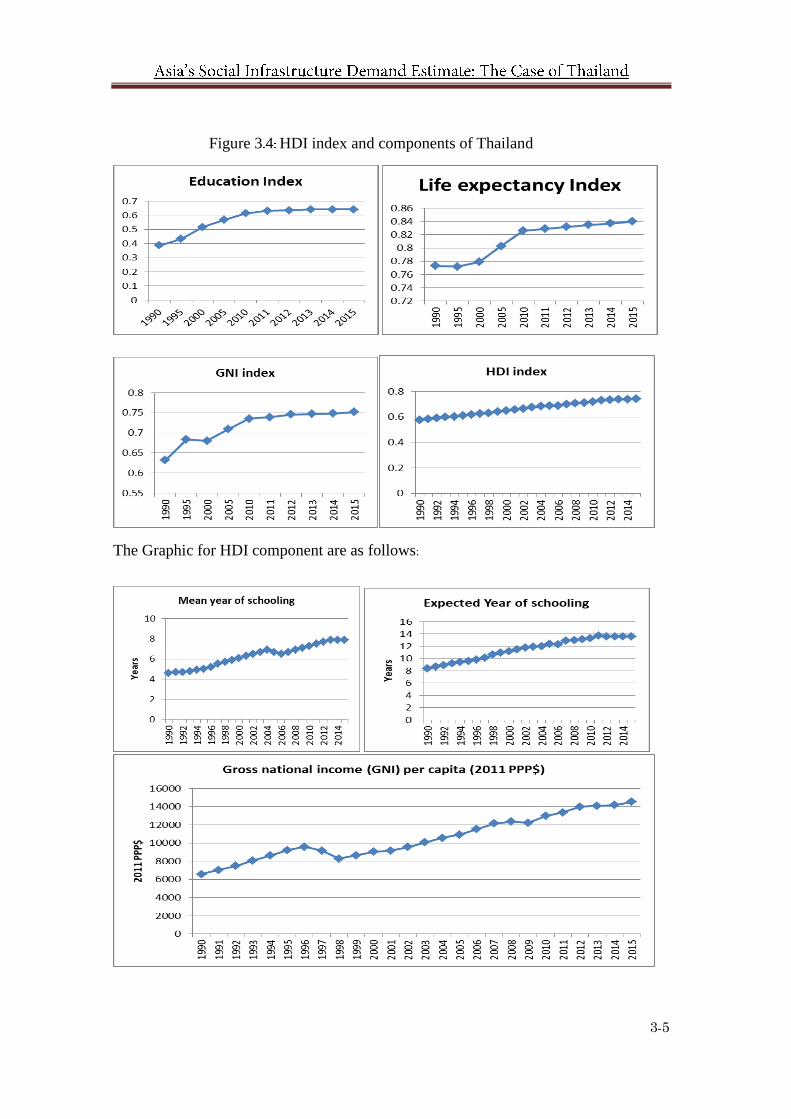
Figure 3 4 HDI index and components of Thailand
The Graphic for HDI component are as follows

3 6
It should be noted also that the relationship between HDI component such as
Mean years of schooling' for Thailand has positive relationship with the rising per
capita income as well
Figure 3 5 Positive Relationship between Mean year of schooling and Real GDP per
capita for Thailand
Definition Education is composite of two variables, mean year of schooling
and expected years of schooling
Education index
(Mean years of schooling
15+
Expected years of schooling
18)
2⁄
Life expectancy index f Life expectancy at birth
Life expectancy at birth (years)−20
85−20
GNI index is hypothesized to be a function of per capita Gross National
Income $PPP
f GNI per capita $PPP

3 7
log(GNI per capita/100)
log(75,000/100)
HDI index is a geometric means of three indices
HDI √Life expectancy index x Education Index x GNI index 3
It is calculated from baseline data of Thailand s health index is 0 84 while
education index is as low as 0 64 respectively in 2015 It
2 1 Econometric Model and Estimation Result
The system of equations may be simultaneously estimated using 3SLS or GMM
Here the data are from UNDP 2016
GFCFR (i, t) = 𝛼0 + 𝛼1 GFCFR(i, t − 1) + 𝛼2 GDPR + 𝛼3 URBANRatio(i,t)
+ 𝛼4 [MVAR(i, t)
GDPR(i, t)]
+ 𝛼5 HDI(i, t) + 𝛼6 TIME(t) + ξ(i, t)
1
HDI(i, t) = 𝛽0 + 𝛽1 𝑌𝑟𝑠(i, t) + 𝛽2 𝐿𝑖𝑓𝑒(i, t) + 𝛽3 𝐺𝐷𝑃𝑅𝑐𝑎𝑝(i, t) +
휀 (2)
[GFCFR
Pop] = 𝛼0 + 𝛼1 [
GDPR
Pop] + 𝛼2 URBANratio + 𝛼3 [
MVAR
Pop] +
𝛼4 HDI + 𝛼6 TIME + ζ
3
GFCFR i,t investment expenditure of both physical infrastructure and
including social investment in terms of gross fixed capital formation
in country i th at time t; t 1990,1995,2000,2010,2011 2015
GDPR i,t real GDP of country i th; in PPP , US$ 2011 constant price
URBAN i,t share of an urban population of country i th; as indices of
urbanization
MVAR i,t the manufacturing value added of country i th; indices of
industrialization
HDI i Human Development Index of country i th as policy target
instrument, with components in the formula assumed to be policy
3 8
instruments
Yrs i years of schooling an index of Human capital investment
Life i Life expectancy at birth, an index of Health in Human capital
investment
GDPRcap real GDP per capita to represent the level of welfare or well being
TIME t a time dummy as a proxy of trend setting
ξ, ζ, 휀 =error terms as the stochastic process
In the model, we assume that human capital can be represented by the
Human Development Index 4 The social infrastructure investment is assumed to rise
with the index over time or vice versa, other things being constant5 Estimation of
the above equation of gross investment including social investment , we have found
that the i th economy has vastly different in sizes, either population, GDP per capita
etc Thus, we may encounter with econometric difficulties like heteroskedsticity and
multi collinearity etc We, therefore, would also test any other forms of a
specification as well Drop economy i th and time subscript t for simplicity
Since HDI is constructed from per capita income as one component, we
may drop GDPR Pop to avoid over identification after trials It may be treated as an
instrumental variable instead The system of equations may be estimated separately
as well It is assumed that there is no feedback of gross investment and HDI
component in our model They are policy instruments We assume parametric
component of the HDI as follows
Human capital investment in terms of mean year of schooling and live
expectancy years has increased over the forecasting horizon to 2030 The wellbeing
of Thais is expected to increase in terms of GNI to 20,000 USD, 2011 PPP in 2030
4 http hdr undp org en data 5 The gross domestic product or income may be endogenously determined the HDI while ODA or government
investment nominal value on social infrastructure is exogenous

3 9
Table 3 1 Hypothetical Improvement of HD s Component Target 2016 2030
HDI component
expected year
schooling years
mean year
schooling
years
GNI
2011PPP$
Life
expectancy
years
2010 13 30 7 30 12,976 73 70
2011 13 70 7 50 13,354 73 90
2012 13 60 7 70 13,993 74 10
2013 13 60 7 90 14,095 74 30
2014 13 60 7 90 14,169 74 40
2015 13 60 7 90 14,519 74 60
2016 13 66 8 03 14,851 74 78
2017 13 65 8 14 15,171 74 97
2018 13 67 8 23 15,419 75 14
2019 13 68 8 29 15,699 75 32
2020 13 83 8 50 16,048 75 73
2021 13 98 8 72 16,405 76 15
2022 14 14 8 93 16,771 76 57
2023 14 30 9 16 17,144 76 99
2024 14 46 9 39 17,525 77 41
2025 14 62 9 62 17,915 77 84
2026 14 78 9 86 18,314 78 27
2027 14 95 10 11 18,722 78 70
2028 15 11 10 36 19,139 79 13
2029 15 28 10 62 19,565 79 56
2030 15 45 10 89 20,000 80 00
The parametric calculation of HDI is by inserting the component into the
formula The assumed level of HDI sim is clearly above the business as usual
level of HDI bau

3 10
Table 3 2 Hypothetical HDI, Thailand
2010 2011 2012 2013 2014
HDI INDEX 0 72 0 73 0 73 0 74 0 74
HDI INDEX Scenario 1 0 72 0 73 0 73 0 74 0 74
2015 2016 2017 2018 2019
HDI INDEX 0 74 0 74 0 75 0 75 0 75
HDI INDEX Scenario 1 0 74 0 74 0 75 0 75 0 75
2020 2021 2022 2023 2024
HDI INDEX 0 76 0 76 0 76 0 77 0 77
HDI INDEX Scenario 1 0 76 0 77 0 77 0 78 0 79
2025 2026 2027 2028 2029
HDI INDEX 0 77 0 77 0 78 0 78 0 78
HDI INDEX Scenario 1 0 80 0 80 0 81 0 82 0 83
2030
HDI INDEX 0 79
HDI INDEX Scenario 1 0 84
Figure 3 4 Hypothetical Improvement of HDI in Thailand

3 11
Table 3 3 Hypothetical GDP per capita Thailand as Proxy of Economic
Development Level
After, we obtain the coefficients from multi countries experiences; we use
this information in the model forecasting The policy maker is assumed to set a target
level of Human capital development i e , schooling achievement years, life
expectancy, and well being in terms of per capita income level overtime 2015 2030
The NESDB s national account statistic on Value of Total Construction
classified by type of assets 1993 2016 together with data series of the private and
public construction investment, the capital stock at current replacement cost
million baht , the annual depreciation at current replacement cost are used in our
estimation We calibrate the construction investment with the total gross fixed
investment needed for scenarios of the planned level of the HDI mentioned in the
equation above over planning horizon 2016 2030 Given the share of construction
2010 2011 2012 2013 2014
GDP per capita 2011 PPP $billions 13,584 0 13,654 0 14,585 0 14,915 0 14,976 0
GDP per capita 2011 PPP $billions scenario 1 13,584 0 13,654 0 14,585 0 14,915 0 14,976 0
2015 2016 2017 2018 2019
GDP per capita 2011 PPP $billions 15,345 0 14,851 0 15,171 0 15,419 0 15,699 0
GDP per capita 2011 PPP $billions scenario 1 15,345 0 14,851 0 15,171 0 15,419 0 15,699 0
2020 2021 2022 2023 2024
GDP per capita 2011 PPP $billions 16,024 0 16,343 0 16,660 0 16,974 0 17,304 0
GDP per capita 2011 PPP $billions scenario 1 16,048 0 16,405 0 16,771 0 17,144 0 17,525 0
2025 2026 2027 2028 2029
GDP per capita 2011 PPP $billions 17,644 0 17,987 0 18,335 0 18,690 0 19,053 0
GDP per capita 2011 PPP $billions scenario 1 17,915 0 18,314 0 18,722 0 19,139 0 19,565 0
2030
GDP per capita 2011 PPP $billions 19,424 0
GDP per capita 2011 PPP $billions scenario 1 20,000 0

3 12
types in the series, we solve for the investment in construction of buildings and
related facilities by type of social infrastructure The postulation of the relationship
between total gross investment from model GFCFR is allocated to be and social
investment by type j th respectively
GFCFR_social j δ j GFCFR 4
δ j distribution of social infrastructure demand by type j th, in terms of construction
investment by types of assets Here, schooling achievement years j 1 , life expectancy j 2 , and
well being in terms of per capita income j 3 level overtime respectively
Figure 3 6 Pattern of Growth of Manufacture and Urbanization
0
400
800
1,200
1,600
2,000
200,00020,0002,000200
Per capita GDP (in US$, PPP of 2011)
MA
NU
_P
ER
_C
AP
(U
S$
pe
r p
ers
on
, PP
P, 2
01
1)
Economic Development and Manufacturing GDP, 1990-2015
0
20
40
60
80
100
10.001.000.100.01
Investment ( log of GFCFR_PER_CAP)
urb
an
po
pu
latio
n ra
tio
(%
)
Urbanization and Investment, 1990 2015
Note: Applying multicounty data from UNDP (2016)
Firstly, we have estimated the determination of the GFCF per capita as a
function of HDI constant 2011price, $billion We estimate the Panel Data Model
equation 3 mentioned above, applying data from UNDP 2016
Eq1 gfcfr_per_cap F gdpr_per_cap, hdi, year
LOG GFCFR_PER_CAP 22 9220556556 0 037666 0 98583802142
LOG GDPR_PER_CAP 2 39327973596 LOG HDI 0 0150574835249
YEAR AR 1 0 258397813744
See Appendix for statistic results

3 13
Eq2 gfcfr F gfcfr_per_cap, pop
GFCFR GFCFR_PER_CAP POP
Since the GFCF is nominated in Local Currency Unit constant 2011 price,
billion baht , we, therefore, have to match the GFCF from UNDP database to
national account of Thailand in terms of construction investment
Eq3 gfcfr_lcu F gfcfr, p_lcu
gfcfr_lcu p_lcu GFCFR
In addition, we estimate the GDP deflator in local currency unit to be
consistent with the data of UNDP
Eq4 p_lcu F gp_lcu, p_lcu
p_lcu p_lcu 1 1 gp_lcu
Now, we have to transform the gross fixed capital formation GFCF from the
model into the GFCF only for construction investment by public and private sector
The series is from National Account Statistic, these are the construction of
1) Building is residential, industrial, commercial, service & transport building of
which social infrastructure investment are school, hospital building
2) other buildings are commercial, industrial, service & transport, dam, road and
bridge, and temple respectively
3) other non building are port, parking lots, advertisement structure, swimming pool,
sport structure
The projection of GFCF from the model is translated into the investment in
construction by types of asset in current price in billion baht , assuming the share of
Social Investment in terms of building in schooling, health and residents or dwelling
inclusive of the housing The non construction investment is identified from total
GFCF projection after construction investment is projected In our study, we would
like to assume that part of public investment' of non construction can be reallocated to

3 14
the social infrastructure investment in the mode of types of equipment and laboratory
for schools and hospitals The rest of public investment can be a subsidy' for a
low income housing project for the rental resident by NHA National Housing
Authority in various forms e g , public private partnership, or government housing
project for the low rank civil servants, etc
Eq5 gfcf_lcu F gfcfr_lcu, p_gfcf
gfcf_lcu p_gfcf gfcfr_lcu
gfcf_construction f gfcf_lcu, con
gfcf_non_construction gfcf_lcu gfcf_construction
Here the gfcf_lcu is a value of total gfcf in a current price of a local
currency The Construction classified by type of assets in the current price, billion
baht , from national account statistic, Thailand It can be allocated into
School building
Eq6 gfcf_school_lcu F a_school, gfcf_lcu
gfcf_school_lcu a_school gfcf_construction
Health building
Eq7 gfcf_health_lcu F a_health, gfcf_construction
gfcf_health_lcu a_health gfcf_construction
Residential building
Eq8 gfcf_resident_lcu F a_resident, gfcf_lcu
gfcf_resident_lcu a_resident gfcf_construction
Other building
Eq9 gfcf_otherbuild_lcu F a_otherbuild, gfcf_lcu
gfcf_otherbuild_lcu a_otherbuild gfcf_construction

3 15
a_health;
a_school;
a_resident
Share of building investment in construction by type
a_otherbuild Share of other building 's investment in construction
gdpr_per_cap GDP per capita 2011 PPP $billions ,
gfcf_lcu Gross fixed capital formation in construction from National account
statistic, NESDB billions baht
gfcf_health_lcu Healthcare's social investment billions baht
gfcf_otherbuild_lcu Other building 's social investment
gfcf_resident_lcu Residential bldg as social investment billions baht
gfcf_school_lcu;
gfcf_resident_lcu;
gfcf_health_lcu
GFCF constructin by type as social investment by type billions baht
gfcfr Gross fixed capital formation 2011 PPP $ billions , UNDP 2016
from model projection
gfcfr_lcu Gross fixed capital formation in local currency constant
2011,billions baht
gfcf_lcu Gross fixed capital formation in local currency current billions baht
gfcf_construction;
gfcf_non_construction
Gross fixed capital formation in local currency current billions baht
for construction and non construction
gfcfr_per_cap Gross fixed capital formation per capita 2011 PPP $ billions , UNDP
2016
gp_lcu percent Growth of GFCF price deflator
hdi HDI index, UNDP 2016
p_gfcf Price converter between current and constant price
p_lcu Price converter between local currency unit and ppp $
pop population
year year
3 16
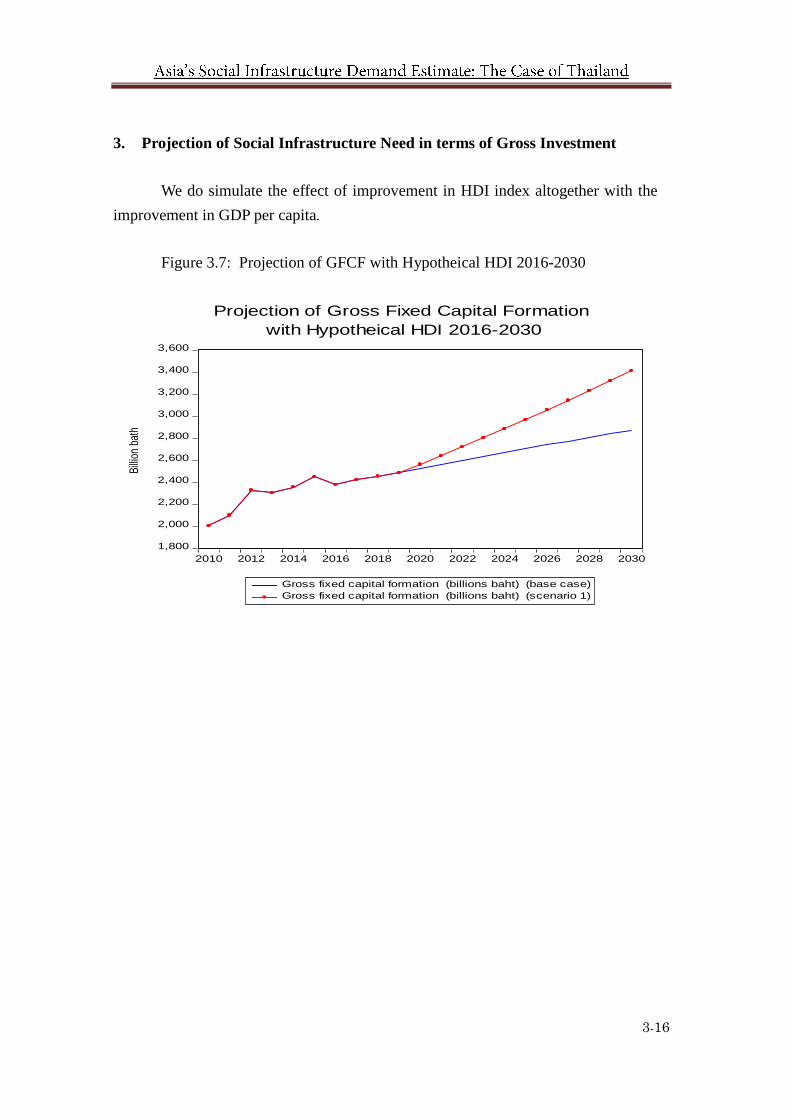
3. Projection of Social Infrastructure Need in terms of Gross Investment
We do simulate the effect of improvement in HDI index altogether with the
improvement in GDP per capita
Figure 3.7: Projection of GFCF with Hypotheical HDI 2016-2030
1,800
2,000
2,200
2,400
2,600
2,800
3,000
3,200
3,400
3,600
2010 2012 2014 2016 2018 2020 2022 2024 2026 2028 2030
Gross fixed capital formation (billions baht) (base case)
Gross fixed capital formation (billions baht) (scenario 1)
Bill
ion
bath
Projection of Gross Fixed Capital Formation
with Hypotheical HDI 2016-2030

3 17
Table 3 4 Gross Fixed Capital Formation billion baht
Gross Fixed Capital Formation Billion baht 2010 2011 2012 2013 2014
Gross fixed capital formation billions baht base case 2,004 0 2,101 6 2,327 0 2,303 4 2,356 8
Gross fixed capital formation billions baht scenario 1 2,004 0 2,101 6 2,327 0 2,303 4 2,356 8
GFCF change from base case Billion baht 0 0 0 0 0 0 0 0 0 0
2015 2016 2017 2018 2019
Gross fixed capital formation billions baht base case 2,449 7 2,379 9 2,425 4 2,454 6 2,485 8
Gross fixed capital formation billions baht scenario 1 2,449 7 2,379 9 2,425 4 2,454 6 2,485 8
GFCF change from base case Billion baht 0 0 0 0 0 0 0 0 0 0
2020 2021 2022 2023 2024
Gross fixed capital formation billions baht base case 2,525 6 2,564 8 2,600 8 2,634 7 2,669 9
Gross fixed capital formation billions baht scenario 1 2,562 2 2,640 6 2,720 8 2,802 2 2,885 2
GFCF change from base case Billion baht 36 6 75 8 119 9 167 5 215 3
2025 2026 2027 2028 2029
Gross fixed capital formation billions baht base case 2,705 7 2,740 6 2,774 5 2,807 8 2,840 8
Gross fixed capital formation billions baht scenario 1 2,969 7 3,055 8 3,143 2 3,232 0 3,322 2
GFCF change from base case Billion baht 264 0 315 1 368 7 424 2 481 3
2030
Gross fixed capital formation billions of baht base case 2,873 4
Gross fixed capital formation billions baht scenario 1 3,413 5
GFCF change from base case Billion baht 540 1

3 18
Table 3 5 Gross Fixed Capital Formation in Construction and Non Construction, measured in current prices 2010 2019 Billion Baht
item Description 2010 2011 2012 2013 2014 2015 2016 2017 2018 2019
1 Gross fixed capital formation
billions of baht base case 2003 971 2101 552 2326 978 2303 441 2356 783 2449 726 2379 856 2425 434 2454 649 2485 781
2 Gross fixed capital formation
billions of baht scenario 1 2003 971 2101 552 2326 978 2303 441 2356 783 2449 726 2379 856 2425 434 2454 649 2485 781
2.1 Gross fixed capital formation
Construction 44 75 43 61 44 54 45 68 44 06 47 31 51 45 51 45 51 45 51 45
2.2 Gross fixed capital formation
Non construction 55 25 56 39 55 46 54 32 55 94 52 69 48 55 48 55 48 55 48 55
3 Gross fixed capital formation
Construction
3.1 RESIDENTIAL 29 87 32 21 31 27 31 29 31 65 27 14 25 32 25 32 25 32 25 32
3.2 SCHOOL 1 97 1 91 1 95 1 87 1 56 3 16 6 2 75 2 75 2 75 2 75
3.3 HOSPITAL 0 75 0 41 0 97 1 18 1 04 1 29 1 52 1 52 1 52 1 52
3.4 OTHER building 1 85 2 47 3 21 3 15 3 49 3 95 2 43 2 43 2 43 2 43
3.5 Other Non Building 65 56 63 00 62 59 62 51 62 26 64 46 67 98 67 98 67 98 67 98
4 Gross fixed capital formation
Construction base case 896 772 916 455 1036 34 1052 166 1038 466 1158 916 1224 328 1,247 78 1,262 81 1,278 82
6 It is noticed that share in school category of construction as part of the gross fixed capital formation has increased from 1 56 in 2015 to 3 16 in 2015 and later decreased to
2 75 in 2016 to its long term trend It is reported in the National Accounts Statistics, NESDB Our model has applied a normal trend from 2016 for our analysis

3 19
item Description 2010 2011 2012 2013 2014 2015 2016 2017 2018 2019
4.1 Social Infrastructure RESIDENTIAL
base case
267 8
295 2
324 1
329 3
328 7
314 5
310 0
316 0
319 8
323 8
4.2 Social Infrastructure SCHOOL
base case
17 7
17 5
20 2
19 7
16 2
36 6
33 7
34 4
34 8
35 2
4.3 Social Infrastructure HOSPITAL
base case
6 7
3 8
10 1
12 4
10 8
14 9
18 6
19 0
19 2
19 5
4.4 OTHER building base case
16 6
22 6
33 3
33 1
36 2
45 8
29 7
30 3
30 6
31 0
4.5 Other Non_Buildings base case
587 9
577 4
648 7
657 7
646 5
747 0
832 3
848 2
858 4
869 3
5 Gross fixed capital formation
Construction scenario1 896 772 916 455 1036 34 1052 166 1038 466 1158 916 1224 328 1,247 78 1,262 81 1,278 82
5.1 Social Infrastructure RESIDENTIAL
scenario 1
267 8
295 2
324 1
329 3
328 7
314 5
310 0
316 0
319 8
323 8
5.2 Social Infrastructure SCHOOL
scenario 1
17 7
17 5
20 2
19 7
16 2
36 6
33 7
34 4
34 8
35 2
5.3 Social Infrastructure HOSPITAL
scenario 1
6 7
3 8
10 1
12 4
10 8
14 9
18 6
19 0
19 2
19 5
5.4 OTHER building scenario 1
16 6
22 6
33 3
33 1
36 2
45 8
29 7
30 3
30 6
31 0
5.5 Other Non Building scenario 1

3 20
item Description 2010 2011 2012 2013 2014 2015 2016 2017 2018 2019
587 9 577 4 648 7 657 7 646 5 747 0 832 3 848 2 858 4 869 3
6 Gross fixed capital formation
Non construction
6.1 Private 80 80 80 80 80 80 80 80 80 80
6.2 Public 20 20 20 20 20 20 20 20 20 20
6.2.1 Education 40 40 40 40 40 40 40 40 40 40
6.2.2 Health 48 48 48 48 48 48 48 48 48 48
6.2.3 Residential 2 2 2 2 2 2 2 2 2 2
7 Social Infrastructure
Investment Need ,
1,107 20
1,185 10
1,290 64
1,251 28
1,318 32
1,290 81
1,155 53
1,177 66
1,191 84
1,206 96
Non construction base case
7.1 Public
221 44
237 02
258 13
250 26
263 66
258 16
231 11
235 53
238 37
241 39
7.1.1 Education
88 58
94 81
103 25
100 10
105 47
103 26
92 44
94 21
95 35
96 56
7.1.2 Health
106 29
113 77
123 90
120 12
126 56
123 92
110 93
113 06
114 42
115 87
7.1.3 Residential
4 43
4 74
5 16
5 01
5 27
5 16
4 62
4 71
4 77
4 83
Source Model simulation in this study; see system model and applying national accounts of Thailand

3 21
Table 3 6 Social Infrastructure Investment Need 2020 2030, measured in current price Billion Baht
Item Description 2020 2021 2022 2023 2024 2025 2026 2027 2028 2029 2030
1
Gross fixed capital
formation billions of baht
base case
2525 593 2564 822 2600 817 2634 717 2669 888 2705 744 2740 647 2774 497 2807 834 2840 823 2873 385
2
Gross fixed capital
formation billions of baht
scenario 1
2562 221 2640 628 2720 754 2802 241 2885 197 2969 723 3055 753 3143 219 3232 045 3322 151 3413 456
2.1 Gross fixed capital formation
Construction
51 45 51 45 51 45 51 45 51 45 51 45 51 45 51 45 51 45 51 45 51 45
2.2 Gross fixed capital formation
Non construction
48 55 48 55 48 55 48 55 48 55 48 55 48 55 48 55 48 55 48 55 48 55
3 Gross fixed capital
formation Construction
3.1 RESIDENTIAL 25 32 25 32 25 32 25 32 25 32 25 32 25 32 25 32 25 32 25 32 25 32
3.2 SCHOOL 2 75 2 75 2 75 2 75 2 75 2 75 2 75 2 75 2 75 2 75 2 75
3.3 HOSPITAL 1 52 1 52 1 52 1 52 1 52 1 52 1 52 1 52 1 52 1 52 1 52
3.4 OTHER building 2 43 2 43 2 43 2 43 2 43 2 43 2 43 2 43 2 43 2 43 2 43
3.5 Other Non Building 67 98 67 98 67 98 67 98 67 98 67 98 67 98 67 98 67 98 67 98 67 98
4 Gross fixed capital 1,299 30 1,319 48 1,338 00 1,355 44 1,373 54 1,391 98 1,409 94 1,427 35 1,444 50 1,461 47 1,478 23

3 22
Item Description 2020 2021 2022 2023 2024 2025 2026 2027 2028 2029 2030
formation Construction
base case
4.1 Social Infrastructure
RESIDENTIAL base case
329 0 334 1 338 8 343 2 347 8 352 5 357 0 361 4 365 8 370 1 374 3
4.2 Social Infrastructure
SCHOOL base case
35 8 36 3 36 8 37 3 37 8 38 3 38 8 39 3 39 8 40 2 40 7
4.3 Social Infrastructure
HOSPITAL base case
19 8 20 1 20 4 20 6 20 9 21 2 21 5 21 7 22 0 22 2 22 5
4.4 OTHER building
base case
31 5 32 0 32 5 32 9 33 3 33 8 34 2 34 6 35 0 35 4 35 9
4.5 Other Non_Buildings
base case
883 2 896 9 909 5 921 4 933 7 946 2 958 4 970 3 981 9 993 5 1,004 9
5
Gross fixed capital
formation Construction
scenario1
1,318 15 1,358 48 1,399 70 1,441 63 1,484 30 1,527 79 1,572 05 1,617 04 1,662 74 1,709 10 1,756 07
5.1 Social Infrastructure
RESIDENTIAL scenario 1
333 8 344 0 354 4 365 1 375 9 386 9 398 1 409 5 421 0 432 8 444 7
5.2 Social Infrastructure
SCHOOL scenario 1
36 3 37 4 38 5 39 7 40 9 42 1 43 3 44 5 45 8 47 1 48 4
5.3 Social Infrastructure
HOSPITAL scenario 1
20 1 20 7 21 3 21 9 22 6 23 3 23 9 24 6 25 3 26 0 26 7

3 23
Item Description 2020 2021 2022 2023 2024 2025 2026 2027 2028 2029 2030
5.4 OTHER building scenario 1 32 0 32 9 33 9 35 0 36 0 37 1 38 1 39 2 40 3 41 5 42 6
5.5 Other Non Building
scenario 1
896 0 923 5 951 5 980 0 1,009 0 1,038 5 1,068 6 1,099 2 1,130 3 1,161 8 1,193 7
6
Change in Gross fixed
capital formation
Construction
18 84 39 00 61 70 86 18 110 77 135 81 162 11 189 69 218 24 247 62 277 84
6.1 Social Infrastructure
RESIDENTIAL Change
4 77 9 88 15 62 21 82 28 05 34 39 41 05 48 03 55 26 62 70 70 36
6.2 Social Infrastructure
SCHOOL Change
0 52 1 07 1 70 2 37 3 05 3 74 4 46 5 22 6 01 6 82 7 65
6.3 Social Infrastructure
HOSPITAL Change
0 29 0 59 0 94 1 31 1 69 2 07 2 47 2 89 3 32 3 77 4 23
6.4 OTHER building Change 0 46 0 95 1 50 2 09 2 69 3 29 3 93 4 60 5 29 6 01 6 74
6.5 Other Non Building
Change
12 81 26 51 41 94 58 58 75 30 92 32 110 20 128 95 148 35 168 33 188 87
7
Gross fixed capital
formation
Non construction
7.1 Private 80 80 80 80 80 80 80 80 80 80 80
7.2 Public 20 20 20 20 20 20 20 20 20 20 20
7.2.1 Education 40 40 40 40 40 40 40 40 40 40 40
3 24
Item Description 2020 2021 2022 2023 2024 2025 2026 2027 2028 2029 2030
7.2.2 Health 48 48 48 48 48 48 48 48 48 48 48
7.2.3 Residential 2 2 2 2 2 2 2 2 2 2 2
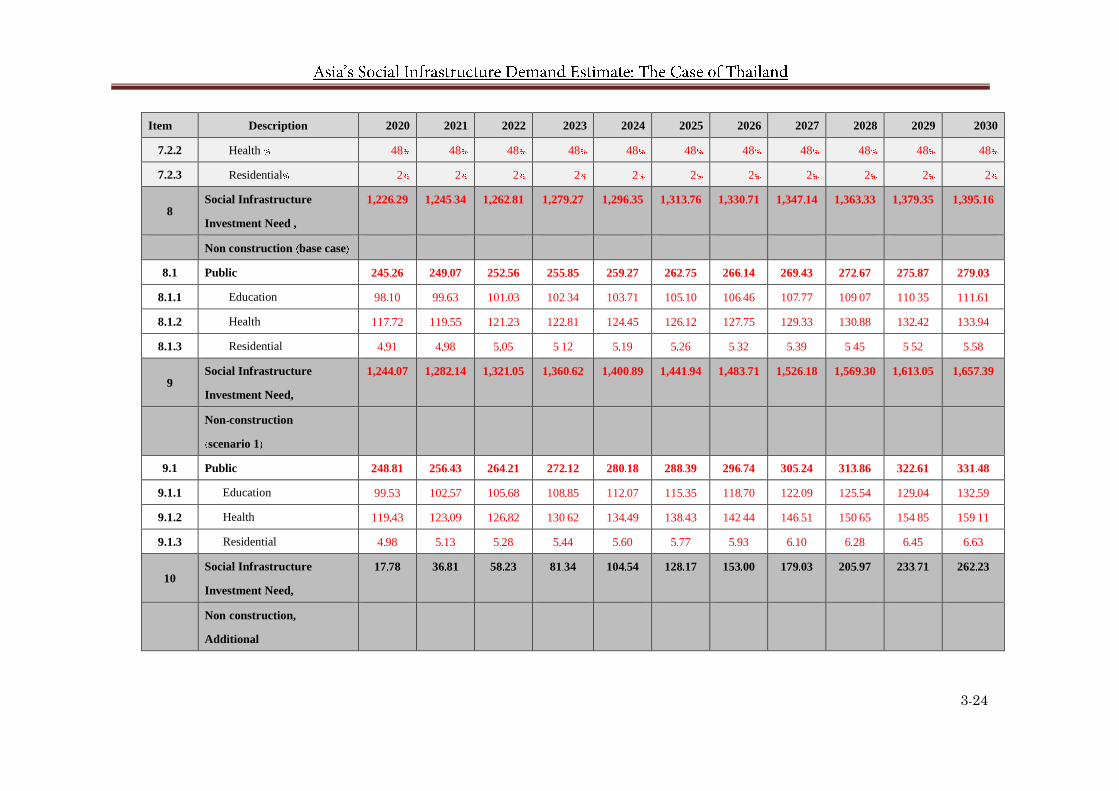
8 Social Infrastructure
Investment Need ,
1,226 29 1,245 34 1,262 81 1,279 27 1,296 35 1,313 76 1,330 71 1,347 14 1,363 33 1,379 35 1,395 16
Non construction base case
8.1 Public 245 26 249 07 252 56 255 85 259 27 262 75 266 14 269 43 272 67 275 87 279 03
8.1.1 Education 98 10 99 63 101 03 102 34 103 71 105 10 106 46 107 77 109 07 110 35 111 61
8.1.2 Health 117 72 119 55 121 23 122 81 124 45 126 12 127 75 129 33 130 88 132 42 133 94
8.1.3 Residential 4 91 4 98 5 05 5 12 5 19 5 26 5 32 5 39 5 45 5 52 5 58
9 Social Infrastructure
Investment Need,
1,244 07 1,282 14 1,321 05 1,360 62 1,400 89 1,441 94 1,483 71 1,526 18 1,569 30 1,613 05 1,657 39
Non construction
scenario 1
9.1 Public 248 81 256 43 264 21 272 12 280 18 288 39 296 74 305 24 313 86 322 61 331 48
9.1.1 Education 99 53 102 57 105 68 108 85 112 07 115 35 118 70 122 09 125 54 129 04 132 59
9.1.2 Health 119 43 123 09 126 82 130 62 134 49 138 43 142 44 146 51 150 65 154 85 159 11
9.1.3 Residential 4 98 5 13 5 28 5 44 5 60 5 77 5 93 6 10 6 28 6 45 6 63
10 Social Infrastructure
Investment Need,
17 78 36 81 58 23 81 34 104 54 128 17 153 00 179 03 205 97 233 71 262 23
Non construction,
Additional

3 25
Item Description 2020 2021 2022 2023 2024 2025 2026 2027 2028 2029 2030
10.1 Public 3 56 7 36 11 65 16 27 20 91 25 63 30 60 35 81 41 19 46 74 52 45
10.1.1 Education 1 42 2 94 4 66 6 51 8 36 10 25 12 24 14 32 16 48 18 70 20 98
10.1.2 Health 1 71 3 53 5 59 7 81 10 04 12 30 14 69 17 19 19 77 22 44 25 17
10.1.3 Residential 0 07 0 15 0 23 0 33 0 42 0 51 0 61 0 72 0 82 0 93 1 05
Source Model simulation in this study; see system model and applying national accounts of Thailand
3 26
It should be noted that the demand for social infrastructure projected from a
hypothetical target of HDI component would be oriented to the physical assets i e ,
building proper The investment in learning facilities, laboratory equipment,
computers and software in the education system as well as hospital types of
equipment with high technology and costly would be considered to be re allocated
from public investment' in the non construction However, the social investment in
hospital facilities can be done explicitly in the projection The availability of data has
limited such possibility
4. Hypothetical Macroeconomic Impact of the Investment in Social
Infrastructure
In order to evaluate the impact of hypothetical investment in human capital
education and health as well as the wellbeing of the population via low income
housing, have applied an economic model to assess the impact
Model simulation is based on A Computable General Equilibrium Model by
N Puttanapong, K Limskul and T Bowonthumrongchai 2017 7 s model In brief, the
model consists of 5 parts, 3 Players 9 Production sectors, domestic agents
Household and Government and Foreign agent Rest of the world and 2 markets
good and services markets and primary factor markets and 4 type of labors, Thai
nationals and foreign migrants Skilled unskilled labor' respectively We also have 7
households with 5 income classes The model has applied database from Social
Account Matrix SAM based on the official Input Output table of 2010 published by
NESDB with a brief description as follows
The household is disaggregated into the household by income type, labor by
skilled and nationality according to data combination from the Social economic
survey 2009, Labor force survey 2010 and national household census 2010
respectively
The model is a system of equations representing equilibrium in the product
market, labor market through price and quantity adjustment For sake of simplicity,
we do not show the whole system of equations At macro economic equilibrium, the
aggregate demand and supply are simultaneously reached
7 N Puttanapong, K Limskul and T Bowonthumrongchai 2017 , A Study on Macroeconomic Impacts of
Immigration Using a SAM Based CGE model, summited to OECD 2017 , How Immigrant Contributed to
Thailand s Economy
https www oecd org migration how immigrants contribute to Thailand s economy 9789264287747 en htm
3 27
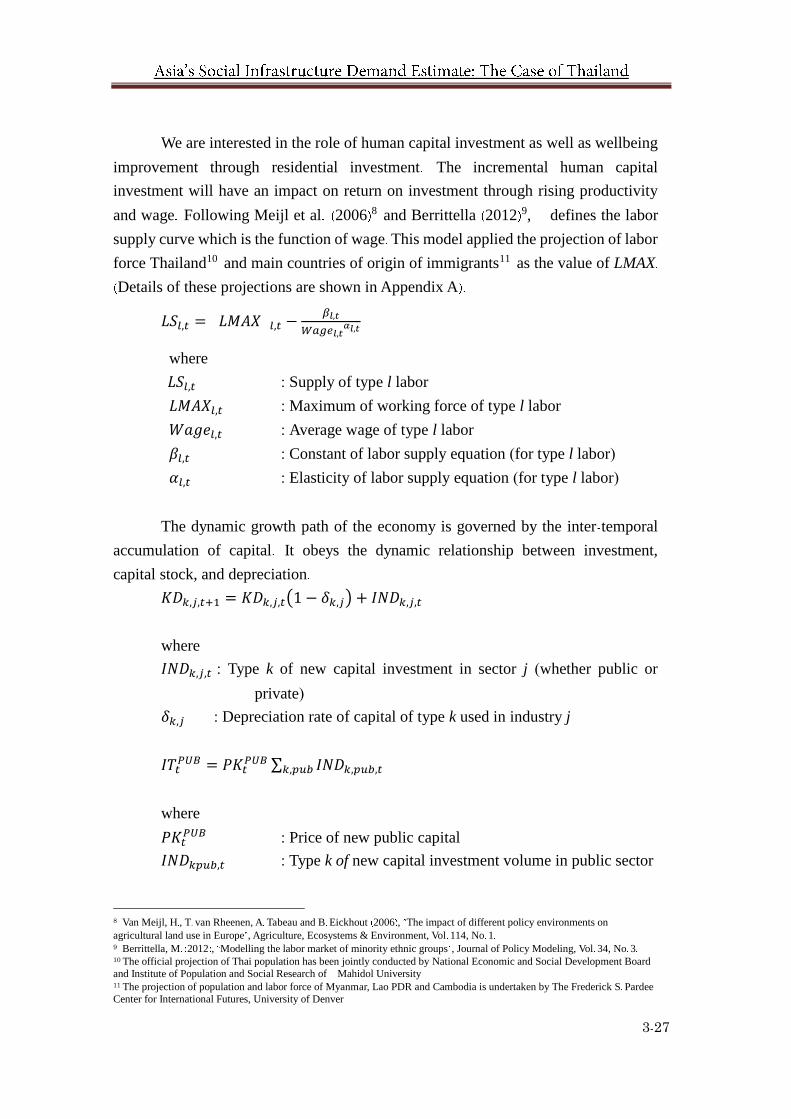
We are interested in the role of human capital investment as well as wellbeing
improvement through residential investment The incremental human capital
investment will have an impact on return on investment through rising productivity
and wage Following Meijl et al 2006 8 and Berrittella 2012 9, defines the labor
supply curve which is the function of wage This model applied the projection of labor
force Thailand10 and main countries of origin of immigrants11 as the value of LMAX
Details of these projections are shown in Appendix A
𝐿𝑆𝑙,𝑡 = 𝐿𝑀𝐴𝑋 𝑙,𝑡 −𝛽𝑙,𝑡
𝑊𝑎𝑔𝑒𝑙,𝑡𝛼𝑙,𝑡
where
𝐿𝑆𝑙,𝑡 : Supply of type l labor
𝐿𝑀𝐴𝑋𝑙,𝑡 : Maximum of working force of type l labor
𝑊𝑎𝑔𝑒𝑙,𝑡 : Average wage of type l labor
𝛽𝑙,𝑡 : Constant of labor supply equation (for type l labor)
𝛼𝑙,𝑡 : Elasticity of labor supply equation (for type l labor)
The dynamic growth path of the economy is governed by the inter temporal
accumulation of capital It obeys the dynamic relationship between investment,
capital stock, and depreciation
𝐾𝐷𝑘,𝑗,𝑡+1 = 𝐾𝐷𝑘,𝑗,𝑡(1 − 𝛿𝑘,𝑗) + 𝐼𝑁𝐷𝑘,𝑗,𝑡
where
𝐼𝑁𝐷𝑘,𝑗,𝑡 : Type k of new capital investment in sector j (whether public or
private)
𝛿𝑘,𝑗 : Depreciation rate of capital of type k used in industry j
𝐼𝑇𝑡𝑃𝑈𝐵 = 𝑃𝐾𝑡
𝑃𝑈𝐵 ∑ 𝐼𝑁𝐷𝑘,𝑝𝑢𝑏,𝑡𝑘,𝑝𝑢𝑏
where
𝑃𝐾𝑡𝑃𝑈𝐵 : Price of new public capital
𝐼𝑁𝐷𝑘𝑝𝑢𝑏,𝑡 : Type k of new capital investment volume in public sector
8 Van Meijl, H , T van Rheenen, A Tabeau and B Eickhout 2006 , The impact of different policy environments on
agricultural land use in Europe , Agriculture, Ecosystems & Environment, Vol 114, No 1 9 Berrittella, M 2012 , Modelling the labor market of minority ethnic groups , Journal of Policy Modeling, Vol 34, No 3 10 The official projection of Thai population has been jointly conducted by National Economic and Social Development Board
and Institute of Population and Social Research of Mahidol University 11 The projection of population and labor force of Myanmar, Lao PDR and Cambodia is undertaken by The Frederick S Pardee
Center for International Futures, University of Denver
3 28
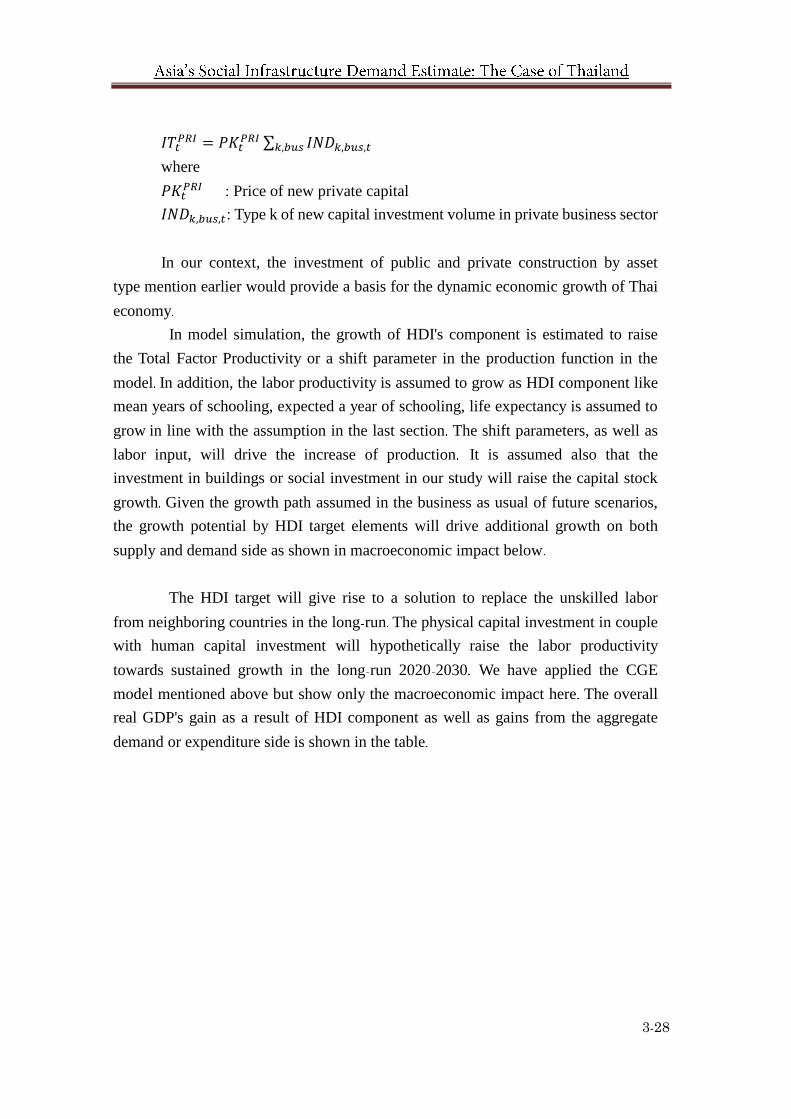
𝐼𝑇𝑡𝑃𝑅𝐼 = 𝑃𝐾𝑡
𝑃𝑅𝐼 ∑ 𝐼𝑁𝐷𝑘,𝑏𝑢𝑠,𝑡𝑘,𝑏𝑢𝑠
where
𝑃𝐾𝑡𝑃𝑅𝐼 : Price of new private capital
𝐼𝑁𝐷𝑘,𝑏𝑢𝑠,𝑡: Type k of new capital investment volume in private business sector
In our context, the investment of public and private construction by asset
type mention earlier would provide a basis for the dynamic economic growth of Thai
economy
In model simulation, the growth of HDI's component is estimated to raise
the Total Factor Productivity or a shift parameter in the production function in the
model In addition, the labor productivity is assumed to grow as HDI component like
mean years of schooling, expected a year of schooling, life expectancy is assumed to
grow in line with the assumption in the last section The shift parameters, as well as
labor input, will drive the increase of production It is assumed also that the
investment in buildings or social investment in our study will raise the capital stock
growth Given the growth path assumed in the business as usual of future scenarios,
the growth potential by HDI target elements will drive additional growth on both
supply and demand side as shown in macroeconomic impact below
The HDI target will give rise to a solution to replace the unskilled labor
from neighboring countries in the long run The physical capital investment in couple
with human capital investment will hypothetically raise the labor productivity
towards sustained growth in the long run 2020 2030 We have applied the CGE
model mentioned above but show only the macroeconomic impact here The overall
real GDP's gain as a result of HDI component as well as gains from the aggregate
demand or expenditure side is shown in the table

3 29
Table 3 7 Impact of Hypothetical Investment in Social Infrastructure on Thai Macro
Economy 2020 2030
Macro Variables measured in billion baht 2020 2021 2022 2023 2024
Change in Real Gross Domestic Product 8 6 17 8 28 7 41 0 54 9
Change in Real Export 3 2 6 8 11 2 16 3 22 2
Change in Real Government Expenditure 1 7 3 3 5 1 7 0 9 0
Change in Gross Fixed Capital Formation 2 4 5 0 8 1 11 8 16 1
Change in Real Import 2 8 6 0 9 8 14 3 19 5
Change in Private Consumption Expenditure 3 8 8 0 12 9 18 6 25 1
2025 2026 2027 2028 2029
Change in Real Gross Domestic Product 70 4 87 9 107 7 129 9 155 0
Change in Real Export 28 9 36 7 45 8 56 2 68 2
Change in Real Government Expenditure 11 1 13 3 15 6 18 0 20 7
Change in Gross Fixed Capital Formation 20 9 26 5 32 9 40 2 48 6
Change in Real Import 25 5 32 5 40 5 49 8 60 6
Change in Private Consumption Expenditure 32 3 40 5 49 8 60 4 72 3
2030
Change in Real Gross Domestic Product 183 1
Change in Real Export 82 0
Change in Real Government Expenditure 23 5
Change in Gross Fixed Capital Formation 58 1
Change in Real Import 72 9
Change in Private Consumption Expenditure 85 7
Note Direct summation of right hand real expenditure change is not matched to change in real GDP owing to we
did not add the change in investment in the table Besides, the change has to be weighted by GDP share

3 30
Appendix
Table A3 1 Determination of Real Gross Fixed Capital Formation GFCFR
Dependent Variable GFCFR
Method Panel EGLS Period random effects
Sample adjusted 1995 2015
Periods included 9
Cross sections included 157
Total panel unbalanced observations 1187
Swamy and Arora estimator of component variances
Cross section SUR PCSE standard errors & covariance d f corrected
Variable Coefficient Std Error t Statistic Prob
C 24 94328 6 771433 3 683604 0 0002
GFCFR 1 1 020276 0 154731 6 593870 0 0000
URBAN_POP 0 209444 0 083715 2 501886 0 0125
MANU_SHARE 1 427857 0 605181 2 359389 0 0185
HDI 51 02846 16 05867 3 177626 0 0015
GDPR 0 021882 0 035602 0 614635 0 5389
Effects Specification
S D Rho
Period random 0 000000 0 0000
Idiosyncratic random 92 82143 1 0000
Weighted Statistics
R squared 0 970836 Mean dependent var 144 0161
Adjusted R squared 0 970713 S D dependent var 543 1343
S E of regression 92 94946 Sum squared resid 10203369
F statistic 7862 875 Durbin Watson stat 1 150210
Prob F statistic 0 000000
Unweighted Statistics
R squared 0 970836 Mean dependent var 144 0161
Sum squared resid 10203369 Durbin Watson stat 1 150210

3 31
Table A3 2 Determination of Real Gross Fixed Capital Formation per capita
Dependent Variable LOG GFCFR_PER_CAP
Method Generalized Linear Model Newton Raphson Marquardt steps
Sample 1990 2015
Included observations 1286
Dispersion computed using Pearson Chi Square
Coefficient covariance computed using observed Hessian
Variable Coefficient Std Error z Statistic Prob
C 4 410516 0 108404 40 68589 0 0000
LOG MANU_PER_CAP 0 261630 0 017525 14 92905 0 0000
LOG URBAN_POP 0 147137 0 036183 4 066418 0 0000
HDI 4 812901 0 168638 28 53978 0 0000
Mean dependent var 0 708444 S D dependent var 1 268308
Sum squared resid 282 7789 Log likelihood 850 8531
Akaike info criterion 1 329476 Schwarz criterion 1 345524
Hannan Quinn criter 1 335500 Deviance 282 7789
Deviance statistic 0 220576 Restr deviance 2067 059
LR statistic 8089 172 Prob LR statistic 0 000000
Pearson SSR 282 7789 Pearson statistic 0 220576
Dispersion 0 220576
Note Explanation of the signs of estimated coefficients
1 Description of variables URBAN_POP urban population; MANU_SHARE share of
manufacturing GDP; HDI Human Development Index; GDPR Gross Domestic Product constant price ;
GDPR_PER_CAP real GDP per capita;
2 The coefficient of determination of Gross Fixed Capital Formation GFCF by HDI is 51 02846
level variables , while the log of GFCF per capita determined by the log of HDI is however is 2 39328

3 32
It can be rationalized as follows First, the level of GFCF is negatively correlated with HDI since the
relationship is convex The marginal increment of HDI by GFCF increases with a decreasing rates The inverse
relationship is negatively shown by the coefficients estimates The per capita income one of the HDI s component
is convex and has a negative relationship with the economic welfare level
Secondly, after log linearization of the variables GFCFR_Per_Capita and HDI The positive coefficient
measured elasticity of HDI index on the gross fixed capital formation per capita by 2 39 percent
The HDI is an index representing the loci of equality between demand and supply for human capital
inputs at equilibrium Thus, around the neighborhood of equilibrium position, the increase of gross fixed capital
formation per capita induced a positive growth of HDI especially the per capita income or welfare of samples
country given the year of schooling, and the life expectancy assuming the inverse relationship exists