Embed Size (px)
Citation preview

Chapter 3 Review Summary Statistics for Numerical Data Measures of location: • Mean • Median • Mode Measures of width: • Range • Variance • Standard Deviation • Coefficient of variation • Interquartile range
Summary Statistic for Categorical Data: • Proportion

Estimating with uncertainty
Chapter 4

Estimation and Sampling Error
• Estimation is inferring a population parameter from sample data
• In the face of chance, how much do we trust an estimate?
à We need to be able to quantify uncertainty based on sampling error

5 10 15 20 25
0.5
1
1.5
2
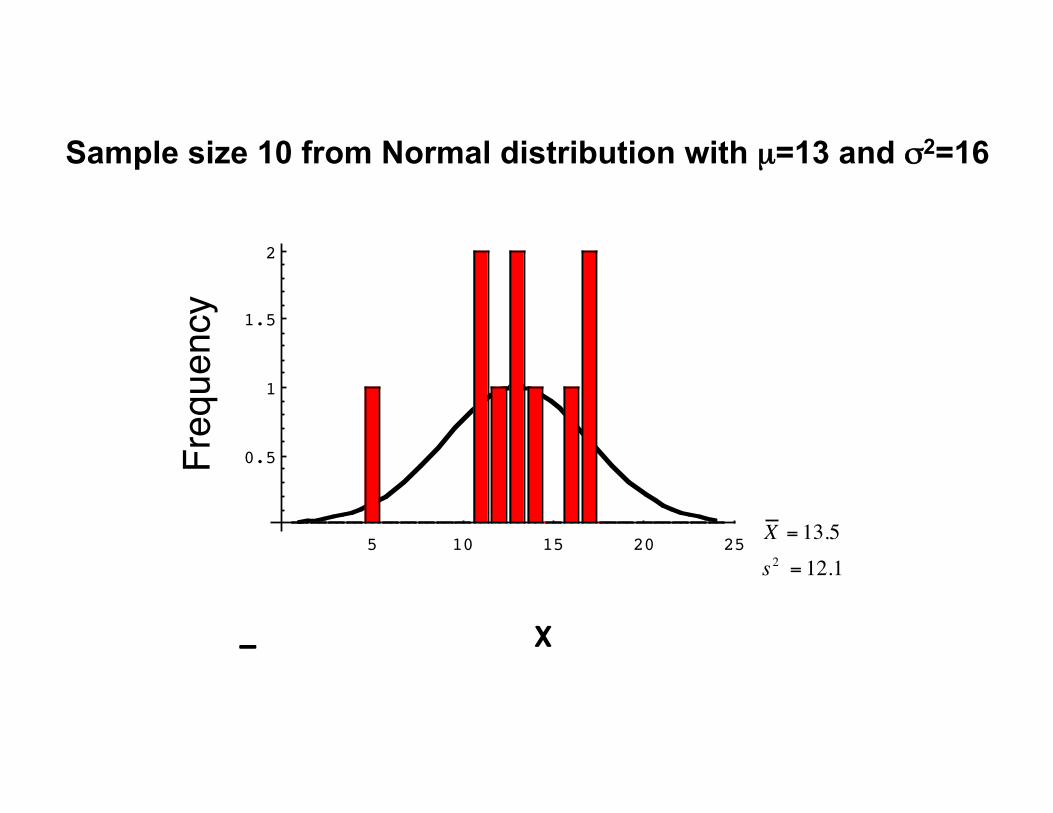
X = 13.5s 2 = 12.1
_ X
Sample size 10 from Normal distribution with µ=13 and σ2=16
Freq
uenc
y"

Another sample of 10 from same distribution
5 10 15 20 25
0.5
1
1.5
2
X =13.3s 2 = 13.0
_ X
Freq
uenc
y"

A third sample of 10 from the same distribution
5 10 15 20 25
0.5
1
1.5
2
X =11.9s 2 = 28.3
X
Freq
uenc
y"

Distribution of the means of many samples, each of sample size 10!
Sampling Distribution
The probability distribution of all values for an estimate that we might obtain when we sample a population
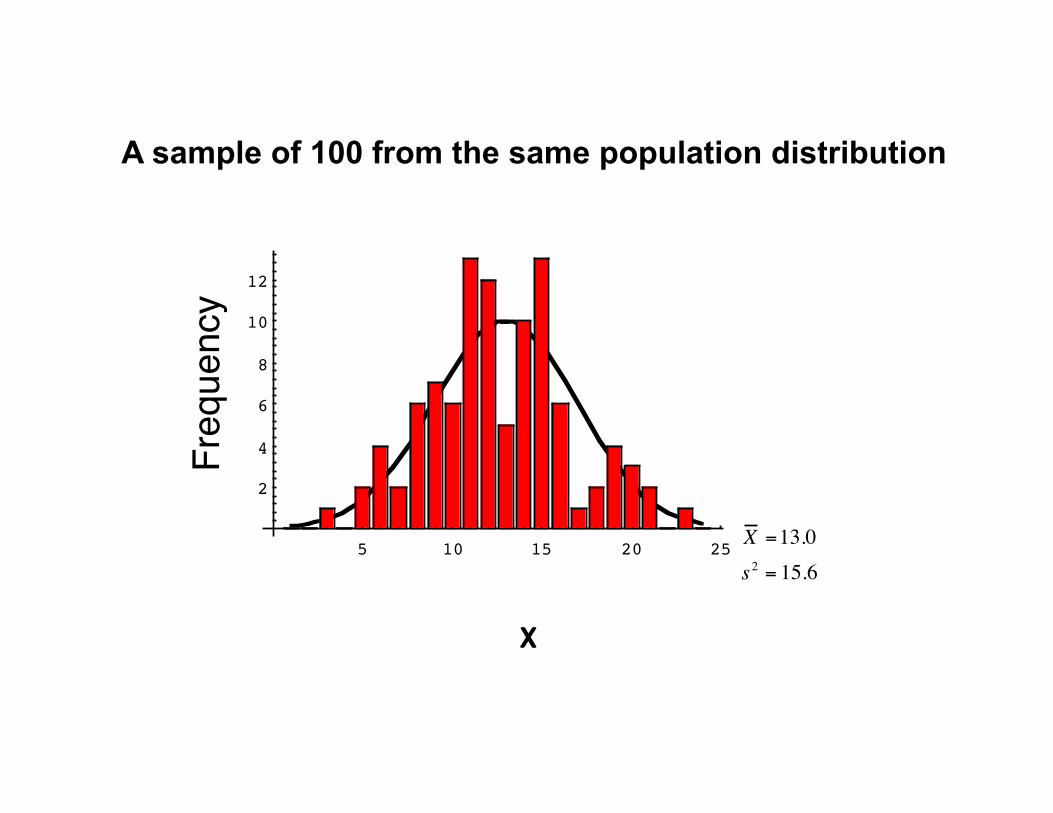
A sample of 100 from the same population distribution Sampl e size 100
5 10 15 20 25
2
4
6
8
10
12
X =13.0s 2 = 15.6
X
Freq
uenc
y"

Sampl e size 1000
5 10 15 20 25
20
40
60
80
100
X =12.9s 2 = 16.3
X
Freq
uenc
y"A sample of 1000 from the same population distribution

Distribution of the means of many samples, each of sample size 100!

n = 100"
n = 10"
Variation in sample means decreases with sample size"
1000 samples each"

Sampling Distribution
The probability distribution of all values for an estimate that we might obtain when we sample a population

The standard error of an estimate is the standard deviation of its sampling
distribution.
The standard error predicts the sampling error of the
estimate.

Standard Deviation vs. Standard Error
• Standard deviation gives you a sense of the spread in your sample (how far typical individuals are from your estimate)
• Standard error gives you a sense of how far your estimate is likely to be from the true parameter

€
µ = 67.4
€
σ = 3.9
€
SD =1.7
€
mean = 67.4
N

Standard error of the mean
€
σY =σn

€
µ = 67.4
€
σ = 3.9
€
µY = µ = 67.4
€
σY =σn
=3.95
=1.7
€
SD =1.7
€
mean = 67.4
N
The math works!!
The problem is, we rarely know σ. "

Estimate of the standard error of the mean
€
SEY =sn
This gives us some knowledge of the likely difference between our sample mean and the true population mean.!

€
µ = 67.4
€
σ = 3.9
N In most cases, we don’t know the real population distribution."
We only have a sample."
€
SEY =sn
=3.15
=1.4
We use this as an estimate of "
€
σY
€
s = 3.1
€
Y = 67.1

95% Confidence Interval
The 95% confidence interval provides a plausible range for a parameter. All values for the parameter lying within the interval are plausible, given the data, whereas those outside are unlikely.""

95% Confidence Interval
If you took 1000 independent samples and calculated the 95% confidence
interval of your estimate from each, ~950 of them would contain the true population
parameter

The 2SE rule-of-thumb
The interval from - 2 to + 2 provides a rough estimate of the 95% confidence interval for the mean. "
€
SEY
€
SEY
€
Y
€
Y
(Assuming normally distributed population and/or sufficiently large sample size.)!


Sampling distributions of gene sizes"

Confidence interval

US counties with high kidney cancer death

US counties with low kidney cancer death

Variation in cancer rates decreases with population size of counties
Wainer (2007) The most dangerous equation. American Scientist 95: 249-256."

Error bars
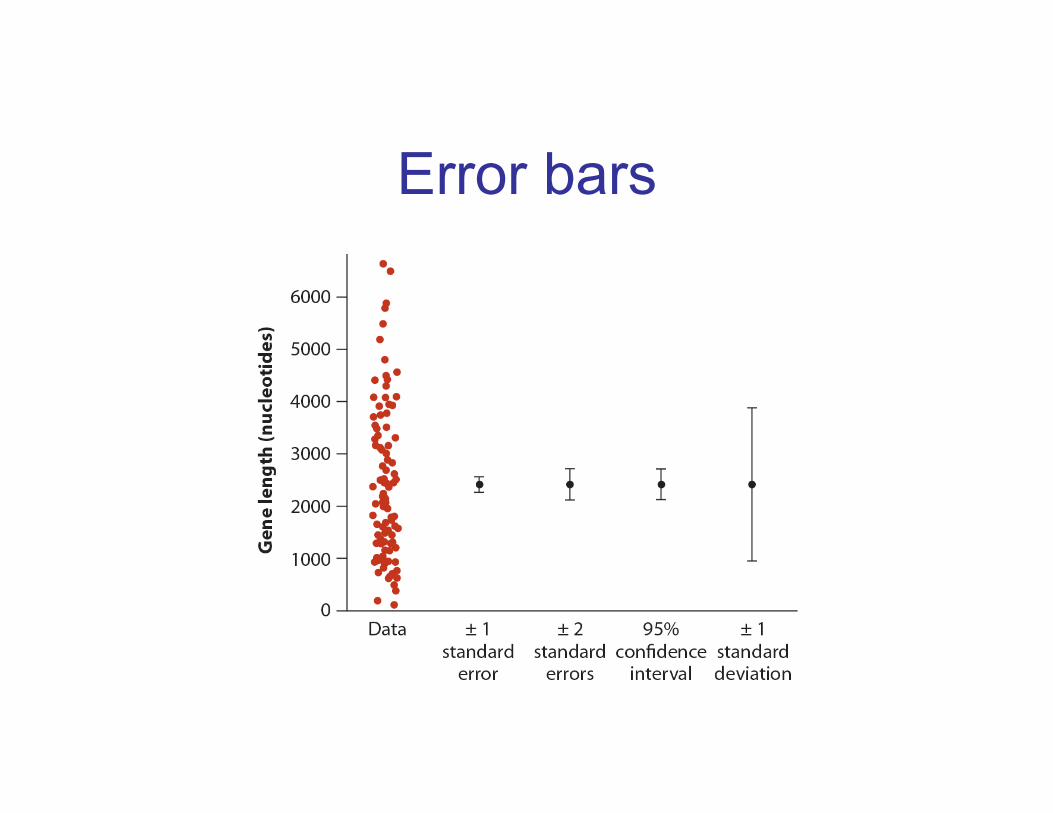
Error bars
Pseudoreplication
The error that occurs when samples are not "independent, but they are treated as though they are."

Example: Pseudoreplication
You are interested in average pulse rate of mountain climbers. Since they are hard to find, you decide to take 10 measurements from each climber. You study 6 climbers, so you have 60 measurements. ""What is your sample size (n)?"

Avoiding pseudoreplication
You are interested in average pulse rate of mountain climbers. Since they are hard to find, you decide to take 10 measurements from each climber. You study 6 climbers, so you have 60 measurements. ""Take the mean blood pressure for each climber, so that you have 6 pulse rates, one for each climber (n = 6)."""

As in other vertebrates, individual zebrafish differ from one another along the shy-bold behavioral spectrum. In addition to other behavioral differences, bolder individuals tend to be more aggressive, whereas shy individuals tend to be less aggressive. Norton et al. (2011) compared several behaviors associated with this syndrome between zebrafish that had the spd mutant at the Fgfr1a gene and the “wild type” lacking the mutation. The data below are measurements of the amount of time, in seconds, that individual zebrafish with and without this mutation spent in aggressive activity over 5 minutes when presented with a mirror image. Wild type: 0, 21, 22, 28, 60, 80, 99, 101, 106, 129, 168 Spd mutant: 96, 97, 100, 127, 128, 156, 162, 170, 190, 195 1) What is the mean and standard deviation of seconds in aggressive activity for
each genotype? 2) What are the standard errors of these estimates of the means? 3) Give approximate 95% confidence intervals of the means. Provide upper and
lower limits.

Wild type: 0, 21, 22, 28, 60, 80, 99, 101, 106, 129, 168 Spd mutant: 96, 97, 100, 127, 128, 156, 162, 170, 190, 195 1) What is the mean and standard deviation of seconds in aggressive activity for
each genotype? Mean: Wild type: 0 + 21 + 22 + 28 + 60 + 80 + 99 + 101 + 106 + 129 + 168 = 814
814 / 11 = 74.0 Spd mutant: 96 + 97 + 100 + 127 + 128 + 156 + 162 + 170 + 190 + 195 = 1421
1412/10 = 142.1

Wild type: 0, 21, 22, 28, 60, 80, 99, 101, 106, 129, 168 Spd mutant: 96, 97, 100, 127, 128, 156, 162, 170, 190, 195 1) What is the mean and standard deviation of seconds in aggressive activity for
each genotype?
0 -74 5476
21 -53 2809
22 -52 2704
28 -46 2116
60 -14 196
80 6 36
99 25 625
101 27 729
106 32 1024
129 55 3025
168 94 8836
814 27576
€
Yi −Y
€
Yi
€
(Yi −Y )2
Sums:"
Wild type:!!s2 = 27576 / 10 = 2757.6 ""s = 52.5"

Wild type: 0, 21, 22, 28, 60, 80, 99, 101, 106, 129, 168 Spd mutant: 96, 97, 100, 127, 128, 156, 162, 170, 190, 195 1) What is the mean and standard deviation of seconds in aggressive activity for
each genotype?
0 -74 5476
21 -53 2809
22 -52 2704
28 -46 2116
60 -14 196
80 6 36
99 25 625
101 27 729
106 32 1024
129 55 3025
168 94 8836
814 27576
€
Yi −Y
€
Yi
€
(Yi −Y )2
Sums:"
Wild type:!!s2 = 27576 / 10 = 2757.6""s = 52.5"
Spd mutant:!!s2 = 12818.9 / 9 = 1424.3""s = 37.7"

Wild type: 0, 21, 22, 28, 60, 80, 99, 101, 106, 129, 168 Spd mutant: 96, 97, 100, 127, 128, 156, 162, 170, 190, 195 2) What are the standard errors of these estimates of the means?
Wild type: 52.5 / = 15.8 Spd mutant: 37.7 / = 11.9
11
10

Wild type: 0, 21, 22, 28, 60, 80, 99, 101, 106, 129, 168 Spd mutant: 96, 97, 100, 127, 128, 156, 162, 170, 190, 195 3) Give approximate 95% confidence intervals of the means. Provide upper and
lower limits.
Wild type: 74 + 2(15.8) = 105.6 74 – 2(15.8) = 42.4 42.4 < µ < 105.6
Spd mutant: 142.1 + 2(11.9) = 165.9
142.1 – 2(11.9) = 118.3 118.3 < µ < 165.9

Reading
For Today: Chapter 4 For Thursday: Chapter 5

Reminder:
Labs this week!
1st and 5th labs are mandatory

Assignment #1
Chapter 1: 14, 17, 19, 20 Chapter 2: 25, 32 Due This Friday Sep. 25th by 2 pm in your TA’s homework box

Assignment #2
Chapter 3: 17, 21 Chapter 4: 18, 20 Due Next Friday, Oct. 2nd by 2pm in your TA’s homework box