Embed Size (px)
Citation preview

93
CHAPTER 3
RESULTS AND DISCUSSION ON QPSEBS AND ITS
COMPOSITE MEMBRANES
This chapter elucidates in detail the results of the various
characterizations and experiments of the QPSEBS membrane, Ag/C, Pd-Ni/C
catalysts as well as the different composites of QPSEBS. This section also
includes the discussion of the obtained results.
3.1 QPSEBS
The anion exchange membrane (AEM) was prepared from poly
(styrene ethylene butylene) poly styrene [PSEBS]. AEMs can be prepared by
several routes: (a) polymer blended with alkali, (b) pyridinium base type
polymer, (c) radiation-grafting and quaternization of polymer, (d)
chloromethylation and quaternization of polymer. Among these, preparation
of anion exchange membrane by chloromethylation and quaternization route
is more advantageous and important because the membrane prepared by this
method has good physical stability and relatively high chemical stability. The
commonly used chloromethylating agents such as chloromethyl methyl ether
(CMME) and bis-chloromethyl ether (BCME) provide excellent conversions
and high yields. But they are now considered to be carcinogens and their use
has been restricted since the 1970s (Laskin et al 1971, Taylor and Laughlin
1975).

94
To avoid the use of such hazardous materials, in this work
paraformaldehyde and concentrated hydrochloric acid was used as
chloromethylating agent as reported by other investigators (Fang and Shen
2006, Xiong et al 2009). The three steps in the preparation of anion exchange
membrane include (i) chloromethylation, (ii) quaternization and (iii)
alkalization. Poly (styrene ethylene butylene poly) styrene was
chloromethylated by nHCHO, conc. HCl (chloromethylating agent) and ZnCl2
(catalyst) then quaternized by triethylamine. The degree of substitution
depends on many parameters such as reaction time, temperature,
concentration of chloromethylating agent and polymer concentration. After
optimization of these parameters, the PSEBS polymer was successfully
chloromethylated to an appropriate level. The optimized parameters are,
[PSEBS] = 28.5 mmol, [nHCHO] = 180 mmol, [Conc. HCl] = 540 mmol,
[ZnCl2] = 25.3 mmol, reaction time = 48 h, reaction temperature = 60 C and
degree of chloromethylation =1.47. The thicknesses of the membranes were
found to be from 85 to 90 µm as measured by micrometer (precision ± 3 µm).
3.1.1 Fourier Transform Infra Red
PSEBS, chloromethylated PSEBS (CMPSEBS) and quaternized
PSEBS (QPSEBS) samples were characterized by FTIR. The FTIR spectra
were obtained to confirm the chloromethylation and quaternization of the
polymer and the resulting spectra is shown in Figure 3.1. The following
conclusions were drawn from the obtained spectra.

95
Figure 3.1 FTIR spectra of (a) PSEBS, (b) CMPSEBS and (c) QPSEBS
Figure 3.1 (a) shows the IR spectrum of PSEBS. Appearance of
peak around 1638 cm-1
was assigned to the aromatic ring C=C. Appearance of
peak around 1458 cm-1
and 1366 cm-1
was assigned to the bending vibration
which is due to the presence of aromatic ring backbone –CH- bending
vibration. The peak at 2924 cm-1
is due to the stretching of C-H bond of
aromatic hydrocarbon. Appearance of peak around 699 cm-1
and 747 cm-1
was
assigned to the aromatic ring out of plane C-H bending vibration. Appearance
of these peaks confirmed the structure of PSEBS.
Due to chloromethylation reaction (Figure 3.1 (b)), the IR bands of
C=C in aromatic ring from styrene unit are shifted to a lower frequency in the
range of 1601 cm-1
. As well as the IR bands of the aromatic ring backbone
CH bending vibration, are shifted to a lower frequency in the range of 1404

96
cm-1
and 1247 cm-1
. This confirms that the reaction has occurred in the
aromatic ring. Appearance of peak at 1247 cm-1
shows that the CH2Cl group is
substituted at the phenyl ring.
Due to quaternization reaction, the IR bands of aromatic ring C=C
and aromatic ring backbone –CH- bending vibration are shifted to a lower
frequency around 1600 cm-1
and 1371 cm-1
. In this reaction, triethylamine is
used to form the quaternized product. IR bands for tertiary amine cannot be
seen in the spectrum. Appearance of peak around 1371 cm-1
was assigned to
C-N stretching vibration. Due to the quaternization (Figure 3.1 (c)), a small
intense peak at 2365 cm-1
has appeared, which is the characteristic absorption
peak of quaternary ammonium groups. From all these evidences, it is clear
that chloromethylation and quaternization reactions have been successfully
carried out in the PSEBS unit at phenyl rings.
3.1.2 1H-Nuclear Magnetic Resonance
Figure 3.2 shows the 1H-NMR spectra of PSEBS, CMPSEBS and
QPSEBS. By characterizing the polymer samples of PSEBS, CMPSEBS and
QPSEBS with proton nuclear magnetic resonance spectroscopy, the following
conclusions were drawn. The base polymer PSEBS contains 29% of
polystyrene and 71% of ethylene and butylene. Since the styrene content is
only 29%, it shows a very low intensity in NMR bands. The solvent peak
appears at = 7.28 ppm. The alkyl proton bands namely CH3 proton, CH2
proton and CH proton are appearing at 0.9ppm, 1.3ppm and 1.5ppm
respectively. The bands that appear in the region between 6-8.5ppm are due to
the aromatic ring protons. Appearance of these proton bands clearly confirms
the structure of the PSEBS.

97
Figure 3.2 1H-NMR spectra of (a) PSEBS, (b) CMPSEBS and (c)
QPSEBS
Due to chloromethylation reaction, a small singlet peak is observed
at 4.5 is assigned to the presence of –CH2Cl group in the phenyl ring.
Due to quaternization reaction, some structural changes takes place
in the reactant PSEBS. Appearance of a new triplet peak at 1.3 is assigned
to the CH3 protons from N-CH2-CH3 group. The new peak appears at 4.1
is assigned to the CH2-N protons due to the presence of the phenyl group. The
quartet band formed at 3.0 is assigned to the N-CH2-CH3 group. All these
confirm the structure of QPSEBS. In summary, the changes in NMR spectra
support the chemical modification of PSEBS in to an anion exchange
polymer.

98
3.1.3 Water Absorption, Ion Exchange Capacity and Stability Test
Water uptake of PSEBS, CMPSEBS, QPSEBS and alkalized
PSEBS (ALPSEBS) membranes are shown in Figure 3.3. Water absorption
capacity depends on the presence of number of ion exchange groups present
in the membrane. The alkalized PSEBS showed the highest water absorption
(5.74%), followed by the quaternized PSEBS (4.04%), chloromethylated
PSEBS (2.25%) and the base PSEBS (0.49%). This percentage variation may
be attributed to the nature of functional group that each polymer carries.
Apparently, ALPSEBS is the most polar polymer, while PSEBS is the least
polar. Although, QPSEBS contained Cl-, this anion is much less active than
the OH- on the alkalized polymer when interacting with water (Wang et al
2009). This water absorption indicates that the introduction of quaternary
ammonium group converts the hydrophobic PSEBS in to hydrophilic.
PSEBS CMPSEBS QPSEBS ALPSEBS
0
1
2
3
4
5
6
Wate
r ab
so
rpti
on
, %
Figure 3.3 Water uptake of PSEBS, CMPSEBS, QPSEBS and ALPSEBS
Experimental ion exchange capacity value (IEC) was calculated for
the QPSEBS by titration method. IEC can provide information on the density
of ionizable functional group in the membrane. IEC of the membrane depends
on the number of ionic channels present in the membrane, which are in turn
responsible for the hydroxyl conductivity of the membrane through hopping
99
mechanism. The ion exchange capacity of the prepared membrane was found
to be 0.958 meq/g.
Hydrolytic stability of the membrane was investigated by
introducing the membrane in to boiling water. It was found that the QPSEBS
withstood the boiling water condition without any physical deformation,
which means that the structure of polymer makes the QPSEBS membrane to
have good hydrolytic stability. Hence it is inferred that the membrane can be
safely used in the fuel cell at higher temperatures (80-100 °C).
Alkaline stability test involves acceleration of the degradation
process, thereby indicating the mechanical and chemical stability. The
QPSEBS ionic membrane was introduced in to 5M NaOH solution. The ionic
membrane does not have any physical deformation and the membrane was
stable for more than two days (48 h). The property of IEC was measured after
the hydrolytic and alkaline stability test, the IEC was not significantly
changed, which means that the prepared QPSEBS membrane has good
mechanical and chemical stability.
3.1.4 Thermogravimetric Analysis
0 100 200 300 400 500 600 700 800
0
20
40
60
80
100
Weig
ht
resid
ue
(%
)
Temperature (OC)
PSEBS
CMPSEBS
QPSEBS
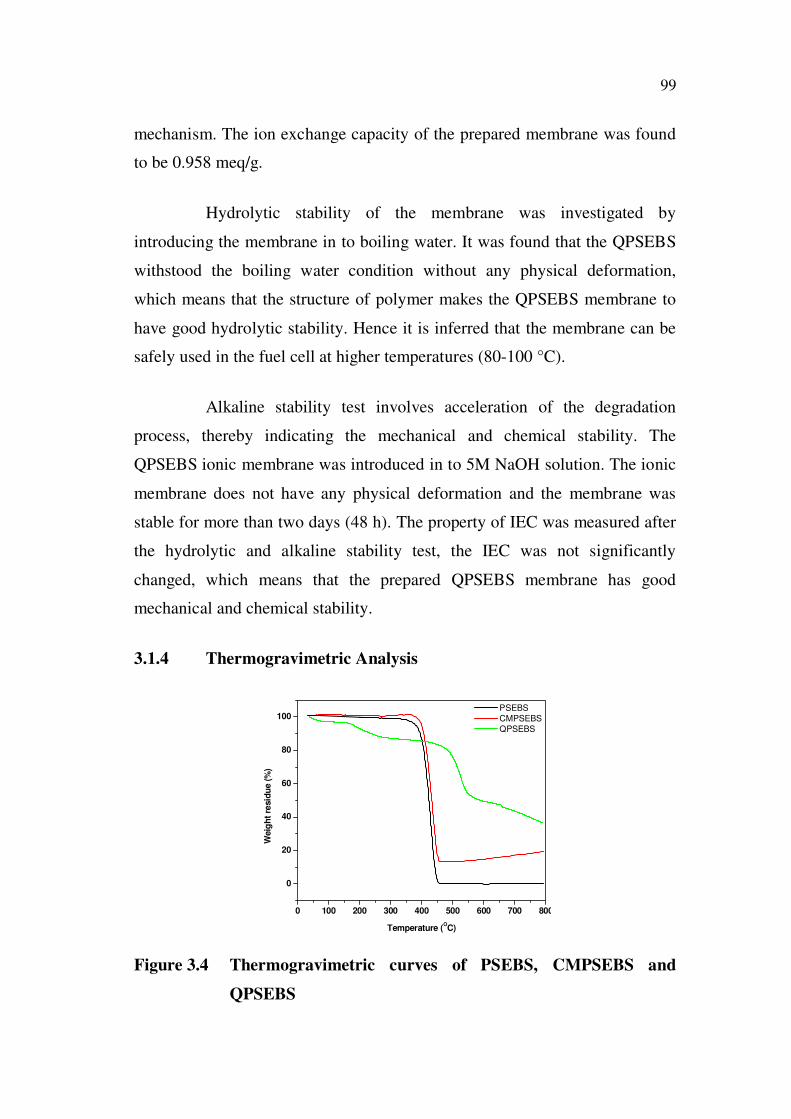
Figure 3.4 Thermogravimetric curves of PSEBS, CMPSEBS and
QPSEBS

100
The thermal degradation of CMPSEBS and QPSEBS was studied
with thermo gravimetric analysis. Figure 3.4 shows the thermo gravimetric
curves of PSEBS, CMPSEBS and QPSEBS. The PSEBS polymer shows a
major decomposition in TGA curve from 416 °C to
459 °C which may be due to the polymer degradation. The chloromethylated
PSEBS also shows sharp single step decomposition at 425 °C. This is due to
the main chain decomposition. The decrease in thermal stability of
CMPSEBS is due to the introduction of polar group in to the polymer chain,
whereas, the QPSEBS shows a two step degradation. The first weight loss
between 70 and 190 °C is due to the removal of quaternary ammonium groups
from the polymer and the second weight loss observed at temperature higher
than 460 °C, is due to the complete degradation of the polymer chain. The
curves demonstrate that the QPSEBS has moderate thermal stability and
higher degradation temperature. This suggests that the QPSEBS based anion
exchange membrane is suitable to work in alkaline fuel cell conditions.
3.1.5 Differential Scanning Calorimetry
50 100 150 200 250 300
Exo
(c)
(b)
(a)
mW
(mg
)
Temperature (OC)
Figure 3.5 DSC curves of (a) PSEBS, (b) CMPSEBS and (c) QPSEBS

101
The thermal behavior of the PSEBS, CMPSEBS and QPSEBS were
studied using DSC. The Tg value for PSEBS (Figure 3.5 (a)) was found to be
78 °C, whereas for CMPSEBS (Figure 3.5 (b)) it was 124 °C. The
remarkable increase in the Tg value could be attributed to the electronegative
nature of the –CH2Cl group. On the other hand, for QPSEBS (Figure 3.5 (c)),
due to the bulkiness of the quaternized group, a lowering in the Tg value (86
°C) was observed. Hence a moderate Tg value obtained for QPSEBS is an
evidence for the adequate thermal property of QPSEBS for AMFC
application. From Figure 3.5 (c) it may be inferred that the crystallization
temperature of QPSEBS was 100 °C and the melting temperature was
observed to be 210 °C.
3.1.6 Dynamic Mechanical Analysis
Figure 3.6 Storage modulus vs. temperature at 1 Hz for (a) PSEBS and
(b) QPSEBS
Figure 3.6 shows the temperature dependence of the storage
modulus E’ of the PSEBS (Figure 3.6a) and QPSEBS (Figure 3.6b)
membrane. The ionomer (QPSEBS) displays typical behavior of an

102
amorphous polymer. In the glassy state, the storage modulus E’ remains
roughly constant. The Tg value of PSEBS and QPSEBS were found to be 77
°C and 86 °C respectively which are close to each other. In the temperature
versus storage modulus plot the two curves belonging to PSEBS and QPSEBS
were found to be close to each other. This is an indication that the Tg values of
the two polymeric materials were close. The storage modulus is an indication
of the rigidity of the material. Upon increasing the temperature from 30 to 200
°C there is a decrease in the storage modulus. The storage modulus was found
to be around 5 MPa when the temperature reaches 105 C for PSEBS and
about 3 MPa for QPSEBS at 120 °C. Around 45 °C, the modulus drop is
associated with the glass-rubber transition of the ionomers. This modulus
corresponds to energy dissipation displayed in a relaxation process (Stoica et
al 2007).
Figure 3.7 Tan delta vs. temperature at 1 Hz for (a) PSEBS and (b)
QPSEBS
The properties of the polymers change with temperature. In
particular, it has been found that the coefficients of thermal expansion of
amorphous polymers undergo abrupt changes in the region of the glass
transition. The temperature at this abrupt change is defined as glass transition

103
temperature, Tg. From the Figure 3.7, it is observed that QPSEBS (Figure
3.7b) membrane shows an inflection point at 86 oC, where the internal friction
(tan ) curve goes through a maximum. This value corresponds to the glass
transition region of the QPSEBS membrane. The Tg values obtained from
DMA is more accurate. The Tg values for PSEBS (Figure 3.7a) and QPSEBS
from DMA were found to be 82 oC and 86
oC and were in good agreement
with the DSC values.
3.1.7 Scanning Electron Microscopy
Figure 3.8 SEM images of (a) QPSEBS and (b) ALPSEBS
The surface morphology of the QPSEBS and ALPSEBS membrane
was studied by scanning electron microscopy. Figure 3.8 (a) and (b) shows the
surface morphology of the QPSEBS and ALPSEBS membrane. Both the SEM
photographs confirms the uniformity of the membrane and also show rough
fractured surfaces, which provide some information regarding membrane’s
mechanical properties (Xiong et al 2008).
(a)

104
3.1.8 Ionic conductivity
On introducing the quaternary ammonium groups in to the polymer
chain, the hydroxyl ion conducting ability was introduced. To examine the
conductivity, the quaternized membrane was first soaked in KOH solution for
24 h to convert in to OH- form and then it was washed several times with
deionized water. After the free KOH was completely removed, the
conductivity of the membrane was measured using electrochemical
impedance spectroscopy (EIS). The anion exchange membrane (QPSEBS)
showed conductivity with the value of 1.51 × 10⁻²
S/cm. Hence, this anion
exchange membrane can be potentially used for alkaline fuel cell applications.
3.1.9 Methanol Permeability and Selectivity Ratio
Methanol permeability of QPSEBS membrane was found to be 2.14
x 10-6
cm2/s in 2M methanol solution whereas the commercially available
anion exchange membrane (AMI-7001) exhibits 2.25 x 10⁻⁶
cm2/s. But,
Nafion, a cation exchange membrane possesses 2.32 x 10⁻⁶
cm2/s (Cho et al
2004) in a solution mixture of methanol and deionized water (5/95 (w/w)).
This reveals that the methanol permeability of the QPSEBS and AMI-7001
membrane was slightly lower than that of Nafion membrane. Also the
concentration of methanol will play an important role during the permeability
experiments. Hence the obtained permeability results of QPSEBS and AMI-
7001 may be negligible at the lower concentration of methanol (5/95 (w/w)).
So, it is probably that the PSEBS matrix has less methanol affinity compared
with perflourinated hydrocarbon polymer and the non-ionic blocks can act as
a barrier to methanol.
In DMAMFC applications, the ratio of ionic conductivity to
methanol permeability (selectivity ratio) is a characteristic parameter to
evaluate the fuel cell performances of membranes. In general, membranes
with higher ionic conductivity and lower methanol permeability are more

105
suitable for DMAMFCs. The selectivity ratio of QPSEBS and AMI-7001
were found to be 0.71 x 10⁴ Ss/cm
3 and 0.76 x 10
4 Ss/cm
3 respectively.
3.2 CARBON SUPPORTED CATALYSTS
The most important criterion for the ion exchange membranes was
to evaluate the performance in real scale fuel cells. For this, membrane
electrode assembly (MEA) was fabricated using three different catalysts
namely Pt/C, Ag/C and Pd-Ni/C for the cathode side while Pt/C as a constant
anode material for the above three cathode materials. Catalysts Ag/C and Pd-
Ni/C were prepared by wet impregnation and reduction methods respectively,
while Pt/C was commercially procured. The prepared catalysts were
subjected into several characterization and the results are described in this
section.
Noble metals such as Pt, Pd, Ru and Au supported over carbon
materials have been reported to be efficient catalysts for both the PEMFC and
DMFC applications. However, the cost and methanol cross-over factors
hinder the development of such products into the market. To overcome these
factors, researchers look forward to non-noble metal catalysts like Ag, Ni and
Co etc. The recent developments in fuel cells have emphasized the use of
silver (Ag) and nickel (Ni) as a principal and necessary component to
fabricate MEA as a cathode material.
To increase the electrochemically active surface area, catalysts
supported on high surface area materials, commonly carbon based materials
are widely used in low temperature fuel cells. Recent studies have revealed
that the physical properties of the carbon based materials can greatly affect
the electrochemical properties of the fuel cell catalyst. It has been reported
that carbon materials with both high surface area and good crystallinity can
not only provide a high dispersion of metal particles, but also facilitate
electron transfer, resulting in better fuel cell performance. Supported-metal

106
catalysts are widely used in the energy-related and fine-chemical industries.
In addition, compared with other supports, carbon materials have considerable
advantages, such as (1) high specific surface area up to 3000 m2/g, (2) high
stability in acidic and basic media (Auer et al 1998), (3) easy modification of
textural properties and functional groups, and (4) easy recovery of supported
metals by burning off the catalyst. Moreover, the varieties of available forms
(e.g. graphite, carbon black (CB), activated carbon (AC), activated carbon
fibers (ACF), carbon nanotubes (CNTs), and carbon molecular sieves (CMS))
make carbon materials very attractive as catalysts or supports for metal
catalysts (Mestl et al 2001, Serp et al 2003). Thus, a resurgence of interest has
occurred to synthesize non-noble metal catalysts using activated carbon
support.
3.2.1 Ag/C Catalyst
3.2.1.1 X-Ray diffraction studies
The as prepared Ag/C catalysts were characterized by XRD the
spectra of which are shown in Figure 3.9. XRD is a bulk analysis that reveals
the crystal structure, lattice constant and crystal orientation of supported
catalysts. In the Figure, the broad peak at 2 = 25.9 is associated with (002)
plane of the graphite-like structure of the activated carbon, and the diffraction
peaks at 2 = 38 , 44 , 64 and 77 can be attributed to the (111), (200), (220)
and (311) crystalline planes respectively of the face centered cubic (fcc)
structure of Ag (Han et al 2009) (JCPDS 04-0783). A diffraction peak of
graphite at 2 = 25.9 was found to slightly decrease with increase in the
percentage of the metal loading. At one stage, in particular 10 wt % of Ag, the
peak completely vanished. This was a result of the strong interaction between
the carbon support and the incorporated silver particles indicating that the
metal particles were well distributed within the activated carbon matrix. The
average size of the metal particles was calculated based on the (111) facets of
diffraction peaks according to Scherrer’s equation (Xu et al 2008). The

107
average size of Ag particles was 5.36 nm in 2 wt %, 5.65 nm in 4 wt %, 6.24
nm in 6 wt %, 7.62 nm in 8 wt % and 10.71 nm in 10 wt %. The analysis
revealed that the size of the prepared Ag particles were in nanometer range
varying from 5-11 nm. The advantage of the nanometer sized particles is their
high surface area which would drastically reduce the amount of catalyst
required and thus becoming cost effective.
10 20 30 40 50 60 70 80
(311)
(22
0)
(200)
(11
1)
c
e
d
b
a
Inte
nsit
y (a.u
)
2 (O)
Figure 3.9 XRD patterns of (a) 2 wt %, (b) 4 wt %, (c) 6 wt %, (d) 8 wt %
and (e) 10 wt % as synthesized Ag/C catalyst
3.2.1.2 UV-visible diffuse reflectance spectra
200 300 400 500 600 700 800
a
b
Absorb
ance (a.u
)
Wavelength (nm)
Figure 3.10 UV-Vis diffuse reflectance spectra of as-prepared Ag/C
catalysts (a) 2 wt % and (b) 10 wt %

108
The UV-visible diffuse reflectance spectra of the as prepared 2 wt
% and 10 wt % Ag/C catalysts are shown in Figure 3.10. Four overlapped
bands centered at about 266, 316, 440 and 560 nm can be identified in the two
samples. There were absorption bands between 400 and 750 nm. They were
assigned to surface plasma resonance band of silver nanoparticles. The
absorption bands at 266 and 316 nm correspond to the absorption of Ag4+ and
Ag5 nanoparticles respectively, as reported by Ershov et al (1993). In addition
as suggested by Sato et al (2003), the bands in the range of 240-270 nm and
275-320 nm correspond to the absorption of Agn+ and Agm nanoparticles
respectively. The difference in absorption bands are due to different in size
and shape of Ag nanoparticles. There is an absorption band close to 316 nm, it
may be assigned to Ag in very small dimensions. In other words, the
absorption bands detected over the catalysts described in the study at about
266 nm and 316 nm can be attributed to small size cationic particles and silver
particles, respectively (Miao et al 2004).
3.2.1.3 Raman spectroscopy
Figure 3.11 Raman spectra of Ag/C (a) 2 wt % and (b) 10 wt % Ag/C

109
The Raman spectra were also used to study the surface structure of
prepared Ag/C catalysts and the results are shown in Figure 3.11. Both the
samples (2 wt % and 10 wt % Ag/C) exhibited two distinct bands appearing at
around 1350 (D-band) and 1575 (G-band) cm-1
. The D-band and G-band
reflect the structure of sp3 and sp
2 hybridized carbon atom, indicating
disordered graphite and the order state on the Ag/C surfaces, respectively
(Yao et al 1998). Therefore the degree of the graphitization of Ag/C can be
quantified by the intensity of ratio of the D to G bands. The peak intensity
ratios (ID/IG) are 0.51 and 0.46 for the 2 wt % and 10 wt % of Ag/C
respectively. High ID/IG ratio indicates that the sample contains high
quantities of amorphous carbon impurities. However, in our case, the ID/IG
ratios obtained were of low value implying that the prepared catalysts
possessed good electrical conductivity and corrosion resistance. Hence, these
materials could be potentially employed as a cathode material for alkaline
membrane fuel cell applications (Wang et al 2008, Zhao et al 2009).
3.2.1.4 Scanning electron microscopy
Figure 3.12 SEM images of 2 wt % (a, b and c) and 10 wt % (d, e and f)
carbon supported silver catalysts with different magnifications

110
Electron microscopic examination is useful in evaluating the spatial
distribution and size of the Ag crystallites in the supported catalyst, since the
densities of Ag and activated carbon are significantly different from each
other.
Figure 3.12 illustrates SEM images of 2 wt % (a, b and c) and 10 wt %
(d, e and f) of activated carbon supported Ag catalysts with different
magnifications. The crystal-grown state and surface morphology of silver on
the activated carbon surface were observed by scanning electron microscopy.
The fine particles and aggregated metallic Ag particles were observed on the
surfaces of some activated carbon as indicated in Figure 3.12. As is evident
from the Figure, the aggregations of metallic Ag particles were found to
increase with increasing amount of Ag content. From these results, one can
easily observe the heterogeneously distributed metallic Ag particles on the
carbon surface. The average size of the Ag particle distributed on the carbon
surface was 8 to 10 nm, which is in good agreement with XRD results.
3.2.1.5 Thermogravimetric analysis
0 200 400 600 800
40
60
80
100
Weig
ht
resid
ue (
%)
Temperature (OC)
2 wt% Ag/C
4 wt% Ag/C
6 wt% Ag/C
8 wt% Ag/C
10 wt% Ag/C
Figure 3.13 Thermogravimetric curves of as-synthesized Ag/C catalysts

111
Figure 3.13 shows the thermogravimetric graphs for the as
synthesized Ag/C catalysts with different weight percentage of metal loading.
From this Figure 3.13, it was found that, in all five thermograms weight loss
occurred in two stages. While the first weight loss i.e. around 90 C
correspond to the removal of moisture present in the prepared catalyst, the
second weight loss at around 580 C was mainly due to the presence of
amorphous carbon in the Ag incorporated activated carbon (Chen et al 2004).
The burning of activated carbon themselves begins at around 620 C. It was
noted that approximately 40 to 70% of the sample remained after performing
TGA up to 800 C. This residue remains mainly due to the presence of carbon
particles. There was no weight gain observed during thermal treatment, since
no oxidation of the metal particles was expected to take place (Hou et al
2001). It should be noted that the prepared Ag/C catalysts can be used
successfully for high temperature fuel cell application also.
3.2.1.6 Cyclic voltammetry
0.0 0.2 0.4 0.6 0.8 1.0
-1.0x10⁻⁴
0.0
1.0x10⁻⁴
2.0x10⁻⁴
3.0x10⁻⁴
4.0x10⁻⁴
5.0x10⁻⁴
6.0x10⁻⁴
7.0x10⁻⁴
(b)
(a)
Cu
rren
t (A
)
Potential (V vs SCE)
Figure 3.14 Cyclic voltammograms of (a) bare GCE and (b) Ag/C
modified GCE in 0.5 M KOH
1 2
3
4
5

112
The cyclic voltammograms of Ag/C catalysts in freshly prepared
0.5 M KOH solution purged with nitrogen are shown in Figure 3.14. There
are three anodic peaks appearing at 0.22, 0.76 and 0.85 V vs. SCE, and one
cathodic peak appearing at 0.38 V vs. SCE. The anodic peaks appearing
between 0.22 and 0.85 V vs. SCE are due to the formation of Ag2O layers and
the cathodic peak at 0.38 V vs. SCE is assigned to the reduction of Ag2O back
to metallic silver form. According to Cheng et al (1996), peak 0.22 is due to
silver dissolution and formation of surface monolayer of Ag2O film while
peaks 0.76 and 0.85 V are due to the formation of AgOH and Ag2O,
respectively and AgOH, the short-lived intermediate, is the transition form of
Ag2O. One cathodic peak, the counterpart of the three anodic peaks, 0.38 V,
due to reduction of Ag2O to Ag form is observed in the following negative
sweep.
The CVs were used for the estimation of the electrochemically
active surface area (ECSA) of the synthesized Ag/C catalyst in alkaline
medium. The ECSA of the Ag/C electrodes was measured by determining the
coulombic charge (Q) for the reduction of Ag2O and using the relation,
ECSA (cm2/mg) = Q (µC/cm
2) / 420 (µC/cm
2) x L (mg/cm
2)
Where, Q is the coulombic charge, 420 (µC/cm2) is assumed to be the charge
required for the reduction of Ag2O monolayer and L is the catalyst loading.
The value of ECSA for Ag/C was found to be 56 m2/g.
The stability (durability) of the Ag/C catalyst was determined using
cyclic voltammetry with 100 continuous cycles in 0.5M KOH solution. The
electrode didn’t show any significant current decrement and hence the
prepared catalyst has good stability towards long run.

113
3.2.2 Pd-Ni/C Catalyst
3.2.2.1 X-ray diffraction studies
10 20 30 40 50 60 70 80
Ni(200
)
Ni(111)
Pd
(111)
Pd(2
00)
C(0
02)
(e)
(d)
(c)
(b)
(a)
Inte
nsit
y (
a.u
)
2 (O)
Figure 3.15 XRD patterns of (a) 1:1 wt %, (b) 1:3 wt %, (c) 1:5 wt %,
(d) 1:7 wt % and (e) 1:10 wt % of as synthesized Pd-Ni/C
catalyst
The XRD patterns of Pd-Ni/C catalysts with different weight
percentage of metal loading are depicted in Figure 3.15. All of them displayed
a typical face-centered cubic (fcc) pattern. The five major diffraction peaks
have been observed at 2 values of 25.2 , 39.9 , 45.9 , 46.17 and 51.8 . The
intense C (002) diffraction peak corresponds to graphite phase (JCPDS file:
25-0284). The diffraction peaks Pd (111) and (200) corresponding to 2 =
39.9 and 45.9 , respectively indicate the presence of Pd in the Pd-Ni on the
carbon support (JCPDS file: 05-0681) while the peaks corresponding to 2 =
46.17 and 51.8 have the signature of Ni (111) and (200) planes of Ni (JCPDS
file: 04-0850) in the carbon support. The different XRD patterns in Figure (c)
to (e) at around 35 - 45 suggests that the presence of H2O in the NaBH4
reduction process will facilitate the formation of Ni(OH)2 phase. The average
particle sizes calculated based on Pd (200) peak using Debye-Scherrer

114
formula, are 3.9 nm in 1:1 wt %, 4.3 nm in 1:3 wt %, 4.8 nm in 1:5 wt %, 5.4
nm in 1:7 wt % and 6.1 nm in 1:10 wt %.
3.2.2.2 UV-visible diffuse reflectance spectra
The UV-visible diffuse reflectance spectra of the as prepared 1:1 wt
% and 1:10 wt % of Pd-Ni/C catalysts are shown in Figure 3.16. There were
no significant difference observed between the above two samples. Four
overlapped bands centered at about 224, 240, 440 and 650 nm can be
identified in the two samples. There were absorption bands between 350 and
650 nm. They were assigned to surface plasma resonance band of palladium
particles. The absorption bands at 224 and 240 nm correspond to the
absorption of palladium particles. The differences in absorption bands are due
to different size and shape of Pd and Ni particles. There is an absorption band
close to 240 nm, which may be assigned to Pd and Ni in very small
dimensions. In other words, the absorption bands detected over the catalysts
described in the study at about 224 nm and 240 nm can be attributed to small
size cationic particles and Pd-Ni particles, respectively.
200 300 400 500 600 700
(b)
(a)
Ab
so
rban
ce (
a.u
)
Wavelength (nm)
Figure 3.16 UV-Vis diffuse reflectance spectra of as-prepared Pd-Ni/C
catalysts (a) 1:1 wt % and (b) 1:10 wt %

115
3.2.2.3 Raman spectroscopy
Figure 3.17 shows the Raman spectra of 1:1 and 1:10 Pd-Ni/C
catalysts. Both the samples (1:1 wt % and 1:10 wt % Pd-Ni/C) exhibited two
distinct bands appearing at around 1350 cm-1
(D-band) and 1575 cm-1
(G-
band). The D-band and G-band reflect the structure of sp3 and sp
2 hybridized
carbon atom, indicating disordered graphite and the order state on the Pd-Ni/C
surfaces, respectively. Therefore the degree of the graphitization of Pd-Ni/C
can be quantified by the intensity of ratio of the D to G bands. The peak
intensity ratios (ID/IG) are 0.62 and 0.54 for the 1:1 wt % and 1:10 wt % of
Pd-Ni/C respectively. High ID/IG ratio indicates that the sample contains high
quantities of amorphous carbon impurities. However, in our case, the ID/IG
ratios obtained were of low value implying that the prepared catalysts
possessed good electrical conductivity and corrosion resistance.
Figure 3.17 Raman spectra of Pd-Ni/C catalyst of (a) 1:1 wt % and
(b) 1:10 wt %

116
3.2.2.4 Scanning electron microscopy
Figure 3.18 illustrates SEM images of 1:1 wt % (a, b and c) and
1:10 wt % (d, e and f) of Pd-Ni on carbon supported catalysts with different
magnifications. Both the catalysts prepared from reduction method exhibit
spherical like morphology and homogeneously dispersed on Vulcan XC-72
with no remarkable observation of agglomerations. The average size of the
particles distributed on the carbon surface was 4 to 7 nm, which is in good
agreement with XRD results.
Figure 3.18 SEM images of 1:1 wt % (a, b and c) and 1:10 wt %
(d, e and f) carbon supported Pd-Ni/C catalysts with
different magnifications

117
Ni(OH)2 NiO + H2O
3.2.2.5 Thermogravimetric Analysis
0 200 400 600 800
0
20
40
60
80
100
Weig
ht
res
idu
e (
%)
Temperature (OC)
1:1 Pd-Ni/C
1:3 Pd-Ni/C
1:5 Pd-Ni/C
1:7 Pd-Ni/C
1:10 Pd-Ni/C
Figure 3.19 Thermogravimetric curves of as-synthesized Pd-Ni/C
catalysts
Figure 3.19 shows the thermogravimetric graphs for the as
synthesized Pd-Ni/C catalysts with different weight percentage of metal
loading. From this Figure 3.19, it was found that, in all five thermograms
weight loss occurred in three stages. While the first weight loss i.e. around 90
C correspond to the removal of moisture present in the prepared catalyst, the
second weight loss at around 190 to 260 C, is attributed to the dehydration of
Ni(OH)2, according to the following equation (Freitas 2001),
The huge weight loss from 500 to 550 C is the rapid oxidation of
carbon support in air.
3.2.2.6 Cyclic voltammetry
The cyclic voltammograms of bare GCE (a) and 1:10 Pd-Ni/C on
GCE (b) were investigated in 0.5 M KOH solution and is shown in Figure

118
3.20. The bare GCE do not show any oxidation or reduction peak. However,
Pd-Ni/C exhibit anodic sweep at the region of 0.3 - 0.5 V (vs. SCE) due to the
oxidation peak of Ni(OH)2 to NiOOH, and the reduction of NiOOH to
Ni(OH)2 in the cathodic sweep at the region of 0.2- 0.4 V (vs. SCE), and the
reduction of PdO to Pd at around -0.6 V (vs. SCE). Due to the penetration of
hydrogen into the Pd- based bimetallic nanostructures, the ECSA of the Pd-
Ni/C catalyst was calculated by the charge of the reduction region of PdO to
Pd. The value of ECSA for Pd-Ni/C was found to be 62 m2/g.
The stability (durability) of the Pd-Ni/C catalyst was determined
using cyclic voltammetry with 100 continuous cycles in 0.5M KOH solution.
The electrode didn’t show any significant current decrement and hence the
prepared catalyst has good stability towards long run.
-1.0 -0.8 -0.6 -0.4 -0.2 0.0 0.2 0.4 0.6 0.8 1.0
-2.0x10⁻³
-1.5x10⁻³
-1.0x10⁻³
-5.0x10⁻⁴
0.0
5.0x10⁻⁴
(b)
(a)
Cu
rre
nt
(A)
Potential (V vs SCE)
Figure 3.20 Cyclic voltammograms of (a) bare GCE and (b) Pd-Ni/C
modified GCE in 0.5 M KOH
Other catalysts such as Pt/C and Pt-Ru/C purchased from Arora
Mathey were also characterized. The ECSA was found to be 74 and 68 m2/g
for Pt/C and Pt-Ru/C respectively.

119
3.3 SINGLE CELL PERFORMANCE OF AMFC WITH QPSEBS
AND AMI-7001
The electrochemical single cell (25 cm2 cell area) performance of
QPSEBS and commercially available anion exchange membrane namely,
AMI-7001 is shown in Figures 3.21 and 3.22. The optimized parameter for
alkaline membrane fuel cell performance is depicted in the Table 3.1 and was
common for all the fuel cell performance studies.
Table 3.1 Experimental conditions for MEA and AMFC operation
AMFC Anode Cathode
Catalyst Pt/C Pt/C or Ag/C or Pd-Ni/C
Catalyst loading (mg/cm2) 0.5 0.375
Active area (cm2) 25 25
Fuel/Oxidant H2 O2
Flow rate (mL/min) 20 40
Relative humidity (%) 77 77
Cell temperature ( C) 60 60
The performance of QPSEBS and AMI-7001 were investigated
using three different cathode catalysts namely, Pt/C, Ag/C and Pd-Ni/C with
Pt/C being used as a common anode catalyst for all the three cathode
catalysts. I-V curves showed the improved performance of the QPSEBS
compared to the AMI-7001 membrane, when AMFC was operated at 60 °C.
The open circuit voltage (OCV) for the QPSEBS was found to be 0.74, 0.69
and 0.72 V for Pt/C, Ag/C and Pd-Ni/C cathode catalyst respectively.
However, AMI-7001 exhibits 0.73, 0.67 and 0.72 V for the Pt/C, Ag/C and
Pd-Ni/C cathode catalyst respectively.
In terms of power density, the QPSEBS using Pt/C cathode catalyst
shows maximum power density of 115.2 mW/cm2 at a current density of 320

120
mA/cm2, followed by Pd-Ni/C and Ag/C of 108.8 and 105.6 mW/cm
2
respectively at a current density of 320 mA/cm2. While AMI-7001, exhibit
maximum power density values of 109, 105 and 99 mW/cm2
of Pt/C, Pd-Ni/C
and Ag/C respectively. As a whole in terms of OCV and maximum power
density, QPSEBS have better results when compared to commercially
available anion exchange membrane. Hence QPSEBS are promising
electrolytes for fuel cells.
0 100 200 300 400 500
0.0
0.1
0.2
0.3
0.4
0.5
0.6
0.7
0.8
Pow
er
density (m
W/c
m2)
Cell v
oltage (V)
Current density (mA/cm2)
Pt/C-Pt/C
Pt/C-Ag/C
Pt/C-(Pd-Ni)/C
0
20
40
60
80
100
120
Figure 3.21 Fuel cell performances of QPSEBS using three different
cathode catalysts and Pt/C as the anode catalyst
0 100 200 300 400 500
0.0
0.1
0.2
0.3
0.4
0.5
0.6
0.7
0.8
Pow
er density (m
W/c
m2
)
Cell v
oltage (V)
Current density (mA/cm2)
Pt/C-Pt/C
Pt/C-Ag/C Pt/C-(Pd-Ni/C)
0
20
40
60
80
100
120
Figure 3.22 AMFC performances of AMI-7001 using three different
cathode catalysts and Pt/C as the anode catalyst

121
3.4 SINGLE CELL PERFORMANCE OF DMAMFC WITH
QPSEBS AND AMI-7001
The electrochemical single cell (25 cm2 cell area) performance of
QPSEBS and commercially available anion exchange membrane namely
AMI-7001 is shown in Figure 3.23. The optimized parameter for DMAMFC
performance is depicted in the Table 3.2 and is common for all the fuel cell
performance studies.
Table 3.2 Experimental conditions for MEA and DMAMFC operation
DMAMFC Anode Cathode
Catalyst Pt-Ru/C Pt/C
Catalyst loading (mg/cm2) 0.5 0.375
Active area (cm2) 25 25
Fuel/Oxidant CH3OH (2M) O2
Flow rate (mL/min) 20 40
Relative humidity (%) 77 77
Cell temperature ( C) 60 60
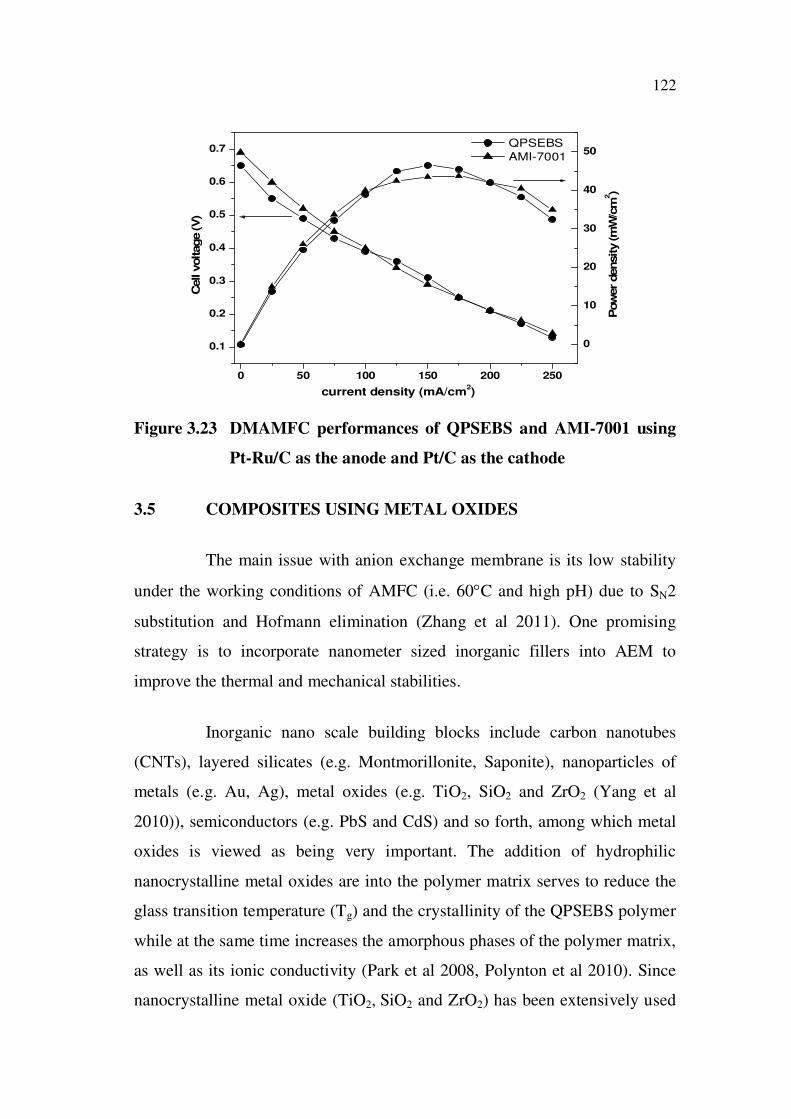
The performance of QPSEBS and AMI-7001 were investigated
using Pt-Ru/C and Pt/C as the anode and cathode catalyst respectively. I-V
curves showed the improved performance of the QPSEBS compared to the
AMI-7001 membrane, when DMAMFC is operated at 60 °C. The OCV of
QPSEBS was found to be 0.65 V and the maximum power density of 46.5
mW/cm2 was achieved at a current density of 150 mA/cm
2, whereas AMI-
7001 possess OCV of 0.69 V and the maximum power density value of 43.75
mW/cm2 at 60 C. Hence QPSEBS was preferably used in DMAMFC too.
122
0 50 100 150 200 250
0.1
0.2
0.3
0.4
0.5
0.6
0.7
Pow
er density (m
W/c
m2)
Cell
voltage (V
)
current density (mA/cm2)
QPSEBS
AMI-7001
0
10
20
30
40
50
Figure 3.23 DMAMFC performances of QPSEBS and AMI-7001 using
Pt-Ru/C as the anode and Pt/C as the cathode
3.5 COMPOSITES USING METAL OXIDES
The main issue with anion exchange membrane is its low stability
under the working conditions of AMFC (i.e. 60 C and high pH) due to SN2
substitution and Hofmann elimination (Zhang et al 2011). One promising
strategy is to incorporate nanometer sized inorganic fillers into AEM to
improve the thermal and mechanical stabilities.
Inorganic nano scale building blocks include carbon nanotubes
(CNTs), layered silicates (e.g. Montmorillonite, Saponite), nanoparticles of
metals (e.g. Au, Ag), metal oxides (e.g. TiO2, SiO2 and ZrO2 (Yang et al
2010)), semiconductors (e.g. PbS and CdS) and so forth, among which metal
oxides is viewed as being very important. The addition of hydrophilic
nanocrystalline metal oxides are into the polymer matrix serves to reduce the
glass transition temperature (Tg) and the crystallinity of the QPSEBS polymer
while at the same time increases the amorphous phases of the polymer matrix,
as well as its ionic conductivity (Park et al 2008, Polynton et al 2010). Since
nanocrystalline metal oxide (TiO2, SiO2 and ZrO2) has been extensively used

123
as a composite material due to its outstanding physical and chemical
properties they were incorporated into the QPSEBS and their properties were
evaluated. Metal oxides are usually used in the form of nanoparticles due to
its high surface area, activity and excellent chemical stability. Also the
mechanical properties of the QPSEBS/metal oxides composite membrane are
greatly enhanced, when nano filler is used as a stiffener material. The thermal
property, dimensional stability and swelling ratio could also be improved.
Therefore quaternized polymer/metal oxide composites have attracted
substantial academic and industrial interest.
3.6 QPSEBS/TiO2 COMPOSITE MEMBRANES
Nanocrystalline anatase TiO2 has been successfully prepared by the
sol–gel method and the characterization results TiO2 and composites of
QPSEBS/TiO2 are discussed here.
3.6.1 Characterization of TiO2
4000 3500 3000 2500 2000 1500 1000 500
0
20
40
60
80
100
% T
ransm
itta
nce (A
.U)
Wave number (cm-1)
Figure 3.24 FTIR spectrum of as synthesized TiO2

124
FTIR spectrum of prepared TiO2 nanoparticles is shown in Figure
3.24. The spectroscopic band is observed around the 3500 cm-1
, which is
ascribed to the stretching vibration of the hydroxyl group (Ti–OH) of the TiO2
nanoparticles. A broad absorption band between 500 and 1000 cm-1
are
ascribed to the vibration absorption of the Ti–O–Ti linkages in TiO2
nanoparticles (Hashimoto et al 2006). The peak at 1640 cm1 is attributed to
adsorbed water.
10 20 30 40 50 60 70 80
0
50
100
150
200
250
300
350
(21
5)
(22
0)
(116
)
(204
)
(21
1)
(10
5)
(200
)
(101
)
(004
)
Inte
nsi
ty (
A.
U)
2 (O)
Figure 3.25 XRD pattern of as synthesized TiO2
The XRD pattern of bare TiO2 nanoparticles is shown in Figure
3.25. The peaks were rather sharp indicating that the obtained TiO2 had high
crystallinity which was attributed to the anatase phase while the crystal size
was determined to be 16 nm from the peak of 1 0 1 plane reflection using
Sherrer’s equation.
TGA profile of synthesized TiO2 is shown in Figure 3.26. The
sample was heated in nitrogen at a heating rate of 10 C min1. The TGA

125
curve exhibits three weight losses associated with endothermic and
exothermic events in the DTA curve. The first endothermic event occurring
around 120 °C corresponds to the elimination of adsorbed water. The
following two exothermic events at 220 °C and 430 °C were due to the
volatilization and combustion of residual organic species. Another peak in the
DTA curve starting at 690 °C, approximately, corresponds to the
crystallization of the amorphous residue into anatase, whereas that around 720
°C indicates the phase transition anatase-rutile. There are no associated
signals with these latter thermal events in the TGA curve confirming the
crystallization and phase transition events.
0 200 400 600 800 1000
88
90
92
94
96
98
100
Temperature (OC)
Weig
ht
resid
ue (
%)
0.00
0.02
0.04
0.06
0.08
0.10
0.12
Deri
v. w
eig
ht
(% /
OC
)
Figure 3.26 TGA-DTA curve of TiO2
Figure 3.27 shows a TEM image of anatase TiO2 nanoparticles
calcined at 500 C. The nanoparticles have a spherical morphology with an
average diameter of 15 nm, which is in good agreement with the XRD
evaluation.

126
Figure 3.27 TEM image of as synthesized TiO2
Figure 3.28 (a) and (b) shows the SEM images of anatase TiO2
nanoparticles calcined at 500 C with two different magnifications (10 and 5
m). The nanoparticles have a spherical morphology with an average
diameter of 15 nm, which is in good agreement with the XRD evaluation.
Figure 3.28 SEM images of as synthesized TiO2

127
3.6.2 Characterization of QPSEBS/TiO2 Composite Membranes
3.6.2.1 Water absorption, ion exchange capacity and ionic
conductivity
Water uptake of QPSEBS and QPSEBS/TiO2 nano composite
membranes are shown in Table 3.3. Water absorption capacity depends on the
number of ion exchange groups and nature of nano fillers present in the
membrane. The water absorption of the composite membrane increased with
increase in titania content upto 7.5 wt %. The reason was inorganic fillers
present in a composite bind larger amount of water molecules with the
membrane via. its hygroscopic effect. The voids or cavities which are present
in the inorganic fillers influence higher amount of water absorption and
tightly pack the water molecules in its voids. The higher amount of water
molecules present in the membrane humidifies the polymeric channels which
in turn favors the lower humidity operation and also circumvents the usage of
a humidifier. Though the operational temperature of fuel cell exceeds 100 C,
a tight packing of water molecules achieved via. nanofillers influences water
retention of the composite membrane.
In principle, ion exchange capacity (IEC) in an ionic-conductive
membrane usually reflects the amount of exchangeable groups in the
membrane, and a relatively high IEC is normally correlative to a higher ionic
conductivity (Wang et al 2010). Experimental IEC values of the QPSEBS and
composite membranes were calculated by back titration method. IEC can
provide information on the density of ionizable functional group in the
membrane. The IEC (Table 3.3) decreased with increase in the content of
titania.
Ionic conductivity is defined as the capability of the transportation
of ions which determines the power generation of a fuel cell. On introducing

128
the quaternary ammonium groups in to the polymer chain, the hydroxyl ion
conducting ability was introduced. Impedance value measurement of ion
exchange membranes at room temperature and 100% humidity was taken. To
examine the conductivity, the quaternized membrane and corresponding
composite membranes were first soaked in 1M KOH solution for 24 h to
convert in to OH form and then it was washed several times with deionized
water. After the free KOH was completely removed, the conductivity of the
membrane was measured. The conductivity values are shown in Table 3.3.
The ionic conductivity of the membrane increases with increase in the
inorganic filler content. This may due to the higher amount of water
molecules adsorbed by the nanofillers that promote the Grothus and vehicle-
type mechanisms. A higher amount of adsorbed water molecules solvate the
moieties of a polymer to a greater extent and has become responsible for the
higher ionic conductivity. The composite membrane with 7.5 wt % TiO2
shows the higher conductivity of 1.78x10⁻²
S cm-1
at 100% hydrated
condition, among all the studied membranes.
Table 3.3 Water absorption, IEC and conductivity values of
QPSEBS/TiO2 composite membranes
Membrane Water
absorption, %
IEC, meq/g Conductivity,
S/cm
AMI-7001 17 1.3 1.72 x 10⁻²
QPSEBS 4.04 0.958 1.51 x 10⁻²
QPSEBS/2.5% TiO2 7.28 0.943 1.63 x 10⁻²
QPSEBS/5% TiO2 9.17 0.928 1.69 x 10⁻²
QPSEBS/7.5% TiO2 11.32 0.906 1.78 x 10⁻²
QPSEBS/10% TiO2 10.09 0.891 1.74 x 10⁻²

129
3.6.2.2 Methanol permeability and selectivity ratio
Table 3.4 Methanol permeability and selectivity ratio of
QPSEBS/TiO2 composite membranes
Membrane Methanol permeability,
cm2/s
Selectivity ratio,
Ss/cm3
AMI-7001 2.25 x 10⁻⁶
0.76 x 10⁴
QPSEBS 2.14 x 10⁻⁶
0.71 x 10⁴
QPSEBS/2.5% TiO2 2.06 x 10⁻⁶
0.79 x 10⁴
QPSEBS/5% TiO2 1.87 x 10⁻⁶
0.90 x 10⁴
QPSEBS/7.5% TiO2 1.76 x 10⁻⁶
1.01 x 10⁴
QPSEBS/10% TiO2 1.75 x 10⁻⁶
0.99 x 10⁴
Methanol permeability is the product of the diffusion coefficient
and sorption coefficient in which the diffusion coefficient reflects the effect of
a surrounding environment on the molecular motion of the permanent and the
sorption coefficient correlates the concentration of a component in the fluid
phase (Gnanakumar et al 2008; Marx et al 2002).
Ionic conductivity and methanol permeability are the two
electrochemical properties which determine the efficiency of DMAMFC.
When the quaternized polymer membrane contacts with an aqueous medium,
OH- ions can combine with water molecules and form a complex. Quaternary
ammonium group create effective path ways for the transportation of ions.
But at the mean while, methanol molecule can also permeate through the
broad hydrophilic channels which are created for the ions migration (Cho et al
2006, Kim et al 2006). So a considerable effort has to be devoted to achieve
high ionic conductivity and lower methanol permeability for the high
efficiency of DMAMFC performance.

130
Low methanol permeability is an important requirement for a
membrane in direct methanol alkaline membrane fuel cells. The results of
methanol permeability of the composite membranes based on QPSEBS/TiO2
are shown in Table 3.4. It is evident from the Table 3.4 that the methanol
permeability decreases on the incorporation of TiO2 in the quaternized
polymer matrix. It is known that methanol permeates through hydrophilic
ionic channels and that OH- ions are transported by hopping between ionic
sites. Therefore, it could be explained that the methanol permeability
decreases due to the incorporation of titania acting as material for blocking
the methanol transport while ionic conductivity is increased.
The ionic conductivity, methanol permeability and selectivity ratio
evaluates the membranes for the application of DMAMFC (Hickner et al
2006). A higher selectivity ratio is favored for the DMAMFC operation. The
membrane QPSEBS/7.5% TiO2 exhibited a high selectivity of 1.01 x 10⁴
Ss/cm3 which is greater than that of AMI-7001 membrane and can have a
great impact on direct methanol alkaline membrane fuel cells field.
3.6.2.3 Hydrolytic and alkaline stability
The property of IEC was measured after the hydrolytic and alkaline
stability tests. The loss of IEC obtained were found to be only 1.25, 1.02,
1.18, 1.55 and 1.23% for QPSEBS, QPSEBS/2.5% TiO2, QPSEBS/5% TiO2,
QPSEBS/7.5% TiO2 and QPSEBS/10% TiO2 respectively. Hence, these
results clearly revealed that the prepared composite membranes possess good
mechanical and chemical stability for use in fuel cells.

131
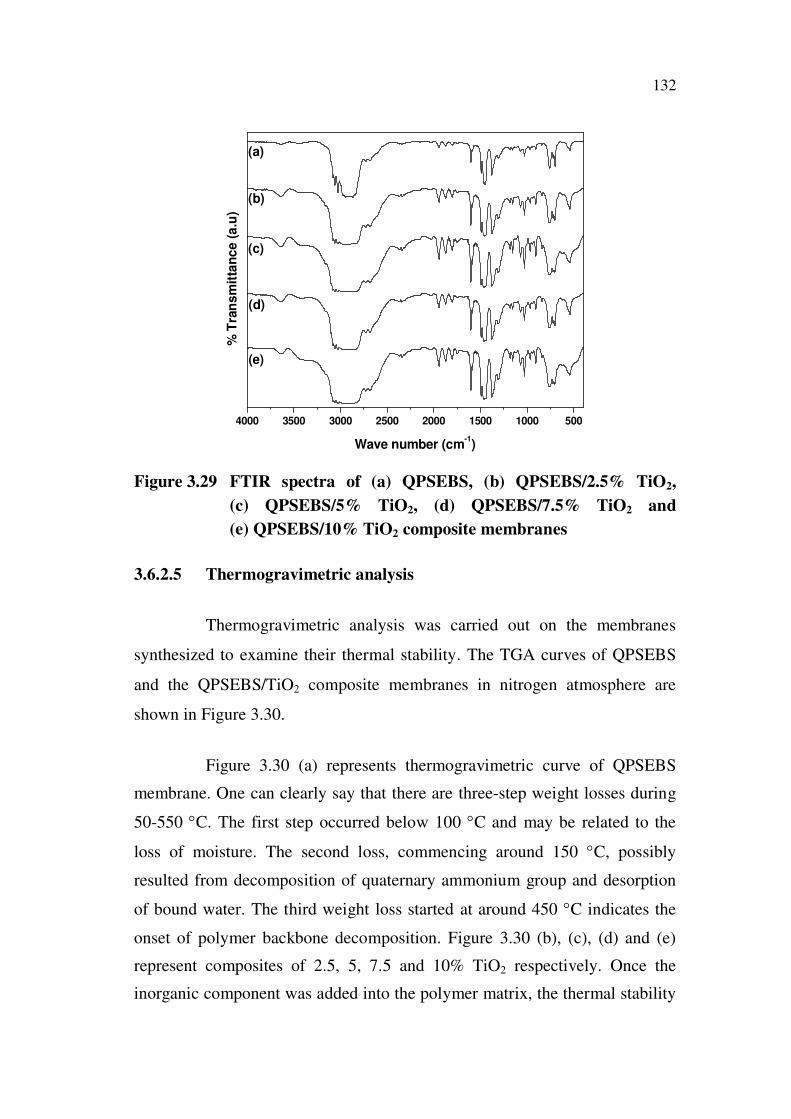
3.6.2.4 Fourier transform infra red
Due to quaternization reaction, the IR bands of aromatic ring C=C
and aromatic ring backbone –CH- bending vibration were observed to a lower
frequency around 1600 cm-1
and 1371 cm-1
. In this reaction, tri ethylamine
was used to form the quaternized product. IR bands for tertiary amine cannot
be seen in the spectrum. Appearance of peak around 1371 cm-1
was assigned
to C-N stretching vibration. In addition to that (Figure 3.29 (a)), a small
intense peak at 2365 cm-1
has been appeared which is the characteristic
absorption peak of quaternary ammonium group. From all these evidences, it
is clear that chloromethylation and quaternization reactions have been
successfully carried out in the PSEBS unit at phenyl rings.
But in the case of composite membranes (Figure 3.29 (b-e)), there
is not much change in the IR spectra. However, in the spectra of
QPSEBS/TiO2 composites the peaks at 1630 cm-1
is responsible for
adsorptive peak of anatase TiO2 and the peak at 3400 cm-1
is due to the –OH
stretching vibration band, which confirms the water molecule adsorbed in
TiO2. The peak beyond 3500 cm-1
is due to moisture absorbance. It can be
clearly seen that on increasing the content of titania filler the intensity broad
peak also increased due to the hydrophilic nature of titania. These
observations clearly reveal that TiO2 has strongly bound to the polymer
matrix.
132
4000 3500 3000 2500 2000 1500 1000 500
(c)
(e)
(d)
(b)
(a)
% T
ran
sm
itta
nc
e (
a.u
)
Wave number (cm-1)
Figure 3.29 FTIR spectra of (a) QPSEBS, (b) QPSEBS/2.5% TiO2,
(c) QPSEBS/5% TiO2, (d) QPSEBS/7.5% TiO2 and
(e) QPSEBS/10% TiO2 composite membranes
3.6.2.5 Thermogravimetric analysis
Thermogravimetric analysis was carried out on the membranes
synthesized to examine their thermal stability. The TGA curves of QPSEBS
and the QPSEBS/TiO2 composite membranes in nitrogen atmosphere are
shown in Figure 3.30.
Figure 3.30 (a) represents thermogravimetric curve of QPSEBS
membrane. One can clearly say that there are three-step weight losses during
50-550 C. The first step occurred below 100 C and may be related to the
loss of moisture. The second loss, commencing around 150 C, possibly
resulted from decomposition of quaternary ammonium group and desorption
of bound water. The third weight loss started at around 450 C indicates the
onset of polymer backbone decomposition. Figure 3.30 (b), (c), (d) and (e)
represent composites of 2.5, 5, 7.5 and 10% TiO2 respectively. Once the
inorganic component was added into the polymer matrix, the thermal stability

133
of the composite membranes was synergistically enhanced. Only one weight
loss occurred for all the weight percentage of the composite membranes and
hence the percentage content of TiO2 determines the thermal stability of the
composite membranes.
Figure 3.30 Thermogravimetric curves of (a) QPSEBS, (b) QPSEBS/2.5%
TiO2, (c) QPSEBS/5% TiO2, (d) QPSEBS/7.5% TiO2 and
(e) QPSEBS/10% TiO2 composite membranes
3.6.2.6 Differential scanning calorimetry
The DSC traces of QPSEBS and 2.5, 5, 7.5 and 10% TiO2 loaded
QPSEBS are shown in Figure 3.31 (a-e). In all the traces, there is a broad
endotherm between 30-100 C due to desorption of polymer entrapped
solvent. The Tg value for QPSEBS (Figure 3.31a) was found to be 150 C,
whereas the composite membranes (i.e. inorganic filler incorporated
QPSEBS), it was around 120 C. The decrease in the Tg value could be
attributed to the addition of titania fillers in the polymer matrix. Hence a
moderate Tg value obtained for composite membranes is an evidence for the
adequate thermal property of composite membranes for AMFC application.

134
50 100 150 200 250 300 350 400 450 500 550 600
Exo
(e)
(d)
(c)
(b)
(a)
mW
(m
g)
Temperature (OC)
Figure 3.31 DSC curves for (a) QPSEBS, (b) QPSEBS/2.5% TiO2,
(c) QPSEBS/5% TiO2, (d) QPSEBS/7.5% TiO2 and
(e) QPSEBS/10% TiO2 composite membrane
3.6.2.7 Scanning electron microscopy
The surface morphology has been analyzed from scanning electron
microscope (Figure 3.32). The average particle diameter is found to be less
than 16 nm in all composites. The inorganic particles appear to be well
dispersed in both low and high wt % composites. The filler particles are
distributed relatively in a uniform fashion and the particles are almost
spherical in shape with irregular boundaries. The filler particles are seen to be
clearly embedded in the polymer matrix, which establishes the connectivity of
the composites (Rusu et al 2005). The particle distribution and particle-
polymer matrix reinforcement play vital roles for both tensile and elongation
properties of the composites. The titania particles are dispersed
homogeneously with the interspaces filled with QPSEBS upto 7.5 wt%, while
in the case of 10 wt% TiO2 composite membranes showed formation of
agglomeration on the surface of polymer matrix. This implies that the

135
prepared composite membranes can be expected to perform consistently well
in the AMFCs.
Figure 3.32 SEM images of (a) QPSEBS, (b) QPSEBS/2.5% TiO2,
(c) QPSEBS/5% TiO2, (d) QPSEBS/7.5% TiO2 and
(e) QPSEBS/10% TiO2 composite membranes

136
0% 2.5% 5% 7.5% 10%
0
50
100
150
200
Tensile s
trength
(M
Pa)
TiO2 content
3.6.2.8 Mechanical properties
Figure 3.33 Variation of tensile strength with the addition of titania
The effect of volume fraction of TiO2 on tensile strength and
percentage elongation of the composites is given in Figure 3.33. The tensile
strength of a filled polymer is more difficult to predict because it depends
strongly on polymer filler interactions. Tensile strength is the force required
to pull the composite to the point where it breaks. Specifically the tensile
strength of a material is the maximum amount of tensile stress that it can be
subjected to before failure. The virgin QPSEBS shows a tensile strength of 31
MPa. Tensile strength of the composites increases with increasing TiO2 filler
content, which may be attributed to the titanium oxide enhancement function.
The optimum loaded filler content was found to be 7.5%. The decrease in the
tensile strength at filler concentration above 7.5% could be due to
agglomerate formation which would result in the composite membranes
contributing to initiation of catastrophic failure of the composites on the
application of stress; the evidence for this statement was clearly observed
from the SEM image (Figure 3.32 (e)). Hence this composite membrane was
preferentially used in AMFC applications.

137
3.6.2.9 X-ray diffraction studies
The X-ray diffraction measurement was performed to examine the
crystallinity of the QPSEBS and QPSEBS/TiO2 composite membranes.
Figure 3.34 illustrates the diffraction pattern of the QPSEBS/TiO2 membranes
that were prepared by a blending process with different titania content (wt %).
It is clearly shown that the QPSEBS (Figure 3.34 (b)) polymer exhibits a semi
crystalline structure with a huge peak at a 2 angle of 19-20 . The first broad
peak located at 2 value of 19-20 is noted for all the samples. In composite
membranes, apart from the main peak, a small intense peak that appeared at
2 angle of 25 are attributed to the anatase titania and are assigned to (101),
whereas other anatase peaks were vanished, which clearly indicated that the
prepared inorganic filler was thoroughly mixed with the polymer matrix.
Also, the intensity of the (101) plane increased while increasing the weight
percentage of titania.
Among various samples, the membrane i.e., QPSEBS/7.5% TiO2
shows the lowest peak intensity at a 2 angle of 19-20 , which means that this
membrane has the lowest crystallinity. The low crystallinity reveals that more
amorphous phase exists in this membrane (7.5% TiO2), indicating that the
structure of the membrane is more disordered and QPSEBS and TiO2 are
mixed more uniformly. Good mixing of QPSEBS and TiO2 is useful for the
enhancement of ionic conductivity (Wang et al 2010).

138
10 20 30 40 50 60 70 80
(f)
(e)
(d)
(c)
(b)
(a)
Inte
nsity (A.U
)
2 (O)
Figure 3.34 XRD spectra of (a) TiO2, (b) QPSEBS, (c) QPSEBS/2.5%
TiO2, (d) QPSEBS/5% TiO2, (e) QPSEBS/7.5% TiO2 and
(f) QPSEBS/10% TiO2 composite membranes
The calculated percentage of crystallinity of QPSEBS and
QPSEBS/TiO2 composites is given in Table 3.5. From the Table 3.5, it can be
seen that the percentage crystallinity of the composite decreased upto 7.5 wt
% filler. After that i.e. 10 wt %, there is an increase in percentage of
crystallinity and hence 7.5 wt % TiO2 composite membrane that possess high
amorphous behavior than the rest, has the lowest crystallinity.
Table 3.5 Percentage of crystallinity values of QPSEBS/TiO2
composite membranes
Membrane % of crystallinity
QPSEBS 3.08
QPSEBS/2.5% TiO2 1.23
QPSEBS/5% TiO2 0.79
QPSEBS/7.5% TiO2 0.54
QPSEBS/10% TiO2 0.67

139
3.6.2.10 AMFC performance study
Figure 3.35 AMFC performances of QPSEBS/TiO2 using three different
cathode catalysts namely (a) Pt/C, (b) Ag/C and (c) Pd-Ni/C
The AMFC performance of QPSEBS/TiO2 composite membranes
investigated using three different cathode catalysts namely, Pt/C, Ag/C and
Pd-Ni/C with Pt/C being used as a common anode catalyst for all the three
cathode catalysts is depicted in Figure 3.35. QPSEBS/7.5% TiO2 exhibits
high OCV when compared to the other weight percentage of TiO2 and virgin
QPSEBS. The OCV for the QPSEBS/7.5% TiO2 was found to be 0.84, 0.81
and 0.83 V for Pt/C, Ag/C and Pd-Ni/C cathode catalyst respectively at 60 C.
In terms of power density, the QPSEBS/7.5% TiO2 using Pt/C and
Pd-Ni/C cathode catalysts show maximum power density of 275 mW/cm2
followed by Ag/C of 270 mW/cm2. As a whole in terms of OCV and
maximum power density, QPSEBS/7.5% TiO2 has better results when
140
compared to the other composites and commercially available anion exchange
membrane.
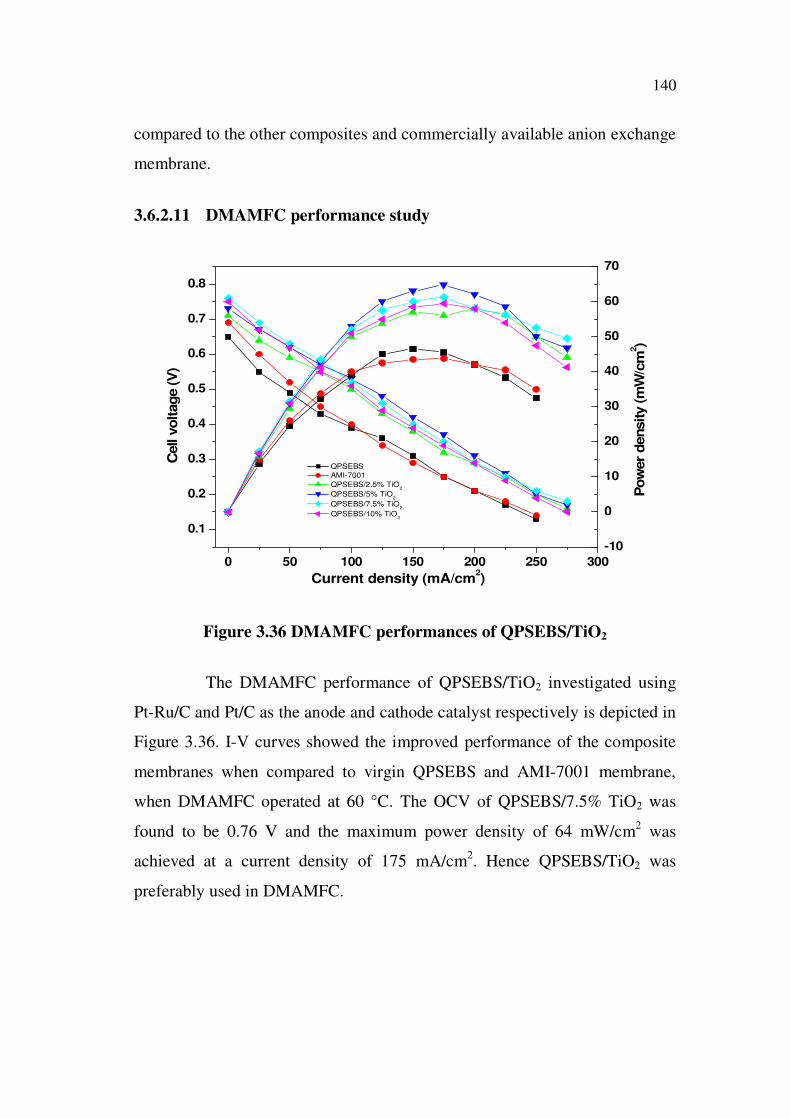
3.6.2.11 DMAMFC performance study
0 50 100 150 200 250 300
0.1
0.2
0.3
0.4
0.5
0.6
0.7
0.8
Pow
er
density (m
W/c
m2)
Cell
voltage (V
)
Current density (mA/cm2)
QPSEBS
AMI-7001
QPSEBS/2.5% TiO2
QPSEBS/5% TiO2
QPSEBS/7.5% TiO2
QPSEBS/10% TiO2
-10
0
10
20
30
40
50
60
70
Figure 3.36 DMAMFC performances of QPSEBS/TiO2
The DMAMFC performance of QPSEBS/TiO2 investigated using
Pt-Ru/C and Pt/C as the anode and cathode catalyst respectively is depicted in
Figure 3.36. I-V curves showed the improved performance of the composite
membranes when compared to virgin QPSEBS and AMI-7001 membrane,
when DMAMFC operated at 60 °C. The OCV of QPSEBS/7.5% TiO2 was
found to be 0.76 V and the maximum power density of 64 mW/cm2 was
achieved at a current density of 175 mA/cm2. Hence QPSEBS/TiO2 was
preferably used in DMAMFC.

141
3.7 QPSEBS/SiO2 COMPOSITE MEMBRANES
3.7.1 Water absorption, Ion Exchange Capacity and Ionic
Conductivity
Table 3.6 Water absorption, IEC and conductivity values of
QPSEBS/SiO2 composite membranes
Membrane Water
absorption, %
IEC, meq/g Conductivity,
S/cm
AMI-7001 17 1.3 1.72 x 10⁻²
QPSEBS 4.04 0.958 1.51 x 10⁻²
QPSEBS/2.5% SiO2 6.82 0.932 1.67 x 10⁻²
QPSEBS/5% SiO2 8.23 0.846 1.73 x 10⁻²
QPSEBS/7.5% SiO2 10.45 0.813 1.81 x 10⁻²
QPSEBS/10% SiO2 11.24 0.784 1.86 x 10⁻²
Water uptake is an important parameter in studying AMFCs,
because the water that resides in the hydrophilic domains facilitates the
transport of OH- ions. However, too much of water uptake will result in loss
of mechanical stability. The water absorption, IEC and conductivity values of
QPSEBS and their composite membranes are shown in Table 3.6. As
expected, the water uptake values increased with increase in the weight
fraction of SiO2 in the QPSEBS membrane. This increase in the water
absorption capacity is due to integrated hygroscopic (silica fillers) materials
into the QPSEBS membranes (Bourlinos et al 2004, Halla et al 2003,
Kanamura et al 2005).
The IEC of the composites decreased with increase in the weight
fraction of SiO2. The decreasing trend may be attributed to the decrease in the
concentration of QPSEBS or in other words decrease in the effective
concentration of the quaternary ammonium groups in the composites.
One of the most important parameter that governs the suitability of
a polymer electrolyte membrane for use in fuel cell is its ionic conducting

142
ability. The ionic conductivity of pristine QPSEBS was found to be 1.51x10⁻²
S/cm. In the case of the composites, there is an increase in the ionic
conductivity with increase in the content of SiO2. This increasing trend can be
explained due to the presence of silica content that acts as Lewis acid sites to
provide extra water to the membrane. Also, membrane ionic conductivity is
affected by the ion concentration and mobility, hydration levels, and polymer
structure or chain mobility (Kreuer et al 2004). To date, the influence of
inorganic silica component on membrane conductivity has been extensively
investigated and debated but there is still no agreement. On one hand, cross-
linked Si–O–Si network may limit the mobility of the conductive ions and
hinder the formation of conductive and hydrophilic ionic clusters and
channels (as found with the perfluorosulfonic acid polymer electrolytes), thus
decreasing the ionic conductivity (Fu et al 2008, Kato et al 2008). On the
other hand, hydroxyl groups (–Si-OH) from silica have strong bonding ability
with H2O molecules, thus favoring water retention and therefore ion transfer
(Kim et al 2004). Hence, the increase in ionic conductivity with the increase
in the content of SiO2 in the present study can be explained due to the
formation of (-Si-OH) from silica.
3.7.2 Methanol Permeability and Selectivity Ratio
Table 3.7 Methanol permeability and selectivity ratio of QPSEBS/SiO2
composite membranes
Membrane Methanol permeability,
cm2/s
Selectivity ratio,
Ss/cm3
AMI-7001 2.25 x 10⁻⁶
0.76 x 10⁴
QPSEBS 2.14 x 10⁻⁶
0.71 x 10⁴
QPSEBS/2.5% SiO2 2.11 x 10⁻⁶
0.79 x 10⁴
QPSEBS/5% SiO2 2.03 x 10⁻⁶
0.85 x 10⁴
QPSEBS/7.5% SiO2 1.89 x 10⁻⁶
0.95 x 10⁴
QPSEBS/10% SiO2 1.82 x 10⁻⁶
1.02 x 10⁴

143
The results of methanol permeability of the composite membranes
based on QPSEBS/SiO2 are depicted in Table 3.7. It is evident from the Table
that the methanol permeability decreases on the incorporation of silica filler in
the quaternized polymer matrix due to incorporation of silica acting as
material for blocking the methanol transport while ionic conductivity is
increased.
The membrane QPSEBS/10% SiO2 exhibited a high selectivity of
1.02 x 10⁴
Ss/cm3 which is greater than that of AMI-7001 membrane and can
have a great impact on direct methanol alkaline membrane fuel cells field.
3.7.3 Hydrolytic and Alkaline Stability
The property of IEC was measured after the hydrolytic and alkaline
stability tests. The loss of IEC was found to be 1 to 1.5% for all the prepared
membranes, which clearly concludes the IEC was not significantly changed,
which means that the prepared QPSEBS/SiO2 composite membranes have
good mechanical and chemical stability.
3.7.4 Fourier Transform Infra Red
In the spectra of QPSEBS/SiO2 (Figure 3.37 b-e) the peaks between
800-1100 cm-1
is responsible for the Si – O – Si chemical bonding. The IR
spectra of QPSEBS/SiO2 composites show the peaks at 1037 and 1087 cm-1
that were slightly shifted from the QPSEBS polymer, which confirms the
interaction between the quaternary ammonium group and silica and also
illustrates an electrostatic interaction, exhibited between the polymer and the
inorganic filler. The peak at 3500 cm-1
is due to moisture absorbance. It can
be clearly seen that on increasing the content of silica filler the intensity of
this peak also increased due to the hydrophilic nature of silica. These
observations clearly reveal that SiO2 has strongly bound to the polymer
matrix.

144
4000 3500 3000 2500 2000 1500 1000 500
(e)
(d)
(c)
(b)
(a)
% T
ransm
itta
nce
Wave number (cm-1)
Figure 3.37 FTIR spectra of (a) QPSEBS, (b) QPSEBS/2.5% SiO2,
(c) QPSEBS/5% SiO2, (d) QPSEBS/7.5% SiO2 and
(e) QPSEBS/10% SiO2 composite membranes
3.7.5 Thermogravimetric Analysis
0 100 200 300 400 500 600 700 800
0
20
40
60
80
100
Temperature (OC )
Weig
ht
res
idu
e (
%)
QPSEBS/SiO2 composites
QPSEBS
Figure 3.38 TGA curves QPSEBS and QPSEBS/SiO2 composite
membranes

145
Figure 3.38 represents thermogravimetric curves of QPSEBS and
its SiO2 composite membranes. QPSEBS membrane exhibits three-step
weight losses during 50-550 C. The first step occurred below 100 C and
may be related to the loss of moisture. The second loss, commencing around
150 C, possibly resulted from decomposition of quaternary ammonium group
and desorption of bound water. The third weight loss that started at around
450 C indicates the onset of polymer backbone decomposition. While in the
case of composite membranes, only one weight loss occurred and this is due
to the addition of silica filler that greatly enhanced the thermal stability.
Hence, the percentage content of SiO2 determines the thermal stability of the
composite membranes.
3.7.6 Differential Scanning Calorimetry
0 50 100 150 200 250 300
(e)
(d)
(c)
(b)
(a)
Exo
mW
/mg
Temperature (OC)
QPSEBS
2.5% SiO2
5.0% SiO2
7.5% SiO2
10.0% SiO2
Figure 3.39 DSC curves of QPSEBS and QPSEBS/SiO2 composite
membranes

146
The DSC traces of QPSEBS and 2.5, 5, 7.5 and 10% SiO2 loaded
QPSEBS are shown in Figure 3.39. In all the traces, there is a broad
endotherm between 30-100 C due to desorption of polymer entrapped
solvent. The Tg value for QPSEBS was found to be 120 C, whereas for the
composite membranes (i.e. inorganic filler incorporated QPSEBS), it was
around 80 C. The decrease in the Tg value could be attributed to the addition
of silica fillers in the polymer matrix. This clearly illustrates that the prepared
membranes can be suitable for low temperature alkaline membrane fuel cells.
3.7.7 Scanning Electron Microscopy
The surface morphology of the QPSEBS and its composite
membranes were investigated by scanning electron microscopy. Figure 3.40
shows the SEM images of QPSEBS and silica fillers incorporated QPSEBS
matrix. Uniform surface was seen in the SEM images of QPSEBS (Figure
3.40(a)) and QPSEBS/SiO2 composite membranes (Figure 3.40(b) to (e)). The
silica material was found to be dispersed uniformly in the quaternized
polymer matrix. There were some white dots in images representing the area
of the SiO2/QPSEBS membranes, and this proves that the silica fillers can be
effectively dispersed when cyclohexane was added via the described solution-
cast method. The improved dispersion is probably because of good mixing
between the inorganic fillers and the QPSEBS.

147
Figure 3.40 SEM images of (a) QPSEBS, (b) QPSEBS/2.5% SiO2,
(c) QPSEBS/5% SiO2, (d) QPSEBS/7.5% SiO2 and
(e) QPSEBS/10% SiO2 composite membranes
3.7.8 Mechanical Properties
The effect of volume fraction of SiO2 on tensile strength of the
composites is given in Figure 3.41. Tensile strength of the composites
increases with increasing SiO2 filler content (upto 7.5%), which may be
attributed to the silicon oxide enhancement function and also specific
interactions between inorganic and organic components. Compared with
previously reported poly phenylene oxide/SiO2 composite membranes (Wu et
al 2010) (tensile strength = 8.2 to 25 MPa), the membranes of the present
work have promising tensile properties with higher level of tensile strength.
An increase in silica content induces an initial increase in tensile strength

148
from 31 to 75.6 MPa. This indicates that optimal silica content enhances
strength but excessive silica contents, destroys homogeneity, and reduces the
membrane strength (Wu et al 2010). The optimum loaded filler content was
found to be 7.5%. The decrease in the tensile strength at filler concentration
above 7.5% could be due to agglomerate formation which would result in the
composite membranes contributing to initiation of catastrophic failure of the
composites on the application of stress.
0% 2.5% 5% 7.5% 10%
0
15
30
45
60
75
Tensile s
trength
(M
Pa)
SiO2 content
Figure 3.41 Variation of tensile strength with the addition of silica
3.7.9 X-Ray Diffraction Studies
The X-ray diffraction measurement was performed to examine the
crystallinity of the QPSEBS and QPSEBS/SiO2 composite membranes
(Figure 3.42). The broad peak located at 2 value of 19-20 is noted for all the
samples.
It can be seen that the peak intensity at 2 = 19-20 of the
QPSEBS/SiO2 composite membranes with different weight percentage of
SiO2 was reduced as compared with that of virgin QPSEBS polymer. Among

149
various samples, the membrane i.e., QPSEBS/10% SiO2 shows the lowest
peak intensity at a 2 angle of 19-20 , which means that this membrane has
the lowest crystallinity. The low crystallinity reveals that more amorphous
phase exists in this membrane (10% SiO2), indicating that the structure of the
membrane is more disordered and QPSEBS and SiO2 are mixed more
uniformly. Good mixing of QPSEBS and SiO2 is useful for the enhancement
of ionic conductivity (Wang et al 2010). The relative degree of amorphous
phase can be estimated from the full-width at half maximum (FWHM) from
the 2 angle of 19-20 peak. The FWHM values of QPSEBS, 2.5, 5, 7.5 and
10 wt% SiO2 membranes are 6.23, 6.98, 7.42, 8.15 and 9.46 respectively.
Apparently, a higher FWHM value corresponding to broadened peak indicates
stronger interaction between QPSEBS and silica filler, which give rise to the
perturbation of long ranged spacing between the chains. Sheng Wen et al
investigated the composite membranes with sulphonated poly ether
sulfone/SiO2. They found that strong hydrogen bonding occurs between the
sulphonated poly ether sulfone and SiO2 and an increase in the amorphous
region abruptly (Wen et al 2010), which is consistent with what we have
observed.
The calculated percentage of crystallinity of QPSEBS and
QPSEBS/SiO2 composites is given in Table 3.8. From the Table, it can be
seen that the percentage crystallinity of the composite decreased with increase
in the silica content. The QPSEBS/10% SiO2 composite membrane exhibits
lowest crystallinity among all the membranes. For fuel cell applications, the
membrane should possess amorphous behavior in other words low
crystallinity because low crystallinity reveals good ionic conductivity. Hence
poor crystallinity gives better performance in fuel cell.

150
10 20 30 40 50 60 70 80
(e)
(d)
(c)
(b)
(a)
Inte
nsit
y (
A. U
)
2 (O)
Figure 3.42 XRD spectra of (a) QPSEBS, (b) QPSEBS/2.5% SiO2,
(c) QPSEBS/5% SiO2, (d) QPSEBS/7.5% SiO2 and
(e) QPSEBS/10% SiO2 composite membranes
Table 3.8 Percentage of crystallinity values of QPSEBS/SiO2
composite membranes
Membrane % of crystallinity
QPSEBS 3.08
QPSEBS/2.5% SiO2 2.23
QPSEBS/5% SiO2 2.16
QPSEBS/7.5% SiO2 1.97
QPSEBS/10% SiO2 1.14

151
3.7.10 AMFC performance study
Figure 3.43 AMFC performances of QPSEBS/SiO2 using three different
cathode catalysts namely (a) Pt/C, (b) Ag/C and (c) Pd-Ni/C
The polarization and power density curves of QPSEBS and the
composite membranes, obtained from the alkaline membrane fuel cell using
Pt as the anode and three different cathode catalysts are presented in Figure
3.43. The measurements were made by feeding hydrogen and oxygen with
flow rate of 20 and 40 mL/min respectively at 60 C. The alkaline membrane
fuel cell with a QPSEBS/10% SiO2 gave better performance than with other
composites, pristine QPSEBS and commercially available AEM. The OCV
for the QPSEBS/10% SiO2 was found to be 0.80, 0.78 and 0.79 V for Pt/C,
Ag/C and Pd-Ni/C cathode catalyst respectively at 60 C.

152
In terms of power density, the QPSEBS/10% SiO2 using Pt/C and
Pd-Ni/C cathode catalysts show maximum power density of 210 and 191
mW/cm2 respectively, followed by Ag/C of 170 mW/cm
2. As a whole in
terms of OCV and maximum power density, QPSEBS/10% SiO2 has better
results when compared to the other composites and commercially available
anion exchange membrane.
3.7.11 DMAMFC performance study
0 50 100 150 200 250 300
0.1
0.2
0.3
0.4
0.5
0.6
0.7
0.8
Po
we
r d
en
sit
y (
mW
/cm
2)
Ce
ll v
olt
ag
e (
V)
Current density (mA/cm2)
QPSEBS AMI-7001
QPSEBS/2.5% SiO2
QPSEBS/5% SiO2
QPSEBS/7.5% SiO2
QPSEBS/10% SiO2
0
10
20
30
40
50
60
70
80
Figure 3.44 DMAMFC performances of QPSEBS/SiO2
The performance of QPSEBS/SiO2 investigated using Pt-Ru/C and
Pt/C as the anode and cathode catalyst respectively is depicted in Figure 3.44.
I-V curves showed the improved performance of the composite membranes
when compared to virgin QPSEBS and AMI-7001 membrane, when
DMAMFC operated at 60 °C. The OCV of QPSEBS/10% SiO2 was found to
be 0.75 V and the maximum power density of 74 mW/cm2 was achieved at a
current density of 225 mA/cm2.

153
3.8 QPSEBS/ZrO2 Composite Membranes
3.8.1 Water Absorption, Ion Exchange Capacity and Ionic
Conductivity
Table 3.9 Water absorption, IEC and conductivity values of
QPSEBS/ZrO2 composite membranes
Membrane Water
absorption, %
IEC, meq/g Conductivity,
S/cm
AMI-7001 17 1.3 1.72 x 10⁻²
QPSEBS 4.04 0.958 1.51 x 10⁻²
QPSEBS/2.5% ZrO2 5.92 0.814 1.63 x 10⁻²
QPSEBS/5% ZrO2 7.24 0.740 1.72 x 10⁻²
QPSEBS/7.5% ZrO2 10.01 0.712 1.79 x 10⁻²
QPSEBS/10% ZrO2 10.56 0.691 1.82 x 10⁻²
Similar trend as observed in QPSEBS/TiO2 and QPSEBS/SiO2, was
observed in the case of QPSEBS/ZrO2 composite membranes also, i.e. water
absorption and conductivity increased with increase in the content of zirconia
while ion exchange capacity reduced with the addition of zirconia. The
maximum ionic conductivity of 1.82 x 10⁻²
S/cm was obtained for
QPSEBS/10% ZrO2 composite membrane.
3.8.2 Methanol Permeability and Selectivity Ratio
The methanol permeability decreased with increase in the content
of zirconia filler and the selectivity ratio increased. All the composite
membranes exhibit higher selectivity ratio values than pristine QPSEBS and
commercially purchased AMI-7001 membranes. Hence, these membranes can
be potentially applicable in direct methanol alkaline membrane fuel cells.
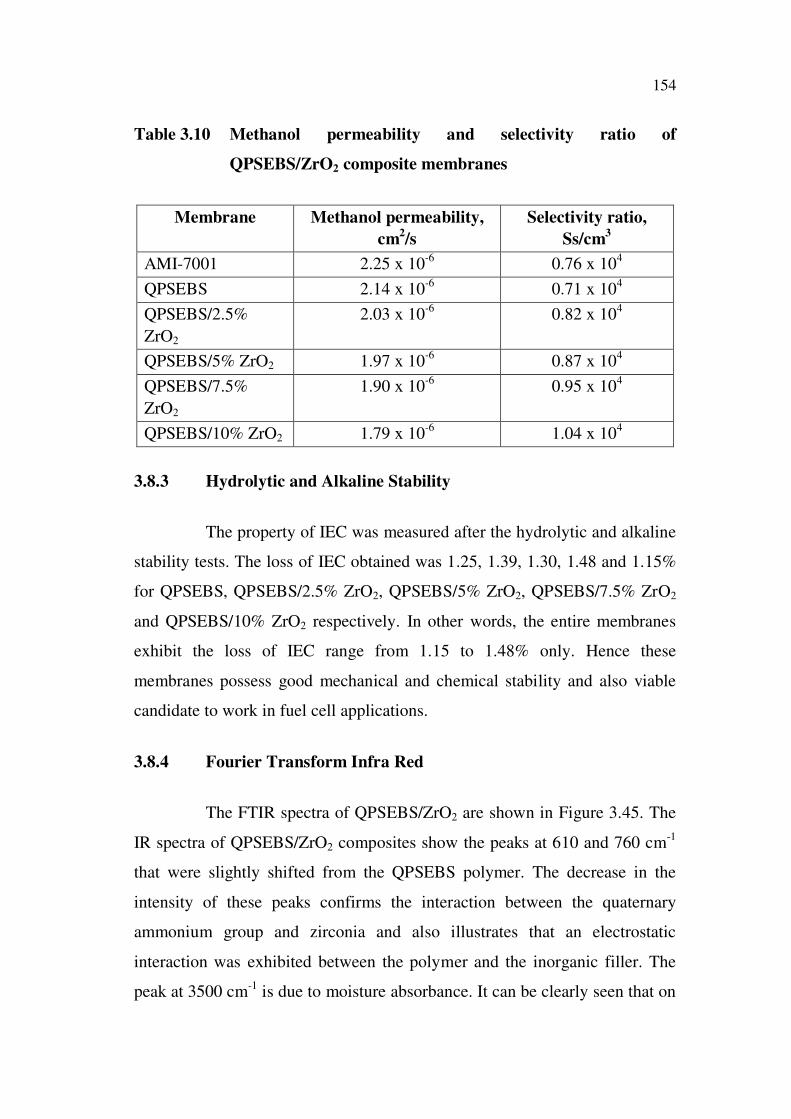
154
Table 3.10 Methanol permeability and selectivity ratio of
QPSEBS/ZrO2 composite membranes
Membrane Methanol permeability,
cm2/s
Selectivity ratio,
Ss/cm3
AMI-7001 2.25 x 10⁻⁶
0.76 x 10⁴
QPSEBS 2.14 x 10⁻⁶
0.71 x 10⁴
QPSEBS/2.5%
ZrO2
2.03 x 10⁻⁶
0.82 x 10⁴
QPSEBS/5% ZrO2 1.97 x 10⁻⁶
0.87 x 10⁴
QPSEBS/7.5%
ZrO2
1.90 x 10⁻⁶
0.95 x 10⁴
QPSEBS/10% ZrO2 1.79 x 10⁻⁶
1.04 x 10⁴
3.8.3 Hydrolytic and Alkaline Stability
The property of IEC was measured after the hydrolytic and alkaline
stability tests. The loss of IEC obtained was 1.25, 1.39, 1.30, 1.48 and 1.15%
for QPSEBS, QPSEBS/2.5% ZrO2, QPSEBS/5% ZrO2, QPSEBS/7.5% ZrO2
and QPSEBS/10% ZrO2 respectively. In other words, the entire membranes
exhibit the loss of IEC range from 1.15 to 1.48% only. Hence these
membranes possess good mechanical and chemical stability and also viable
candidate to work in fuel cell applications.
3.8.4 Fourier Transform Infra Red
The FTIR spectra of QPSEBS/ZrO2 are shown in Figure 3.45. The
IR spectra of QPSEBS/ZrO2 composites show the peaks at 610 and 760 cm-1
that were slightly shifted from the QPSEBS polymer. The decrease in the
intensity of these peaks confirms the interaction between the quaternary
ammonium group and zirconia and also illustrates that an electrostatic
interaction was exhibited between the polymer and the inorganic filler. The
peak at 3500 cm-1
is due to moisture absorbance. It can be clearly seen that on

155
increasing the content of zirconia filler the intensity of this peak also
increased due to the hydrophilic nature of zirconia. These observations clearly
reveal that ZrO2 has strongly bound to the polymer matrix.
4000 3500 3000 2500 2000 1500 1000 500
(c)
(d)
(e)
(b)
(a)
% T
ransm
itta
nce
Wave number (cm-1)
Figure 3.45 FTIR spectra of (a) QPSEBS, (b) QPSEBS/2.5% ZrO2,
(c) QPSEBS/5% ZrO2, (d) QPSEBS/7.5% ZrO2 and
(e) QPSEBS/10% ZrO2 composite membranes
3.8.5 Thermogravimetric Analysis
Figure 3.46 represents thermogravimetric curves of QPSEBS and
QPSEBS/ZrO2 composite membranes. When compared to pristine QPSEBS,
composite membranes exhibit higher thermal stability. Hence, the percentage
content of ZrO2 determines the thermal stability of the composite membranes.
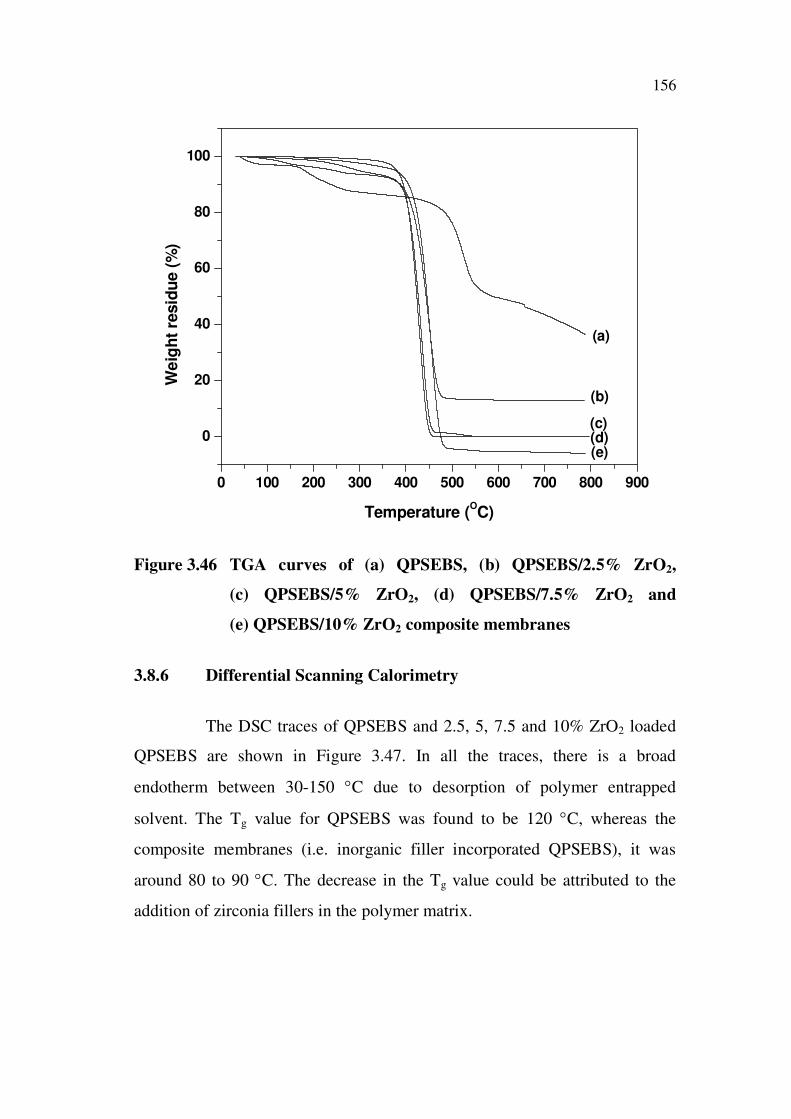
156
0 100 200 300 400 500 600 700 800 900
0
20
40
60
80
100
(e)(d)(c)
(b)
(a)
We
igh
t re
sid
ue (
%)
Temperature (OC)
Figure 3.46 TGA curves of (a) QPSEBS, (b) QPSEBS/2.5% ZrO2,
(c) QPSEBS/5% ZrO2, (d) QPSEBS/7.5% ZrO2 and
(e) QPSEBS/10% ZrO2 composite membranes
3.8.6 Differential Scanning Calorimetry
The DSC traces of QPSEBS and 2.5, 5, 7.5 and 10% ZrO2 loaded
QPSEBS are shown in Figure 3.47. In all the traces, there is a broad
endotherm between 30-150 C due to desorption of polymer entrapped
solvent. The Tg value for QPSEBS was found to be 120 C, whereas the
composite membranes (i.e. inorganic filler incorporated QPSEBS), it was
around 80 to 90 C. The decrease in the Tg value could be attributed to the
addition of zirconia fillers in the polymer matrix.

157
100 200 300 400 500
Exo
(e)
(d)
(c)
(b)
(a)
mW
(m
g)
Temperature (OC)
Figure 3.47 DSC traces of (a) QPSEBS, (b) QPSEBS/2.5% ZrO2,
(c) QPSEBS/5% ZrO2, (d) QPSEBS/7.5% ZrO2 and
(e) QPSEBS/10% ZrO2 composite membranes
3.8.7 Scanning Electron Microscopy
The SEM images of QPSEBS/ZrO2 composite membrane are
shown in Figure 3.48. The electron micrograph shows the adhesion between
the zirconia domains and the polymer matrix is low. In the case of composite
membranes negligible amount of agglomeration was observed on the surface
of the polymer matrix.

158
Figure 3.48 SEM images of (a) QPSEBS, (b) QPSEBS/2.5% ZrO2,
(c) QPSEBS/5% ZrO2, (d) QPSEBS/7.5% ZrO2 and
(e) QPSEBS/10% ZrO2 composite membranes
3.8.8 Mechanical Properties
The tensile strength of the composite membranes incorporated with
various percentages of ZrO2 is shown in Figure 3.49. In general, there is an
improvement in the tensile strength as the inorganic content increases. The
tensile strength of the zirconia incorporated QPSEBS showed an
improvement in the tensile strength as the inorganic content increases. This is
because of the interaction between the polymer and zirconia filler.

159
0% 2.5% 5% 7.5% 10%
0
20
40
60
80
100
Ten
sile s
tren
gth
(M
Pa)
ZrO2 content
Figure 3.49 Variation of tensile strength with the addition of zirconia
3.8.9 X-Ray Diffraction Studies
The XRD patterns of QPSEBS/ZrO2 composite membranes are
shown in Figure 3.50. It can be seen that the peak intensity at 2 = 19-20 is
the QPSEBS/ZrO2 composite membranes with different weight percentage of
zirconia was reduced as compared with that of virgin QPSEBS polymer. In
composite membranes, apart from the main peak, the sharp intense peaks
appeared at 2 angle of 28.11, 50.16 and 55.80 are referred to the zirconia and
are assigned to (111), (022) and (031) facets respectively. Among various
samples, QPSEBS/10% ZrO2 composite membrane shows the lowest peak
intensity at a 2 angle of 19-20 , which means that this membrane has the
lowest crystallinity. The low crystallinity reveals that more amorphous phase
exists in this membrane, indicating that the structure of the membrane is more
disordered and QPSEBS and ZrO2 are mixed more uniformly.

160
10 20 30 40 50 60 70 80
(c)
(e)
(d)
(b)
(a)
Inte
nsit
y (
A. U
)
2 (O)
Figure 3.50 XRD patterns of (a) QPSEBS, (b) QPSEBS/2.5% ZrO2,
(c) QPSEBS/5% ZrO2, (d) QPSEBS/7.5% ZrO2 and
(e) QPSEBS/10% ZrO2 composite membranes
The calculated percentage of crystallinity of QPSEBS and
QPSEBS/ZrO2 composites is given in Table 3.11. From the Table, it can be
seen that the percentage crystallinity of the composite decreased with
increasing content of inorganic filler i.e. ZrO2. At 10 wt % of ZrO2, the
composite became more amorphous and showed low percentage of
crystallinity. For fuel cell applications, the membrane should possess
amorphous behavior in other words low crystallinity because low crystallinity
reveals good ionic conductivity (Wang et al 2010). Hence poor crystallinity
gives better performance in fuel cell.

161
Table 3.11 Percentage of crystallinity values of QPSEBS/ZrO2
composite membranes
Membrane % of crystallinity
QPSEBS 3.08
QPSEBS/2.5% ZrO2 2.45
QPSEBS/5% ZrO2 1.85
QPSEBS/7.5% ZrO2 1.62
QPSEBS/10% ZrO2 1.37
3.8.10 AMFC performance study
Figure 3.51 AMFC performances of QPSEBS/ZrO2 using three different
cathode catalysts namely (a) Pt/C, (b) Ag/C and (c) Pd-Ni/C

162
The polarization and power density curves of QPSEBS and the
composite membranes, obtained from the alkaline membrane fuel cell using
Pt as the anode and three different cathode catalysts are presented in Figure
3.51. The alkaline membrane fuel cell with QPSEBS/ZrO2 composite
membranes gave better performance than that with pristine QPSEBS and
commercially available AEM. The OCV for the QPSEBS/10% ZrO2
composites using Ag/C catalyst exhibit 0.78 V at 60 C.
In terms of power density, the QPSEBS/10% ZrO2 using Ag/C
cathode catalyst exhibit maximum power density of 198 mW/cm2. As a whole
in terms of OCV and maximum power density, QPSEBS/ZrO2 shows better
results and hence could be a strong candidate in alkaline fuel cell applications.
3.8.11 DMAMFC performance study
0 50 100 150 200 250
0.1
0.2
0.3
0.4
0.5
0.6
0.7
0.8
Po
wer
de
nsit
y (
mW
/cm
2)
Cell v
olt
ag
e (
V)
Current density (mA/cm2)
QPSEBS
AMI-7001
QPSEBS/2.5% ZrO2
QPSEBS/5% ZrO2
QPSEBS/7.5% ZrO2
QPSEBS/10% ZrO2
-10
0
10
20
30
40
50
60
70
80
Figure 3.52 DMAMFC performances of QPSEBS/ZrO2

163
The performance of QPSEBS/ZrO2 investigated using Pt-Ru/C and
Pt/C as the anode and cathode catalyst respectively is depicted in Figure 3.52.
I-V curves showed the improved performance of the composite membranes
when compared to virgin QPSEBS and AMI-7001 membrane, when
DMAMFC operated at 60 °C. The OCV of QPSEBS/10% ZrO2 was found to
be 0.71 V and the maximum power density of 69 mW/cm2 was achieved at a
current density of 200 mA/cm2.
3.9 QPSEBS/MWCNT COMPOSITE MEMBRANES
3.9.1 Functionalization and Confirmation of MWCNT
There are two critical issues associated with CNTs, when these
materials are used as reinforcements in polymer composites (Delozier et al
2006). The major problem concerns the aggregation of CNTs into bundles
resulting in weak interfacial bonding between CNTs and the polymer matrix
which leads to a depreciation in the electrical and mechanical properties of the
composites (Xu and Wang 2008). To overcome this problem, it is necessary
to develop a strong interface between the fillers and the polymer, and thus, the
efficiency of the load transfer could be made higher. A widely employed
approach towards this objective reported thus far in the literature is the
surface functionalization of CNTs (Koval’chuk et al 2008, McIntosh et al
2007). Generally, covalent functionalization will introduce defects on the
CNT surface, disrupting the extent of conjugation and adversely impacting
charge carrier mobility in CNTs (Bekyarova et al 2005). However, since
MWCNTs are less prone to bundle than SWCNTs and because it is possible
to functionalize the surface layers only, the conductivity will not be reduced
significantly (Hatton et al 2008).
Carbon nanotubes functionalized with carboxylic acid groups were
confirmed by FT–IR. Figure 3.53 represents FTIR spectra of MWCNT and

164
functionalized MWCNT (f-MWCNT). There are four distinct absorption
peaks at 1564, 2862, 2932 and 3440 cm-1
in Figure 3.53 (b). The spectrum
shows a band around 3440 cm-1
which can be attributed to the hydroxyl group
(-OH). Bands around 2932 and 2850 cm-1
were due to asymmetric and
symmetric C-H stretching. In the acid-functionalized MWCNTs spectrum, the
peak near 1560 cm1 corresponds to the infrared-active phonon mode of the
nanotubes and the peaks at 1740 and 1250 cm1 apparently correspond to the
stretching mode of the carboxylic acid groups. These observations are clear
indications of –COOH groups on the surface of nanotubes.
4000 3500 3000 2500 2000 1500 1000 500
15
64
1250
3440
2862
293
2 17
40
(b)
(a)
% T
ran
sm
itta
nce
Wavenumber (cm-1)
Figure 3.53 FTIR spectra of (a) MWCNT and (b) functionalized MWCNT
Figure 3.54 represents the FE-SEM photographs of as-purchased
MWCNT and f-MWCNT with their corresponding EDAX spectra. Pristine
MWCNTs which have smooth surfaces appeared as large bundles with
lengths in the order of micron and diameters around 10–20 nm. After acid

165
treatment, the f-MWCNTs were disentangled and roughed, and their lengths
were slightly reduced by both the oxidation and ultrasonic treatment. The
same was confirmed through corresponding EDAX spectrum with the
presence of other elements.
Figure 3.54 FE-SEM images of (a) MWCNT, (b) f-MWCNT and their
corresponding EDAX spectra
3.9.2 Characterization of QPSEBS/MWCNT
3.9.2.1 Water absorption, ion exchange capacity and ionic conductivity
Water uptake is an important parameter in studying AMFCs,
because the water that resides in the hydrophilic domains facilitates the
transport of OH- ions. However, too much of water uptake will result in loss
of mechanical stability. The water absorption, IEC and conductivity values of
QPSEBS and their composite membranes are shown in Table 3.12. The IEC

166
of the composites decreased with increase in the weight fraction of f-
MWCNT. The decreasing trend may be attributed to the decrease in the
concentration of QPSEBS or in other words decrease in the effective
concentration of the quaternary ammonium groups in the composites.
As expected, the water uptake values increased with increase in the
weight fraction of f-MWCNT in the membrane. This increase in the water
absorption is due to the incorporation of functionalized (-COOH) MWCNTs.
One of the most important parameter that governs the suitability of
a polymer electrolyte membrane for use in fuel cell is its ion conducting
ability. The ionic conductivity of pristine QPSEBS was found to be 1.51x10⁻²
S/cm. In the case of the composites, there is an increase in the ionic
conductivity with increase in the content of f-MWCNT. This increasing trend
can be explained by looking into the transportation of hydroxyl ions which
was facilitated by the presence of water molecules. The increment in ionic
conductivity was also associated with the acidic site of f-MWCNT in the
presence of water. Hence the ionic conductivity increased with increasing
content of f-MWCNTs.
Table 3.12 Water absorption, IEC and conductivity values of
QPSEBS/f-MWCNT composite membranes
Membrane Water
absorption, %
IEC, meq/g Conductivity,
S/cm
AMI-7001 17 1.3 1.72 x 10⁻²
QPSEBS 4.04 0.958 1.51 x 10⁻²
QPSEBS/2.5% MWCNT 5.78 0.941 1.59 x 10⁻²
QPSEBS/5% MWCNT 6.56 0.908 1.66 x 10⁻²

167
3.9.2.2 Methanol Permeability and Selectivity Ratio
Table 3.13 Methanol permeability and selectivity ratio of QPSEBS/f-
MWCNT composite membranes
Membrane Methanol permeability,
cm2/s
Selectivity ratio,
Ss/cm3
AMI-7001 2.25 x 10⁻⁶
0.76 x 10⁴
QPSEBS 2.14 x 10⁻⁶
0.71 x 10⁴
QPSEBS/2.5% MWCNT 1.97 x 10⁻⁶
0.80 x 10⁴
QPSEBS/5% MWCNT 1.86 x 10⁻⁶
0.89 x 10⁴
Table 3.13 shows the methanol permeability and selectivity ratio of
AMI-7001, QPSEBS and composite membranes. When compared with
QPSEBS, f-MWCNT incorporated QPSEBS shows a remarkable decrement
in the methanol permeability. The resistance to the flow of methanol became
better than QPSEBS and AMI-7001. The pristine QPSEBS and AMI-7001
electrolyte membranes exhibited a selectivity ratio of 0.71 x10⁴ Ss/cm
3 and
0.76 x10⁴ Ss/cm
3 respectively which are lower when compared to QPSEBS/f-
MWCNT composite membranes. It indicates that the QPSEBS/f-MWCNT
composite membranes can be successfully used in DMAMFCs.
3.9.2.3 Hydrolytic and alkaline stability
The property of IEC was measured after the hydrolytic and alkaline
stability tests. The loss of IEC was found to be 1.25 to 1.56% for all the
prepared membranes, which clearly concludes the IEC was not significantly
changed, which means that the prepared QPSEBS/MWCNT composite
membranes have good mechanical and chemical stability.
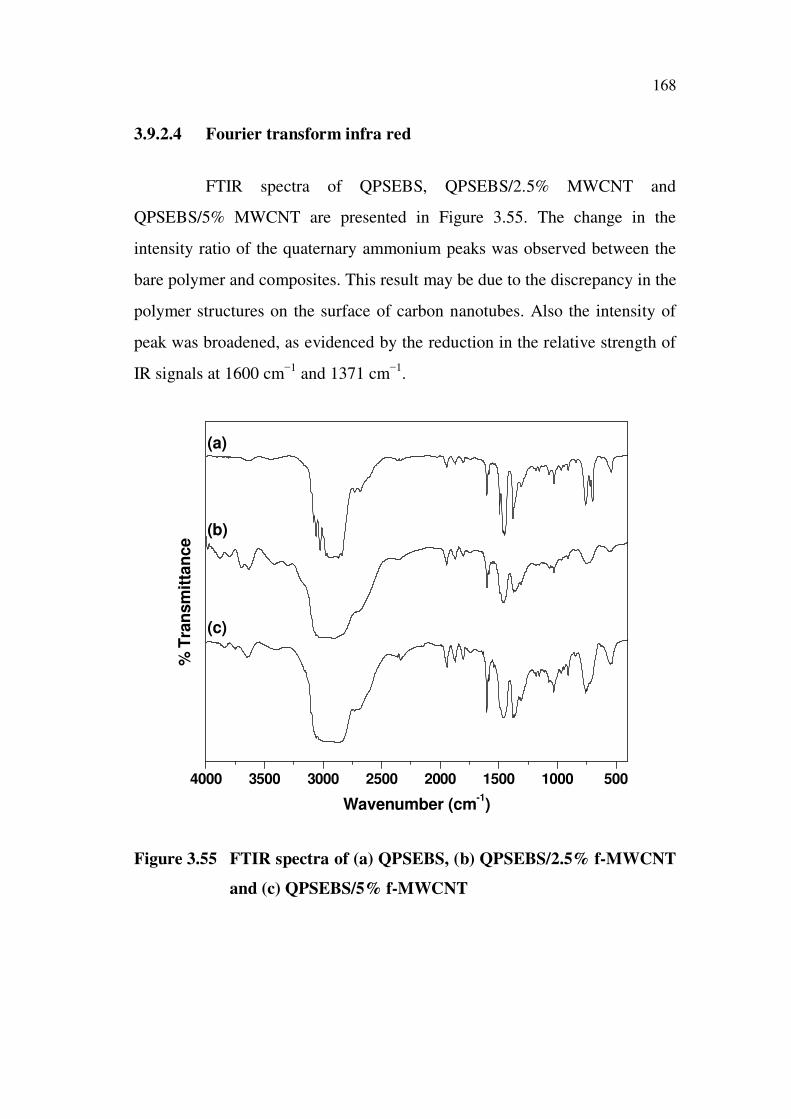
168
3.9.2.4 Fourier transform infra red
FTIR spectra of QPSEBS, QPSEBS/2.5% MWCNT and
QPSEBS/5% MWCNT are presented in Figure 3.55. The change in the
intensity ratio of the quaternary ammonium peaks was observed between the
bare polymer and composites. This result may be due to the discrepancy in the
polymer structures on the surface of carbon nanotubes. Also the intensity of
peak was broadened, as evidenced by the reduction in the relative strength of
IR signals at 1600 cm1 and 1371 cm
1.
4000 3500 3000 2500 2000 1500 1000 500
(c)
(b)
(a)
% T
ran
sm
itta
nce
Wavenumber (cm-1)
Figure 3.55 FTIR spectra of (a) QPSEBS, (b) QPSEBS/2.5% f-MWCNT
and (c) QPSEBS/5% f-MWCNT

169
3.9.2.5 UV-Visible Spectroscopy
200 300 400 500 600 700 800
0
2
4
6
8
10
(b)
(a)
Ab
so
rban
ce
Wavelength (nm)
Figure 3.56 UV-Visible spectra of (a) QPSEBS and (b) QPSEBS/5%
f-MWCNT. Inset is expanded view of (b)
To elucidate the interactions between f-MWCNTs and quaternized
polymer matrix, UV-visible spectra of QPSEBS and QPSEBS/ f-MWCNT
dispersion in cyclohexane solvent were measured (Figure 3.56). UV-Visible
spectroscopy was effectively used for quantitative characterization of the
colloidal stability of f-MWCNT dispersions (Jiang et al 2003) and for the
investigation of dispersion behavior which have correlations with solubility
parameters based on the interactions between filler and polymer (Ham et al
2005). By comparing the relative heights for the peaks at 215 nm and 260 nm,
we can see that the band at 260 nm in the nanocomposite showed a higher
absorption than that in the bare polymer which indicates that there is an
interaction between f-MWCNT and QPSEBS mainly via - bonding
(Baskaran et al 2005, Frehill et al 2005).
250 260 270 280 290 300 310 320 330 340 350
0
1
2
260 nm
Absorb
ance
Wavelength, nm

170
3.5.4.2.6 Thermogravimetric analysis
0 100 200 300 400 500 600 700 800
30
40
50
60
70
80
90
100
110
(c)
(b)
(a)
Weig
ht re
sid
ue (%
)
Temperature (OC)
Figure 3.57 TGA curves of (a) QPSEBS, (b) f-MWCNT and
(c) QPSEBS/5% f-MWCNT
The effect of f-MWCNTs presence on the thermal stability of
QPSEBS composites was studied by means of TGA under N2 atmosphere, as
shown in Figure 3.57. Figure 3.57 (a) represents thermogravimetric curve of
QPSEBS membrane. One can clearly say there are three-step weight losses
during 50-550 C. The first step occurred below 100 C and may be related to
the loss of moisture. The second loss, commencing around 150 C, possibly
resulted from decomposition of quaternary ammonium group and desorption
of bound water. The third weight loss that started around 450 C indicates the
onset of polymer backbone decomposition. Figure 3.57 (b) and (c) represent
pristine MWCNT and 5% f-MWCNT composite respectively. Once the f-
MWCNT was added into the polymer matrix, the thermal stability of the
composite membranes was synergistically enhanced. Only one weight loss

171
occurred for the composite membrane. Hence, the addition of f-MWCNTs
determines the thermal stability of the composite membranes.
3.9.2.7 Scanning electron microscopy
The surface morphology of the QPSEBS and composite membrane
was investigated by scanning electron microscopy. Figure 3.58 shows the
SEM images of 5% f-MWCNT reinforced QPSEBS. The f-MWCNTs were
found to be dispersed uniformly in the quaternized polymer matrix. There
were some white dots in images representing the area of the f-
MWCNTs/QPSEBS membranes, and this proves that the multiwalled carbon
nanotubes can be effectively dispersed when cyclohexane was added via the
described solution-cast method with the f-MWCNTs. The improved
dispersion is probably because of covalent or ionic bond formation between
the carbon nanotubes and the QPSEBS.
Figure 3.58 SEM images of QPSEBS/5% f-MWCNT
3.9.2.8 Mechanical properties
One of the primary reasons for adding inorganic fillers to the
polymer matrix is to improve their mechanical performance; excellent
mechanical properties of polymer nanocomposites are vital for the
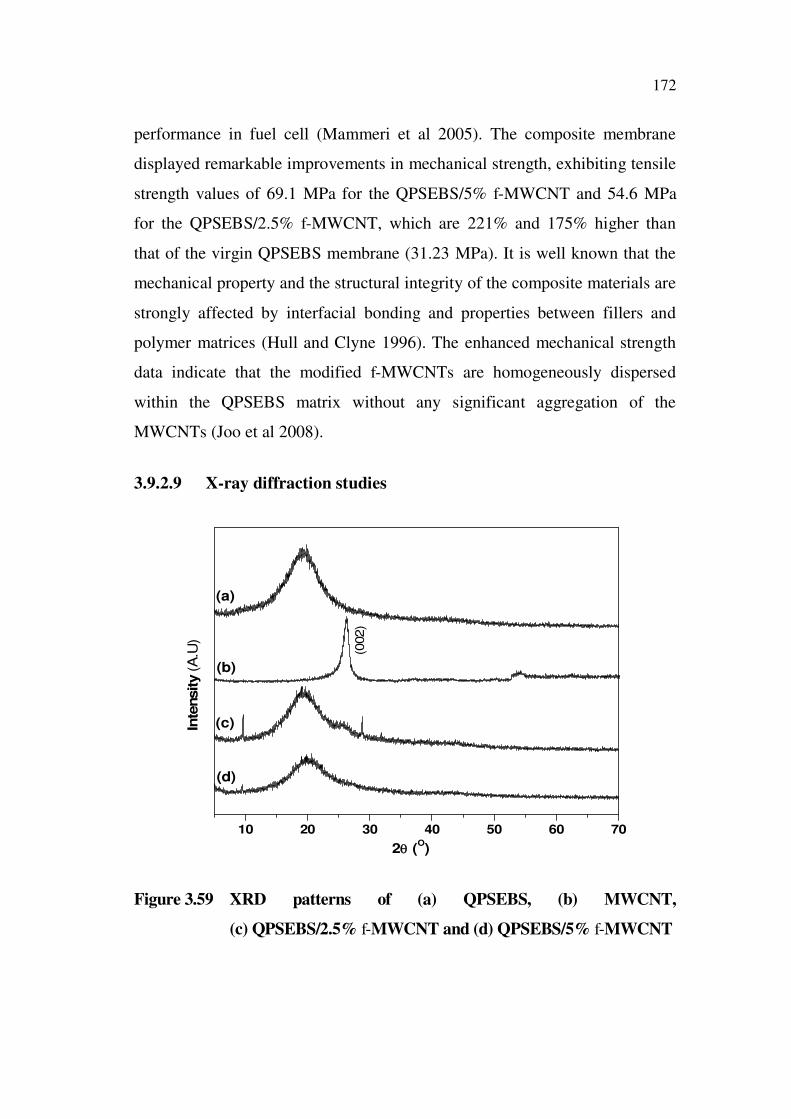
172
performance in fuel cell (Mammeri et al 2005). The composite membrane
displayed remarkable improvements in mechanical strength, exhibiting tensile
strength values of 69.1 MPa for the QPSEBS/5% f-MWCNT and 54.6 MPa
for the QPSEBS/2.5% f-MWCNT, which are 221% and 175% higher than
that of the virgin QPSEBS membrane (31.23 MPa). It is well known that the
mechanical property and the structural integrity of the composite materials are
strongly affected by interfacial bonding and properties between fillers and
polymer matrices (Hull and Clyne 1996). The enhanced mechanical strength
data indicate that the modified f-MWCNTs are homogeneously dispersed
within the QPSEBS matrix without any significant aggregation of the
MWCNTs (Joo et al 2008).
3.9.2.9 X-ray diffraction studies
10 20 30 40 50 60 70
(002)
(d)
(c)
(b)
(a)
Inte
nsity (A
.U)
2 (O)
Figure 3.59 XRD patterns of (a) QPSEBS, (b) MWCNT,
(c) QPSEBS/2.5% f-MWCNT and (d) QPSEBS/5% f-MWCNT

173
In order to confirm the influence of multiwalled carbon nanotubes
on the crystal structure of QPSEBS, XRD spectra of MWCNTs, bare
polymer, and nanocomposites of 2.5% f-MWCNTs and 5% f-MWCNTs were
studied (Figure 3.59). Diffraction pattern of MWCNTs is characterized by a
strong peak at 2 = 25.9 which is ascribed to the graphite-like structure. In
the spectrum of bare polymer, a broad peak at 2 = 19-20 represents the
crystalline nature of the polymer. The addition of f-MWCNTs into the
polymer matrix did not cause a discernible change in the lattice structure of
QPSEBS as can be seen in Figure 3.59. There was only a small reduction in
the sharpness of the crystalline peaks, as the MWCNTs were present in the
polymer matrix and it only slightly changed the crystalline nature of the bare
polymer i.e. low crystallinity. The low crystallinity reveals that more
amorphous phase exists in the composite membrane, indicating that the
structure of the membrane is more disordered and QPSEBS and MWCNTs
are mixed more uniformly. Good mixing of QPSEBS and f-MWCNTs is
useful for the enhancement of ionic conductivity.
The calculated percentage of crystallinity of QPSEBS and
QPSEBS/MWCNT composites is given in Table 3.14. From the Table, it can
be seen that the percentage crystallinity of 5 wt % f-MWCNT exhibits lower
percentage of crystallinity (1.67%). For alkaline membrane fuel cell
applications, the membrane should possess amorphous behavior in other
words, low crystallinity because low crystallinity reveals good ionic
conductivity.
Table 3.14 Percentage of crystallinity values of QPSEBS/f-MWCNT
composite membranes
Membrane % of crystallinity
QPSEBS 3.08
QPSEBS/2.5% MWCNT 2.02
QPSEBS/5% MWCNT 1.67

174
3.9.2.10 Raman spectroscopy
Raman spectroscopy has been widely used to evaluate the
interaction between polymers and CNTs in CNT based composites (Gao et al
2010). Generally, the interaction between f-MWCNTs and matrix can be
reflected by the Raman shifts of the characteristic peaks (Schadler et al 1998).
There are several main peaks for the QPSEBS film, located at 998, 1027,
1190, 1303, and 1440 cm1
as seen in Figure 3.60. In particular, the peak at
998 cm1 is due to the C–N stretching; the peak of 1303 cm
1 could be due to
the C–H deformation. It is a proof that PSEBS polymer was successfully
quaternized by triethylamine via a quaternization process. The most
prominent Raman spectra modes of f-MWCNTs are the G-band (1580 cm–1
)
and the D-band (1340 cm–1
) which appeared in the composite membrane
(Figure 3.60(b)). The other characterization peaks present in the bare
membrane were absent in the composite membrane and also the intensity of
the main peaks were greatly decreased, which clearly illustrates that the f-
MWCNTs are well blended with QPSEBS matrix and it could be preferably
used in fuel cell applications.
600 800 1000 1200 1400
(a)
Inte
nsit
y (
a.u
)
Wave number (cm-1)
800 1000 1200 1400 1600
(b)
Inte
ns
ity
(a
.u)
Wave number (cm-1)
Figure 3.60 Raman spectra of (a) QPSEBS and (b) QPSEBS/5% f-
MWCNT
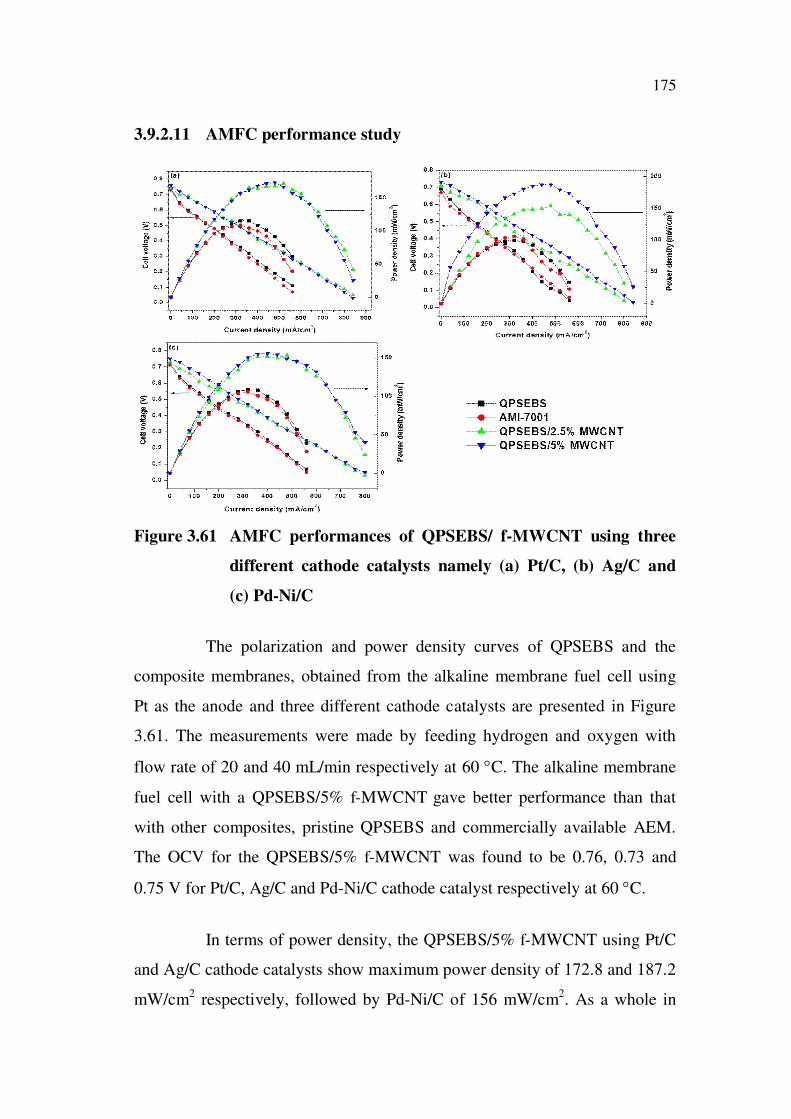
175
3.9.2.11 AMFC performance study
Figure 3.61 AMFC performances of QPSEBS/ f-MWCNT using three
different cathode catalysts namely (a) Pt/C, (b) Ag/C and
(c) Pd-Ni/C
The polarization and power density curves of QPSEBS and the
composite membranes, obtained from the alkaline membrane fuel cell using
Pt as the anode and three different cathode catalysts are presented in Figure
3.61. The measurements were made by feeding hydrogen and oxygen with
flow rate of 20 and 40 mL/min respectively at 60 C. The alkaline membrane
fuel cell with a QPSEBS/5% f-MWCNT gave better performance than that
with other composites, pristine QPSEBS and commercially available AEM.
The OCV for the QPSEBS/5% f-MWCNT was found to be 0.76, 0.73 and
0.75 V for Pt/C, Ag/C and Pd-Ni/C cathode catalyst respectively at 60 C.
In terms of power density, the QPSEBS/5% f-MWCNT using Pt/C
and Ag/C cathode catalysts show maximum power density of 172.8 and 187.2
mW/cm2 respectively, followed by Pd-Ni/C of 156 mW/cm
2. As a whole in

176
terms of OCV and maximum power density, QPSEBS/5% f-MWCNT has
better results when compared to the other composites and commercially
available anion exchange membrane.
3.9.2.12 DMAMFC performance study
0 50 100 150 200 250
0.1
0.2
0.3
0.4
0.5
0.6
0.7
0.8
Po
wer
den
sit
y (
mW
/cm
2)
Cell v
olt
ag
e (
V)
Current density (mA/cm2)
QPSEBS
AMI-7001
QPSEBS/2.5% MWCNT
QPSEBS/5% MWCNT
0
10
20
30
40
50
60
Figure 3.62 DMAMFC performances of QPSEBS/MWCNT composites
The performance of QPSEBS/MWCNT was investigated using Pt-
Ru/C and Pt/C as the anode and cathode catalyst respectively is depicted in
Figure 3.62. I-V curves showed the improved performance of the composite
membranes when compared to virgin QPSEBS and AMI-7001 membrane,
when DMAMFC operated at 60 °C. The OCV of QPSEBS/5% f-MWCNT
was found to be 0.76 V and the maximum power density of 59.5 mW/cm2 was
achieved at a current density of 175 mA/cm2.