Embed Size (px)
Citation preview

47
CHAPTER 3
METHODOLOGY
3.1 METHODOLOGY ADOPTED FOR THE STUDY
The methodology adopted for the study is outlined in Table 3.1.
Table 3.1 Methodology adopted for the study
Stages Data collection/ preparation Tools used Analysis Expected outcome
Stage I Characterization of sandstone used in the monuments
1. Selection of three monuments for detailed study
2. Collection of a sandstone sample from each of the three monuments
Micro structure study of weathered sandstone samples collected from the monuments
Petrographic analysis and Chemical analysis
The physical properties of sandstone and the major elements present in the sandstone
48
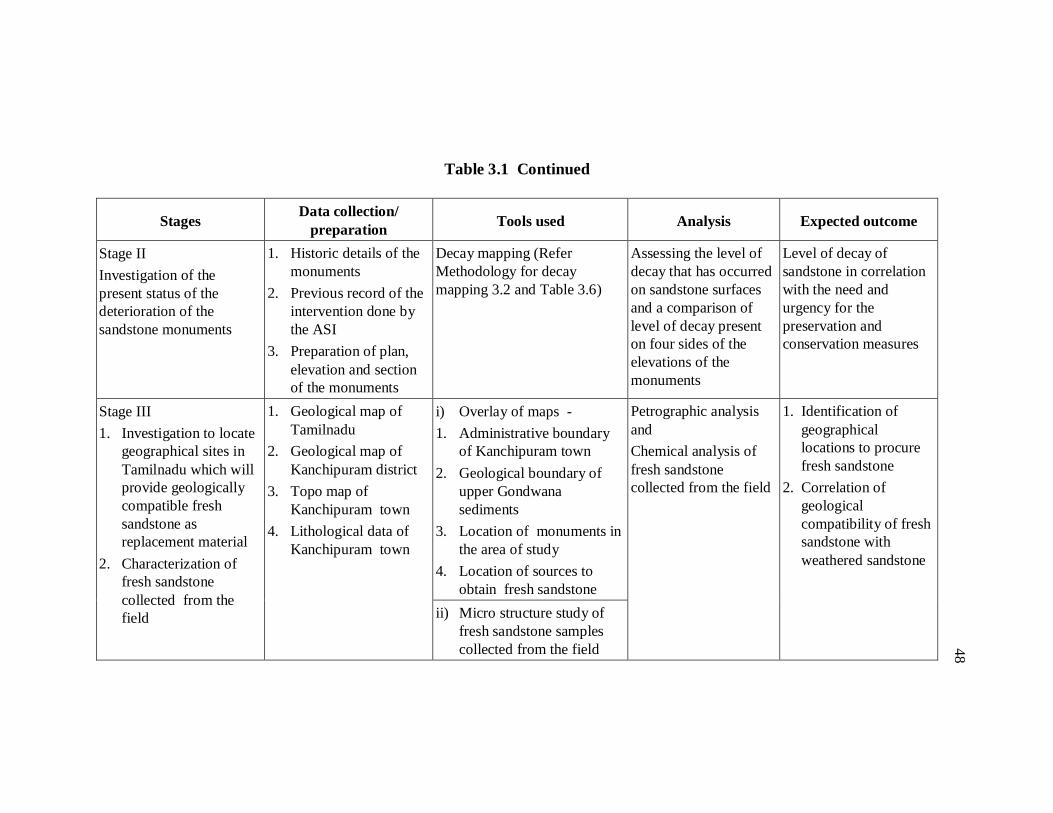
Table 3.1 Continued
Stages Data collection/ preparation Tools used Analysis Expected outcome
Stage II Investigation of the present status of the deterioration of the sandstone monuments
1. Historic details of the monuments
2. Previous record of the intervention done by the ASI
3. Preparation of plan, elevation and section of the monuments
Decay mapping (Refer Methodology for decay mapping 3.2 and Table 3.6)
Assessing the level of decay that has occurred on sandstone surfaces and a comparison of level of decay present on four sides of the elevations of the monuments
Level of decay of sandstone in correlation with the need and urgency for the preservation and conservation measures
Stage III 1. Investigation to locate
geographical sites in Tamilnadu which will provide geologically compatible fresh sandstone as replacement material
2. Characterization of fresh sandstone collected from the field
1. Geological map of Tamilnadu
2. Geological map of Kanchipuram district
3. Topo map of Kanchipuram town
4. Lithological data of Kanchipuram town
i) Overlay of maps - 1. Administrative boundary
of Kanchipuram town 2. Geological boundary of
upper Gondwana sediments
3. Location of monuments in the area of study
4. Location of sources to obtain fresh sandstone
Petrographic analysis and Chemical analysis of fresh sandstone collected from the field
1. Identification of geographical locations to procure fresh sandstone
2. Correlation of geological compatibility of fresh sandstone with weathered sandstone
ii) Micro structure study of fresh sandstone samples collected from the field

49
Assessing the level of decay of sandstone in
the frame of visual inspection
Identification of weathering forms
present on the sandstone surfaces and
their Classification
Transformation of weathering forms into
weathering damage categories
Rating of damage
categories into five levels
3.2 METHODOLOGY ADOPTED FOR DECAY MAPPING OF THE MONUMENTS
3.2.1 Decay mapping - Stage I Decay mapping - Stage I explains the methodology adopted to assess the level of decay that has occurred on sandstone surfaces. This method is purely quality-based on visual inspection in the field. Figure 3.1 shows the methodology adopted for Decay mapping – Stage I.
Figure 3.1 Methodology adopted for Decay mapping - Stage I
Step I: Understanding the causes, processes and mechanisms of stone damage is a prerequisite for stone preservation (Ashurst and Ashurst 1988). Any undesirable change in the properties of a material is termed as deterioration. The phenomenon of stone deterioration embraces those factors, which operate to alter the appearance, strength, coherence, dimensions or chemical behavior of the material either as individual elements or as parts of structures.
Investigations were carried out to understand and classify the weathering forms commonly found in all the sandstone monuments.

50
Weathering forms represent the visible result of weathering processes which are initiated and controlled by interacting weathering factors. Weathering forms are used for detailed description of individual weathering phenomena. The locations of weathering were identified and classified, based on the cause and nature of weathering into four categories, namely Physical disintegration, bio-deterioration, salt attack and human intervention (Fitzner et al 2002). Step II: Based on the above classification, an inventory of weathering forms including the listing, description and photo-documentation of weathering forms, was created in the form of a photo atlas (Photo Atlas- The individual weathering forms are described with a photograph) (Fitzner and Heinrichs 2004). The photo atlas of weathering forms are presented in Tables 3.2 to 3.5. Step III: The presence of weathering forms found on sandstone surfaces has been transformed into weathering damage category based as outlined (Fitzner 2004).
1. The absence of weathering forms - No visible damage 2. The discoloration/deposits that only represent damage from
the aesthetic point of view - slight damage 3. Discoloration/deposits and human intervention that harm the
stone but damage is reversible - Moderate damage 4. Discoloration/deposits and human intervention that really
harm the stone and can cause detachment of stone material - Severe damage
5. The stone material irretrievably lost contributing to the loss of historical and aesthetic value of the monument - Very severe damage
Step IV: The damage categories are given a rating ranging from I to V indicated by a colour code represented in Table 3.6.

51
Table 3.2 Physical disintegration
Weathering forms present on the
sandstone surfaces Description Example
Granular disintegration This physical damage is caused due to lashing rain, wetting and drying cycles and thermal changes. Loss of cohesion of minerals causes disintegration and surface loss of material.
Loss of material on the external surface of the wall Honeycombing The soft clayey part within the matrix is washed off by
means of the rain and the wind. The iron skeletal form remains intact. But these holes provide access to insects and microorganisms and they thrive in it.
Honey combing found at the plinth level Cracks Cracks are seen in the columns and other architectural
features and the magnitude is minimal
Cracks at the base of the column
Pitting Further damages caused after surface erosion due to the action of sand and dust particles are manifested in the form of large holes.
Holes found on the exterior surface of the walls

52
Table 3.3 Salt attack
Weathering forms present on the
sandstone surfaces Description Example
Efflorescence White patches on the surface of the material cause an unsightly appearance due to crystallization of salts on the material surface. The phenomenon occurs mainly on interior surfaces or sheltered areas of structures with a low rate of evaporation or high humid environment.
Presence of salt as white patches on the under
side of the roof slab
Flaking Crystallization is due to the mobility of salts; this is seen on exposed surfaces. Swelling of salt crystals below the exposed surface causes blistering and scaling of the outer layers.
Flaking of layers at plinth level
Rock meal
This damage produces debris that is a mixture of salt and individual grains. This is a progressive damage, which renders the material soft and crumbling into powder form.
Sandstone crumbling into powder form
53
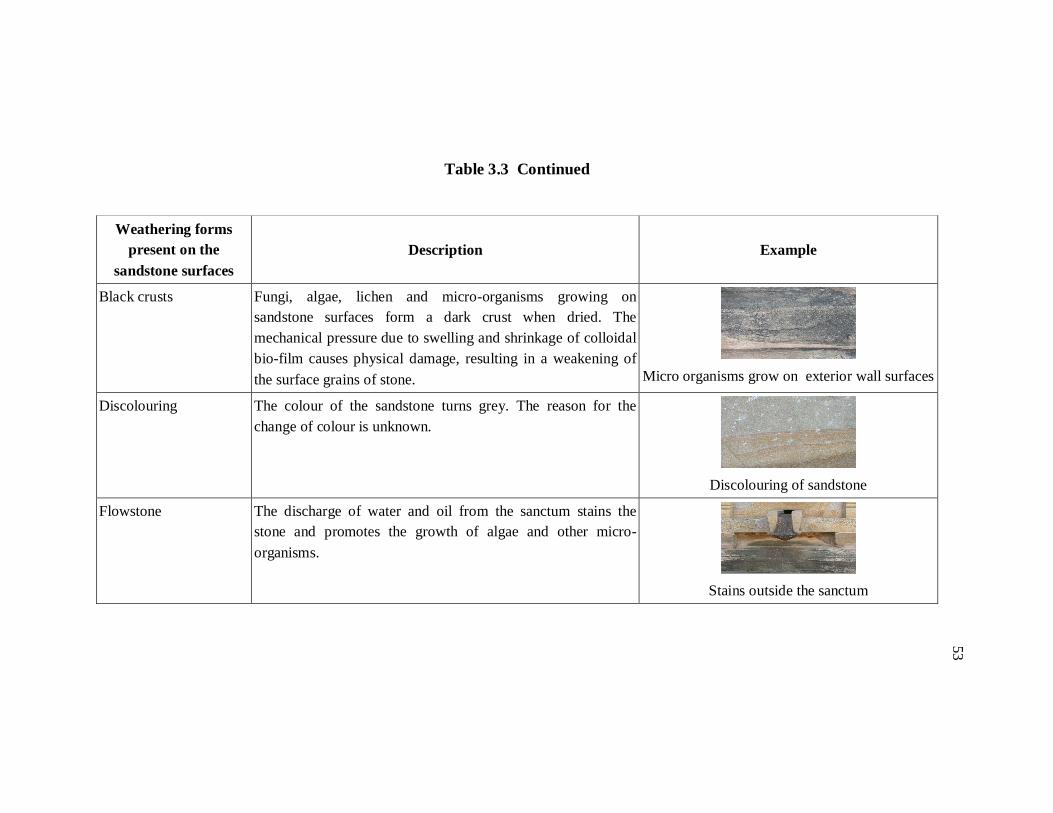
Table 3.3 Continued
Weathering forms present on the
sandstone surfaces Description Example
Black crusts Fungi, algae, lichen and micro-organisms growing on sandstone surfaces form a dark crust when dried. The mechanical pressure due to swelling and shrinkage of colloidal bio-film causes physical damage, resulting in a weakening of the surface grains of stone.
Micro organisms grow on exterior wall surfaces
Discolouring The colour of the sandstone turns grey. The reason for the change of colour is unknown.
Discolouring of sandstone
Flowstone The discharge of water and oil from the sanctum stains the stone and promotes the growth of algae and other micro-organisms.
Stains outside the sanctum

54
Table 3.4 Bio-deterioration
Weathering forms present on the
sandstone surfaces Description Example
Bio-film formation Bio-film formation takes place due to dampness. The damp surface of sandstone attracts dust, dirt and other micro-organisms. It is green when wet, and becomes dark when dry. The acidic secretion produced by the lichens leads to bio- corrosion in sandstone.
Bio-film on the external surface of the sanctum wall
Growth of plants Micro flora provide nutrients for the growth of small plants. Since the sandstone has pores on the surface once the decay is initiated, the surface serves as the receptacle for vegetation. The growth of small plants leads to further damage.
Growth of small plants seen on the tower (Vimana)

55
Table 3.5 Human intervention
Weathering forms present on the
sandstone surfaces Description Example
Repair Wrong intervention done by using hard cement mortar and brick to repair sandstone. Cement mortar creates a hard rigid boundary around the material. The expansion and shrinkage of the material due to thermal variation cycles within the hard rigid boundary leads to formation of cracks and disintegration of sandstone.
Repair of sculpture on the compound wall using
hard cement mortar and brick
Vandalism Sandstone wall surfaces are broken
Broken sandstone at the outer enclosure
Neglect Stains caused due to burning camphor by the pilgrims create an unsightly appearance and damage the monument.
Camphor stains at the entrance steps

56
Table 3.6 Level of decay
Sl. No. Presence of weathering forms Transformation of weathering forms into damage
categories Rating of damage
Colour code
1 - The absence of weathering forms - No visible damage
Level I
2 Discolouring, stains and neglect The discoloration/deposits that only represent damage from the aesthetical point of view - slight damage
Level II
3 Bio-film formation, flowstone, stains, repair Discolouration/deposits and human intervention that harm the stone but damage is reversible - Moderate damage
Level III
4 Surface erosion, efflorescence, black crusts, cracks, repair
Surface erosion, Discoloration/deposits and human intervention that really harm the stone and cause detachment of stone material - Severe damage
Level IV
5 Break-out due to unknown reasons, rounding of edges, loss of material due to granular disintegration, crumbling, honeycombing, pitting, exfoliation, single scale, and multiple scales
The stone material irretrievably lost contributing to the loss of historical and aesthetic value of the monument - Very severe damage
Level V

57
Recording the decay level of sandstone
surfaces
Elevations from cardinal directions evolved.
Dividing the elevation into a grid (horizontal
direction named A, B, C etc., and vertical named 1,2,3,4 etc.,) termed as the investigation grid
Documentation of the level of decay present in
each grid
Documentation of the
level of decay in all the grids indicated by colour
code for the whole elevation
3.2.2 Decay mapping - Stage II
The decay level of sandstone surfaces are recorded in Decay
mapping - Stage II. Figure 3.2 shows the methodology adopted for Decay
mapping - Stage II.
Figure 3.2 Methodology adopted for decay mapping - Stage II
Step I: Elevations of the monuments from the cardinal directions
are evolved.
Step II: Each side of the elevation is divided into a grid
(Horizontal direction named A, B, C etc., vertical direction named 1, 2, 3, 4
etc., termed as the investigation grid) (Refer Chapter 5).
Step III: Level of decay present in each grid is documented
according to Table 3.6 and indicated by a colour code.
58
Step IV: By documenting the level of decay in all the grids for the
whole elevation, a systematic mapping of decay for the façade is created.
Similarly the decay mapping is done for four sides of the elevations for a
monument.
Stage V: Based on the level of decay, analysis is done in
correlation with the need and urgency for preservation and conservation
measures.