Embed Size (px)
Citation preview

Chapter 3: Markets, Strategies & Time Frames
The first step in developing a trading strategy is to select the market action and corresponding strategy type that you want to trade. As I’ve discussed, selecting a strategy type is a very important part of strategy trading and you should take your time in evaluating the alternatives. Many factors will influence your decision, but your own personality will ultimately direct you to the strategy that is right for you. In making the choice, the most important thing to remember is that it is yours to make alone. Read everything I have to share with you about different types of strategies, but then decide for yourself. Only you really know what type of person you are and therefore what type of trading is best for you.
This chapter will help you to understand some of the conditions that can occur in the market, and the strategy type that complements those conditions. Once you are familiar with the basic strategy types, you will be able to select the one you want to use.
Three Market Types Generally, there are three types of markets. The three market types, or phases, are derived from three distinct chart patterns that appear when there is a shift in market action. The phases are trending, volatile, and directionless, and each can be characterized by specific price activity. Take a look at the following charts and familiarize yourself with each different market pattern.

42 Chapter 3: Markets, Strategies & Time Frames
TRENDING MARKET A sustained large increase or decrease in price characterizes a trending market. Take a look at Chart 1. This weekly chart of Coca Cola (KO) from early to mid-1997:
In fact, this stock has been in an up-trend since 1994. KO has almost tripled since then. This trending market was characterized by sustained up moves with very small and short-lived corrections. The 9- and the 18-period moving averages are included in Chart 1. A trend trader would buy the market when the shorter 9-period moving average crosses above the 18, and hold the stock until the 9-period average crosses below the 18. In this time period, he would have held KO for at least two trend moves.
Now take a look at this daily chart, Chart 2, of the Swiss Franc from mid-1996 to early 1997:
In this time period, the Swiss Franc has been in a daily downtrend for many months. It has lost more than 15% of its value over the period. This market was characterized by a sustained downmove with very small corrections. The same
Chart 1 TradeStation EasyLanguage Indicator: Moving Ave Cross
Input: Price(Close),Length1(9),Length2(18);
Plot1(Average(Price,Length1),"SimpAvg1");Plot2(Average(price,Length2),"SimpAvg2");
Chart 2 TradeStation EasyLanguage Indicator: Moving Ave Cross
Input: Price(Close),Length1(9),Length2(18);
Plot1(Average(Price,Length1),"SimpAvg1");Plot2(Average(Price,Length2),"SimpAvg2");

Chapter 3: Markets, Strategies & Time Frames 43
moving averages were plotted here, the 9 and 18. Note that if you had followed these averages, you would have stayed short for several months at a time.
The time frame you are looking at is important when you consider the type market action. Chart 3 shows the same Swiss Franc viewed on a monthly instead of daily chart.
The downtrend in 1996-1997 looks a little different when put in this perspective. It looks like the most recent move in a directionless market. And if you had traded the same moving averages on Chart 3, you would have been chopped around and most likely lost a lot of money. The point is that you should be aware that a directionless monthly or weekly chart might have very tradable daily trends, and vice versa.
DIRECTIONLESS MARKET A directionless market is characterized by smaller, insignificant up and down movements in price, with the general movement sideways. We probably would not call Chart 3 of the Swiss Franc directionless because the movements were not insignificant.
On the other hand, Chart 4 of Caterpillar in 1996 clearly shows a sideways directionless market, whose movements I would call insignificant, as the stock moved between 31 and 37 for most of the year. Markets chop around like this between trends. As you can see, I put the Stochastic Indicator on this chart. The Stochastic Indicator is commonly used as an overbought/oversold indicator. In directionless markets, you might attempt to buy CAT when the Stochastic is at or below 20 or 25 and sell when it is above 75 or 80. You could have made some money doing this with CAT in 1996.
Chart 3 TradeStation EasyLanguage Indicator: Moving Ave Cross
Input: Price(Close),Length1(9),Length2(18);
Plot1(Average(Price,Length1),"SimpAvg1");Plot2(Average(Price,Length2),"SimpAvg2");

44 Chapter 3: Markets, Strategies & Time Frames
VOLATILE MARKET A volatile market is characterized by sharp jumps in price. Chart 5 is a weekly chart of American Software. You will notice that this type of market action involves a quick and unexpected change in volatility. At the marked points on this chart, AMSWA was quiet for the previous 7 to 15 weeks. Then the price leaped out of this low volatility trading range. This is what is commonly called a “volatility expansion.”
The volatility of the market increased substantially during the breakout week as it shot out of the previous range. Strategies can be designed to take advantage of this type of change in volatility. They are generally called Volatility Expansion Strategies.
Volatility expansion strategies profit from market action like the movement depicted in the AMSWA chart. Basically, the strategy measures recent volatility and attempts to trade an immediate increase by buying an upside breakout with increased volatility or selling a downside breakout as the volatility increases.
Chart 5 Volatility Expansion Examples Long Short
Chart 4 TradeStation EasyLanguage Indicator: Stochastic Slow Input: Length(14),BuyZone(20),SellZone(80); Plot1(SlowK(Length),"SlowK"); Plot2(SlowD(Length),"SlowD"); Plot3(BuyZone,"BuyZone"); Plot4(SellZone,"SellZone");

Chapter 3: Markets, Strategies & Time Frames 45
Another measure of volatility might be the difference or spread between two moving averages—the spread increases with volatility. Price action, such as gap openings or an increase in the daily range, can also be considered an indication of an increase in volatility.
Three Strategy Types Each of these three types of markets (Trending, Directionless and Volatile) are tradable, but with markedly different trading strategies. Let’s take a look at each type of market behavior and the strategies that are appropriate to that type of market.
TREND FOLLOWING STRATEGIES Like the name, trend-following strategies are designed for trending markets, and to take a position for all the big trending moves that may occur. In creating trend-following strategies, the number one priority is that the strategy must never miss the big move.
The easy way to accomplish this is to always be in the market, that is, to always be either short or long. If you always have a position, you will always be there when the big move takes place.
The other method is to always have a “stop” order in the market, resting either above or below the current price (this is the same order as a stop loss, but it is used to enter the market rather than exit). Using a stop to enter the market will protect you because if the market moves quickly in either direction, you will be stopped in before the big move begins.
I can’t emphasize enough how important it is never to miss a big move in trend-following strategies. During the choppy, directionless phases of the market, you will experience several losses in a row and most likely significant drawdown. Therefore, if your strategy misses a big move, you may not have enough capital to hold out through the drawdown for the next big move.
Another design priority should be to limit your losses during the market’s sideways mode. Notice how I said limit losses not make profits. It is very important to recognize that no strategy will make money in every market condition. It is therefore very important to identify the market action in which the strategy will make money and the market action in which it will lose money.

46 Chapter 3: Markets, Strategies & Time Frames
Once you have found the market action in which the strategy will lose money, it becomes a strategy design priority to minimize losses during that market action. If the strategy is designed to make money in a trending market, it will lose money in the choppy phase. Your priority should be to minimize the losses in the directionless market.
Many trend-following strategies make their money in one or two trades of the year and break even or lose money for the rest. The most common indicator used for trend following is moving averages, most often two, a short moving average and a longer moving average. Chart 6 of Disney shows the 9- and 18-period moving averages with TradeStation arrows indicating where a 9- and 18-period moving average crossover strategy would go long (up arrow) and short (down arrow).
As you can see, there were periods of trend where a significant amount of money was made as well as periods where the market was choppy and the strategy whipsawed back and forth with losses.
Let’s analyze what we’ve just learned. Most trend traders will tell you that the 80/20 rule works for trend trading: they make 80% of their profits on 20% of their trades. Even though the moving average strategy on Disney (Chart 6) made money over time, it was profitable only 39% of the time. That means that the strategy lost money 61% of the time. This is the difficult part of trend trading—a low percentage of winning trades. You need a lot of positive self-esteem and a lot of confidence in your abilities to trade a strategy that loses money on 60 or 65% of its trades.
We will talk about this issue again later, but you should be thinking now about the design of the strategy you would be able to trade. If you want to be a typical trend
Chart 6 TradeStation EasyLanguage Strategy: Moving Ave Cross Input: Length1(9),Length2(18); IF CurrentBar > 1 and Average(Close,Length1) crosses over Average(Close,Length2) Then Buy on Close; IF CurrentBar > 1 and Average(Close,Length1) crosses below Average(Close,Length2) Then Sell on Close;
Choppy Market Causes Losses
Trending Market produces Big Move and Profit

Chapter 3: Markets, Strategies & Time Frames 47
trader, you should be prepared to lose money in a majority of trades. You should also be able to sit through significant drawdown as the market drifts through a directionless period.
The table below, SPF 1, is what I call a Strategy Parameter File. It is a summary of all the relevant information that I use to create a strategy with TradeStation. Each time I test a strategy in this book, I will use this so that you can see a description of a strategy in summary form and you have all the information to reproduce the results if you so desire.
Strategy Parameter File Moving Average Crossover
Set-Up 9/18 Moving Average Crossover
Entry None (market order)
Stops None Exits None
MaxBarsBack 50 Slippage 0
Margin None Used Commission 0
Data Source (DIS) - Disney Stock - Omega Research CD
Data Duration 1/2/90 to 7/11/97
Look at the Performance Summary labeled PS 1. As I just asked you, could you sit in front of your computer screen and place losing trade after losing trade, waiting for the big move to come? Could you sit through a string of 6 or 7 losses in a row before the next profitable trade? Could you lose $20 per share in a string of losses?
PS 1
I do not include margin in my calculations as I personally look at return on Maximum Intra-day Drawdown or what I call ROMID. Margin can be placed in T-Bills to earn a risk free return. To add it to the account size thus becomes redundant.
Also, using different amount of margin needlessly complicates strategy performance comparison.
SPF 1
Note that under “Entries” I have put none. I do not consider a market order technically an Entry.
This is discussed in the next chapter, under the title, The Magic of Set-Up and Entry.

48 Chapter 3: Markets, Strategies & Time Frames
Note: If you are unfamiliar with Performance Summaries (Strategy Report), please refer to Chapter 8, The Science of Strategy Evaluation.
As you can see from PS 1, the maximum number of consecutive losers was 6 and the maximum intra-day drawdown (MAXID) was $20.13. That means that at least once, from 1990 to 1997, you would have placed six losing trades in a row and had a cumulative loss of over $20 per share. Could you realistically put up with this?
Another characteristic of a trend-following strategy is that it makes most of its profits in one or two big trades. Of the $18 profit in Disney, $10 came from one trade over the six years of data. This is not unusual for a trend-following strategy. I discuss how much profit you should permit to come from the largest profitable trade in Chapter 8, The Science of Strategy Evaluation.
Many researchers have estimated that any market is in the trend mode 15% of the time and is directionless 85% of the time. A trend-following strategy then, by definition, has a low percentage of profitable trades. A trend-following strategy is psychologically difficult to trade, but if you think you can successfully trade without constant positive feedback, it can prove to be very profitable.
Trend-following strategies are probably the most popular type of strategy. With a high percentage of losing trades, you might be wondering why is it so popular. Very simply, trend-following strategies can be very profitable over time. Another reason is that people like to follow (and make money on) the big trends. It is human nature to want to cash in on the big moves in the market. It is innately satisfying to get in early on a trend and watch your profits soar.
SUPPORT & RESISTANCE STRATEGIES The main focus of a Support and Resistance (S/R) strategy is to profit from the price swings that occur in directionless markets. The strategy attempts to capture price movement opposite to that captured by trend-following strategies.
Support and resistance strategies start with the premise that markets are directionless 85% of the time. The strategy attempts to take advantage of this price movement and catch the small swings that take place in sideways or choppy markets.
This type of strategy has a higher number of winning trades, with small profits on each trade. It misses the full trend because it exits early in the trend move as the market becomes quickly overbought or oversold.

Chapter 3: Markets, Strategies & Time Frames 49
An S/R strategy is built on the concept of buying low and selling high. As you are buying when prices are low and selling when prices go up, you are actually trading against the trend. Essentially, you are attempting to pick tops and bottoms. You buy low and sell high, but the market keeps going higher. You keep selling as the market goes higher, and keep taking small losses until the market finally turns down and gives you a profitable trade.
Although an S/R strategy is easier to trade emotionally, many traders don’t trade this type of strategy because they miss the big move (by design). The most common indicator used with a support/resistance type of strategy is probably the Stochastic Oscillator.
You can see the Stochastic Indicator on Chart 7 of Caterpillar. I also applied the Stochastic Crossover strategy I created based on this indicator, highlighted in SPF 2.
Notice how the indicator fluctuates between 0 and 100. In this case, I used the 65 line and the 35 line to represent overbought and oversold, respectively. The overbought level for the stochastic is generally between 65 and 90 and the oversold level is between 35 and 10. You can play around with these levels to find the ones that make the most sense for you.
I have designed an S/R strategy so that when the Stochastic (SlowD) is below 35 and the short average (SlowK) moves above the long average (SlowD), the strategy produces a buy signal. The opposite would be true for a short signal, SlowD is above 65 and SlowK crosses below SlowD.
Chart 7 TradeStation EasyLanguage Strategy: Stochastic Cross Input: Length(10); IF CurrentBar > 1 and SlowD(Length) < 35 and SlowK(Length) crosses above SlowD(Length) then Buy on Close; IF CurrentBar > 1 and Slowd(Length) > 65 and SlowK(Length) crosses below SlowD(Length) then Sell on Close;
Shorts an uptrend

50 Chapter 3: Markets, Strategies & Time Frames
Strategy Parameter File Stochastic Crossover
Set-Up SlowD < 35 or SlowD > 65
Entry SlowK crosses SlowD
Stops None Exits None
MaxBarsBack 50 Slippage 0
Margin None Used Commission 0
Data Source (CAT)Caterpillar Stock - Omega Research CD
Data Duration 1/2/91 to 4/11/97
The drawback of support and resistance strategies is that they usually have small profits and larger strings of losses as they lose money when the market trends. By design, the strategy keeps shorting a market that is in an uptrend, or buying a market that is a downtrend.
You can see this happened twice in Chart 7 (previous page). Both times the market was in a sustained up-trend and when the Stochastic set-up reached overbought (above 65), the strategies went short. The market then kept moving up, resulting in losing trades.
As you can see from Performance Summary PS 2, this strategy has a high percentage of profitable trades (68%). This high percentage is needed to be profitable overall because the average losing trade was close to 1/3 larger than the average winning trade. Observe also that the strategy only had two consecutive losses in a row, which makes it much easier to trade from a self-esteem standpoint. The maximum intra-day drawdown (MAXID) was very large as a
SPF 2
Note that in this test I have both a Set-Up and an Entry. Again, the magic of Set-Up and Entry is discussed in the next chapter.
PS 2
Note that the average losing trade is greater than the average winning trade. The strategy was ultimately profitable because of the high percentage winners.
Chapter 3: Markets, Strategies & Time Frames 51
percentage of the net profit (76%). This would have to be fixed before this strategy would be ready to trade. I’ll show you techniques for fixing problems like this in the following chapters.
Keep in mind that, while strategy development looks easy, it is not. CAT was in a choppy market during this time whereas the stock market was in a strong bull market. If you had traded our moving average crossover trend-following strategy on CAT during this time, you would have lost a significant amount of money thinking that CAT would trend with the overall market.
An S/R strategy is designed to buy low and sell high, which is an easy method psychologically to trade because it makes logical sense. However, these strategies can lose money in the long run. Generally, most successful strategy traders don’t trade this type of strategy. If S/R strategies are used at all, it is to complement a group of strategies that includes trending strategies and perhaps a volatility strategy or two.
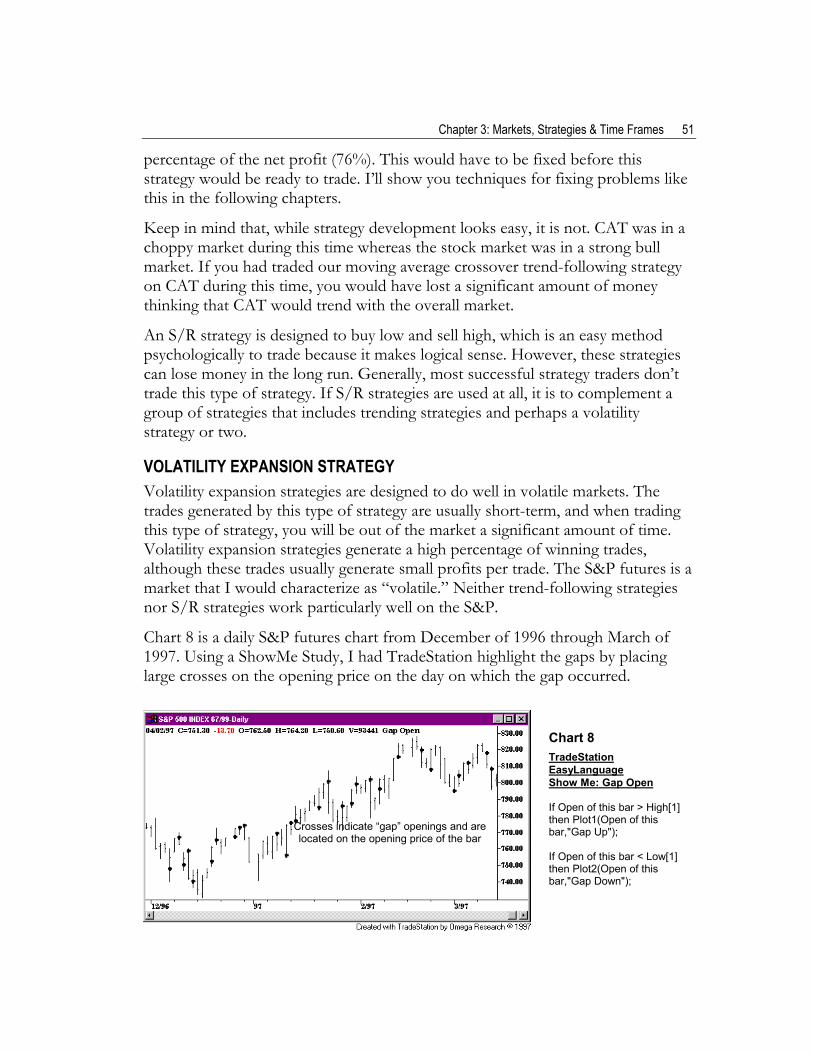
VOLATILITY EXPANSION STRATEGY Volatility expansion strategies are designed to do well in volatile markets. The trades generated by this type of strategy are usually short-term, and when trading this type of strategy, you will be out of the market a significant amount of time. Volatility expansion strategies generate a high percentage of winning trades, although these trades usually generate small profits per trade. The S&P futures is a market that I would characterize as “volatile.” Neither trend-following strategies nor S/R strategies work particularly well on the S&P.
Chart 8 is a daily S&P futures chart from December of 1996 through March of 1997. Using a ShowMe Study, I had TradeStation highlight the gaps by placing large crosses on the opening price on the day on which the gap occurred.
Chart 8 TradeStation EasyLanguage Show Me: Gap Open If Open of this bar > High[1] then Plot1(Open of this bar,"Gap Up"); If Open of this bar < Low[1] then Plot2(Open of this bar,"Gap Down");
Crosses indicate “gap” openings and are located on the opening price of the bar

52 Chapter 3: Markets, Strategies & Time Frames
One characteristic of a volatile market is gaps. Gaps refer to places in a bar chart where there is no continuity or overlapping of price. In this case, I have defined a gap as existing when today’s open is either above the high of yesterday or below yesterday’s low. Chart 8A is a small chart with two examples of up gaps.
In both cases, the open gapped up over the high of the previous day, and was unable to fill the gap created between the opening price and the previous day’s high. In most cases, as you can see on Chart 8, the prices fill the gap created on the open. In either case (whether the gap is filled or not) this type of chart action usually indicates an increase in volatility, or volatility expansion. A volatility expansion strategy could be designed to take advantage of market movement such as this.
As you can see from the marks on the S&P in Chart 8 (previous page), gaps appear to indicate that the market makes substantial daily moves following an opening gap. Let’s try to capture this movement with a strategy that is designed to profit from opening gaps and subsequent movement.
Let’s assume that if the market gaps up it is going to continue to go up, and if it gaps down it is going to continue to go down. The up or down gap sets up the trade. We then need to figure out how we are going to enter the market once the set-up occurs. I think we should require that the market move a significant amount away from the opening price before we enter the market.
Strategy Parameter File Gap Up/Down Volatility Increases
Set-Up Gap Opening
Entry Moves away from yesterday’s close an amount equal to yesterday’s range
Stops None Exits Next Day’s Open
MaxBarsBack 50 Slippage None
Margin None Used Commission None
Data Source S&P Futures - Omega Research CD
Data Duration 1/1/90 to 4/2/97
SPF 3
The exit is on the next day’s open. If we have a gap day and we get long or short, the strategy holds overnight and exits on the first trade of the following day.
Chart 8A

Chapter 3: Markets, Strategies & Time Frames 53
This strategy enters when the price action moves up or down an amount equal to yesterday’s close plus or minus yesterday’s range. The idea is that in addition to the price gap on the opening, we will require the price to move a distance at least equal to the previous day’s range away from the previous day’s close. This adds a second condition, assuring that volatility actually does expand. The strategy is applied to a daily S&P futures chart in Chart 9.
The results of this strategy are pretty good for the first try. This is definitely something that we can work with. There are many additions and variations that could improve the strategy. We might work on different exits, money management stops, and profit targets. We might also work on different ways of entering the market after a gap occurs. The results in PS 3 indicate that this price movement has real potential for creating a viable strategy.
As you can see in PS 3, the profits from a volatility expansion strategy come from a high percentage of profitable trades. Even though the average winning trade was less than the average losing trade, we still had the makings of a profitable strategy.
I hope you also noticed that in this test, as in all the previous tests in this chapter, I did not include any costs for slippage and commission. If, for instance, we included $25 for commission and $75 for slippage, the average trade profit would be $91.13 instead of $191.13. In strategies that have a lot of trades, these costs can make the difference between a strategy you would trade and one you would not.
Chart 9 TradeStation EasyLanguage Strategy: Gap Open IF Open of next bar > High of this bar or Open of next bar < Low of this bar then Buy next bar at Close of this bar + Range of this bar Stop; IF Open of next bar < Low of this bar or Open of next bar > High of this bar then Sell next bar at Close of this bar - Range of this bar Stop; Exitlong next bar at market; Exitshort next bar at market;

54 Chapter 3: Markets, Strategies & Time Frames
Price explosions of one form or another characterize a volatile market. One way of defining a price explosion would be a “gap” opening, another would be an increase of “range” (high-low). Some indicators have been developed to try to indicate a change in volatility. One of these is actually called “volatility” and is included as a study in TradeStation.
Typical volatility expansion strategies measure current volatility and enter the market when there is an abrupt increase in volatility. This type of strategy makes a quick exit, usually after only a few bars.
Selecting a Market and Strategy Type You should now have an idea as to the different types of market action and the strategy characteristics that attempt to take advantage of the action and profit from it. Each type of market has unique characteristics and takes a different thought process for strategy design.
In your own thoughts, you should begin to think about what type of market you are most comfortable with and would like to trade. Another consideration is the financial and statistical characteristics of the strategies, with specific regard as to whether you could actually trade the strategy. It is not wise to create a great strategy that would be psychologically impossible for you to trade.
The first step in strategy design is to think about the characteristics of the three market types and the strategies that are effective for each. Then decide what type of trader you are, or want to be: a trend trader, who buys low and sells high, or a volatility trader, who takes selective but high percentage trades.
PS 3
Note that the high percentage of profitable trades compensates for the higher average losing trade. The largest winning trade is a small percentage of the total profits.
Chapter 3: Markets, Strategies & Time Frames 55
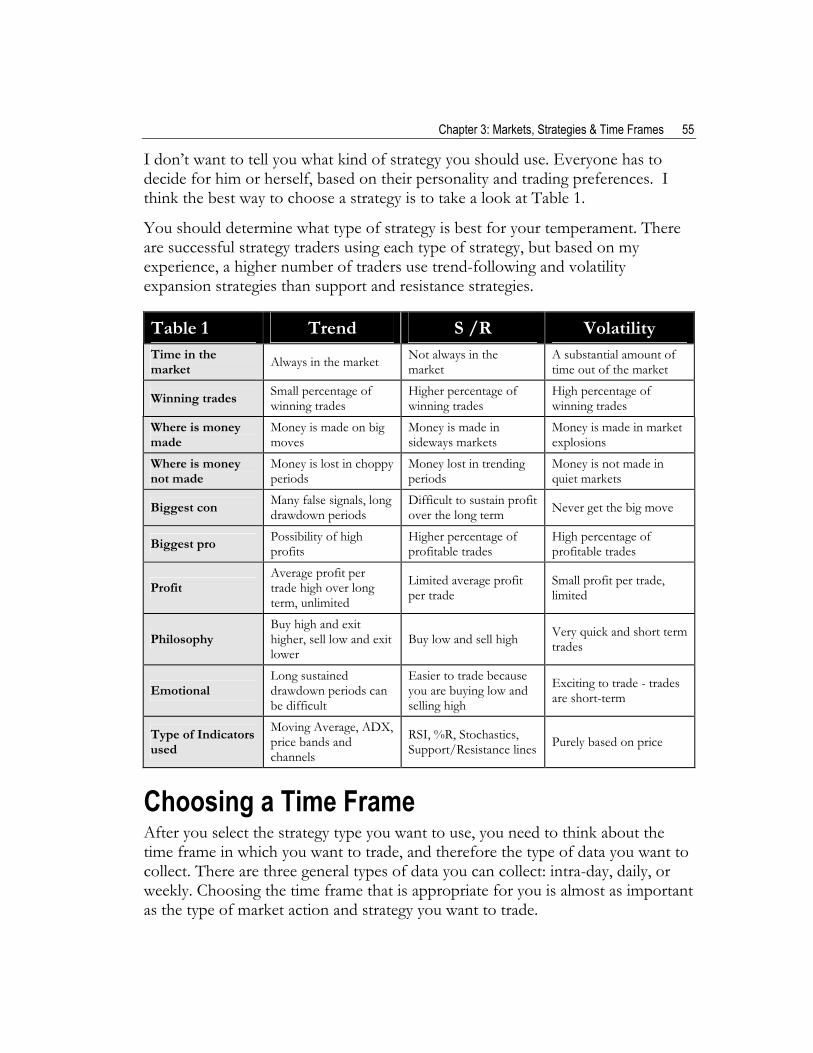
I don’t want to tell you what kind of strategy you should use. Everyone has to decide for him or herself, based on their personality and trading preferences. I think the best way to choose a strategy is to take a look at Table 1.
You should determine what type of strategy is best for your temperament. There are successful strategy traders using each type of strategy, but based on my experience, a higher number of traders use trend-following and volatility expansion strategies than support and resistance strategies.
Table 1 Trend S /R Volatility Time in the market Always in the market Not always in the
market A substantial amount of time out of the market
Winning trades Small percentage of winning trades
Higher percentage of winning trades
High percentage of winning trades
Where is money made
Money is made on big moves
Money is made in sideways markets
Money is made in market explosions
Where is money not made
Money is lost in choppy periods
Money lost in trending periods
Money is not made in quiet markets
Biggest con Many false signals, long drawdown periods
Difficult to sustain profit over the long term Never get the big move
Biggest pro Possibility of high profits
Higher percentage of profitable trades
High percentage of profitable trades
Profit Average profit per trade high over long term, unlimited
Limited average profit per trade
Small profit per trade, limited
Philosophy Buy high and exit higher, sell low and exit lower
Buy low and sell high Very quick and short term trades
Emotional Long sustained drawdown periods can be difficult
Easier to trade because you are buying low and selling high
Exciting to trade - trades are short-term
Type of Indicators used
Moving Average, ADX, price bands and channels
RSI, %R, Stochastics, Support/Resistance lines Purely based on price
Choosing a Time Frame After you select the strategy type you want to use, you need to think about the time frame in which you want to trade, and therefore the type of data you want to collect. There are three general types of data you can collect: intra-day, daily, or weekly. Choosing the time frame that is appropriate for you is almost as important as the type of market action and strategy you want to trade.

56 Chapter 3: Markets, Strategies & Time Frames
The most common chart used by traders is the daily chart, and this is why I use daily charts for most of the examples in this book. Daily charts are the most common for several reasons. Because most traders also have day jobs, they want to keep abreast of the market as much as possible without it intruding into their workday. The daily chart is perfect for this type of trader. You are able to review the markets each night and make your decisions for the next day.
WEEKLY VS. DAILY CHARTS Weekly charts are much more difficult to trade because it takes more discipline. To trade weekly charts, you must make your decisions on the weekends and not make any changes until the next weekend. For most traders, this is very difficult to do. It is very easy to yield to temptation and move a stop loss or a money management stop, or want to keep your profits and exit the market early.
To discipline yourself not to look at the market during the week is a tough thing to do. Most people don’t think of trading weekly charts. My experience is that there is a lot of money to be made trading weekly charts, simply because so few traders are able to do so. To make money in the markets, you have to tread where the average traders do not tread. Weekly charts are one of those places.
Chart 10 shows the weekly S&P futures in the upper box and the daily S&P in the lower.
There is more price detail in the daily chart, but also more price noise. Let’s check out a simple strategy on both the daily and weekly charts.
Chart 10
The top chart is a weekly chart and the bottom is a daily chart of the S&P futures.

Chapter 3: Markets, Strategies & Time Frames 57
Chart 11 is a daily IBM with a 50-period channel. The 50-period channel marks the highest high of the last 50 bars and the lowest low of the last 50 bars. The strategy would go long if the close of the bar closed above the channel and sell short if the price closed below the lowest low of the last 50 bars.
Chart 11 shows IBM up to and including the crash of 1987. The first thing you should notice is that this strategy is always in the market, i.e., it is either long or short. I arbitrarily chose the 50-period channel for this test. I will then compare the results with the same length channel on a weekly chart.
In these tests, I will assume that 50 days is about equal to 10 weeks. So, to compare a daily strategy with a weekly strategy, we will use the same lengths in time although measuring the length on daily charts in days (50) and on weekly charts in weeks (10).
Let’s take a look at how a simple channel breakout strategy works, first on a daily chart, then on a weekly. Our working premise is that the strategy will be more profitable on weekly charts than on daily.
Ask yourself why should a strategy, basically the same strategy, work better on a weekly chart than on a daily. I can come up with several reasons. First, very few people have the patience and the discipline to trade weekly charts. Second, by their very nature weekly charts smooth the price fluctuations of the daily chart. If there is a long trending market, we should be in the trend longer. We might get in the trend a little later than on the daily chart, and out later, but we will probably not get whipsawed as much in the directionless markets.
I chose IBM again arbitrarily because it went through some frustrating choppy periods and some very fine trending periods in its action packed history since 1970. The Strategy Parameter File SPF 4 shows how we would design a strategy to test this theory.
Chart 11 TradeStation EasyLanguage Indicator: Plot Channel Input: Length(50); Plot1(Highest(High,Length),"Channel"); Plot2(Lowest(Low,Length),"Channel");

58 Chapter 3: Markets, Strategies & Time Frames
Strategy Parameter File Channel Breakout on Close
Set-Up 50-Day Highest High and Lowest Low Channel
Entry Close above or below channel
Stops None Exits Reversal
MaxBarsBack 50 Slippage 35 cents/share
Margin None Used Commission 15 cents/share
Data Source IBM Stock Daily – Dial Data
Data Duration 1/5/70 to 7/24/97
Let’s look at the results for the daily chart, shown in PS 4.
This strategy was profitable over the 27 years. IBM moved from a low of 24 to a high of approximately 110, an 86 point rise. The strategy made $29 per share from 1970 to 1997.
Now let’s look at the same indicator and strategy on an IBM weekly chart, Chart 12.
Keep in mind that this is essentially the same indicator and strategy as the daily chart. The Strategy Parameter File is shown in SPF 5. Notice that the only difference is that it is a 10-period channel on a weekly chart instead of a 50-period channel on a daily chart.
SPF 4 Note that in this test we have for the first time used a cost for slippage and commission. I assumed you would pay about $0.15 per share in commissions and we would have slippage of $.35 per share. Slippage is the difference between the price of the order and the actual price at which you get filled.
Chart 12 TradeStation EasyLanguage Indicator: Plot Channel Input: Length(10); Plot1(Highest(High,Length),"Channel"); Plot2(Lowest(Low,Length),"Channel");
PS 4 TradeStation EasyLanguageStrategy: Channel Breakouts Input: Length(10); IF CurrentBar > 1 and Close > Highest(High,Length)[1] Then Buy on Close;
IF CurrentBar > 1 and Close < Lowest(Low,Length)[1] Then Sell on Close;

Chapter 3: Markets, Strategies & Time Frames 59
Strategy Parameter File Weekly Channel Breakout on Close
Set-Up 10-Wk Highest High and Lowest Low Channel
Entry Close above or below channel
Stops None Exits Reversal
MaxBarsBack 10 Slippage 35 cents/share
Margin None Used Commission 15 cents/share
Data Source IBM Stock Weekly – Dial Data
Data Duration 1/5/70 to 7/24/97
All else being equal, the strategies should perform about the same. However, as you can see in PS 5, in almost every category the weekly strategy outperformed the daily strategy.
Both strategies took their first trade within two days of April 22, 1970. From that point on, the weekly chart had a greater profit on fewer trades and less drawdown than the daily chart. The rest of the data is about the same. Clearly this data comes down on the side of the weekly chart rather than the daily.
This is just one very simple example of why you should consider weekly charts and not just assume that daily charts are your only option for trading.
SPF 5 Note that in this test we have also used a cost for slippage and commission. I assumed you would pay about $0.15 per share in commissions and we would have slippage of $.35 per share. Slippage is the difference between the price of the order and the actual price at which it is filled.
PS 5 Note that there is a large open position profit of $32.44. This is the profit on the current trade and should be considered when comparing the two strategies.

60 Chapter 3: Markets, Strategies & Time Frames
INTRA-DAY VS. DAILY CHARTS Intra-day charts are the 5-, 10-, 30-, and 60-minute charts that are compiled from intra-day tick data. To trade intra-day charts, you must give almost your full attention to the markets during the day.
It is virtually impossible to have a full-time job and trade intra-day charts well. As a percentage of traders, relatively few traders are able to trade during the day. I think it is for this reason that there is significant money to be made trading intra-day. The relative lack of competition has to be in your favor trading intra-day. Chart 13 is an example of a 30-minute S&P futures chart placed on top of a daily chart.
Trading intra-day data permits you to put a microscope on daily activity and filter trades so that you can take advantage of the intra-day timing. I want to show you the benefits of looking at a technique and strategy through the intra-day microscope.
To do so, let’s analyze a technique that I taught in my seminars many years ago. I called it a RangeLeader Breakout. A range leader is a special type of bar that has two attributes. The first is that the range of the bar must be greater than the range of the previous bar. Range is defined as the bar’s high minus the bar’s low.
The second characteristic of a range leader is that the midpoint of the bar must be above the previous bar’s high or below the previous bar’s low.
Range Leader Bar
The mid-point is greater than the high of the previous bar Or
The mid-point is less than the low of the previous bar And
The range (high - low) is greater than the range of the previous bar
Chart 13
There are 14 intra-day bars in a 30-minute chart. However the last bar is only 15 minutes because it covers the time from 4:00 to 4:15pm (EST).
The top chart is a 30-minute chart and the bottom is a daily chart.

Chapter 3: Markets, Strategies & Time Frames 61
So let’s create a strategy using the range leader. And make it simple. If a range leader occurs today, on the current bar, we will buy tomorrow one tick over the high of the range leader, or we will sell one tick below the low of the range leader. That’s about as simple as I can conceive it.
The daily chart of the S&P with both the ShowMe Study and the RangeLeader Breakout strategy on TradeStation is shown in Chart 14.
What type of a strategy is this? Trend-following, support and resistance, or volatility expansion? This the first question you should ask yourself as you look at this or any other strategy. In this case, since we’re looking at a breakout based on the previous bar’s range, it is a volatility expansion strategy.
The Strategy Parameter File is shown in SPF 6.
Strategy Parameter File RangeLeader Breakout Set-Up RangeLeader Entry Breakout Next Bar
Stops $500 MMS Exits Next day on open, $1,500 PT
MaxBarsBack 2 Slippage $35 Margin None Used Commission $25
Mid Point: greater than previous high
Chart 14 TradeStation EasyLanguage ShowMe: RangeLeaders If RangeLeader = 1 then Plot1(High + 100 points,"RangeLeader"); TradeStation EasyLanguage Function: RangeLeader Vars : Value1(0), Cond1(False), Cond2(False); Value1 = (High + Low) / 2 ; Cond1 = Value1 > High[1] OR Value1 < Low[1] ; Cond2 = Range[0] > Range[1] ; If Cond1 and Cond2 then RangeLeader = 1 else RangeLeader = 0;
Range: greater than previous bar’s range
SPF 6 TradeStation EasyLanguage Strategy: Daily RL Breakouts If RangeLeader = 1 then begin Buy at High + 1 point stop; Sell at Low - 1 point stop; end; Exitlong next bar on Open; Exitshort next bar on Open;

62 Chapter 3: Markets, Strategies & Time Frames
Data Source S&P Futures Daily – Omega CD Data Duration 1/1/93 to 12/31/93
Note that this strategy introduces the concept of Money Management Stops (“MMS”) and Price Targets (“PT”). An MMS is an order you place in the market to conserve your capital. In this case I decided I did not want to risk more than $500 per trade. The strategy design therefore includes a provision that when it gets filled, it immediately puts a stop loss $500 away from the entry price.
Price targets are placed if you want to exit the market at a particular profit level. This, of course, limits your profit per trade. In this case, I decided that if the price moved $1,500 in my favor, I would take the profit. For this strategy, I arbitrarily decided on the $500 MMS and $1,500 PT amount, but if we want to we can use TradeStation to test for the optimum amount for both of these.
For the exit, if my price target was not hit, that is, I did not make the $1,500, I decided that I would want to get out a soon as possible. I had two choices as to how to exit: on the close of the entry bar or the next day on the open. I chose the next day on the open as I wanted to take advantage of possible gap opens. I could also test other options for exiting the market. So, if I did not make $1,500 on the day the strategy entered the market, I would exit the following day on the open. This strategy was not too bad right out of the box.
The Performance Summary for this strategy is shown in PS 6.
We made 125% return on our drawdown in one year. All in all, not a bad first try.
PS 6
Note that our largest winning and losing trades were greater than our money management stop and profit target. This happened because our stop and target were not always hit. The next day the price gapped and we exited on the open. The gap was beyond either our stop loss or our price target.

Chapter 3: Markets, Strategies & Time Frames 63
Are we able to improve on this basic strategy by using the microscope of intra-day charts? Let’s try using a 30-minute chart and see what we find. The Performance Summary results are shown in PS 7.

64 Chapter 3: Markets, Strategies & Time Frames
This obviously didn’t work. We simply put the same strategy for the daily chart on the 30-minute chart (with one small change). The Strategy Parameter File is shown in SPF 7.
Strategy Parameter File RangeLeader Intra-Day Breakouts
Set-Up RangeLeader 30-Minute Breakouts
Entry Breakout Next Bar
Stops $500 MMS Exits Next day on open, $1500 PT
MaxBarsBack 2 Slippage $35
Margin None Used Commission $25
Data Source S&P Futures 30-Minute charts – Tick Data
Data Duration 1/1/93 to 12/31/93
Again, the strategy entered on RangeLeader Breakouts with a $1,500 PT and a $500 MMS. This time it lost some money. Let’s look at the minor change I made to it and then think for a moment about what went wrong.
An important consideration for this strategy, as with any intra-day strategy, is the first and last bar of the day. If the first bar of the day is a range leader, this means that the range of this bar is greater than the range of yesterday’s last 30-minute bar, and that the mid-point of this bar is either greater than the high or less than the low of the last bar yesterday. I have always thought that with the intervening time, this information was meaningless and shouldn’t be used to trade.
SPF 7 TradeStation EasyLanguage Strategy: ID RL Breakouts If RangeLeader = 1 then begin Buy at High + 1 point stop; Sell at Low - 1 point stop; end; If Time = 1615 then begin Exitlong next bar on Open; Exitshort next bar on Open; end;
PS 7 TradeStation EasyLanguage Strategy: ID RL Breakouts Condition1 = Time <> Sess1StartTime; Condition2 = Time <> Sess1EndTime; If Condition1 and Condition2 and RangeLeader = 1 then begin Buy at High + 1 point stop; Sell at Low - 1 point stop; end; If Time = 1615 then begin Exitlong next bar on Open; Exitshort next bar on Open; end;

Chapter 3: Markets, Strategies & Time Frames 65
Therefore, I added a Condition1, which eliminates the first bar from use (Sess1StartTime). Notice that I have also eliminated the last bar of the day (Sess1EndTime). If the last bar of the day is a range leader, the breakout will occur tomorrow during the opening bar. The fact that the last bar of the day is a range leader is irrelevant to tomorrow’s first bar, and the breakout is meaningless. Condition1 and Condition2 in the TradeStation EasyLanguage for this strategy deal with these issues.
Now, let’s look now at what went wrong. I believe the reason that the strategy lost money on the intra-day chart is because we didn’t take advantage of the strengths of using intra-day charts. It stands to reason that there must be certain times of the day when the market moves and other times when it rests. We simply used each 30-minute bar as if it was no different than any other bar. I have always thought that there were different times of the day that are more important.
Perhaps we should test each individual bar for a RangeLeader Breakout and then put in our MMS and PT and exit on tomorrow’s opening price if we don’t reach our target or get stopped out.
There are 13 30-minute bars during the day, and a 14th bar which is the last 15 minutes between 4:00 and 4:15pm (EST). I changed the strategy to test each bar, designated by its ending time, for a RangeLeader Breakout, using a $1,500 PT and a $500 MMS. If neither the MMS nor the PT is hit, we then exit the next day on the open. A summary of the results for each 30-minute intra-day bar is shown in PS 8.
Time Profit Long Short Ave Trade

66 Chapter 3: Markets, Strategies & Time Frames
10:00 -1400.00 1205.00 -2605.00 -11.67
10:30 -2625.00 -2160.00 -465.00 -105.00
11:00 4080.00 -1525.00 5605.00 151.11
11:30 -4700.00 -400.00 -4300.00 -156.67
12:00 -2800.00 3750.00 -6550.00 -112.00
12:30 1990.00 -430.00 2420.00 43.26
13:00 -5005.00 -3020.00 -1985.00 -116.40
13:30 -4230.00 -1410.00 -2820.00 -111.32
14:00 -10835.00 -4030.00 -6805.00 -235.54
14:30 -5395.00 -1130.00 -4265.00 -94.65
15:00 12225.00 5070.00 7155.00 188.08
15:30 -1910.00 2545.00 -4455.00 -34.11
16:00 -2975.00 -860.00 -2115.00 -74.38
PS 8 shows that there were only three time periods that produced profitable trades, 11:00, 12:30 and 15:00 (3:00pm). Clearly the 15:00 bar was the most profitable. It looks like we can conclude that most of the action in the S&P takes place after 3:00 in the afternoon.
Strategy Parameter File RangeLeader Intra-Day Breakouts
Set-Up RangeLeader at 15:00 bar
Entry Breakout Next Bar
Stops $500 MMS Exits Next day on open, $1,500 PT
MaxBarsBack 2 Slippage $35
Margin None Used Commission $25
Data Source S&P Futures 30 Minute charts – Tick Data
Data Duration 1/1/93 to 12/31/93
SPF 8 shows a summary of the final design of the 3:00 intra-day RangeLeader Breakout. Key elements of this strategy are the time of day, the $1,500 profit
SPF 8 TradeStation EasyLanguage Strategy: ID RL Breakouts Input:Bartime(1500); If Time = Bartime and RangeLeader = 1 then begin Buy at High + 1 point stop; Sell at Low - 1 point stop; end; If Time = 1615 then begin Exitlong next bar on Open; Exitshort next bar on Open; end;
PS 8 TradeStation EasyLanguage Strategy: ID RL Time B/O Input:Bartime(1500); Condition1 = Time <> Sess1StartTime; Condition2 = Time <> Sess1EndTime; If Condition1 and Condition2 and Time = Bartime and RangeLeader = 1 then begin Buy at High + 1 point stop; Sell at Low - 1 point stop; end; If Time = 1615 then begin Exitlong next bar on Open; Exitshort next bar on Open; end;

Chapter 3: Markets, Strategies & Time Frames 67
target, the $500 money management stop, and the exit on the open of the following day if neither of the stops are hit. PS 8A shows the whole Performance Summary using only the 15:00 bar as the RangeLeader Breakout.
As you can see in PS 8A, the results of using 30-minute bars and only using the 15:00 bar the RangeLeader Breakout strategy were very good. In 1993, it produced a return on maximum intra-day drawdown (MAXID) of 659% with 57% profitable trades. In every category, this strategy outperformed the daily chart.
Keep in mind that this is only for 1993. Before I would get overly excited about this strategy, I would test this in other years as well.
So, after all of this information, what’s the point? The point is that intra-day data, if used correctly, can give you a distinct advantage over daily charts. If you have the time and energy, you can take advantage of the microscopic look at the markets using intra-day charts, and you may be able to improve your return.
Summary Let’s recap what we have covered in this chapter. First, we took a look at the three types of markets: trending, directionless and volatile. We noted their individual characteristics and how to recognize each of them.
Next we studied strategies that take advantage of the three different types of market action. First, we looked at trending markets and the trend-following strategies that attempt to profit from this type of market. We saw that this type of strategy tries to catch the big move, and usually loses money while it waits for the trend. Trend-following strategies take trades with a low probability of profit, with
PS 8A
This strategy is a 3:00 RangeLeader breakout on 30-minute charts with a $500 money management stop and a $1500 profit target.

68 Chapter 3: Markets, Strategies & Time Frames
the eventual profitable trade usually being a big winner, covering all of the losses and more.
We then looked at both support and resistance strategies and volatility expansion strategies and noted their characteristics. Generally, these strategies are designed to intentionally miss the big trend. They attempt to make money by entering trades that have a high probability of success, but have limited profits. S/R strategies buy low and sell high. Volatility expansion strategies capture an increase in volatility and profit from this short-term explosion in price.
We then looked at the different time frames available for the strategy trader. I noted that most people instinctively trade daily charts. However, the successful strategy trader looks at the time frames that will maximize profits, not necessarily those that are most convenient. We compared the same strategy on the same data on both a daily chart and a weekly chart, and found that in this case the weekly results were much better than the daily. While this won’t be the case for every strategy in every market, it makes the point that using weekly charts is something you should at least consider.
We then turned to intra-day charts. I hoped to show you that the same issue exists for intra-day charts. Are there markets and strategies that would be improved by using intra-day charts rather than daily? We found at least one instance where this was true, using my concept of range leaders for an S&P strategy.
Our first step was to test an indicator, the RangeLeader, and use it to develop a reasonable strategy on a daily chart. We then modified the daily strategy for intra-day data, eliminating the first and last intra-day bar. This didn’t work. Undaunted, for the next step we decided to use the 30-minute intra-day data as a microscope to find the periods that did work with intra-day, 30-minute range leaders. For that reason, the last step was to test each of the individual bars to see which bars (if any) produced a viable strategy. We found the 1,500 bar to be very profitable and modified our strategy accordingly.
In this chapter, I hoped to show you that it is not necessary to be locked into trading daily charts. Although daily charts are the most common, and for most people the easiest to use, a case can be made that this is precisely the reason that you should consider trading other time frames. The decision rests on three factors: individual preference, personal discipline, and time.
The move to consider weekly charts involves some self-evaluation. Do you have the discipline to only look at the markets once a week? Can you effectively ignore market action during the week? In many markets, trading weekly charts can be a
Chapter 3: Markets, Strategies & Time Frames 69
big advantage; weekly charts tend to smooth out the price action, reducing many of the daily whipsaws into small insignificant corrections. This can be a distinct advantage for trend traders. I showed you one instance where using a weekly chart for a trend strategy was an advantage.
The intra-day time frame has its own advantages and disadvantages. First, you must have the time to watch the markets during the day. Second, you will probably be entering many more trades, and the cost of commissions becomes a larger factor. And third, the software and data costs are greater.
These are the first issues that you must consider as you begin to develop a strategy and trade it: the type of market, the strategy type and the time frame. Let’s now move on to the major elements of creating the strategy itself.
NOTE: What you have just read has been presented solely for informational oreducational purposes. No investment or trading advice or strategy of any kind is being offered, recommended or endorsed by the author or by TradeStation Technologies or any of its affiliates, agents or employees.

70 Chapter 3: Markets, Strategies & Time Frames