Embed Size (px)
Citation preview

Chapter 3
Lay of the Land: Survey
All civil-engineering projects start with a survey. Base maps provide engineers with data, which normally contain existing conditions. These maps can be used to develop an engineering-design model. Civil 3D 2011 provides an integrated solution that surveyors can use to create base maps that will reside in the same native format the engineers will use, thereby reducing potential (and costly) errors that result from translating data from one design software to another. In this chap-ter, you’ll learn about tools and techniques that will link your survey equipment directly into the software, automate your drafting procedures from fieldwork, and provide a secure and indepen-dent database for storing and manipulating your survey data.
In this chapter, you’ll learn to:
Properly collect field data and import it into AutoCAD Civil 3D 2011•u
Set up styles that will correctly display your linework•u
Create and edit field book files•u
Manipulate your survey data•u
Understanding the ConceptsBefore you start working with the survey portion of Civil 3D, you first need to understand some basic concepts. When the majority of people think about surveying in any software, they generally think about going out into the field with a survey instrument and some form of data collector and returning to the office with a group of points—text entities with unique identifiers, northings, eastings, elevations, and some sort of descriptors. That point file, whether it be in ASCII format, text format, CSV format, or otherwise, is imported into a survey program that displays those points in some way, allowing technical staff to essentially play a game of “connect the dots” to create a base plan. However, with the survey crew and the office staff working together, much of the “connect-the-dots” game can be played in the field. For example, in Figure 3.1, parking stripes, curb and gutter, asphalt, and concrete features have been connected correctly in the field with fig-ures. This is important because it has the potential to reduce liability—always an important topic of conversation with surveyors. Because the field crew is on site and have actually witnessed existing conditions, they are in a better position to create the linework than a drafter who may have never seen the site.

68 | Chapter 3 lay of the land: survey
Aside from having to get the survey field crew and the office staff working in harmony, there are a few other things you need to know. The first thing to know is that the survey functionality in Civil 3D doesn’t need to use the old Point, Northing, Easting, Zed (elevation), and Description (PNEZD) text file. It can use the raw data from your data collector to process an Autodesk field book (FBK) file, or a LandXML file. If you use an FBK file for your surveys, you have much more than just points on a screen—you actually have a record of how those points were collected. You will have the information you need to edit this file if needed. Instead of calculating new coor-dinates for a bad point, you will actually be able to navigate to the setup from which that point was collected and edit the rod height, instrument height, vertical angle, horizontal angle, or any other information that can be input directly into a data collector. This information is imported, stored, and manipulated in the survey database. The survey database is a Microsoft SQL Server Compact database file with all the information required to create the survey network.
Because this survey database file is located external to the drawing, it can be used simultane-ously in multiple drawings, even if those drawings have different coordinate systems. The coor-dinate system information is set in the survey database settings and will automatically translate to any coordinate system set up in the drawing settings. This external database requires you to treat the survey database a bit differently than you would other aspects of Civil 3D. For example, many settings will reside in the survey database settings and not in the drawing template as is common for other Civil 3D settings. Other settings will reside in the Survey User Settings dialog, as shown in Figure 3.2.
I’ve Created a Database for practice, Now how Do I Delete It?
One small issue with the external database is that there is no way to delete it from within the program. This database is stored in C:\Civil 3D Projects by default (or your working folder if you’re using Vault). The database is stored in a subfolder inside that working folder that has the same name as the database. To delete a database, you will be required to use Windows Explorer to delete the folder. Refreshing the database listing on the Survey tab will update the view and remove the deleted database.
Figure 3.1 A portion of an as-built survey cre-ated with Civil 3D

understandInG the ConCepts | 69
The settings in this dialog control many of the default choices for creating survey objects, much as Command settings do on the Settings tab of Civil 3D. You’ll look at some in this exercise:
1. Create a new drawing by selecting the Application Menu New and picking the _AutoCAD Civil 3D (Imperial) NCS.dwt template file.
2. On the Survey tab in Toolspace, click the Edit Survey Settings icon in the upper-left corner, as shown in Figure 3.3. If the Survey tab is not available, change to the Home tab and click the Survey Toolspace button on the Palettes panel.
Figure 3.2 The Survey User Settings dialog
Figure 3.3 The Edit Survey Settings button in the upper left of the Survey tab in Toolspace

70 | Chapter 3 lay of the land: survey
3. The Survey User Settings dialog opens. Look through the options and settings and observe all the defaults that can be chosen.
4. Click Cancel to dismiss the dialog without saving any changes.
Now that you’ve looked at the settings, let’s get into the databases behind the scenes.
Databases Everywhere!The Survey tab of Toolspace contains four different types of databases. The first is the survey database, where your survey networks are created and stored. This database contains the survey data that you can import into the program from the field. The equipment database is where you create replicas of your existing survey equipment for use when performing traverse analyses. The figure prefix database is where you enter your figure prefixes for use when you import a field book with linework into the program. The linework code sets database stores line and curve segment codes as well as coding methods and any special codes used in data collection. In this section, you’ll explore the equipment database and the figure prefix database. Later you’ll create and work with a survey database.
The Equipment DatabaseThe equipment database is where you set up the different types of survey equipment that you are using in the field. This will allow you to apply the proper correction factors to your traverse analyses when it comes time to balance your traverse. Civil 3D comes with a sample piece of equipment for you to inspect to see what information you will need when it comes time to create your equipment. The Equipment Properties dialog (see Figure 3.4) provides all the default set-tings for the sample equipment in the equipment database. Expand the Equipment Databases Sample branches, right-click Sample, and select Properties to access this dialog in Toolspace. You will want to create your own equipment entries and enter the specifications for your particular total station. If you are unsure of the settings to enter, refer to the user documentation that you received when you purchased your total station.
Figure 3.4 The Equipment Properties dialog

dataBases everyWhere! | 71
The Figure Prefix DatabaseFigures are created by codes entered into the data collector during field collection. Figures can have line segments, curve segments, elevations, and linetypes or colors assigned to them. For example, your field crew may locate a water line in the field and have it come in as line segments colored blue with a waterline linetype, or they could locate the back of a curb and display it with a solid line and a concrete style. They could set the back of this curb to come in as a breakline for surface creation. Figure 3.5 shows the Figure Prefixes Editor in Panorama.
You’ll need to have some styles ready to go when you create your figures, so you’ll build a few now:
1. Open the drawing figure styles.dwg. (All drawings in this chapter can be downloaded from www.sybex.com/go/masteringcivil3d2011.)
2. In Toolspace, click the Settings tab.
3. Expand the Survey branch.
4. Right-click Figure Styles and select New. The Figure Style dialog opens.
5. On the Information tab, enter CL (for Centerline) in the Name text box. This is the name of the new style you are creating.
6. Switch to the Display tab, and make sure that Figure Lines is the only Component Type that is visible. Turn off any other ones that are visible.
7. Set the Layer for the Figure Lines component to V-SURV-FIGR by clicking in the Layer cell. The Layer Selection dialog appears, with the available layers on a drop-down list. Click OK to dismiss the Layer Selection dialog box.
8. Set the Color for the Figure Lines component to Red and the Linetype to CENTER2.
9. Create additional figure styles with the following names: PROP, CONC, WATER, CATV, GAS, EP, BREAK, BLDG, and OHP. Apply different colors and linetypes to each figure style as desired. Save the drawing—you will use it in the next exercise.
10. Click OK to dismiss the Figure Style dialog.
Figure 3.5 The Figure Prefixes Editor in Panorama

72 | Chapter 3 lay of the land: survey
figure settings
The following six settings can be specified for each figure prefix:
Name This specifies the name of the figure prefix. The figure prefix is used when you import a field book into a survey database network.
Breakline This specifies whether the figure should be used as a breakline during surface creation. These figures will have elevation data, allowing them to be selected manually in the breakline section of the surface definition.
Lot Line This specifies whether the figure should behave as a parcel segment. When toggled on, these figures are used to create parcels when inserted into a drawing and can be labeled as parcel segments.
Layer This specifies the layer that the figure will reside on when inserted into the drawing. If the layer already exists in the drawing, the figure will be placed on that layer. If the layer does not exist in the drawing, the layer will be created and the figure placed on the newly created layer.
Style This specifies the style to be used for each figure. The style contains the linetype and color of the figure. If the style exists in the current drawing, the figure will be inserted using that style. If the style does not exist in the drawing, the style will be created with the standard settings and the figure will be placed in the drawing according to the settings specified with the newly created style.
Site This specifies which site the figures should reside on when inserted into the drawing. As with previous settings, if the site exists in the drawing, the figure will be inserted into that site. If the site does not exist in the drawing, a site will be created with that name and the figure will be inserted into the newly created site. Because a figure can create parcels and surface breaklines, this functionality can be used to place those objects on the correct site.
Next you’ll look at these settings in a practical exercise. You’ll use the styles created in the previous exercise:
1. Open the drawing figure prefix library.dwg.
2. In the Survey tab of Toolspace, right-click Figure Prefix Databases and select New. The New Figure Prefix Database dialog opens.
3. Enter Mastering Civil 3D in the Name text box, and click OK to dismiss the dialog. Mastering Civil 3D will now be listed under the Figure Prefix Databases branch in the Survey tab on Toolspace.
4. Right-click the newly created Mastering Civil 3D figure prefix database and select Manage Figure Prefix Database. The Figure Prefix Database Manager will appear.
5. Select the white + symbol in the upper left corner of the Figure Prefix Database Manager to create a new figure prefix.
6. Click the SAMPLE name and rename the figure prefix EP (for Edge of Pavement).
dataBases everyWhere! | 73
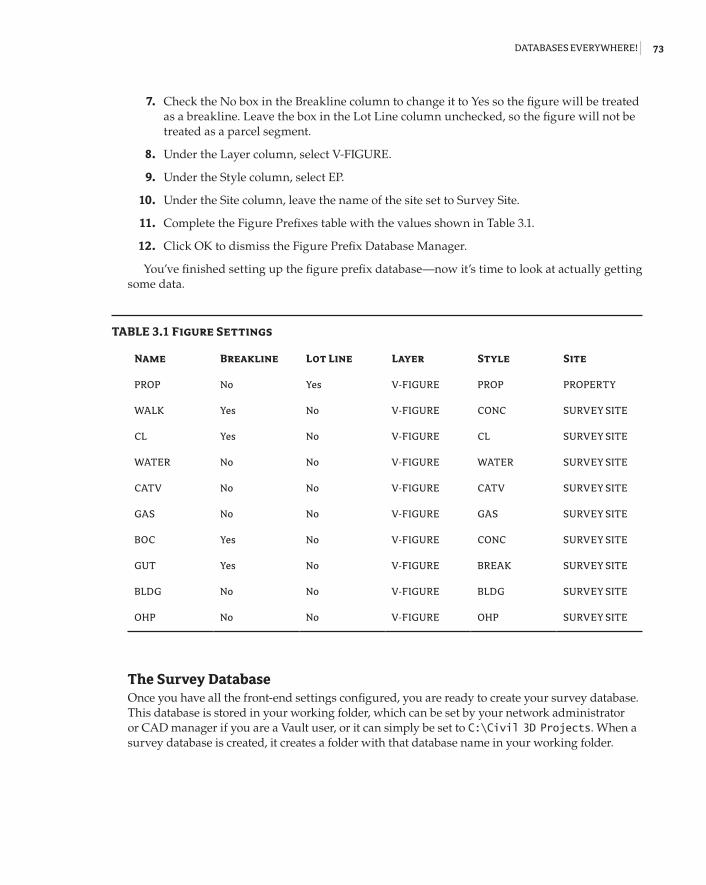
7. Check the No box in the Breakline column to change it to Yes so the figure will be treated as a breakline. Leave the box in the Lot Line column unchecked, so the figure will not be treated as a parcel segment.
8. Under the Layer column, select V-FIGURE.
9. Under the Style column, select EP.
10. Under the Site column, leave the name of the site set to Survey Site.
11. Complete the Figure Prefixes table with the values shown in Table 3.1.
12. Click OK to dismiss the Figure Prefix Database Manager.
You’ve finished setting up the figure prefix database—now it’s time to look at actually getting some data.
taBLe 3.1 Figure Settings
Name Breakline Lot Line Layer Style Site
PROP No Yes V-FIGURE PROP PROPERTY
WALK Yes No V-FIGURE CONC SURVEY SITE
CL Yes No V-FIGURE CL SURVEY SITE
WATER No No V-FIGURE WATER SURVEY SITE
CATV No No V-FIGURE CATV SURVEY SITE
GAS No No V-FIGURE GAS SURVEY SITE
BOC Yes No V-FIGURE CONC SURVEY SITE
GUT Yes No V-FIGURE BREAK SURVEY SITE
BLDG No No V-FIGURE BLDG SURVEY SITE
OHP No No V-FIGURE OHP SURVEY SITE
The Survey DatabaseOnce you have all the front-end settings configured, you are ready to create your survey database. This database is stored in your working folder, which can be set by your network administrator or CAD manager if you are a Vault user, or it can simply be set to C:\Civil 3D Projects. When a survey database is created, it creates a folder with that database name in your working folder.

74 | Chapter 3 lay of the land: survey
the survey database settings
Each survey database has numerous settings that control the database, as shown in Figure 3.6.
The settings are as follows:
Units This is where you set your coordinate zone. It is the master coordinate zone for the data-base. If you insert any information in the database into a drawing with a different coordinate zone set, the program will translate that data to the drawing coordinate zone. Your coordi-nate zone units will lock the distance units in the Units branch. You can also set the angle, direction, temperature, and pressure units under this branch.
Precision This is where the precision information of angles, distance, elevation, coordi-nates, and latitude and longitude is defined and stored.
Measurement Type Defaults This is where you define the defaults for measurement types, such as angle type, distance type, vertical type, and target types.
Measurement Corrections This is used to define the methods (if any) for correcting mea-surements. Some data collectors allow you to make measurement corrections as you collect the data, so that needs to be verified, because double correction applications could lead to incorrect data.
Traverse Analysis Defaults This is where you choose how you perform traverse analyses and define the required precision and tolerances for each. There are four types of 2D-traverse analyses: Compass Rule, Transit Rule, Crandall Rule, and Least Squares Analysis. You can find more information and definitions of these analyses in the Civil 3D Help file.
There are also two types of 3D-traverse analyses: Length Weighted Distribution and Equal Distribution. You can also find more information and definitions of these analyses in the Civil 3D Help file. It should be noted that a 3D Least Squares Analysis can only be performed if the 2D Least Squares Analysis is also selected.
Figure 3.6 The Survey Database Settings dialog

dataBases everyWhere! | 75
Least Squares Analysis Defaults This is where you set the defaults for a least squares analysis. You only need to change settings here if least squares analysis is the method you will use for your horizontal and/or vertical adjustments.
Survey Command Window This is the interface for manual survey tasks and for running survey batch files. This is where the default settings are defined for the Survey Command window interface.
Error Tolerance This is where tolerances are set for the survey database. If you perform an observation more than one time and the tolerances set within are not met, an error will appear in the Survey Command window and ask you what action you want to take.
Extended Properties This defines settings for adding extended properties to a survey LandXML file. This is useful for certain types of surveys, including Federal Aviation Administration (FAA)–certified surveys.
Next, you’ll create a survey database and explore the database options before taking a look at the components of the database:
1. Open the drawing survey database.dwg.
2. On the Survey tab of Toolspace, right-click Survey Databases and select New Local Survey Database. The New Local Survey Database dialog opens.
3. Enter Mastering Survey in the text box and click the OK button. The Mastering Survey database will be created under the Survey Databases branch in the Survey tab of Toolspace.
4. Right-click your newly created survey database and select Edit Survey Database Settings. The Survey Database Settings dialog opens.
5. Browse through the various settings.
6. Click Cancel to dismiss the Survey Database Settings dialog.
survey database comPonents
Once you create a survey database and open it in the Survey tab of Toolspace, you will find that it contains seven components:
Import Events Import Events provide a framework for viewing and editing specific survey data, and they are created each time you import data into a survey database. The default name for the import event is the same as the imported filename (filename.ext). The Import Event collection contains the Networks, Figures, and Survey Points that are referenced from a specific import command, and provides an easy way to remove, re-import, and reprocess survey data in the current drawing.
Networks A survey network is a collection of connected data that is collected in the field. The network consists of setups (or stations), control points, non-control points, known direc-tions, observations, setups, and traverses. This data is typically imported through a field book (also known as an FBK file) that is converted from raw data from the data collector, although it can also be imported through a LandXML file, a point file, or points from the drawing. A network must be created in a survey database before any data can be imported.

76 | Chapter 3 lay of the land: survey
A survey database can have multiple networks. For example, you can use different networks for different phases of a project. If working within the same coordinate zone, some users have used one survey database with many networks for every survey that they perform. This is possible because individual networks can be inserted into the drawing simply by dragging and dropping the network from the Survey tab in Toolspace into the drawing. You can hover your cursor over any Survey Network component in the drawing to see information about that component and the survey network. You can also right-click any component of the net-work and browse to the observation entry for that component.
Network Groups Network groups are collections of various survey networks within a survey database. These groups can be created to facilitate inserting multiple networks into a drawing at once simply by dragging and dropping.
Figures As discussed earlier, figures are linework created by codes and commands entered into the raw data file during data collection. These figures typically come from the descriptor or description of a point. A typical way of creating figures is illustrated in the following entry from an FBK file:
BEG ECNE SS 3202 10040.90000 10899.21000 793.75000 ″EC″CONT ECC3NE SS 3203 10056.53000 10899.45000 793.47000 ″EC″NE SS 3204 10058.52000 10897.42000 793.53000 ″EC″NE SS 3205 10055.94000 10895.19000 793.61500 ″EC″CONT ECC3NE SS 3206 10040.43000 10895.11000 793.61500 ″EC″NE SS 3207 10038.18000 10896.59000 793.58000 ″EC″NE SS 3208 10040.47000 10899.34000 793.50500 ″EC″END
This FBK entry is going to create a figure named EC, which comes from the point descrip-tion. This particular figure will have one line segment, and then a compound curve will be created from two three-point curves. The BEG EC, CONT EC, C3, and END commands tell the program how to draw the figure. Figures can be 2D or 3D (that is, they can be used simply for horizontal geometry or as breaklines for vertical geometry), can be used as parcel seg-ments, and can be displayed in any of the same ways that a regular polyline can. The behavior of these figures is controlled by the Figure Prefix Library, which matches point descriptors with figure styles and displays them appropriately. Figures can be added to a drawing by dragging and dropping them into the drawing from the Survey tab in Toolspace.
Figure Groups Similar to network groups, figure groups are collections of individual figures. These groups can be created to facilitate quick insertion of multiple figures into a drawing.
Survey Points One of the most basic components of a survey database, points form the basis for each and every survey. Survey points look just like regular Civil 3D point objects, and their visibility can be controlled just as easily. However, one major difference is that a
dataBases everyWhere! | 77
survey point cannot be edited within a drawing. Survey points are locked by the survey data-base, and the only way of editing is to edit the observation that collected the data for the point. This provides the surveyor with the confidence that points will not be accidentally erased or edited. Like figures, survey points can be inserted into a drawing by either dragging and dropping from the Survey tab of Toolspace or by right-clicking Surveying Points and select-ing the Points Insert Into Drawing option.
Survey Point Groups Just like network groups and figure groups, survey point groups are collections of points that can be easily inserted into a drawing. When these survey point groups are inserted into the drawing, a Civil 3D point group is created with the same name as the survey point group. This point group can be used to control the visibility or display properties of each point in the group.
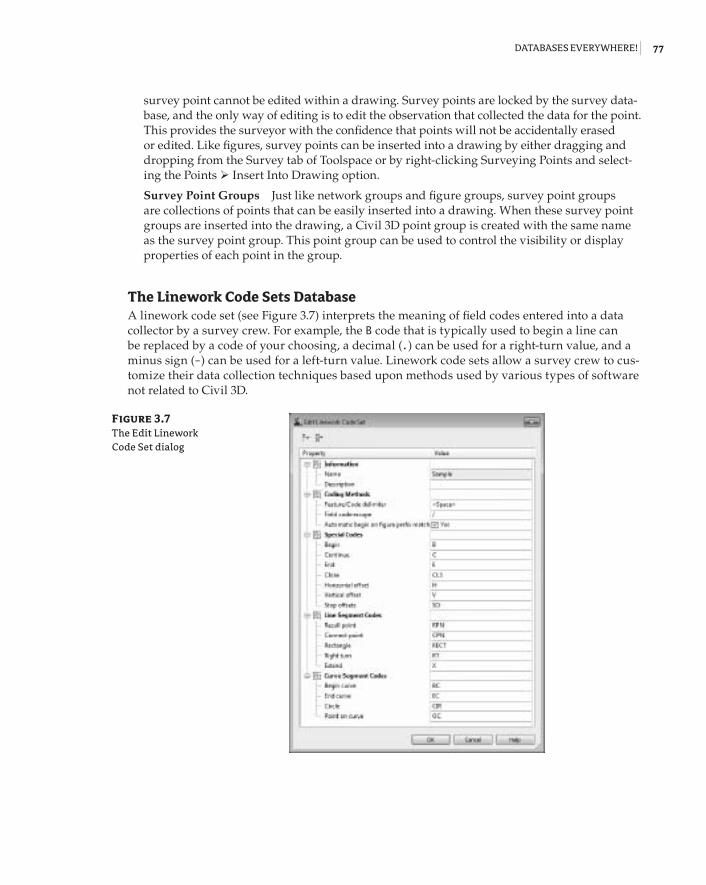
The Linework Code Sets DatabaseA linework code set (see Figure 3.7) interprets the meaning of field codes entered into a data collector by a survey crew. For example, the B code that is typically used to begin a line can be replaced by a code of your choosing, a decimal (.) can be used for a right-turn value, and a minus sign (-) can be used for a left-turn value. Linework code sets allow a survey crew to cus-tomize their data collection techniques based upon methods used by various types of software not related to Civil 3D.
Figure 3.7 The Edit Linework Code Set dialog

78 | Chapter 3 lay of the land: survey
This manner of data collection allows for an incredible amount of flexibility in the field. For example, two consecutive points described in the field as follows could not have been inter-preted properly previously (a figure would not be drawn):
FC1 VA 313 279.571080 61.851 89.414283 ″BLDG9 B″FC1 VA 314 228.405718 51.821 89.381046 ″BLDG9 RT 100 50 25 -25 50 25 CLS″
However, the same information interpreted by Civil 3D 2011 will yield a closed figure, as shown in Figure 3.8.
In the following example, you’ll create an import event, and import an ASCII file with survey data. The survey data includes linework.
1. Create a new drawing from the _AutoCAD Civil 3D (Imperial) NCS.dwt template file.
2. Navigate to the Survey tab of Toolspace.
3. Right-click Survey Databases and select New Local Survey Database. The New Local Survey Database dialog opens.
4. Enter Roadway as the name of the folder in which your new database will be stored.
5. Click OK to dismiss the dialog. The Roadway survey database is created as a branch under the Survey Databases branch.
6. Expand the Roadway survey database, right-click Import Events, and select Import Survey Data to open the Import Survey Data dialog.
7. Select the Roadway survey database and select Next.
8. Select the Point File radio button, and specify the PNEZD (comma delimited) point file format as shown in Figure 3.09.
9. Click the Browse button on the right side of the Selected File text box, and browse to the import points.txt file.
10. Click Open and the name will be listed in the dialog as shown in Figure 3.09. Select Next to open the Import Survey Data – Specify Network dialog.
Figure 3.8 A closed figure interpreted properly

dataBases everyWhere! | 79
11. Click the Create New Network button to open the New Network dialog.
12. Expand the Network property dialog if necessary, and enter Roadway as the Name of the new network. Click OK to dismiss the dialog, and click Next to open the Import Survey Data – Import Options dialog as shown in Figure 3.10.
13. Set the options as shown in Figure 3.10 and click the Finish button to import the data.
Figure 3.9 Selecting the appropriate file and file type from the Import Survey Data Wizard
Figure 3.10 The Import Options dialog in the Import Survey Data Wizard

80 | Chapter 3 lay of the land: survey
The data is imported and the linework is drawn; however, the building is missing the left side. The following steps will resolve the issue:
1. In the Survey tab, select Survey Databases Roadway Networks Roadway Non-Control points.
2. Right-click and select Edit to bring up the Non-Control Points Editor palette in Panorama.
3. Scroll to the bottom of the point list and notice the last line in the file describing point number 34.
4. Move your cursor to the left of the description and type CLS as shown in Figure 3.11. This is the default Close Figure command.″
5. Click the check box in the upper right of the palette to apply changes and save your edits. A warning dialog will appear. Click Yes to apply your changes.
6. Select Survey Databases Roadway Import Events import points.txt. Right-click import points.txt, and select Process Linework to bring up the Process Linework dialog.
7. Click OK to reprocess the linework with your updated point description. The building figure line and your drawing should look something like Figure 3.12.
Figure 3.11 Editing import points.txt to add the CLS com-mand and close the building geometry
Figure 3.12 After editing and reprocessing the linework

dataBases everyWhere! | 81
editing the Surveyed point?
Many surveyors will cringe at this new ability to easily modify the drawing data without updating the source files from the field survey. We think this is an improvement in that you can create draw-ings that accurately reflect personal field observations without modifying the legal record that is the original survey data.
Creating a Field BookOnce the data is collected and in its native format, you have to get the data into a format that can be imported into a survey database. Most users are accustomed to utilizing a simple ASCII or TXT file and importing the points from that file format, but there are several more options.
One common practice utilizes the FBK file, simply referred to as a field book. This electronic field book is a simple text file that contains the survey information and the coding commands from the fieldwork, and it is most often converted from the raw data file in a data collector. How this data is converted really depends on the data collector being used—it is a common file type, but each data collector manufacturer writes their files a different way. The following paragraphs will help explain some of the more common data collectors and the methods used to convert their data into an FBK file.
Trimble Often considered the survey industry leader, Trimble data collectors are becoming more popular every day. Trimble has two major offerings in the data collector market: the Trimble TCS Survey Controller and the Trimble SCS900 Site Controller. Both of these data collectors interact directly with Civil 3D via a freely available download from the Trimble website called Trimble Link. This download will add a Trimble menu to Civil 3D and allow uploading and downloading of data directly using both data collectors as well as Trimble Site Vision software. Trimble Link will take a JOB file (the default file format for Trimble), convert it to an FBK transparently, create a new survey network in an existing database (or create a new database as well), and import the FBK into that newly created network, all in one step. You can download the software (32-bit version only) from http://www.trimble.com/link_ts.asp?Nav=Collection-63438.
TDS Now a division of Trimble, Survey Pro is one of the most popular data collection soft-ware packages on the market today. Having been around for a long time, it seems as if everyone has seen some version of this software being used. The TDS RAW or RW5 file format is the format on which other data-collector manufacturers base their RAW data files. To convert from a TDS RAW data file to an FBK, users must either purchase TDS ForeSight DXM or use TDS Survey Link, which is included in your Civil 3D install. Survey Link can be initiated by typ-ing STARTSURVEYLINK on the command line, or selecting Survey Data Collection Data Link from the Create Ground Data panel on the Home tab.
Leica Leica has been around for quite a while, and a lot of its older equipment is still very serviceable today. The Leica System 1200 data collectors can be integrated with Civil 3D via the use of Leica X-Change. Leica X-Change allows for the import of Leica data and

82 | Chapter 3 lay of the land: survey
conversion to the FBK format, as well as export options for Leica System 1200 collectors. You can download the software from www.leica-geosystems.com/corporate/en/downloads/lgs_page_catalog.htm?cid=239.
Microsurvey Microsurvey has two advantages not shared by any other data collector in this list: it does not need code commands to create linework, and it has the ability to directly export an FBK from the data collector. However, if users demand a conversion process, the Microsurvey RAW data file is based on TDS RAW data, and it can be converted using the included TDS Survey Link.
Carlson Like Trimble, Carlson offers a freely downloadable plugin for Civil 3D. Carlson Connect allows for direct import and export to Carlson SurvCE data collectors as well as a conversion option for drawings containing Carlson point blocks. You can download the software by going to http://update.carlsonsw.com/updates.php and selecting Carlson Connect as the product you are seeking.
Other If none of these tools appeal to you, you still have other options. The group over at CADApps in Australia makes two programs that can convert almost any raw data file into an FBK file. The first is Stringer Connect, a free download. The second is a much more full-functioned program called Stringer. This software will also work with a simple ASCII file of points to convert to an FBK. You can download the software from www.civil3dtools.com/catalog24.html.
a Note about Data Collectors and add-On Software
The Trimble, Leica, and Carlson options were available with Civil 3D 2008, and they have histori-cally been released soon after the yearly release of Civil 3D. However, as this is being written, none of these updates have been posted or even announced. In spite of this, we feel relatively confident that history will repeat itself again this year.
Working with Field BooksOnce you have a survey database created, you have to create a network within that database to enable you to import survey data. As mentioned earlier, individual survey databases can be cre-ated for each survey job that you do, or you can create one overall database per coordinate zone and create individual networks for each survey job. Once you create a network, you can import either an FBK file or a survey LandXML file. This data can then be used to bring survey figures and survey points into a drawing, or it can be analyzed and adjusted. Figure 3.13 illustrates a typical network, with control points, directions, setups, and a traverse. This network also includes figures and survey points that have been derived from the network data.
control Points
Control points are typically points in your data that have a high confidence factor. Figure 3.14 illustrates the data related to a typical control point shown in the Preview pane of Toolspace.

dataBases everyWhere! | 83
non-control Points
Non-control points are also stored in the survey database. Manually created points (hand-entered) or GPS-collected points, such as those located by real-time kinematic (RTK) GPS, are the only types of points that can be non-control points.
Figure 3.13 A typical survey database network and its data
Figure 3.14 Control point data as shown in the Preview pane of Toolspace

84 | Chapter 3 lay of the land: survey
directions
The direction from one point to another must be manually entered into the data collector for the direction to show up later in the survey network for editing. The direction can be as simple as a compass shot between two initial traverse points that serves as a rough basis of bearings for a survey job. In the past, changing this direction was the easiest way to rotate a survey network, but it only worked if the information was provided in the raw data. An example of a direction is shown in Figure 3.15.
setuPs
The setup is typically where the meat of the data is found, especially when working with con-ventional survey equipment. Every setup, as well as the points (sideshots) located from that setup, can be found. Setups will contain two components: the station (or occupy point) and the backsight. Setups, as well as the observations located from the setup, can be edited. The interface for editing setups is shown in Figure 3.16. Angles and instrument heights can also be changed in this dialog.
traverses
The Traverses section is where new traverses are created or existing ones are edited. These traverses can come from your data collector, or they can be manually entered from field notes via the Traverse Editor, as shown in Figure 3.17. You can view or edit each setup in the Traverse Editor, as well as the traverse stations located from that setup.
Figure 3.15 The direction from point 2 to point 1 is 00° 00′ 00″
Figure 3.16 Setups and obser-vations can be changed in the Setups Editor of Panorama
Figure 3.17 The Traverse Edi-tor in Panorama
dataBases everyWhere! | 85
In this exercise, you’ll create a traverse from an FBK file and save it for adjusting later:
1. Create a new drawing from the _AutoCAD Civil 3D (Imperial) NCS.dwt template file.
2. Navigate to the Survey tab of Toolspace.
3. Right-click Survey Databases and select New Local Survey Database. The New Local Survey Database dialog opens.
4. Enter Shopping Center as the name of the folder in which your new database will be stored.
5. Click OK to dismiss the dialog. The Shopping Center survey database is created as a branch under the Survey Databases branch.
6. Expand the Shopping Center survey database, right-click Networks, and select New. The New Network dialog opens.
7. Expand the Network branch in the dialog if needed. Name your new network As-Built. Enter your initials and today’s date as the description. This will serve as an indication of who created the network and when.
8. Click OK. The As-Built network is now listed as a branch under the Networks branch in Prospector.
9. Right-click the As-Built network and select Import Import field book.
10. Open shopping_center.fbk and click OK. The Import Field Book dialog opens.
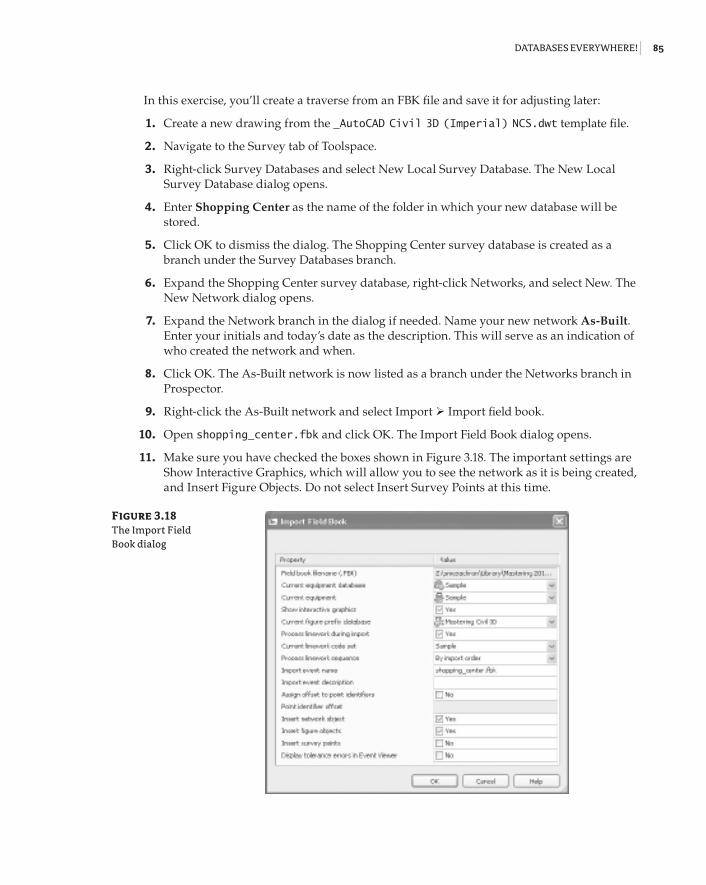
11. Make sure you have checked the boxes shown in Figure 3.18. The important settings are Show Interactive Graphics, which will allow you to see the network as it is being created, and Insert Figure Objects. Do not select Insert Survey Points at this time.
Figure 3.18 The Import Field Book dialog

86 | Chapter 3 lay of the land: survey
12. Click OK to dismiss the dialog and watch your network as it is created. It may take a few minutes to import the entire network, but once it’s imported, you should see figure objects in the drawing. Look at the network data within the survey database. All points in the net-work are listed as non-control points because the entire job was located using RTK GPS.
13. Save the drawing to your desktop as Shopping Center.dwg and close it.
Once you have defined a traverse, you can adjust it by right-clicking its name and selecting Traverse Analysis. You can adjust the traverse either horizontally or vertically, using a variety of methods. The traverse analysis can be written to text files to be stored, and the entire net-work can be adjusted on the basis of the new values of the traverse, as you’ll do in the following exercise:
1. Create a new drawing from the _AutoCAD Civil 3D (Imperial) NCS.dwt template file.
2. Navigate to the Survey tab of Toolspace.
3. Right-click Survey Databases and select New Local Survey Database. The New Local Survey Database dialog opens.
4. Enter Traverse as the name of the folder in which your new database will be stored.
5. Click OK to dismiss the dialog. The Traverse survey database is created as a branch under the Survey Databases branch.
6. Expand the Traverse branch, right-click Networks, and select New. The New Network dialog opens.
7. Expand the Network branch in the dialog if needed. Name your new network Traverse Practice.
8. Click OK. The Traverse Practice network is now listed as a branch under the Networks branch of the Traverse survey database in Prospector.
9. Right-click the Traverse Practice network and select Import Import field book.
10. Select the traverse.fbk file and click Open. The Import Field Book dialog opens.
11. Make sure you have checked the boxes shown in Figure 3.19. You will be inserting the points into the drawing this time.
12. Click OK.
Inspect the data contained within the network. You have one control point—point 2—that was manually entered into the data collector. There is one direction, and there are four setups. Each setup combines to form a closed polygonal shape that defines the traverse. Notice that there is no traverse definition. In the following exercise, you’ll create that traverse definition for analysis:
1. Right-click Traverses under the Traverse Practice network and select New to open the New Traverse dialog.

dataBases everyWhere! | 87
2. Name the new traverse Traverse 1.
3. Enter 2 as the value for the Initial Station and 1 (if necessary) for the Initial Backsight.
The traverse will now pick up the rest of the stations in the traverse and enter them into the next box.
4. Enter 2 as the value for the Final Foresight if necessary (the closing point for the traverse). Click OK.
5. Right-click Traverse 1 in the bottom portion of the Toolspace. Select Traverse Analysis.
6. In the Traverse Analysis dialog, ensure that Yes is selected for Do Traverse Analysis and Do Angle Balance.
7. Select Least Squares for the Horizontal and Vertical Adjustment Method.
8. Select 30,000 for the Horizontal and Vertical Closure Limit 1:X.
9. Make sure the option Update Survey Database is set to Yes.
10. Click OK.
The analysis is performed, and four text files are displayed that show the results of the adjust-ment. Note that if you look back at your survey network, all points are now control points, because the analysis has upgraded all the points to control point status.
Figure 3.19 The Import Field Book dialog
88 | Chapter 3 lay of the land: survey
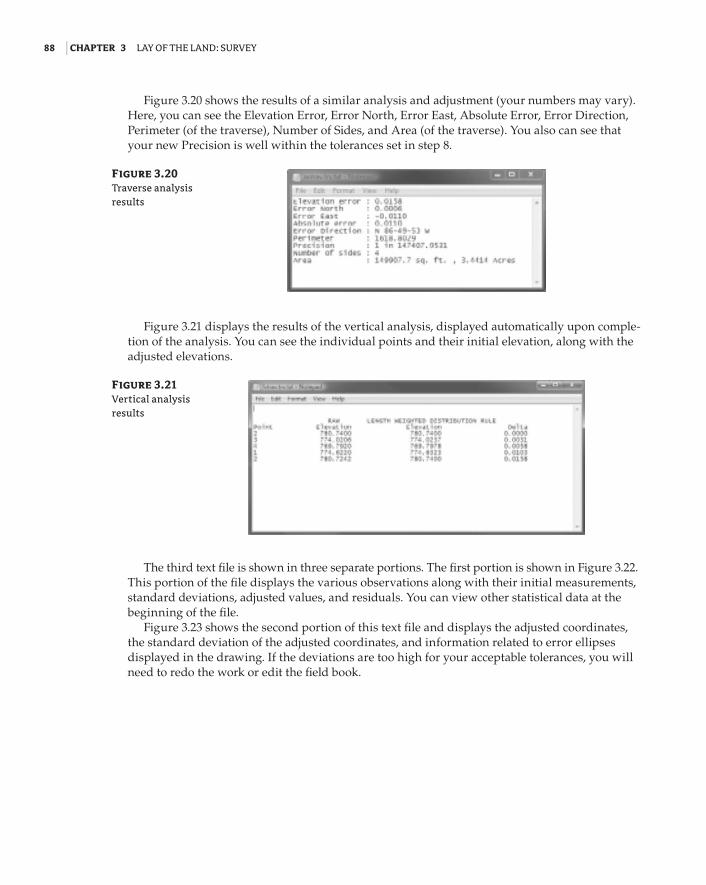
Figure 3.20 shows the results of a similar analysis and adjustment (your numbers may vary). Here, you can see the Elevation Error, Error North, Error East, Absolute Error, Error Direction, Perimeter (of the traverse), Number of Sides, and Area (of the traverse). You also can see that your new Precision is well within the tolerances set in step 8.
Figure 3.21 displays the results of the vertical analysis, displayed automatically upon comple-tion of the analysis. You can see the individual points and their initial elevation, along with the adjusted elevations.
The third text file is shown in three separate portions. The first portion is shown in Figure 3.22. This portion of the file displays the various observations along with their initial measurements, standard deviations, adjusted values, and residuals. You can view other statistical data at the beginning of the file.
Figure 3.23 shows the second portion of this text file and displays the adjusted coordinates, the standard deviation of the adjusted coordinates, and information related to error ellipses displayed in the drawing. If the deviations are too high for your acceptable tolerances, you will need to redo the work or edit the field book.
Figure 3.20 Traverse analysis results
Figure 3.21 Vertical analysis results

dataBases everyWhere! | 89
Figure 3.22 Statistical and observation data
Figure 3.23 Adjusted coordi-nate information

90 | Chapter 3 lay of the land: survey
Figure 3.24 displays the final portion of this text file—the Blunder Detection and Analysis. Civil 3D will look for and analyze data in the network that is obviously wrong and choose to keep it or throw it out of the analysis if it doesn’t meet your criteria. If a blunder (or bad shot) is detected, the program will not fix it. You will have to edit the data manually, whether by going out in the field and collecting the correct data or by editing the FBK file.
other methods of maniPulating survey data
Often, it is necessary to edit the entire survey network at one time. For example, rotating a net-work to a known bearing or azimuth from an assumed one happens quite frequently. However, unless directions are defined in the field book file, changing that rotation is difficult. Previously, you would have to calculate several coordinates to make a rotation and/or translation. However, if you change to the Modify tab and choose Survey from the Ground Data panel, you’ll open a Survey tab. On the Survey tab, choose Translate Database from the Modify panel to manipulate the location of a network.
Figure 3.24 Blunder analysis

dataBases everyWhere! | 91
Questioning the results
A traverse completed using the aforementioned process will create a Traverse 1.lsi file. This is known as the input file. The input file can be edited using Windows Notepad. Opening this file reveals something like this snippet:
?NEZ 1 13740905.915851 2157152.441122 774.599442NEZ 2 13740803.176500 2156598.905200 780.740000?NEZ 3 13740513.387064 2156723.987321 774.020112?NEZ 4 13740471.057054 2157000.167405 769.790530
If you remove the question mark from the front of any line, Civil 3D will then use that point as another monument when balancing the survey. This may be necessary because the initial point and the first foresight or backsight may be known local monuments with known coordinate values.
Use the following steps as a guideline to balancing a traverse via this method:
1. Create a network and import a field book using normal methods.
2. Right-click the name of the network and select Least Squares Analysis Perform Analysis.
3. Right-click the name of the network and select Least Squares Analysis Edit Input File.
4. Remove the necessary question marks in the .lsi file and save the file.
5. Right-click the name of the network and select Least Squares Analysis Process Input File.
6. Right-click the name of the network and select Least Squares Analysis Update Survey Database.
7. Right-click the name of the network and select Points Update.
As you can see, this process is longer than the simple traverse adjustment of the prior exercise, but it allows greater flexibility. It’s interesting to note that when you use this methodology, a traverse does not need to be defined.
Manipulating the Network
Translating a survey network can move a network from an assumed coordinate system to a known coordinate system, it can rotate a network, and it can adjust a network from assumed elevations to a known datum.
1. Create a new drawing from the NCS Extended Imperial template file.
2. In the Survey tab of Toolspace, right-click and select New Local Survey Database. The New Local Survey Database dialog opens. Enter Translate in the text box. This is the name of the folder for the new database.
3. Click OK, and the Translate database will now be listed under the Survey Databases branch on the Survey tab.

92 | Chapter 3 lay of the land: survey
4. Select Networks under the new Translate branch. Right-click and select New to open the New Network dialog. Enter Translate as the name of this new network. Click OK to dismiss the dialog.
5. Right-click the Translate network, and select Import Import Field Book.
6. Navigate to the traverse.fbk file, and click Open. The Import Field Book dialog opens. Select OK to accept the default options.
7. Update the Point Groups collection in Prospector so that the points show up in the drawing if needed.
8. Draw an orthogonal polyline directly from point 3 (the point to the southwest), to the north of point 3 (toward the middle of the loop). It can be any length, but be sure to use the object snap node at point 3.
9. Change to the Modify tab and choose Survey from the Ground Data panel to open the Survey tab.
10. Choose Translate Database from the Modify panel drop-down menu.
11. For the purposes of this exercise, you will leave the points on their same coordinate system, but change the bearing of the line defined from point 3-point 2 to due north. Elevations will remain unchanged.
12. In the first window, type 3 as the Number. This is the Base Point number (the number that you will be rotating the points around). Click Next.
13. In the next window, click the Pick in Drawing button in the lower-left corner to specify the new angle.
14. Using osnaps, pick point 3 and then point 2 (to the northwest) for your Reference Angle.
15. When prompted to Specify New Direction, Pick point 3, and then somewhere along the orthogonal polyline when prompted to Specify Second Point to define the new angle. Click Next.
16. In the next window, click the Pick in Drawing button on the lower left to pick point 3 as the Destination Point. This will essentially negate any translation features and provide you with only a rotation.
17. Leave the Elevation Change box empty. If you were raising or lowering the elevations of the network, this box is where you would enter the change value.
18. Click Next to review your results, and Finish to complete the translation.
19. Go back to the drawing and inspect your points. Point 2 should now be due north of point 3.
20. Close the drawing without saving. Even though you did not save the drawing, the changes were made directly to the database and the network can be imported into any drawing.
Other Survey FeaturesTwo other components of the survey functionality included with Civil 3D 2011 are the Astronomic Direction Calculator and the Geodetic Calculator. The Astronomic Direction Calculator, shown in Figure 3.25, is used to calculate sun shots or star shots.

dataBases everyWhere! | 93
The Geodetic Calculator is used to calculate and display the latitude and longitude of a selected point, as well as its local and grid coordinates. It can also be used to calculate unknown points. If you know the grid coordinates, the local coordinates, or the latitude and longitude of a point, you can enter it into the Geodetic Calculator and create a point at that location. Note that the Geodetic Calculator only works if a coordinate system is assigned to the drawing in the Drawing Settings dialog. In addition, any transformation settings specified in this dialog will be reflected in the Geodetic Calculator, shown in Figure 3.26.
Figure 3.25 The Astronomic Direction Calculator
Figure 3.26 The Geodetic Calculator

94 | Chapter 3 lay of the land: survey
The Bottom Line
Properly collect field data and import it into AutoCAD Civil 3D 2011 You learned best practices for collecting data, how the data is translated into a usable format for the survey database, and how to import that data into a survey database. You learned what commands draw linework in a raw data file, and how to include those commands into your data collection techniques so that the linework is created correctly when the field book is imported into the program.
Master It In this exercise, you’ll create a new drawing and a new survey database and import the Shopping_Center.fbk file into the drawing.
Set up styles that will correctly display your linework You learned how to set up styles for figures. You also learned that figures can be set as breaklines for surface creation and lot lines and that they can go on their own layer and be displayed in many different ways.
Master It In this exercise, you’ll use the Mastering1.dwg file and survey database from the previous exercise and create figure styles and a figure prefix database for the various figures in the database.
Create and edit field book files You learned how to create field book files using various data collection techniques and how to import the data into a survey database.
Master It In this exercise, you’ll create a new drawing and survey database. Open the field notes.pdf file and use a data collector (data collector emulators can be downloaded from the websites of data collector manufacturers) to input the field notes. Export the raw data, convert it into an FBK file, and import it into the new survey database.
Manipulate your survey data You learned how to use the traverse analysis and adjustments to create data with a higher precision.
Master It In this exercise, you’ll use the survey database and network from the previ-ous exercises in this chapter. You’ll analyze and adjust the traverse using the following criteria:
Use the Compass Rule for Horizontal Adjustment.•u
Use the Length Weighted Distribution Method for Vertical Adjustment.•u
Use a Horizontal Closure Limit of 1:25,000.•u
Use a Vertical Closure Limit of 1:25,000.•u