Embed Size (px)
Citation preview

Chapter 3: How Climate Change will Affect People Around the World
Lawrence TseChris Whitehouse

Outline
¡ 3.1 Introduction¡ 1°C¡ 3.2 Water¡ 2°C¡ 3.3 Food¡ 3°C¡ 3.4 Health¡ 4°C¡ 3.5 Land + 3.6 Infrastructure¡ 5°C¡ 3.7 Environment¡ More Than 5°C¡ 3.8 Non-Linear Changes and Threshold Effects¡ 3.9 Conclusion

3.1 Introduction
Temperature projections for the 21st century
¡ First need to asses likely climate change
¡ Multiple models give a range of outcomes

3.1 Introduction
Medium 2% p.a. $235 trillion
High, 2.75% p.a. ($328 trillion)
Medium, 2% p.a. ($243 trillion)
Very high, 3.5% p.a. ($550 trillion)
World GDP Growth
Medium (3.0)High (1.8)Low (4.2)High (1.6)Degree of convergence: ratio of GDP per capita in rich vs. poor countries
Medium LowLowMedium HighHighEmissions
Medium (10 Billion)
Low (7 Billion)
High(15 Billion)
Low(7 Billion)Population Growth
Local Stewardship
Global Sustainability
National Enterprise
World Markets
Name
B2B1A2A1 F1IPCC Scenarios
¡ Summary characteristics of IPCC socio-economic scenarios (numbers in brackets for 2100)

3.1 Introduction¡ From the IPCC website
l A1: World Markets = Global and Economicl A2: National Enterprise = Regional and Economicl B1: Global Sustainability = Global and Environmentall B2: Local Stewardship = Regional and Environmental

1°C
Atlantic ThermohalineCirculation starts to weaken.
At least 10% of land species facing extinction, 80% bleaching of coral reefs.
Permafrost thawing damages buildings and roads in parts of Canada and Russia
At least 300, 000 people each year die from climate related disease, reduction in mortality in higher latitudes.
Modest increase in cereal yield in temperate regions.
Small glaciers in the Andes disappear completely, threatening water supplies for 50 million people.
Abrupt and Large Scale Impacts
EnvironmentLand + Infrastructure
HealthFoodWater

3.2 Water
¡ Water provision presents biggest impact of Climate Change
¡ Water cycle will Intensify¡ Increased flood and drought risk to 1
billion people

3.2 Water¡ Changes in runoff with five different climate models¡ Regional differences become more pronounced
¡ Water stress is a useful indicator of water availability¡ Defined as average runoff / number of people¡ <1000m3 per person per year = water stress
¡ Already, 1/3 population experience moderate to high water stress

2°C
15 - 40% species facing extinction, high risk of extinction for Arctic species including polar bears and caribou
Up to 10 million more people affected by coastal flooding each year
40 to 60 million more people exposed to malaria in Africa
Sharp decline in crop yields in tropical regions.
Potentially 20-30% decrease in water availability in some vulnerable regions e.g. southern Africa and the Mediterranean.
Abrupt and Large Scale Impacts
EnvironmentLand + Infrastructure
HealthFoodWater

3.3 Food
-15
-10
-5
0
5
10
15
Global Developed Developing
% Ch
ange
GISSGFDLUKMO
¡ GISS = Global Institute for Space Studies – NASA¡ GFDL = Geophysical Fluid Dynamics Laboratory¡ UKMO = UK Met Office
¡ Food production sensitive to climate change¡ Low levels of warming increase yields in northern latitudes¡ In tropical regions small amounts of warming will lead to declines in yield¡ Declining yields to leave hundreds of millions without food, particularly the poor
¡ Changes in Cereal production - 3°C

3.3 Food¡ Carbon fertilisation effect
¡ Impacts of climate change on agriculture depend on magnitude of carbon fertilisation effect
¡ Rising levels of CO2 are beneficial to photosynthesis
¡ However, prevailing conditions may have negative impacts
¡ Balance?
¡ Ocean Acidification¡ Major consequences for marine ecosystems

3°C
20 – 50% of species facing extinction including; 25 – 60% of mammals, 30 – 40% of birds, 15 –70% of butterflies and the Amazon Forest collapse
1 to 170 million more people affected by coastal flooding each year
1 to 3 million more people die from malnutrition
150-550 additional millions at risk of hunger. Agricultural yields in higher latitudes likely to peak
In southern Europe serious droughts occur one in every ten years. 1-4 billion more people suffer water shortages whilst 1-5 billion gain water, which may increase flood risk
Abrupt and Large Scale Impacts
EnvironmentLand + Infrastructure
HealthFoodWater

3.4 Health¡ Climate change will increase worldwide deaths from malnutrition and
heat stress.¡ The distribution and abundance of disease vectors are closely linked
to temperature and rainfall patterns.¡ According to one study, a 2°C rise in temperature may lead to 40 – 60
million more people exposed to malaria in Africa (9 – 14% increase on present-day), increasing to 70 – 80 million (16 – 19%) at higher temperatures, assuming no change to malaria control efforts.
¡ Climate change will also increase the global population exposed to dengue fever, predominantly in the developing world, e.g. 5 – 6 billion people exposed with a 4°C temperature rise compared with 3.5 billion people exposed with no climate change.
¡ Droughts and floods lead to disease, also causing death from dehydration or drowning.
¡ Prolonged droughts will fuel forest fires that release respiratory pollutants
¡ Floods foster growth of infectious fungal spores, create new breeding sites for disease vectors such as mosquitoes, and trigger outbreaks of water-borne diseases like cholera.
¡ In higher latitudes, cold-related deaths will decrease.

Figure: Stylised U-shaped human mortality curves as a function oftemperatureReference: McMichael et al. (2006)
3.4 Health
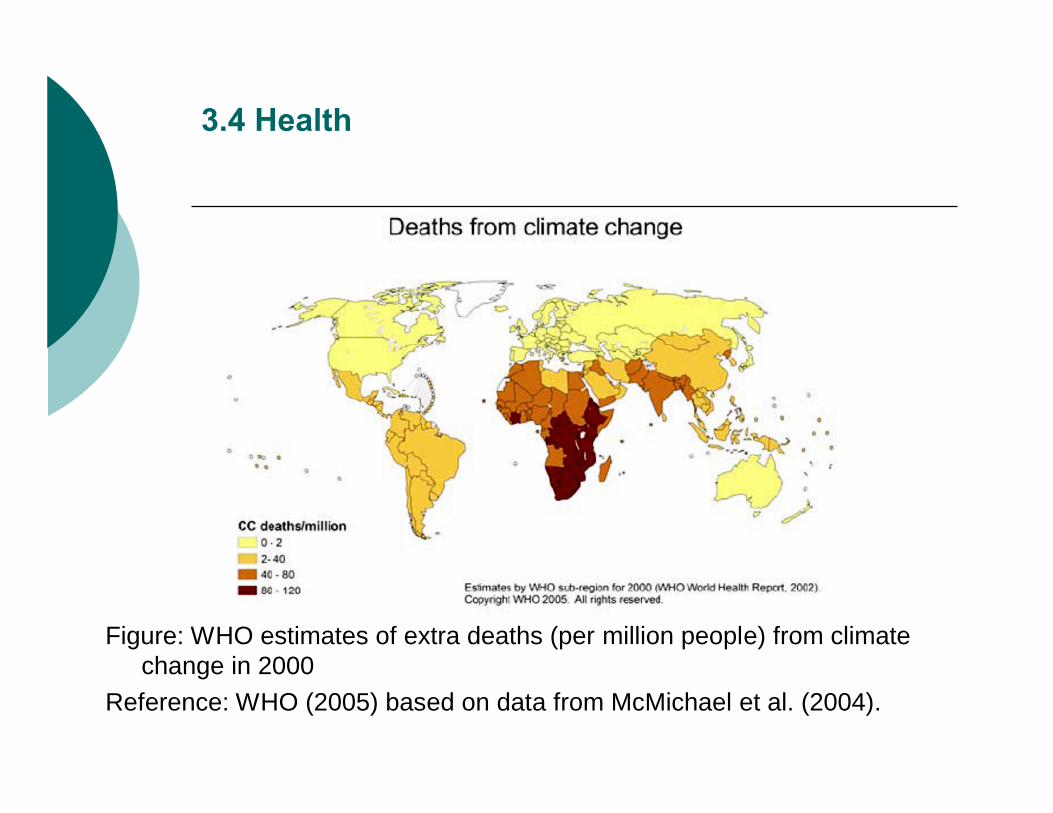
Figure: WHO estimates of extra deaths (per million people) from climate change in 2000
Reference: WHO (2005) based on data from McMichael et al. (2004).
3.4 Health

4°C
Loss of half of Arctic tundra. Around half of world’s nature reserves can not fulfil objectives
7 – 300 million more people affected by coastal flooding each year
Up to 80 million more people exposed to Malaria in Africa
Agricultural yields decline by 15 – 35% in Africa and entire regions out of parts of Australia
Potential 30 – 50% decrease in water availability in southern Africa and Mediterranean
Abrupt and Large Scale Impacts
EnvironmentLand + Infrastructure
HealthFoodWater

3.5 Land + 3.6 Infrastructure
¡ Sea level rise will increase coastal flooding, raises costs of coastal protection, lead to loss of wetlands and coastal erosion, and increase saltwater intrusion into surface and groundwater.
¡ The homes of tens of millions more people are likely to be affected by flooding from coastal storm surges with rising sea levels. People in South and East Asia will be most vulnerable, along with those living on the coast of Africa and on small islands.
¡ Some estimates suggest that 150-200 million people may become permanently displaced by the middle of the century due to rising sea levels, more frequent floods, and more intense droughts.
¡ Damages to infrastructure from storms will increase substantially from only small increases in event intensity. Changes in soil conditions (from droughts or permafrost melting) will influence the stability of buildings and roads.

5°C
Sea levels rise, threatening small islands, low lying coastal areas and major world cities such as New York, London, and Tokyo
Continued increase in ocean acidity seriously disrupting marine eco-systems and possibly fish stocks
Possible disappearance of large glaciers in the Himalayas affecting one quarter of China’s population and hundreds of millions in India
Abrupt and Large Scale Impacts
EnvironmentLand + Infrastructure
HealthFoodWater

3.7 Environment
¡ Climate change likely to occur too rapidly for many species to adapt.
¡ One study estimates that around 15-40% of species face extinction with 2ºC of warming.
¡ Strong drying up over the Amazon, as predicted by some climate models, would result in dieback of forest with the highest biodiversity on the planet.

More than 5°C
The latest science suggest that Earth’s average temperature will rise by even more than 5-6°C if emissions continue to grow and positive feedbacks amplify the warming effects of green house gases (e.g. release of carbon dioxide from soils or methane from permafrost). This level of global temperature rise would be equivalent to the amount of warming that occurred between the last ice age and today – and is likely to lead to major disruption and large scale movement of population. Such “socially contingent” effects could be catastrophic, but are currently very hard to capture with current models as temperatures would be so far outside human experience.
Abrupt and Large Scale Impacts
EnvironmentLand + Infrastructure
HealthFoodWater

3.8 Non-Linear Affects¡ Warming will increase the chance of triggering abrupt and large-
scale changes¡ Melting/collapse of polar ice sheets would accelerate sea level rise
and eventually lead to substantial loss of land, affecting around 5% of the global population (around 270 million people).
¡ $2 trillion worth of GDP would be threatened by a 5-m rise. ¡ The most vulnerable regions are South and East Asia, which could
lose 15% of their land area (an area over three times the size of the UK). Many major world cities would likely have to be abandoned unless costly flood defences were constructed.
¡ Warming may induce sudden shifts in regional weather patterns that have severe consequence for water availability in tropical regions:
¡ Changes in the timing and variability of rainfall, both within the wet season and between years that are likely to have the most significant impacts on lives and livelihoods. A year-to-year fluctuation of just 10% in average rainfall can lead to food andwater shortages.

Non-Linear Changes and Threshold Effects (2)
O’Neill and Oppenheimer (2002)
Low>3-5ºCComplete collapse of North Atlantic ThermohalineCirculation
Wood et al. (2006)
HighGradual weakening from present
Weakening of North Atlantic Thermohaline Circulation
Oppenheimer (2005)
Low>2-5ºCSubstantial melting threatening the stability of West Antarctic Ice Sheet
Lowe et al. (2006)Medium2-3ºCOnset of irreversible melting of Greenland
Hoskins (2003)MediumUncertainShifts in regional weather regimes
ReferencesRelative Confidence
Global Temp. Rise (Above pre-industrial)
Phenomenon
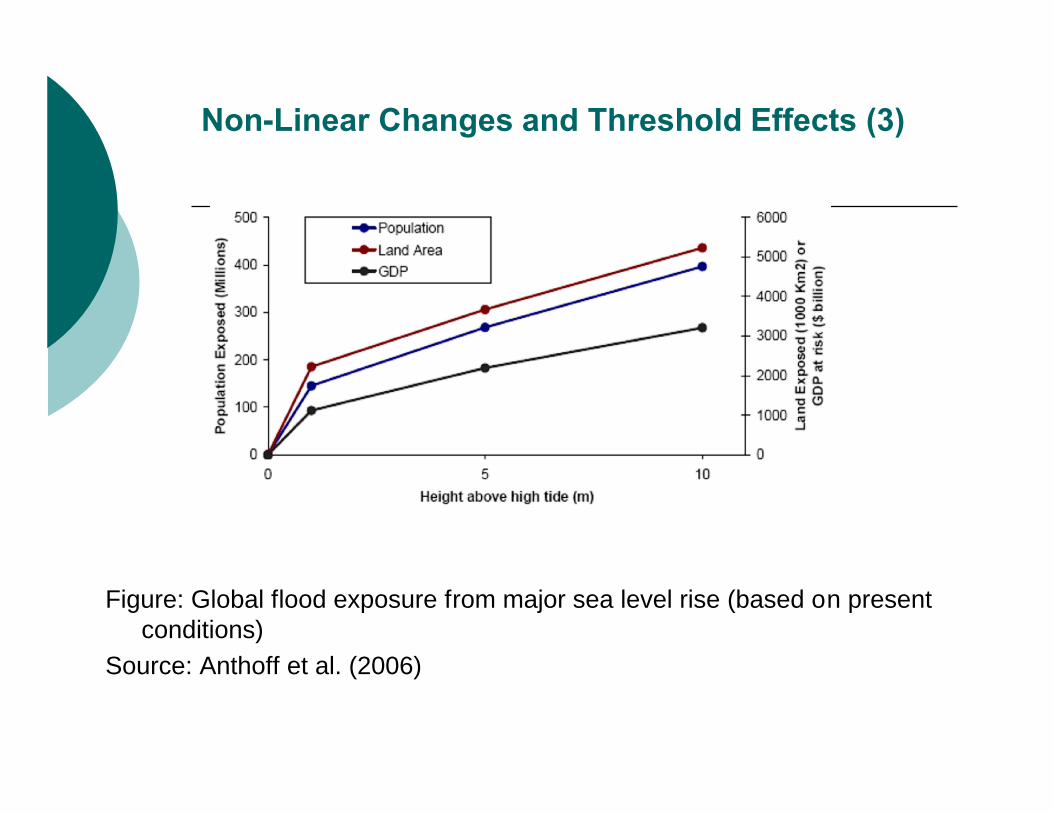
Figure: Global flood exposure from major sea level rise (based on present conditions)
Source: Anthoff et al. (2006)
Non-Linear Changes and Threshold Effects (3)

3.9 Conclusion
¡ The potential affects on people increase exponentially with each degree of temperature increase
¡ Ranges will be felt widely in particularly:l Waterl Foodl Healthl Landl Environment
¡ The volatility of change could lead to catastrophic social changes