Embed Size (px)
Citation preview
CHAPTER -3
Financial Performance Evaluation of SBI
3.1 Introduction
3.2 Growth and Development of SBI
3.3 Trend of branches of SBI
3.4 Trend of Profit and Loss of SBI.
3.5 Trend of employee of SBI.
3.6 Total Income
3.7 Financial Performance of SBI
3.8 Bank Size
3.9 Trend of Profitability Ratio
3.10 Liquidity Position
3.11 Nonperforming Assets
3.12 Conclusion
Chapter 3 Financial Performance Evaluation of SBI
Chapter 3
Financial Performance Evaluation of SBI
3.1 Introduction
The previous chapter is related to the conceptual and regulatory
framework of Indian banking industry. It includes evolution of banking, its growth
before independence, after independence and again segregated into pre-reform
and post-refornn period, its current position and its role in Indian economy. The
present chapter deals with the financial performance of SBI on the account of
some parameters. It deals with the financial performance of SBI overall, which
includes history grov\rth profitability, solvency, NPA and liquidity of SBI. The
performance evaluation also being made by calculating the financial ratio. The
importance's of financial system for economic development of a country were
recognized worldwide as well as in India. The policy makers, which comprise the
Reserve Bank of India (RBI), Ministry of Finance and related government and
Financial Sector Regulatory entities, have made severable notable efforts to
improve the regulation in this sector. The sector now compare favorably with
banking sector and bank to bank comparison on the metric like growth, efficiency
and profitability and Non Performing Assets (NPA's). The two major players of
Public Sector and Private Sector bank were SBI and ICICI Bank respectively.
The main challenges facing the commercial banks in India are the disbursement
of funds in quality assets (loans and advances) or otherwise it leads to NPA.
Secondly efficiency in terms of interest spread, net interest margin, return on
owners equity ratio, thirdly liquidity as to total assets in investment, advances,
cash and cash equivalent terms, fourthly leverage ratio described in the ratio of
capital, Deposit to Equity Ratio. These are the bases for showing the
performance of SBI.
106
Chapter 3 Financial Performance Evaiuaiion of SBI
The origin of the SBI goes back to the first decade of the nineteenth
century with the establishment of the Bank of Calcutta in Calcutta on 2 June
1806\ Three years later the bank received its charter and was re-designed as
the Bank of Bengal (2 January 1809). A unique institution, it was the first joint-
stock bank of British India sponsored by the Government of Bengal. The Bank of
Bombay (15 April 1840) and the Bank of Madras (1 July 1843) followed the Bank
of Bengal. These three banks remained at the apex of modern banking in India
until their amalgamation as the Imperial Bank of India on 27 January 1921.
Primarily Anglo-Indian creations, the three presidency banks came into existence
either as a result of the compulsions of imperial finance or by the felt needs of
local European commerce and were not imposed from outside in an arbitrary
manner to modernize India's economy. Their evolution was, however, shaped by
ideas culled from similar developments in Europe and England, and was
influenced by changes occurring in the structure of both the local trading
environment and those in the relations of the Indian economy to the economy of
Europe and the global economic framework.
The establishment of the Bank of Bengal marked the advent of limited
liability, joint stock banking in India. So was the associated innovation in banking,
viz. the decision to allow the Bank of Bengal to issue notes, which is accepted for
payment of public revenues within a restricted geographical area^. This right of
note issue was very valuable for not only the Bank of Bengal but also its two
siblings, the Banks of Bombay and Madras. The concept of deposit banking was
also an innovation because the practice of accepting money for safekeeping and
in some cases, even investment on behalf of the clients by the indigenous
bankers had not spread as a general habit in most parts of India. However, for a
long time, and especially up to the time that the three presidency banks had a
right of note issue, bank notes, and government balances made up the bulk of
the investible resources of the banks. The three banks governed by royal
charters, which revised from time to time. Each charter provided for a share
107
Chapter 3 Financial Performance Evaluation of SBI
capital, four-fifth of which were privately subscribed and the rest owned by the
provincial government. The members of the board of directors, which managed
the affairs of each bank, were mostly proprietary directors representing the large
European managing agency houses in India.' The rest were government
nominees, invariably civil servants, one of whom elected as the president of the
board.
The business of the banks initially confined to discounting of bills of
exchange or other negotiable private securities, keeping cash accounts and
receiving deposits and issuing and circulating cash notes. Loans were restricted
to Rs one lakh and the period of accommodation confined to three months only.
The security for such loans was public securities, commonly called Company's
Paper, bullion, treasure, plate, jewels, or goods 'not of a perishable nature' and
no interest could be charged beyond a rate of twelve per cent. Loans against
goods like opium, indigo, salt woolens, cotton, cotton piece goods, mule twist and
silk goods had granted but such finance by way of cash credits gained
momentum only from the third decade of the nineteenth century. All commodities,
including tea, sugar, and jute, which began financed later, either pledged or
hypothecated to the bank. Demand promissory notes were signed the borrower
in favor of the guarantor, which was in turn endorsed to the bank. Lending
against shares of the banks or on the mortgage of houses, land and other real
property. However, Indians were the principal borrowers against deposit of
Company's paper, while the business of discounts on private as well as salary
bills was almost the exclusive monopoly of individuals Europeans and their
partnership firms. Nevertheless, the main function of the three banks, as far as
the government was concerned, was to help the latter raise loans from time to
time and also provide a degree of stability to the prices of government securities.
A major change in the conditions of operation of the Banks of Bengal, Bombay,
and Madras occurred after 1860. With the passing of the Paper Currency Act of
1861, the right of note issue of the presidency banks abolished and the
108
Chapter 3 Financial Performance Evaluation of SBI
Government of India assumed from 1 March 1862 the sole power of Issuing
paper currency within British India. The task of management and circulation of
the new currency notes was verified on the presidency banks and the
Government undertook to transfer the Treasury balances to the banks at places
where the banks would open branches. None of the three banks had tilled then
any branches (except the sole attempt and that too short-lived one by the Bank
of Bengal at Mirzapure in 1839) although the charters had given them such
authority. However, as soon as the three presidency bands were assured of the
free use of government Treasury balances at places where they would open
branches, they embarked on branch expansion at a rapid pace. By 1876, the
branches, agencies, and sub agencies of the three presidency banks covered
most of the major parts and many of the inland trade centers in India. While the
Bank of Bengal had eighteen branches including its head office, seasonal
branches, and sub agencies, the Banks of Bombay and Madras had fifteen each.
The presidency Banks Act, which came into operation on 1 May 1876,
brought the three presidency banks under a common statute with similar
restrictions on business. The proprietary connection of the Government however,
terminated, though the banks continued to hold charge of the public debt offices
in the three presidency towns, and the custody of a part of the government
balances. The Act also stipulated the creation of Reserve Treasuries at Calcutta,
Bombay, and Madras into which sums above the specified minimum balances
promised to the presidency banks at only their head offices been lodged. The
Government could lend to the presidency banks from such Reserve Treasuries
but the latter could look upon them more as a favors than as a right. The decision
of the Government to keep the surplus balances in Reserve Treasuries outside
the normal control of the presidency banks and the connected decision not to
guarantee minimum government balances at new places where branches were
to be opened effectively checked the growth of new branches after 1876. The
pace of expansion witnessed in the previous decade fell sharply although, in the
109
Chapter 3 Financial Perfornnance Evaluation of SB!
case of the Bank of Madras, it continued on a modest scale as the profits of that
bank mainly derived from trade dispersed among a number of port towns and
inland centre of the presidency. India witnessed rapid commercialization in the
last quarter of the nineteenth century as its railway network expanded to cover all
the major regions of the country. New irrigation networks in Madras, Punjab, and
Sind accelerated the process of conversion of subsistence crops into cash crops,
a portion of which found its way into the foreign markets. Tea and coffee
plantations transformed large areas of the eastern Terrains, the hills of Assam
and the Nilgiris into regions of estate agriculture par excellence. All these
resulted in the expansion of India's international trade more than six-fold. The
three presidency banks were both beneficiaries and promoters of this
commercialization process as they became involved in the financing of practically
every trading, manufacturing, and mining activity in the sub-continent. While the
Banks of Bengal and Bombay were engaged in the financing of large modern
manufacturing industries, the Bank of Madras went into the financing of large
modern manufacturing industries; the Bank of Madras went into the financing of
small-scale industries in a way, which had no parallel elsewhere. But the three
banks were rigorously excluded from any business involving foreign exchange.
Not only was such business considered risky for these banks, which held
government deposits, it was also feared that these banks enjoying government
patronage would offer unfair competition to the exchange banks which had by
then arrived in India. This exclusion continued until the creation of the Reserve
Bank of India in 1935.
The presidency Banks of Bengal, Bombay and Madras with their 70
branches had been merged in 1921 to form the Imperial Bank of India. The triad
had been transformed into a monolith and a giant among Indian commercial
banks had emerged. The new bank took on the triple role of a commercial bank,
a banker's bank, and a banker to the government. However, this creation
proceeded by years of deliberations on the need for a 'State Bank of India'. What
110
Chapter 3 Financial Performance Evaluation of SBI
eventually emerged was a 'half-way house' combining the functions of a
commercial bank and a quasi-central bank'*. The establishment of the Reserve
Bank of India as the central bank of the country in 1935 ended the quasi-central
banking role of the Imperial Bank. The latter ceased to be bankers to the
Government of India and instead became agent of the Reserve Bank for the
transaction of government business at centers at which the central bank was not
established. However, it continued to maintain currency chests and small coin
depots and operate the remittance facilities scheme for other banks and the
public on terms stipulated by the Reserve Bank. It also acted as a bankers' bank
by holding their surplus cash and granting them advances against authorized
securities. The management of the bank clearing houses also continued with it at
many places where the Reserve Bank did not have offices. The bank was also
the biggest tendered at the Treasury bill auctions conducted by the Reserve
Bank on behalf of the Government. The establishment of the Reserve Bank
simultaneously saw important amendments were being made to the constitution
of the Imperial Bank converting it into a purely commercial bank. The earlier
restrictions on its business been removed and the bank permitted to undertake
foreign exchange business and executor and trustee business for the first time.
The Imperial Bank during the three and a half decades of its existence
recorded an impressive grov/ih in terms of offices, reserves, deposits,
investments and advances, the increases in some cases amounting to more than
six-fold. The financial status and security inherited from its forerunners no doubt
provided a firm and durable platform. However, the lofty traditions of banking
which the Imperial Bank consistently maintained and the high standard of
integrity it observed in its operations inspired confidence in its depositors that no
other bank in India could perhaps then equal. All these enabled the Imperial
Bank to acquire a pre-eminent position in the Indian banking industry and secure
a vital place in the country's economic life.
111
Chapter 3 Financial Performance Evaluation of SB!
When India attained freedom, the Imperial Bank had a capital base
(including reserves) of Rs.11.85 crores, deposits and advances of Rs.275.14
crores, and Rs.72.94 crores, respectively and a network of 172 branches and
more than 200 sub offices extending all over the country.^
In 1951, when the First Five Year Plan launched, the development of rural
India were given the highest priority. The commercial banks of the country
including the Imperial Bank of India had until then confined their operations to the
urban sector and were not equipped to respond to the emergent needs of
economic regeneration of the rural areas. In order, therefore, to serve the
economy in general and the rural sector in particular, the All India Rural Credit
Survey Committee recommended the creation of a state partnered and state-
sponsored bank by taking over the Imperial Bank of India, and integrating with it,
the former state-owned or state-associate banks. An act passed in Parliament in
May 1955 and the State Bank of India constituted on 1 July 1955. More than a
quarter of the resources of the Indian banking system thus passed under the
direct control of the State. Later, the State Bank of India (Subsidiary Banks) .Act
was being passed in 1959, enabling the State Bank of India to take over eight
former State-associated banks as its subsidiaries (later named Associates)^.
The State Bank of India was destined to act as the pacesetter in this
respect and lead the Indian banking system into the exciting field of national
development. The State Bank of India, the country's oldest Bank and a premier in
terms of balance sheet size, number of branches, market capitalization and
profits is today going through a momentous phase of Change and
Transformation. The two hundred year old Public sector behemoth is today
stirring out of its Public Sector legacy and moving with an ability to give the
Private and Foreign Banks a run for their money. The bank is entering into many
new businesses with strategic tie-ups-Pension Funds, General Insurance,
Custodial Services, Private Equity, Mobile Banking, Point of Sale Merchant
112
Chapter 3 Financial Performance Evaluation of SB!
Acquisition, Advisory Services, structured products etc, each one of these
initiatives having a huge potential for growth. SB! is forging ahead with innovative
technology and innovative new banking models, to expand its Rural Banking
base. It is also focusing at the top end of the market, on wholesale banking
capabilities to provide India is growing large Corporate with a complete array of
products and services. It is consolidating its global treasury operations and
entering into structured products and derivative instruments. Today, the Bank is
the largest provider of infrastructure debt and the largest arranger of external
commercial borrowings in the country. It is the only Indian bank to feature in the
Fortune 500 list. SBI is also looking at opportunities to grow in size in India as
well as internationally. It presently has 173 foreign offices in 33 countries across
the globe. It has also seven Subsidiaries in India - SBI Capital Markets, SBICAP
Securities, SBI DFHI, SBI Factors, SBI Life, and SBI Cards - forming a
formidable group in the Indian Banking scenario. It is in the process of raising
capital for its growth and consolidating its various holdings.
3.2 Growth and Development of SBI
It is imperative to know about the financial performance of SBI from 1990-
91 to 2011-12, how it reached to the storm of financial sector reform, together
with holding a position in the Indian banking sector. SBI growth and development
were based on key responsibility areas of deposit mobilization, credit
deployment, NPA, profitability and productivity.
3.2.1 Deposit mobilization of SBI
Deposit mobilization is a primary function of a commercial function of a
commercial bank. Deposit mobilization by banks plays a key role not only as an
important source of funds for banks but also instruments for promoting saving
and banking habits among people. Deposit are essential raw material for banking
industry .Commercial banks are expected to make efforts in both the rural and
113
Chapter 3 Financial Performance Evaluation of SBI
urban areas for mobilization saving in the form of their deposits which are
beneficial to them as well as to the nation. The SBI has been showing
outstanding performance in the area of deposit mobilization.
The deposit of the SBI was Rs 226 Rs crore at the end of its year of
inception 1955. It crossed the Rs 100000 crore marks in the year 1997.From
1997 onwards, within a period of four years; deposit crossed Rs 2 lakhs crore
with a high growth rate.
In the end of March 2003 the deposit of SBI were Rs 296123 crore. By the
end of March 2011, the deposits of SBI were Rs 933933 crore and recently in
March 2012 are Rs 1,043,647 crore. In the post reform era, SBI has mobilized
deposits rapidly through new product innovations and introducing e- commerce,
Internet banking, ATMs etc.
3.2.2 SBI Credit Deployment of SBI
Banks are the service institutions, which supply lubricants in the form of
loans and advances to the industry, trade, and commerce of the country for their
smooth functioning. The success of a Bank depends largely upon its effective
management of loan portfolio. If deposits of bank were not channeled in the
proper directions, they will not only adversely affect the economic activities in the
country but would also endanger the safety of deposit and existence of the banks
themselves. SBI is the biggest commercial bank in India. It recorded a
tremendous growth in its advance since its inception. It advance were just Rs
106 Crore in December 1955, which reached a level of Rs 867,579 crore the
year ending March 2012 recording a growth of 8184 times in a period of 57
years It advances account for holding good percent of all schedule commercial
banks advances in the country .
114

Chapter 3 Financial Performance Evaluation of SBI
3.2.3 Credit Deposit Ratio of SBI
Managerial performance of banks is ascertained in terms of credit -
deposit ratio and cash deposit ratio in percentage. Tlie Credit Deposit Ratio
reflects the management performance of the banks. It can be seen after financial
liberalization, most of the banks reported higher C-D ratio. The proportion of the
credit deployed to the deposit mobilized, popularly known as C-D Ratio. C-D
Ratio is one of the parameter to assess the performance of a bank. The Credit
Deposit Ratio of a bank in general, indicates the extent to which the depositor's
money is being investing in advances.^ In other words, it explains the extent to
which the depositor's money is advance in the form of loan and the extent to
which such money is placed in the form of investment.
Table 3.1 Stv Credit Deposit Ratio (By the end of March 31 )
Year
1991
1992 1993 1994 1995 1996 1997 1998 1999 2000 2001 2002 2003
2004
2005
2006 2007 2008
2009
2010 2011 2012
Deposit (Rs in Crore)
48374
60192 66317 76406 85122 96395 110701 131091 160042 196821 242828 270560 296123
318619
367048 380046 435521 537404
742073
804116
933933 1,043,647
Advances (Rs in Crore)
40440
44018 47695 41498 48530 59826 62233 74237 82360 98102 113590 120806 137759
157934
202374 261641 337336 416768
542503
631914 756719 867,579
C/D Ratio
83.6
73.13 71.92 54.31 57.01 62.06 56.22 56.22 49.72 49.84 46.78 44.65 46,52
49.56
55.13 68.84 77.45 77.55
73.11
78.58
81.02 83.12
Source: Annual Accounts of SBI, Various Issues
115
Chapter 3 Financial Performance Evaluation of SBI
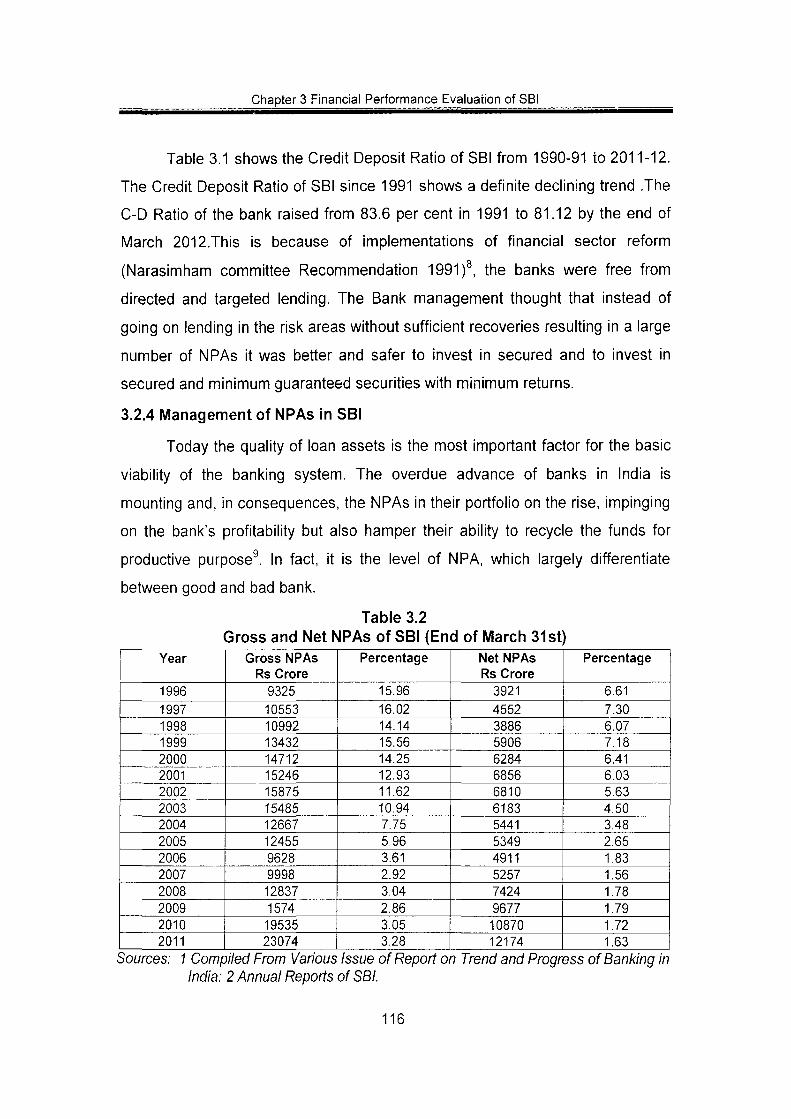
Table 3.1 shows the Credit Deposit Ratio of SBI from 1990-91 to 2011-12.
The Credit Deposit Ratio of SBI since 1991 shows a definite declining trend .The
C-D Ratio of the bank raised from 83.6 per cent in 1991 to 81.12 by the end of
March 2012.This is because of implementations of financial sector reform
(Narasimham committee Recommendation 1991)^, the banks were free from
directed and targeted lending. The Bank management thought that instead of
going on lending in the risk areas without sufficient recoveries resulting in a large
number of NPAs it was better and safer to invest in secured and to invest in
secured and minimum guaranteed securities with minimum returns.
3.2.4 Management of NPAs in SBI
Today the quality of loan assets is the most important factor for the basic
viability of the banking system. The overdue advance of banks in India is
mounting and, in consequences, the NPAs in their portfolio on the rise, impinging
on the bank's profitability but also hamper their ability to recycle the funds for
productive purpose^. In fact, it is the level of NPA, which largely differentiate
between good and bad bank.
Table 3.2 Gross and Net NPAs of SBI (End of March 31st)
Year
1996
1997 1998 1999 2000 2001 2002 2003 2004 2005 2006 2007 2008 2009 2010 2011
Gross NPAs Rs Crore 9325
10553 10992 13432 14712 15246 15875 15485 12667 12455 9628 9998 12837 1574 19535 23074
Percentage
15.96
16.02 14.14 15.56 14.25 12.93 11.62 10.94 7.75 5.96 3.61 2.92 3.04 2.86 3.05 3.28
Net NPAs Rs Crore 3921
4552 3886 5906 6284 6856 6810 6183 5441 5349 4911 5257 7424 9677 10870 12174
Percentage
6.61
7.30 6.07 7.18 6.41 6.03 5.63 4.50 3.48 2.65 1.83 1.56 1.78 1.79 1.72 1.63
Sources: 1 Compiled From Various India: 2 Annual Reports
Issue of Report on Trend and Progress of Banking in of SBI.
116
Chapter 3 Financial Performance Evaluation of SBI
Table 3.2 shows the SBI's NPA Management policy has laid stress on
early identifications of problems loans, effective response to early warning
signals, adherence to time norms for corrective actions including one time
settlements. Under the RBI guidelines, the SBI approved one time settlement if
Rs 718 crore in respect of Rs 1.95 lakhs accounts with NPAs up to Rs 5 crore.
SBI made a cash recovery of Rs 384 Crore during the year 2002-03 recovery of
Rs 5 lakhs and made a cash recovery of Rs 718 crore during the year 2002-03.
3.2.5 Profitability of SBI
Profit is a prime motive for any business. The most important function of
profit is the establishment of viability of operations and continued stability of the
originations it has to be appreciated that the banks are commercial organizations
and they cannot compromise profitability while fulfilling social obligations and
playing a development role.
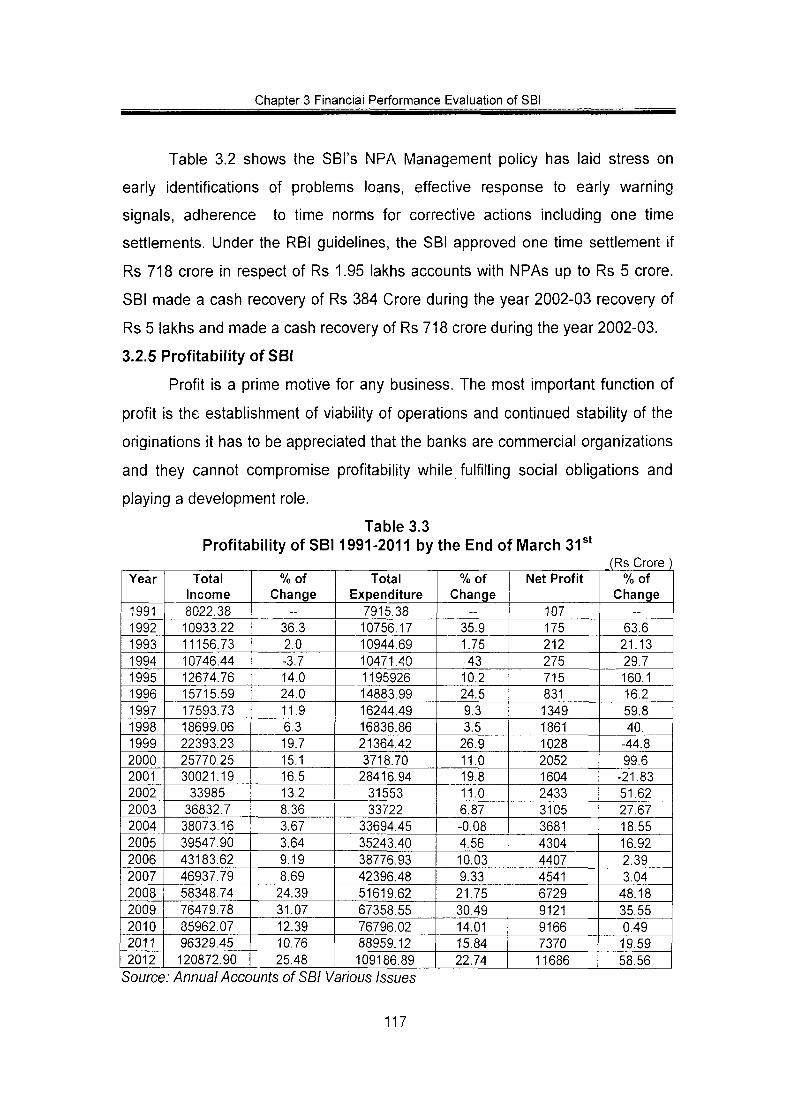
Table 3.3 Profitability of SB11991 -2011 by the End of March 31 *
Year
1991 1992 1993 1994 1995 1996 1997 1998 1999 2000 2001 2002 2003 2004 2005 2006 2007 2008 2009 2010 2011 2012
Total Income 8022.38 10933.22 11156.73 10746.44 12674.76 15715.59 17593.73 18699.06 22393.23 25770.25 30021.19 33985 36832.7 38073.16 39547.90 43183.62 46937.79 58348.74 76479.78 35962.07 96329.45 120872.90
%of Change
~
36.3 2.0 -3.7 14.0 24.0 11.9 6.3 19.7 15.1 16.5 13.2 8.36 3.67
L 3.64 9.19 8.69 24.39 31.07 12.39 10.76 25.48
Total Expenditure 7915.38 10756.17 10944.69 10471.40 1195926 14883.99 16244.49 16836.86 21364.42 3718.70 28416.94 31553 33722
33694.45 35243.40 38776.93 42396.48 51619.62 67358.55 76796.02 88959.12 109186.89
%of Change
-
35.9 1.75 43 10.2 24.5 9.3 3.5 26.9 11.0 19,8 11.0 6.87 -0.08 4.56 10.03 9.33 21.75 30.49 14.01 15.84 22.74
Net Profit
107 175 212 275 715 831 1349 1861 1028 2052 1604 2433 3105 3681 4304 4407 4541 6729 9121 9166 7370 11686
(Rs Crore) %of
Change —
63.6 21.13 29.7 160.1 16.2 59.8 40. -44.8 99.6 -21.83 51.62 27.67 18.55 16.92 2.39 3.04 48.18 35.55 0.49 19.59 58.56
Source: Annual Accounts of SBI Various Issues
117
Chapter 3 Financial Performance Evaluation of SB!
A glance at Table 3.3 reveals that the net profit recorded the highest
growth rate of 160 percent by the year ending 1995. The transition period of
financial sector reforms was over and so the bank got some relief from the
provisions and contingencies. Another important observation is that, during the
1999 and 2001, the bank recorded a negative growth of 44.8 per cent and 21.8
percent in Net Profit. The reasons for this considered excess provisions for
depreciation on investment, huge expenses for the issue of the Resurgent India
Bonds. The percentage change is calculated based on the previous year. The
Total Income of the Bank for 2011-12 stood at Rs 120872.90 crores, as
compared to 8022.38 crores in 1990-91 registering an excellent growth of
1406.69%. The Bank has posted a Net Profit of 11686 crores for 2011-12 as
compared to Rs 107 crores in 1990-91 registering a growth of 10821%. Total
Expenditure increased by 1287% attributable to higher staff cost and other
overall expenses.
3.2.6 Productivity of SBI
The productivity ratio indicate how best the manpower is utilized how
effectively the branches are being managed and o what extent all the resources
are exploited. It is a relation of an output of an activity and an input of resources.
One aspect of productivity is the measurement of a Business (deposits +
advances) per Branch and the other aspects is Business level per Employee.
The performance of bank is also judged by the branch expansion. After banking
reform, nearly two decades there had been massive branch expansion primarily
with the objective of covering the unbanked centre in the rural and semi rural
centre, coupled with intensive branch network in metro urban centre to sustain
profitability.
118
Chapter 3 Financial Performance Evaluation of SB!
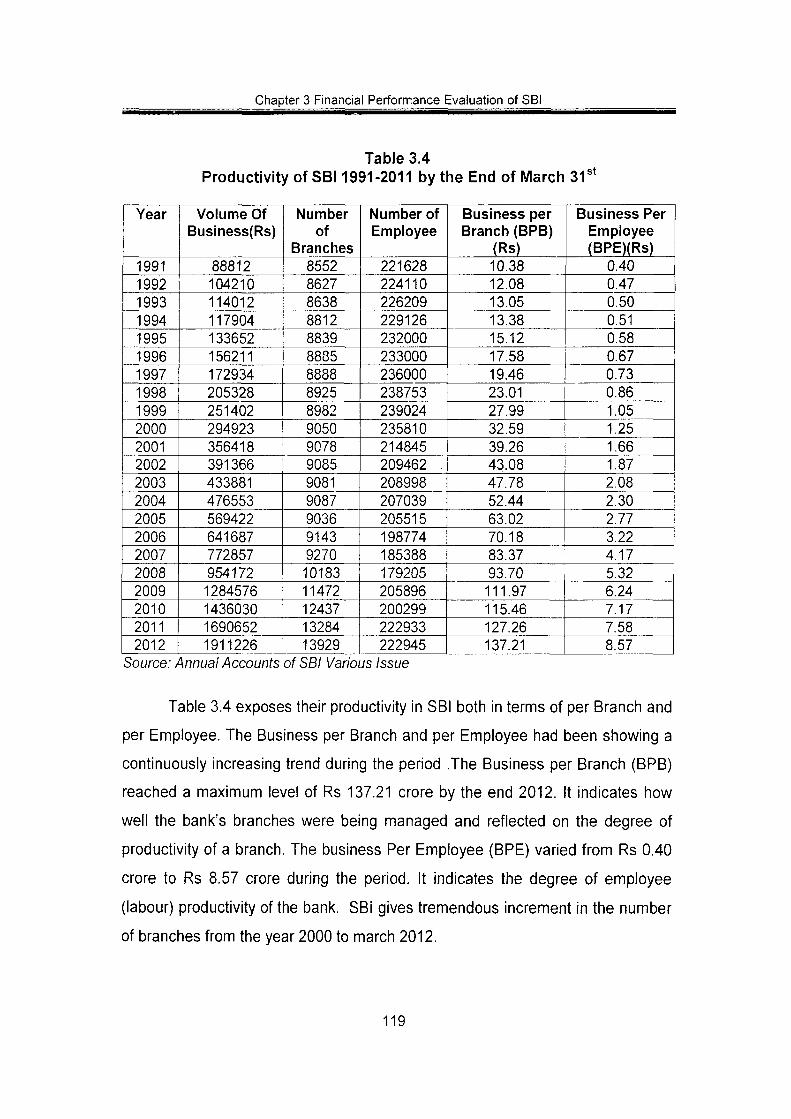
Table 3.4 Productivity of SB! 1991 -2011 by the End of March 31 *
Year
1991 1992 1993 1994 1995 1996 1997 1998 1999 2000 2001 2002 2003 2004 2005 2006 2007 2008 2009 2010 2011 2012
Volume Of Business(Rs)
88812 104210 114012 117904 133652 156211 172934 205328 251402 294923 356418 391366 433881 476553 569422 641687 772857 954172 1284576 1436030 1690652 1911226
Number of
Branches 8552 8627 8638 8812 8839 8835 8888 8925 8982 9050 9078 9085 9081 9087 9036 9143 9270 10183 11472 12437 13284 13929
Number of Employee
221628 224110 226209 229126 232000 233000 236000 238753 239024 235810 214845 209462 . 208998 207039 205515 198774 185388 179205 205896 200299 222933 222945
Business per Branch (BPB)
(Rs) 10.38 12.08 13.05 13.38 15.12 17.58 19.46 23.01 27.99 32.59 39.26 43.08 47.78 52.44 63.02 70.18 83.37 93.70 111.97 115.46 127.26 137.21
Business Per Employee (BPE)(Rs)
0.40 0.47 0.50 0.51 0.58 0.67 0.73 0.86 1.05 1.25 1.66 1.87 2.08 2.30 2.77 3.22 4.17 5.32 6.24 7.17 7.58 8.57
Source: Annual Accounts of SBI Various Issue
Table 3.4 exposes their productivity in SBI both in terms of per Branch and
per Ennployee. The Business per Branch and per Employee had been showing a
continuously increasing trend during the period .The Business per Branch (BPB)
reached a maximum level of Rs 137.21 crore by the end 2012. It indicates how
well the bank's branches were being managed and reflected on the degree of
productivity of a branch. The business Per Employee (BPE) varied from Rs 0.40
crore to Rs 8.57 crore during the period. It indicates the degree of employee
(labour) productivity of the bank. SBi gives tremendous increment in the number
of branches from the year 2000 to march 2012.
119

Chapter 3 Financial Performance Evaluation of SBI
In the decade of 1990's i.e. reform period it was felt that haphazard growth
should be contains and these should be qualitative network in branch expansion.
The Narasimham Committee Recommended that branch licensing been
abolished and the matters of opening and closing branches are left to
commercial judgment of individual bank. This recommendation been partly
implemented. Although branch licensing has not been abolished, greater
operational freedom has been given to individuals bank to open certain
specialized branches as well as expanding branches in more systematic way in
its geographically spread, off late the banking system has been increasingly
looking towards technology based delivery channels and progressive reduction of
physical branches to the extent possible.
3.3 Trend of branches of SBI
Figure 3.1
Number of Branches of SBI (1991-2012)
0)
u c CO
14000
12000
10000
8000
6000
4000
2000
0
No of Branches of SBI (1991-2012) DSeriesl
•
# c, ' C ^ <^^ C=> c? ^^ ^^ ^^ ^^ ^^ <^'' ^^ ^^ CP CP* O"" O"" Ci> ^^
# # # # c?^ # ^^' # # o "" O ^ ^ ^"^ # # O^ <#' <#' # 0>'
Year
Source: Compiled from table 3.4
Figure 3.1 and table 3.4 reveals the performance of SBI in terms of
expansion of branches from the year 1991 until 2012. It shows there is a 62.87
120
Chapter 3 Financial Performance Evaluation of SB!
per cent increment from its initiation as now it having 13929 branches as
compared to 8552 branches in 1991.
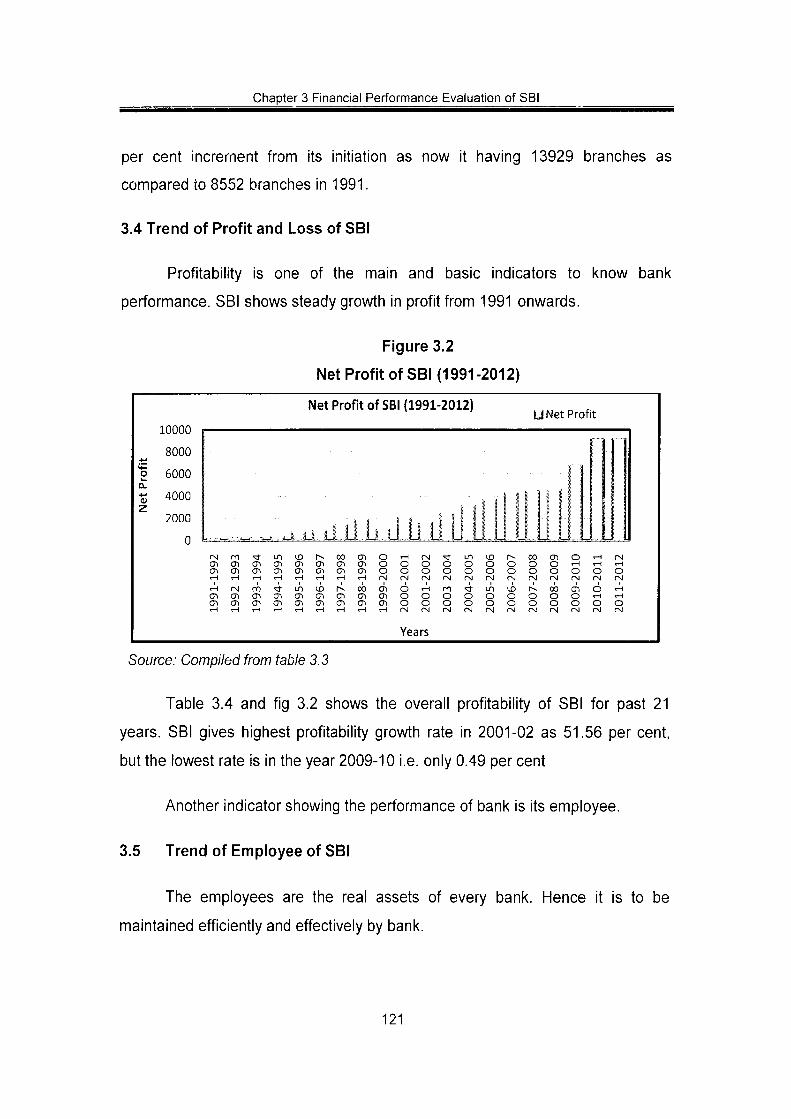
3.4 Trend of Profit and Loss of SBI
Profitability is one of the main and basic indicators to know bank
performance. SBI shows steady growth in profit from 1991 onwards.
Figure 3.2
Net Profit of SBI (1991-2012)
4-»
o
0 . 4-»
z
10000
8000
6000
4000
2000
0
cn
Net Profit of SBI (1991-2012)
_.._..-.. ,a .y.d .lJ,.b.iJ iJ .b L r O ^ U l l i J t ^ O O O l O r H r M ' v f c n c r i c n c j i c n c r i t n o o o o C T i C T i c n c n c n c r i a i o o o o
r M m > ^ i n i o r ~ - . o o c n o ^ - i r o CTitncncricricncricriooo C T l C T t C T i a ^ C T l O C n O ^ O O O
Years
• i ^
l\\ o o o o rsl IN ^ LD O O O O (N (N
U Net Profit
1 _J
1 j
J I r^ 00 o o o o
o o o o
i j { j i' 1
O O IN 00 O O IN
I I 1
O vH fN vH iH t-l o o o IN IN IN 01 O TH O rH tH O O O IN IN (N
Source: Compiled from table 3.3
Table 3.4 and fig 3.2 shows the overall profitability of SBI for past 21
years. SBI gives highest profitability growth rate in 2001-02 as 51.56 per cent,
but the lowest rate is in the year 2009-10 i.e. only 0.49 per cent
Another indicator showing the performance of bank is its employee.
3.5 Trend of Employee of SBI
The employees are the real assets of every bank. Hence it is to be
maintained efficiently and effectively by bank.
121
Chapter 3 Financial Performance Evaluation of SBI
Figure 3.3
Number of Employee (1991-2012)
250000
a) 200000
0 150000 a
1 100000
50000
0 i
No.of Employees of SBI (1991-2012) " " ^ ^ "^ Employees
Ol
m Ol Ol >H
(N Ol Ol
O l O l rH
m Ol O l rH
i n Ol Ol
Ol Ol
ID Ol 01 rH
Ln Ol Ol
Ol Ol rH
ID Ol Ol rH
1 "- 1 1 0 0 O l O r H r M ' v f L n i X i r - - . 0 0 O l O r H C N O l O l O O O O O O O O O r H r H r H O l O l O O O O O O O O O O O O r H r H ( N r M r M r N f N ( N r v l ( N r M ( N f N r N ]
r ^ o o o i O r H m ^ L o i o r ^ o o o i O r H O l O l O l O O O O O O O O O r H r H O l O l O l O O O O O O O O O O O r H r H r H f N r M r \ l r N r M r M ( N ( N r M f N I ! N
Years
Source: Compiled from table 3.4
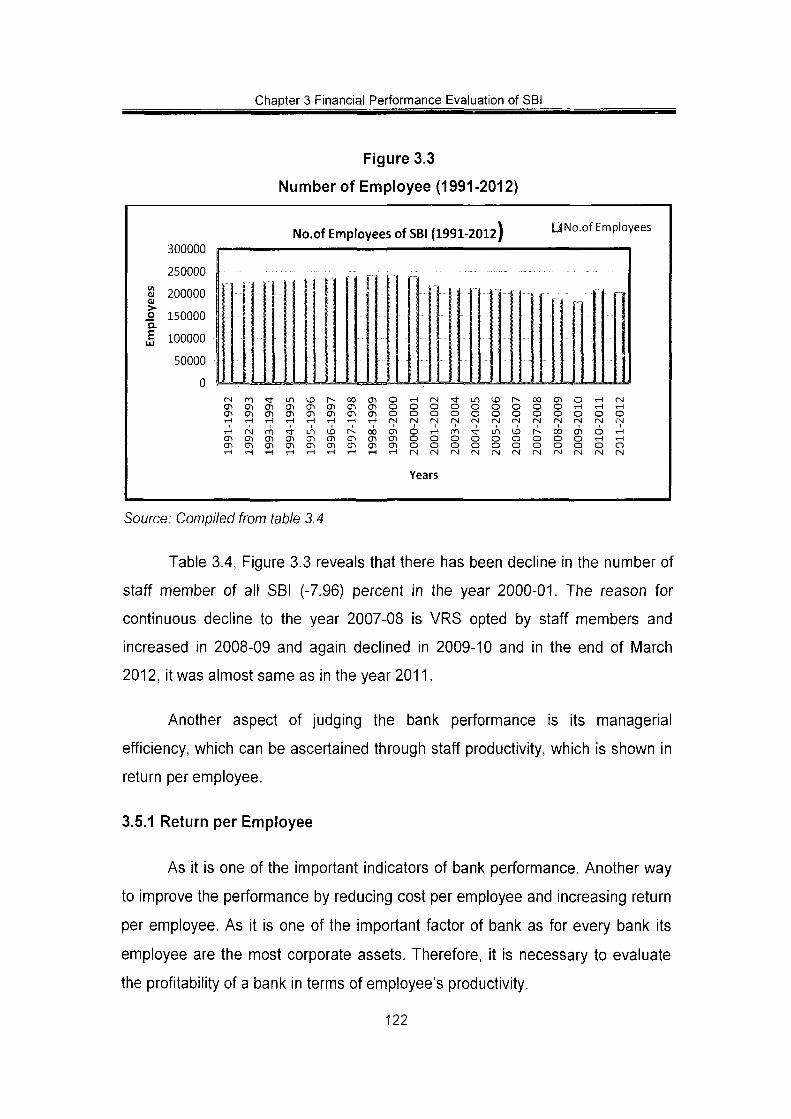
Table 3.4, Figure 3.3 reveals that there has been decline in the number of
staff member of all SBI (-7.96) percent in the year 2000-01. The reason for
continuous decline to the year 2007-08 is VRS opted by staff members and
increased in 2008-09 and again declined in 2009-10 and in the end of March
2012, it was almost same as in the year 2011.
Another aspect of judging the bank performance is its managerial
efficiency, which can be ascertained through staff productivity, which is shown in
return per employee.
3.5.1 Return per Employee
As it is one of the important indicators of bank performance. Another way
to improve the performance by reducing cost per employee and increasing return
per employee. As it is one of the important factor of bank as for every bank its
employee are the most corporate assets. Therefore, it is necessary to evaluate
the profitability of a bank in terms of employee's productivity.
122
Chapter 3 Financial Performance Evaluation of SBI
Figure 3.4
Business per Employee of SBI (1991-2012)
(U > • o
0)
a.
Business per Employee O Business per Employee
_ o . j-i_0-J±JXJLJX-^
n -. n n
n ^ M P i in r inoni l . iJ lJL
= ^ dfv' c.= ^ <^ <^^ <^ J ' c^ ^ c?^ # c?'" c. '' c Q c^" c?i* c? " cN^ c>" ^
o> d> d?? oJ» c^ o$o c>> 6?' c^ c?> o> c^ c¥ c^ os - ^ CN c9> ' ^ ^^ ^c? c,= ^c,^ ^°> ^ ^c? ^c, ^c, ^c, ^c? ^ ^ ^ ^ ^ ^ ^ ^ ^ ^^
Years
Source: Compiled from table 3.4
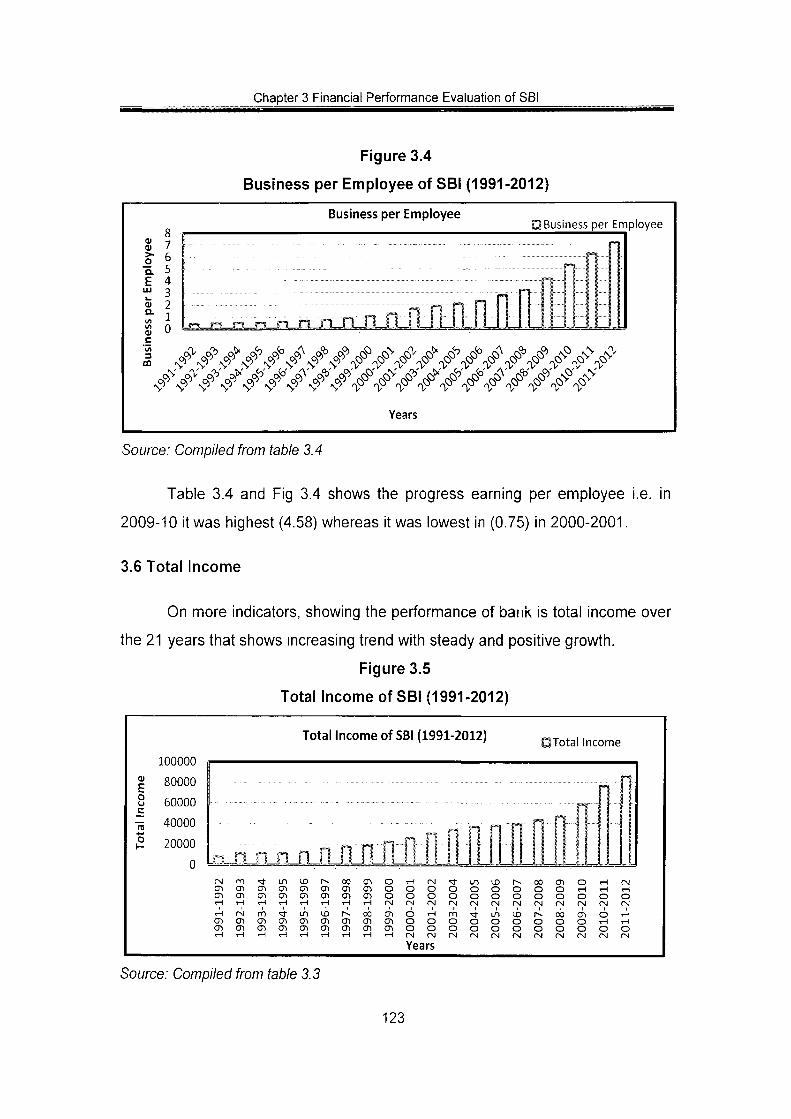
Table 3.4 and Fig 3.4 shows the progress earning per employee i.e. in
2009-10 it was highest (4.58) whereas it was lowest in (0.75) in 2000-2001.
3.6 Total Income
On more indicators, showing the performance of bank is total income over
the 21 years that shows increasing trend with steady and positive growth.
Figure 3.5
Total Income of SBI (1991-2012)
Total Income of SBI (1991-2012) OTotal Income
100000 <u E o
-o
01 (Jl
ro Ol Ol iH
(N (J) CD
CD
cn
rn Ol
en en
CI Ol
en en rH in Ol Ol
en en
en en
00
en rH
Ol Ol
Ol O) en
00 01 en
o o o (N Ol Ol en
o o
6 o o fN
O O
O O rN
m O O
O O (N
4 o O
U3 O O (N
I
Ln o o rs]
o o (N
I
o o
00 O O (N
o o IN
en o o rsi 00 o o
O CNI
en o o rM
<-i
o O fN
O
Years
Source: Compiled from table 3.3
123
Chapter 3 Financial Performance Evaluation of SBI
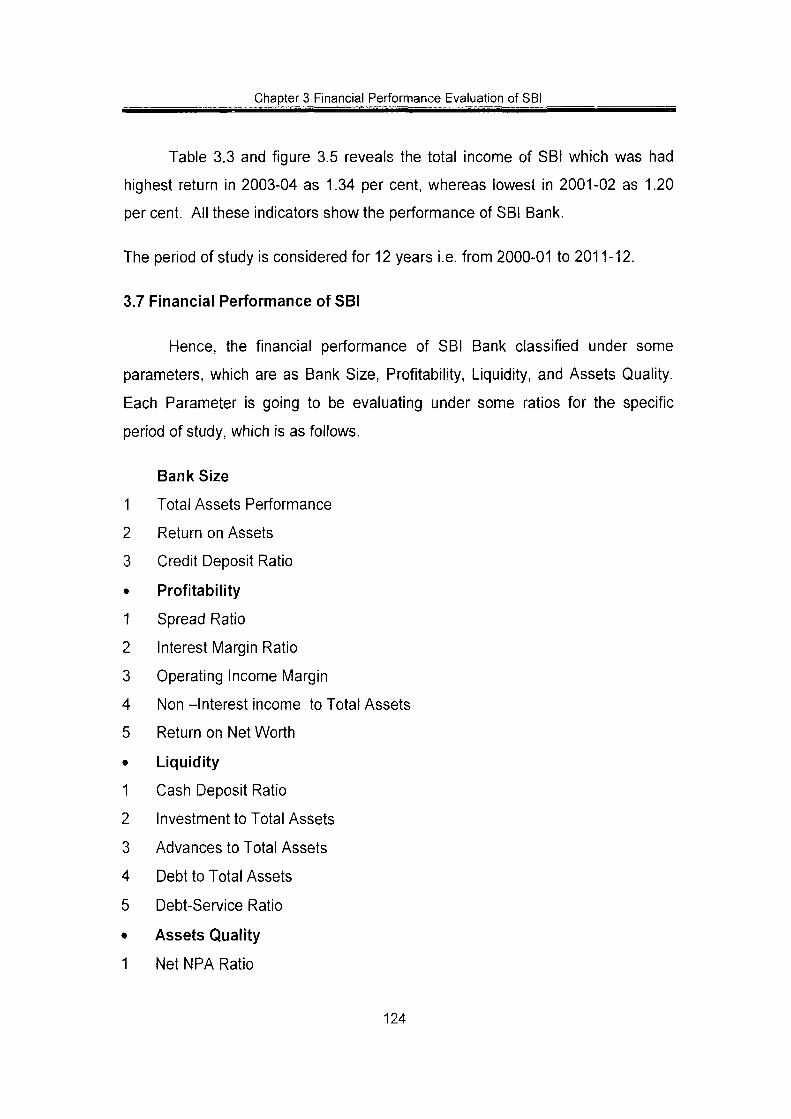
Table 3.3 and figure 3.5 reveals the total Income of SBI which was had
highest return in 2003-04 as 1.34 per cent, whereas lowest in 2001-02 as 1.20
per cent. All these indicators show the performance of SBI Bank.
The period of study is considered for 12 years i.e. from 2000-01 to 2011-12.
3.7 Financial Performance of SBI
Hence, the financial performance of SBI Bank classified under some
parameters, which are as Bank Size, Profitability, Liquidity, and Assets Quality.
Each Parameter is going to be evaluating under some ratios for the specific
period of study, which is as follows.
Bank Size
1 Total Assets Performance
2 Return on Assets
3 Credit Deposit Ratio
• Profitability
1 Spread Ratio
2 Interest Margin Ratio
3 Operating Income Margin
4 Non-Interest income to Total Assets
5 Return on Net Worth
• Liquidity
1 Cash Deposit Ratio
2 Investment to Total Assets
3 Advances to Total Assets
4 Debt to Total Assets
5 Debt-Service Ratio
• Assets Quality
1 Net NPA Ratio
124

Chapter 3 Financial Performance Evaluation of SBI
3.8 Bank Size
The bank size is considered under tiiis study througii Total Assets, Return
on Assets and Credit Deposit Ratio. Table 3.7 show the performance of SBI from
2001 to 2012 in terms of bank size.
Table 3.5
SBI'sTotal Assets, ROA, and Credit-Deposit Ratio (2001 to 2012)
Year
2000-2001
2001-2002
2002-2003
2003-2004
2004-2005
2005-2006
2006-2007
2007-2008
2008-2009
2009-2010
2010-2011
2011-2012
Total Assets
Rs (Crore)
315644.21
348228.25
368765.76
497815.30
459382.86
493869.54
566565.24
721526.32
964432.08
1053413.7
1,223,736.20
1,335,519.22
ROA
0.75
1.16
1.62
1,78
2.10
2.21
2.45
3.75
4.43
4.58
3.71
9.13
C-D Ratio
46.78
44.65
45.89
49.56
55.13
68.84
77.45
77.55
73.11
78.58
81.02
83.12
l-D Ratio
48.85
52.21
56.98
58.24
55.83
48.14
38.22
34.81
36.38
36.33
33.45
30.73
Source Compiled From Annual Accounts of SBI Various Issue.
125
Chapter 3 Financial Performance Evaluation ofSBI
3.8.1 Total Assets Performance of SB! Bank
Every asset on a bank's financial statement carries some risk of default or
loss. The degree of risk the bank takes on usually affects the size of losses the
bank eventually incurs. Measuring that risk is a critical part of understanding the
potential for the bank to encounter difficulties or to perform well. Often market to
market measuring the fair value of financial assets and liabilities of a bank that is
an essential step to analyze the performance of a bank.
Figure 3.6
Total Assets of SBI from 2000-2001 to 2011-2012
Total Assets of SBI ITotal Assets (Crore)
1600000
1400000
^ 1200000
S 1000000
< 800000
S 600000
^ 400000
200000
^^" ^^' ^^' ^^" ^^" ^^" ^^" ^^^ ^^^ ^^^ ^^^ ^<>^
^ ^ ^ QO^ O'' ^O" (.0 ^ "Xr V ir ^ 1/ "V
c^'
Years
Source: Compiled from table 3.7
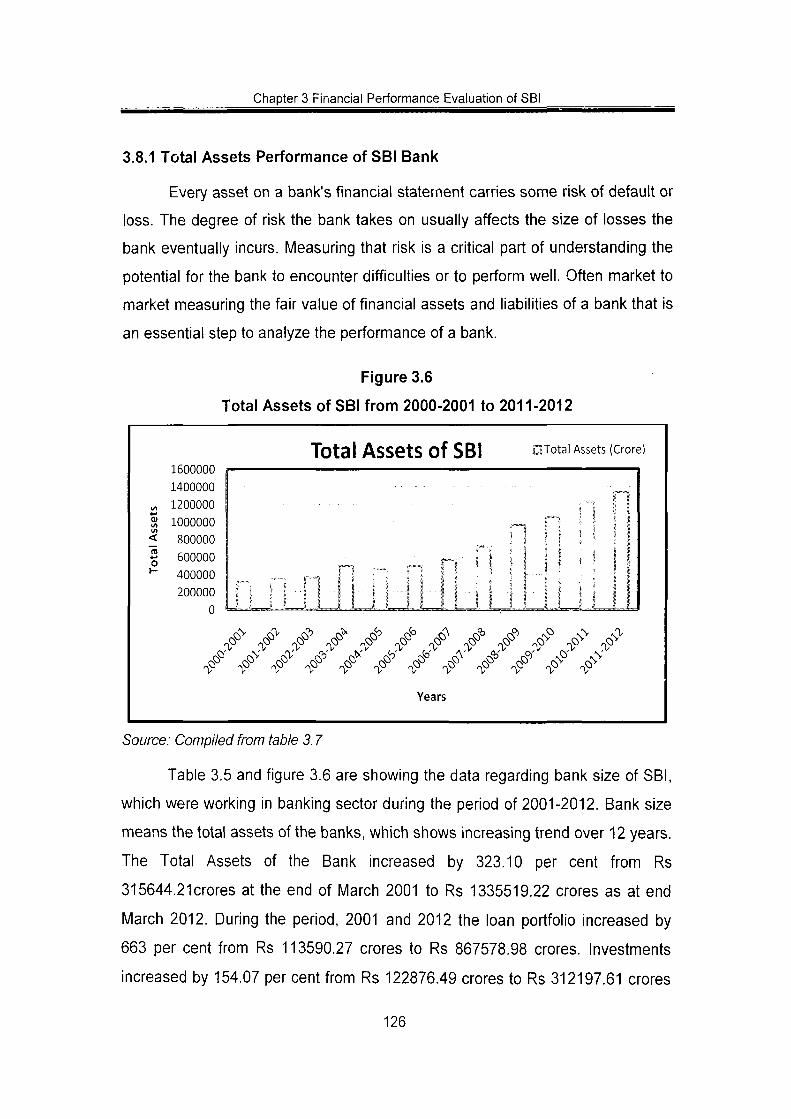
Table 3.5 and figure 3.6 are showing the data regarding bank size of SBI,
which were working in banking sector during the period of 2001-2012. Bank size
means the total assets of the banks, which shows increasing trend over 12 years.
The Total Assets of the Bank increased by 323.10 per cent from Rs
315644.21 crores at the end of March 2001 to Rs 1335519.22 crores as at end
March 2012. During the period, 2001 and 2012 the loan portfolio increased by
663 per cent from Rs 113590.27 crores to Rs 867578.98 crores. Investments
increased by 154.07 per cent from Rs 122876.49 crores to Rs 312197.61 crores
126
Chapter 3 Financial Perfornnance Evaluation of SBI
as at the end of March 2012. A major portion of the investment was in the
domestic marl<et in government and other approved securities.
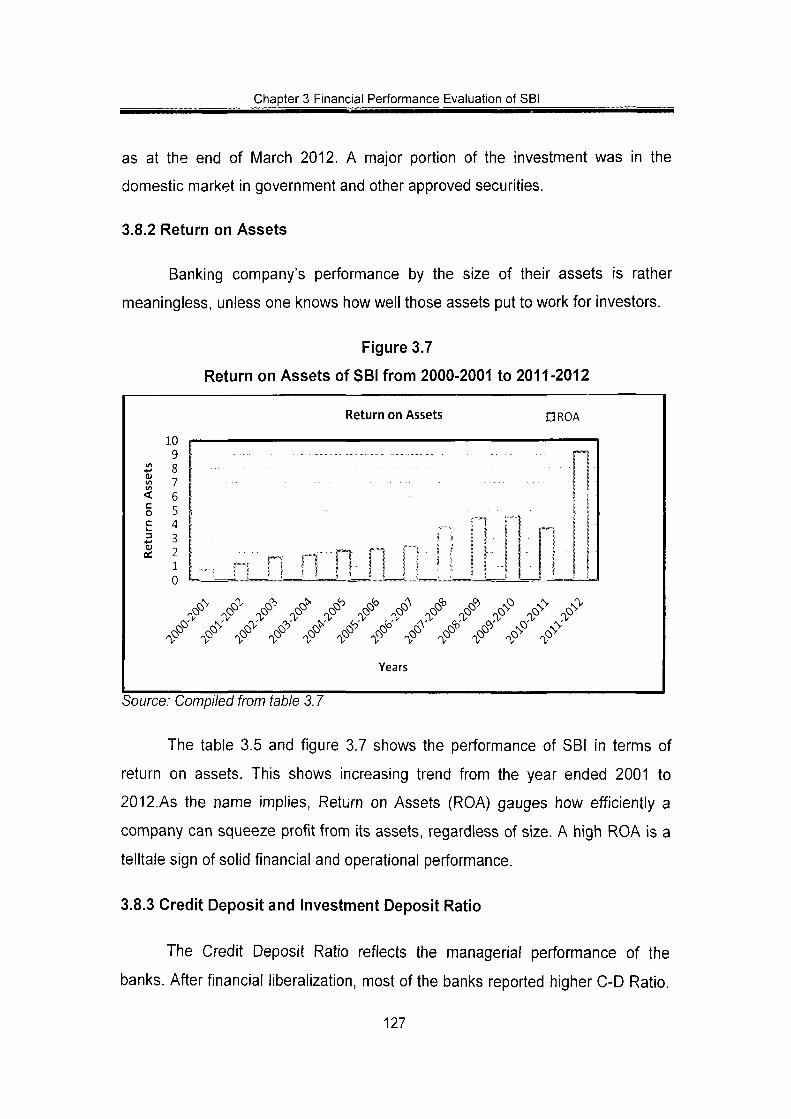
3.8.2 Return on Assets
Banking company's performance by the size of their assets is rather
meaningless, unless one knows how well those assets put to work for investors.
Figures.?
Return on Assets of SBI from 2000-2001 to 2011-2012
(/) 0} V)
< c o c 1_ 3 <u 0£
10 9 8 7 6 5 4 3 2 1 0
Return on Assets o ROA
f-'~ 1 I s 1
„ « n f'i r""l • ^ 1 1
-., n n fhO- n i ! MM
: : : • n
i "1 e-i ! 1 i f 1 1 '
^0^' ^^ ^^ QO^ ^&' ^^' ^^' QO*' # ^N^' ^N^
Years
Source: Compiled from table 3.7
The table 3.5 and figure 3.7 shows the performance of SBI in terms of
return on assets. This shows increasing trend from the year ended 2001 to
2012.AS the name implies, Return on Assets (ROA) gauges how efficiently a
company can squeeze profit from its assets, regardless of size. A high ROA is a
telltale sign of solid financial and operational performance.
3.8.3 Credit Deposit and Investment Deposit Ratio
The Credit Deposit Ratio reflects the managerial performance of the
banks. After financial liberalization, most of the banks reported higher C-D Ratio.
127

Chapter 3 Financial Performance Evaluation of SBI
For an emerging economy like India, it is vital to have sound financial
intermediaries and commercial banking sector, which effectively mops up the
savings available with the public and disburses credit to the productive sector in
an efficient manner helping India to progress on the path of steady growth and
prosperity. While investment by bank is also precious topic as this is also be out
of deposits of bank hence investment and credit both affects the deposits. In
2011-12, the series of incremental credit-deposit and investment-deposit ratios
drifted away from each. Since 2001, banks showing growing preference for credit
over investments.
Figure 3.8
Credit Deposit and Investment Deposit Ratio of SBI from 2001 to 2012
Credit Deposit and Investment Deposit Ratio
100
3C-D Ratio
31-0 Ratio
o 'ra 8 0 • oe Q
^ A." ra I o 40 ! ' * I ra ; '
oc I Q 20 ; M 1— "
;i IS: 0 ^ \i
w ^ -
! i
I ; ; r v ' rsV <-?> r^ r$o A _($> 'S^ _ N N N'V
^o- ^o- ^o- ^o- ^o- ^o- ^- ^- ^o- ^o> ^o> ^> ^O ' ^O ' ^^ ^^' ^O ' # ^O ' QO ' ^O*' ^^' ^^' ^N '
Years
Source: Compiled from table 3.7
Figure 3.8 reflecting the outstanding credit-deposit ratio at end-March
2001 was much lower at 46.78 per cent as compared to 83.12 per cent at end-
March 2012.Conversely; the Investment-deposit ratio was marginally higher at
48.85 per cent at end-March 2010 as compared to 30.73 per cent at end 2012.
128
Chapter 3 Financial Performance Evaluation of SBI
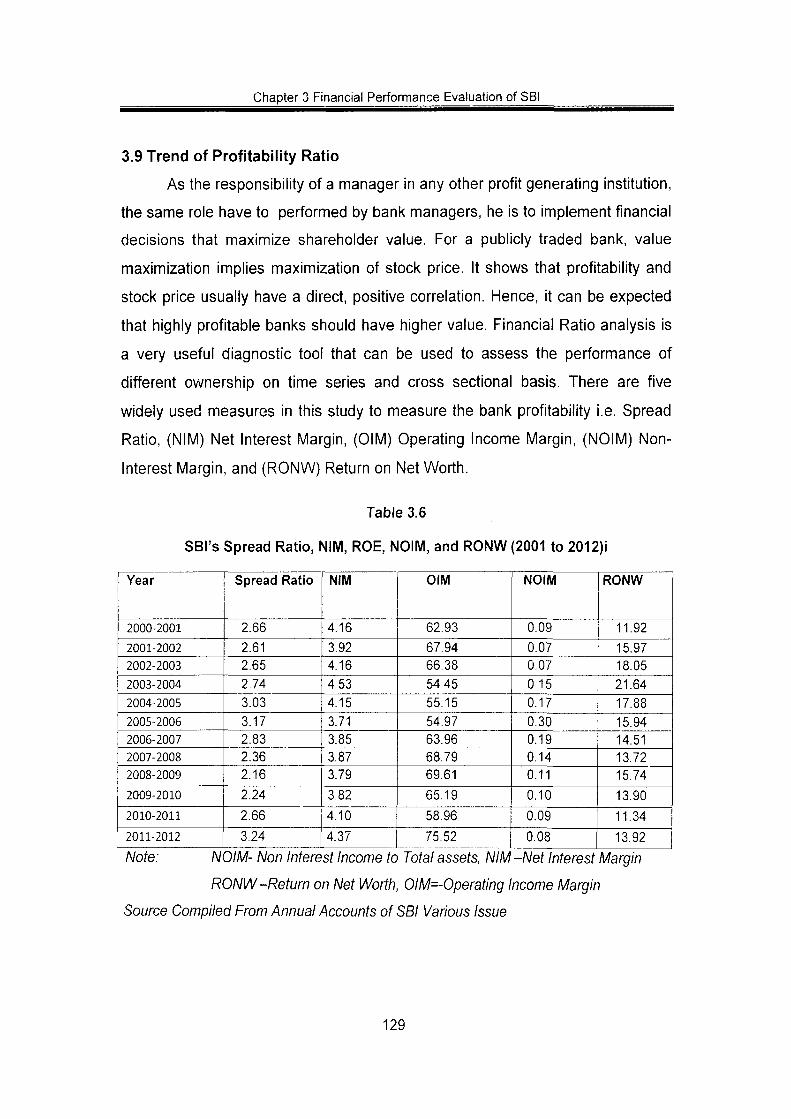
3.9 Trend of Profitability Ratio
As the responsibility of a manager in any other profit generating institution,
the same role have to performed by bank managers, he is to implement financial
decisions that maximize shareholder value. For a publicly traded bank, value
maximization implies maximization of stock price. It shows that profitability and
stock price usually have a direct, positive correlation. Hence, it can be expected
that highly profitable banks should have higher value. Financial Ratio analysis is
a very useful diagnostic tool that can be used to assess the performance of
different ownership on time series and cross sectional basis. There are five
widely used measures in this study to measure the bank profitability i.e. Spread
Ratio, (NIM) Net Interest Margin, (OIM) Operating Income Margin, (NOIM) Non-
Interest Margin, and (RONW) Return on Net Worth.
Table 3.6
SBI's Spread Ratio, NIIVI, ROE, NOIM, and RONW (2001 to 2012)i
Year
2000-2001
2001-2002 2002-2003 2003-2004
2004-2005
2005-2006 2006-2007 2007-2008 2008-2009
2009-2010
2010-2011
2011-2012
Spread Ratio
2.66
2,61 2.65 2.74
3.03
3.17 2.83 2.36 2.16
2.24
2.66
3.24
NIM
4.16
3.92 4.16
4.53
4.15
3.71 3.85 3.87 3.79
3.82
4.10
4.37
OIM
62.93
67.94 66.38
54.45 55.15
54.97 63.96 68.79 69.61
65.19
58.96
75.52
NOIM
0.09
0.07 0.07
0.15 0.17
0.30 0.19 0.14 0.11
0.10
0.09
0.08
RONW
11.92
15.97 18.05 21.64
17.88
15.94 14.51 13.72 15.74
13.90
11.34
13.92
Note: NOIM- Non Interest Income to Total assets, NIM -Net Interest Margin
RONW-Return on Net Worth, OIM=-Operating Income Margin
Source Compiled From Annual Accounts of SBI Various Issue
129
Chapter 3 Financial Performance Evaluation of SB!
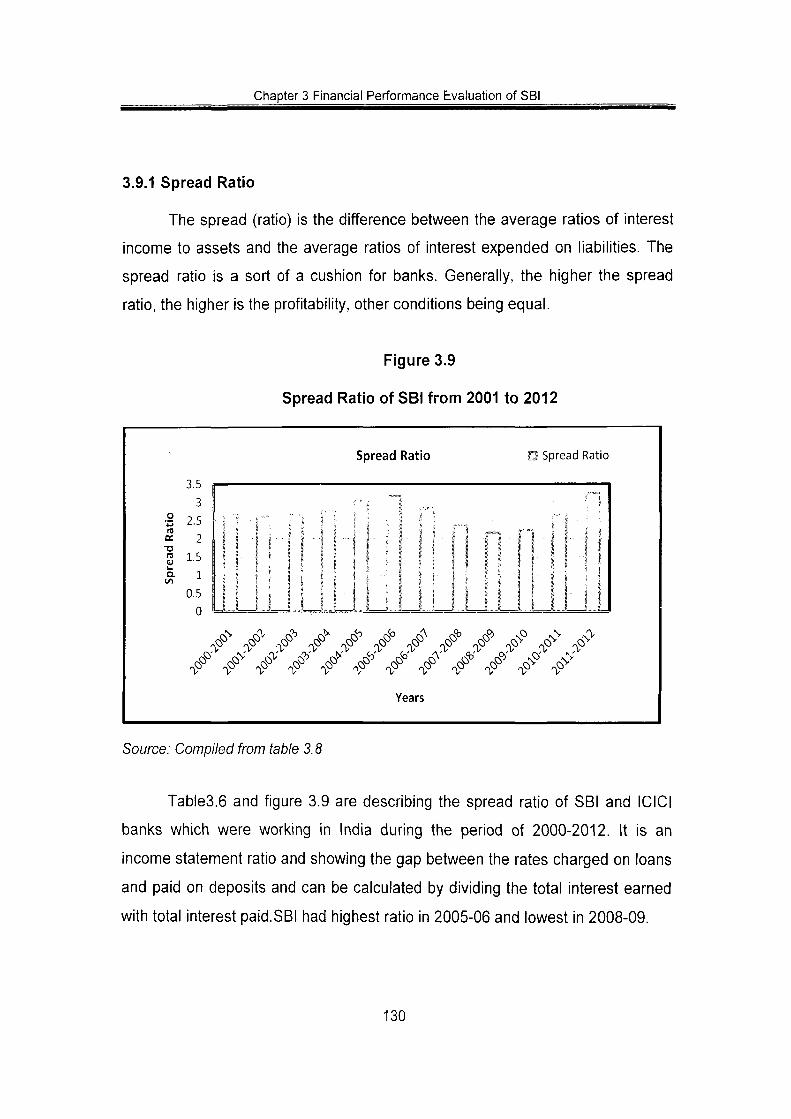
3.9.1 Spread Ratio
The spread (ratio) is the difference between the average ratios of interest
income to assets and the average ratios of interest expended on liabilities. The
spread ratio is a sort of a cushion for banks. Generally, the higher the spread
ratio, the higher is the profitability, other conditions being equal.
Figure 3.9
Spread Ratio of SBI from 2001 to 2012
Spread Ratio D Spread Ratio
3.5 3
•B 2.5 oe 2 -a ?, 1.5 a. 1
0.5 0
i i i
n M i .1 LJ U
s i i i 1 i 5 ' ! ! 1 1 ! 1 ? •• 1
j !
' i ;••
1 • I \ f i l l 1 1 -S f 1 i
1 ' i 1 1 s i 1 .. i 1 1 l
\
i r 1
LJ 1
j
r i
1
r;
: j l i 1 '
i
.:^ > sO nO .^ £^ ^& ^& ^
>o <Q}'
T -.0 ©^ nO <\ sO c * c%V .Q
^- ^^ ^O- r^-
jy ,y' r'y ^y' jy jy r.'y y -> r^ r$3 f<\ c* S S> S
^ y ^
Years
,0" r y T>
sV ,C) -^ <^'
Source: Compiled from table 3.8
Tables.6 and figure 3.9 are describing the spread ratio of SBI and ICICI
banks which were working in India during the period of 2000-2012. It is an
income statement ratio and showing the gap between the rates charged on loans
and paid on deposits and can be calculated by dividing the total interest earned
with total interest paid.SBI had highest ratio in 2005-06 and lowest in 2008-09.
130
;;hapter 3 Financial Performance Evaluation of SBI
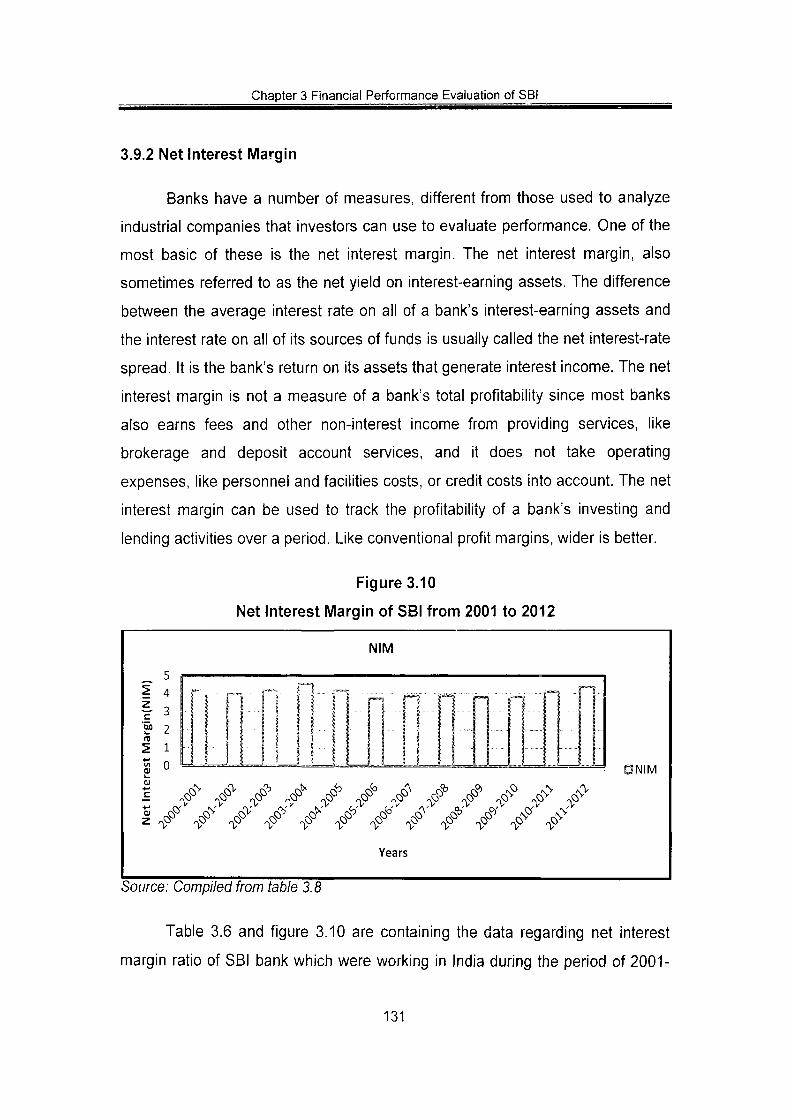
3.9.2 Net Interest Margin
Banks have a number of measures, different from those used to analyze
industrial companies that investors can use to evaluate performance. One of the
most basic of these is the net interest margin. The net interest margin, also
sometimes referred to as the net yield on interest-earning assets. The difference
between the average interest rate on all of a bank's interest-earning assets and
the interest rate on all of its sources of funds is usually called the net interest-rate
spread. It is the bank's return on its assets that generate interest income. The net
interest margin is not a measure of a bank's total profitability since most banks
also earns fees and other non-interest income from providing services, like
brokerage and deposit account services, and it does not take operating
expenses, like personnel and facilities costs, or credit costs into account. The net
interest margin can be used to track the profitability of a bank's investing and
lending activities over a period. Like conventional profit margins, wider is better.
Figure 3.10
Net Interest Margin of SBI from 2001 to 2012
Source: Compiled from table 3.8
Table 3.6 and figure 3.10 are containing the data regarding net interest
margin ratio of SBI bank which were working in India during the period of 2001-
131
Chapter 3 Financial Performance Evaluation of SB!
2012. It is an income statement ratio and can be calculated by dividing the net
interest income with total assets to signify earning capacity of banking sector
through core banking activities after utilization of all the assets. This ratio is high
in 2003-04 as 4.53 and lowest in 2008-09 as 2.16.
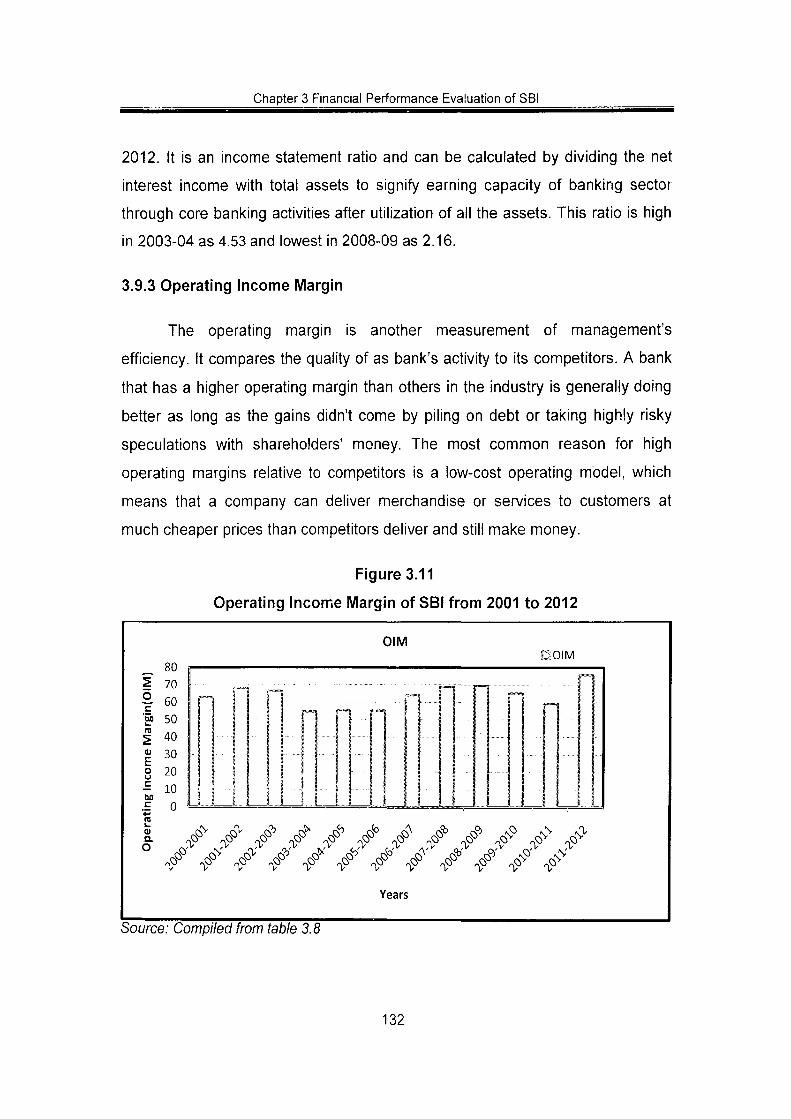
3.9.3 Operating Income Margin
The operating margin is another measurement of management's
efficiency. It compares the quality of as bank's activity to its competitors. A bank
that has a higher operating margin than others in the industry is generally doing
better as long as the gains didn't come by piling on debt or taking highly risky
speculations with shareholders' money. The most common reason for high
operating margins relative to competitors is a low-cost operating model, which
means that a company can deliver merchandise or services to customers at
much cheaper prices than competitors deliver and still make money.
Figure 3.11
Operating Income Margin of SBI from 2001 to 2012
Source: Compiled from table 3.8
132

Chapter 3 Financial Performance Evaluation of SBI
Tables.8 and figure 3.11 are demonstrating the data related to operating
margin of SBI during the period of study i.e. 2001 to 2012. It reveals that in the
year2005-06 SBI had highest ratio as 0.30 and in the two consequent years
2001-02 and 2002-03 it had lowest ratio at 0.07.
3.9.4 Non Interest Income to Total Assets
This ratio denotes a bank's ability to earn from non-conventional sources
in a liberalized environment; this ratio assumes significance of a bank. For, it
mirrors a bank's ability to take full advantage of its operational freedom.
Figure 3.12
Non Interest Income to Total Assets of SBI from 2001 to 2012
O O ^ 2
— \A 4-» *^ W 0) fll I/) Z in (U <
c o
0.35
0.3
0.25
0.2
0.15
0.1
0.05
0
NOIM ONOIM
1 i n n ~ 11 s i 11 I \ I f 11 11 I i
T"'
i 1 1 • •il n r n o ^ o '' ^ <^ 4" ^ 4" <^ ^ ^ <^ S^
^ r^ ^ r^ r^ r^ ^ M ^ ^ ^ ^
QO^' QO>' ^ ^ ' ^^' ^ QO^ ^ ' QO*' QC?' ^N^ ' ^^
Years
Source: Compiled from table 3.8
Table 3.6 and figure 3.12 are depicting the data regarding non-interest
expenses to total incomes of SBI, which were working in India during the period
of 2001-2012.This ratio is used to know the management efficiency related to the
resources application in the bank related to expenses. It can be calculated as
non-interest expenses percentage to total incomes and also known as overhead
133
Chapter 3 Financial Performance Evaluation of SBI
expense ratio. It depicts SBI having 0.09 per cent in 2000-01 and slightly
decreased in 2012 at 0.08 per cent.
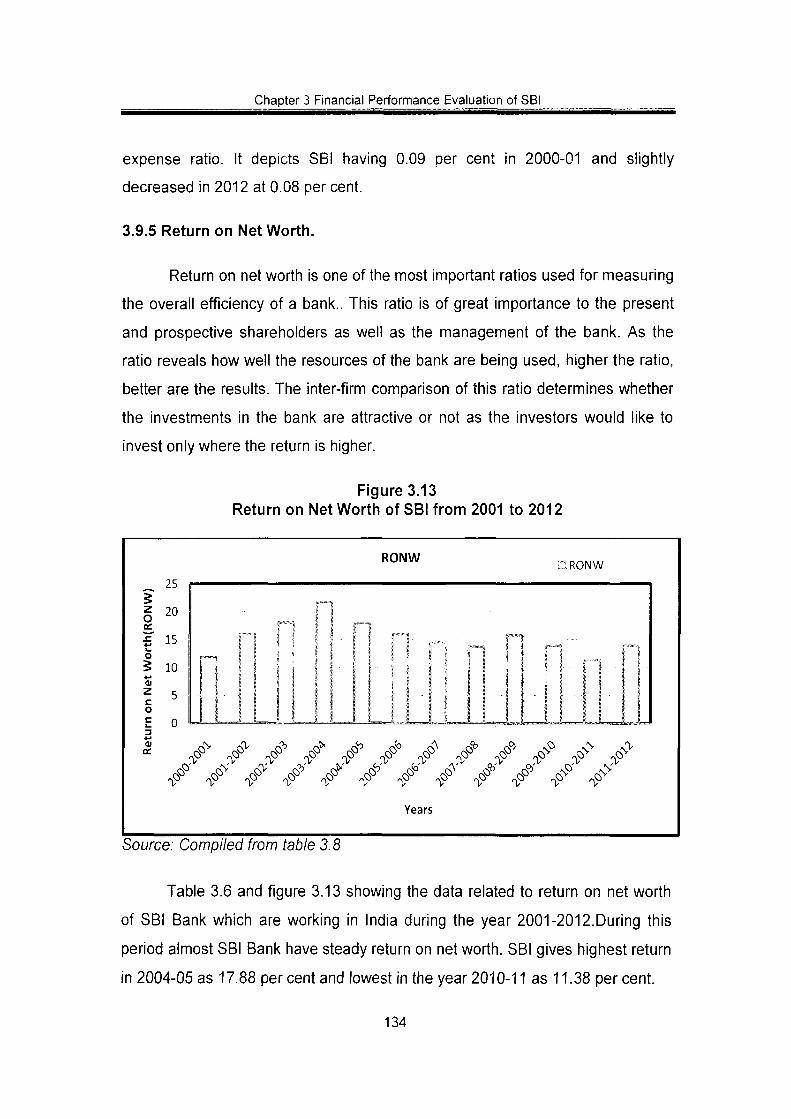
3.9.5 Return on Net Worth.
Return on net worth is one of the most important ratios used for measuring
the overall efficiency of a bank.. This ratio is of great importance to the present
and prospective shareholders as well as the management of the bank. As the
ratio reveals how well the resources of the bank are being used, higher the ratio,
better are the results. The inter-firm comparison of this ratio determines whether
the investments in the bank are attractive or not as the investors would like to
invest only where the return is higher.
Figure 3.13 Return on Net Worth of SBI from 2001 to 2012
25
§ 20 ec ^ 15 o 5 10 • • - •
1 ^ o £ 0 3 4-' (U
RONW DRONW
n 1 1 n r - i 1 1 i . 1 1 1 ) 1 1 • ,._
M i 11 n M 1 M : I • ^ M > M
" "
1 1 1
1
^o^ ^ ^ ^ ^ ^ ^ ^ ^ ^ ^ ^ '^ .'y ^>^ r.'y jy . ^ ^y ^y J^ r.y ^rP ^y
^ ^ ^ ^ ^ ^^ ^ ^ ^ ^^ ^^
Years
Source: Compiled from table 3.8
Table 3.6 and figure 3.13 showing the data related to return on net worth
of SBI Bank which are working in India during the year 2001-2012.During this
period almost SBI Bank have steady return on net worth. SBI gives highest return
in 2004-05 as 17.88 percent and lowest in the year2010-11 as 11.38 percent.
134

Chapter 3 Financial Performance Evaluation of SBI
3.10 Liquidity Position
Liquidity ratio, expresses a banks's ability to repay short-term creditors,
made investment , to cover debt services out of its total cash. The liquidity ratio
shows the relationship between cash-deposit and advances to total assets also .
Under the period of study liquidity ratio is divided under 5 categories such as
Cash-Deposit Ratio, Investment To Total Assets, Advances Total Assets, Debt
To Total Assets And Debt-Service Ratio.
Table 3.7
Year
2000-2001 2001-2002 2002-2003 2003-2004 2004-2005 2005-2006 2006-2007 2007-2008 2008-2009 2009-2010 2010-2011 2011-2012
Liquidity ratio of SBI (2001-2012)
Cash Deposit ratio 8.51 7.86 6.11 5.17 5.23 5.15 6.22 8.29 8.37 7.56 8.96 5.18
Investment to Total Assets 38.93 41.68 45.85 45.53 42.86 32.91 26.33 26.26 28.61 27.13 24.15 23.37
Advance to Total Assets 35.98 34.69 36.64 38.72 44,00 52.98 59.54 57.76 56.25 59.99 61.83 64.96
Debt to Total Assets 80.33 80.37 81.26 81.42 83.98 83.15 83.58 81.65 82.51 86.11 86.09 87.65
Debts-Service Ratio 3.21 4.66 3.31 1.91 1.71 1.90 2.53 3.24 3.30 2.35 1.57 3.66
Source;Complied from Annual Accounts of SBI, Various Issue
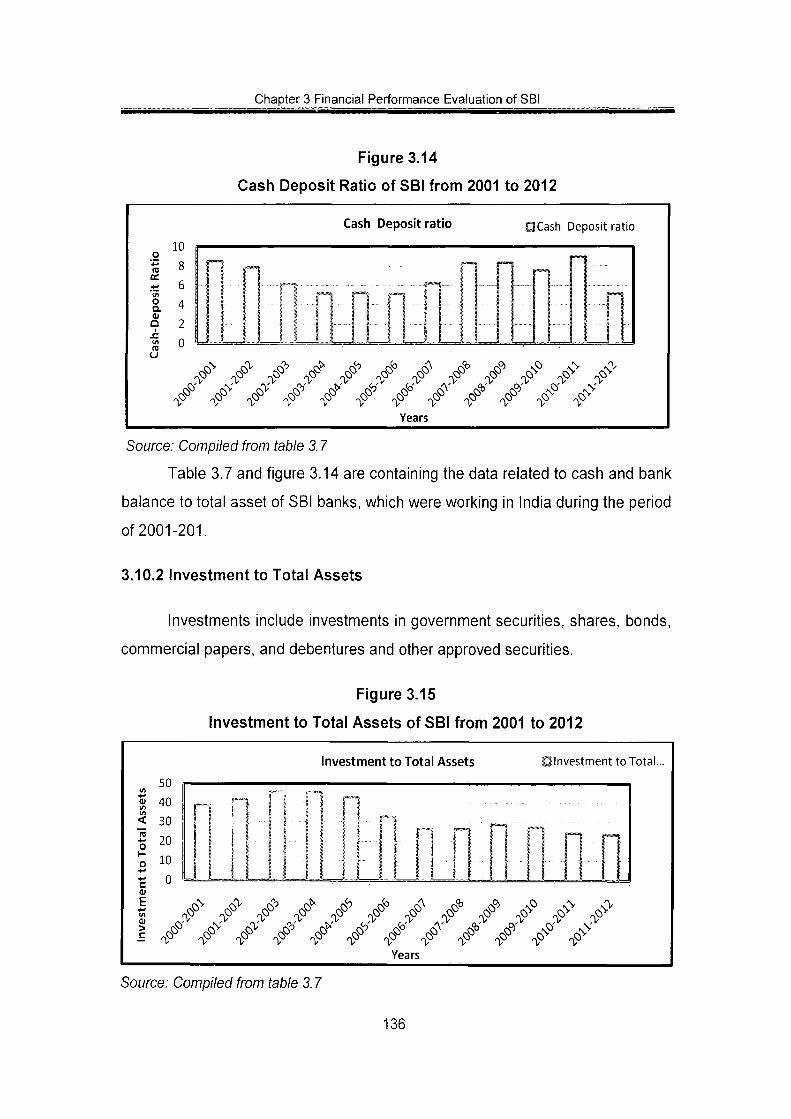
3.10.1 Cash Deposit Ratio
Cash is the amount of money a bank should have available as a
percentage of the total amount of money its customers have paid into the bank.
This amount is calculated so that bank can be sure that they will be able to give
the customers money whenever they want which is also one of the tools for
performance
135
Chapter 3 Financial Performance Evaluation of SBI
Figure 3.14
Cash Deposit Ratio of SBI from 2001 to 2012
Cash Deposit ratio QCash Deposit ratio
TO
I ra
1 0
8
6
4
2
0
vN vO^ ^ ©
rCV rv> © ' fsO' ,0^ ^O^ ^<i^ C$-NO^ r$i^ sC?' .0^ . \ ^ ,o^ ^o A s V <<y' n-
y" T T y^ y^ x n> T y y y y # .# .<f'' J"' .# .# J"' J"' A
y y y y y y y y y y y y Years
,0^
Source: Compiled from table 3.7
Table 3.7 and figure 3.14 are containing the data related to cash and bank
balance to total asset of SBI banks, which were working in India during the period
of 2001-201.
3.10.2 Investment to Total Assets
Investments include investments in government securities, shares, bonds,
commercial papers, and debentures and other approved securities.
Figure 3.15
Investment to Total Assets of SBI from 2001 to 2012
Investment to Total Assets DInvestment to Total.
< "ra o
50
40
30
20
10
- 0
E
L . # .0^^ .0^'
y
y y y
vV y
rxO' <V' y' .y
y y
• ^O^ ^O^ QO* <3. y y y y
^ # o^ ' # ^' y y y y y Years
A ,0^
'V O" y
Source: Compiled from table 3.7
136
Chapter 3 Financial Performance Evaluation of SBI
Table 3.7 and figure 3.15 are showing the data related to investment to
total assets of SBI bank, which was working in India during the period of 2001-
2011. This ratio is used to recognize the segment of total assets, which are used
for investment in government.
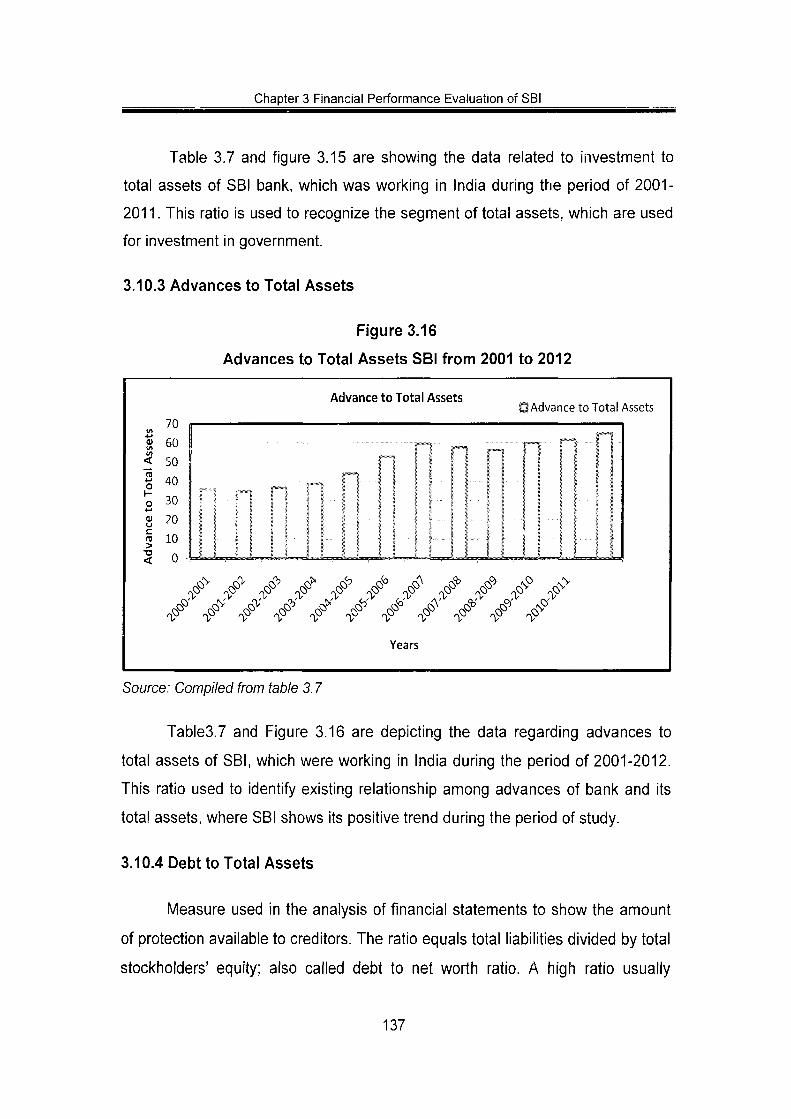
3=10.3 Advances to Total Assets
Figure 3.16
Advances to Total Assets SBI from 2001 to 2012
4-» O t/t in
< "ra o 1-o 01 U
c > -a <
70
60
50
40
30
20
10
0
Advance to Total Assets Q Advance to Total Assets
f*-i ,,^, r™i >" ' ' • ,~ ' ' ? 1... 1 1 1 t
1 1 ! 1 1 i - , ' • i i 1 1 i 1 < I I i
^^ ^^ ^^ <,0 ^& ^^ ^^ ^0* QC? QN^ QN-
^^ <^ QC?' QO ' ^^' J'^ ^' ^' ^' ^^'
Years
Source: Compiled from table 3.7
Tables.7 and Figure 3.16 are depicting the data regarding advances to
total assets of SBI, which were working in India during the period of 2001-2012.
This ratio used to identify existing relationship among advances of bank and its
total assets, where SBI shows its positive trend during the period of study.
3.10.4 Debt to Total Assets
Measure used in the analysis of financial statements to show the amount
of protection available to creditors. The ratio equals total liabilities divided by total
stockholders' equity; also called debt to net worth ratio. A high ratio usually
137
Chapter 3 Financial Performance Evaluation of SB!
indicates that the banl< has a lot of risl< because it must meet principal and
interest on its obligations. Potential creditors are reluctant to give financing to a
bank with a high debt position. However, the magnitude of debt depends on the
type of business. For example, a bank has a high debt ratio but its assets are
generally liquid. A utility can afford a higher ratio than a manufacturer because its
earnings can be controlled by rate adjustments.
Figure 3.17
Debt to Total Assets of SBI from 2001 to 2012
Debt to Total Assets DDebt to Total Assets
90
ai 88
Si 01 Q
86 84 82 80 78 76
Pi • ;
I I ! i
r^
O^"' V r ^O <v
c? ' V
,o^ .y f^ r^
if
K >
o A
T> ,© NV :v ,o
s<S
Years
sO* . 0 ^ y
CNN"
ro" >
y # .'V
Source: Compiled from table 3.7
Usually, book value is used to measure a firm's debt and equity securities
in calculating the ratio. Market value may be a more realistic measure, however,
because it takes into account current market conditions
Table 3.7 and figure 3.17 are showing the data related to debt to total
assets of SBI, which were working in India during the period of 2001-2012.Almost
In this period SBI have debt to total assets in increasing trend.
3.10.5 Debts-Service Ratio
In banking industry, it is the amount of cash flow available to meet annual
interest principal payments on debt, including sinking fund payments.
138

Chapter 3 Financial Performance Evaluation of SB!
Figure 3.18
Debts-Service Ratio of SB! from 2001 to 2012
Debts-Service Ratio O Debts-Service Ratio
ra
u
o
\
©' :v .N^ .c?'
0-' n> ,c?
^ y .n> #
y ,0?
n> ,cP
.y .y / .y y y" y> y
<^' y y NO'
y
Years
Source: Compiled from table 3.7
Table 3.7 and figure 3.18 are showing the data related to debt service of
SBI bank, which was working in India during the period of 2000-2012. This ratio
is also known as debt to asset ratio, which is used to know that what percent of
total assets are financed through debt.
3.11 Nonperforming Assets
The banking business is of mobilizing the deposits and utilizing it for
lending to industry.NPA effects very much on banks, because profitability down
due to NPA while when NPA is minimizes then banks gets relief.
139

Chapter 3 Financial Performance Evaluation of SBI
Table 3.8
NPA's of SBI (2001-2011)
Year Year
2000-2001
2001-2002
2002-2003
2003-2004
2004-2005
2005-2006 2006-2007
2007-2008
2008-2009 2009-2010 2010-2011
(in per cent Net NPAs
6.03 5.63 4.50 3.48
2.65
1.83 1.56
1.78
1.79 1.72
1.63
Source; Complied from annual reports of SBI from the year 2000- 2011
Figure 3.19
Nonperforming Assets of SBI from 2001 to 2011
Net NPAs ONNPA
c E o
\~ Q. C o 2 ^ 0
f 1 1 I ,
1
... . '
li W n n n 1 1 1 0)
z fsO s \ © £^ ^& J^ / ,:f" -v o- ^^ ^- o-
:^ .>^ ,:^^ rS^ ^ fS 'y ^y c^ .0
.y ^ oN
^^ ' .0^^
.N
^- ^^ ^0- ^^ ^^ ^O- ^0>
Years
Source: Complied from table 3.8
Table 3.8 and figure 3.19 are showing the data regarding NPA to of SBI
banks which were working in India during the period of 2001-2011. Non-
140

Chapter 3 Financial Performance Evaluation of SBI
performing assets to bank use this ratio to indicate the exposure. V\/hile the
capital adequacy of SBI remained robust, there were some emerging concerns
with regard to the important soundness indicator of banks of Nonperforming
Assets (NPAs). Asset quality of Indian banks had generally seen a steady
improvement as evident from a declining level of gross and net NPA ratio since
1999. The gross NPA ratio of SBI placed at 12.93 per cent at end-March 2001
had declined steadily to 3.28 per cent at end-March 20011. During the crisis year
2008-09. However, during 2009-10, the gross NPA ratio showed an increase to
6.64 per cent. After netting out provisions, and net NPA ratio of SBI decreased
from 12.93 per cent at end-March 2001 to 3.28 percent at end-March 2011.which
is a good sign of performance.
3.12 Conclusion
The present chapters deals the performance of SBI bank in India with
reference to different parameter .It include the performance of SBI on the
grounds of Total Assets, efficiency, profitability, Liquidity, leverage and assets
quality ratios. Indeed the present chapter did not testify the significant difference
between the two banks. Next chapter deals with the performance of ICICI bank
and the next to next chapter deals with the analysis and interpretation of the data
comprises the performance of SBI and ICICI Bank by using statistical tools to test
the hypotheses of the study.
141
Chapter 3 Financial Performance Evaluation of SB!
Reference
1. Reserve Bank of India (2006), History, Vol. II, Pg 248
2. Ibid , Pg 249
3. SB! (2010)www.sbi.co.in/about/us/dated,26-7-2010
4. Pilloff, S. J. & Rhoades, S. A. (2002), "Structure and Profitability in
Banking iVIarkets. Review of Industrial Organization, 20, pp 81-98.
5. Rbi.(2010),(www.rbi.co.in), dated 19-9-2010)
6. Reserve Bank of India, master circular on prudential norms on income
recognition. Asset classification and provisioning
7. Op.cit, dated 26-7-2010
8. Hanson James A (2001), Indian Banking: Market Liberalization and the
pressures for institutional and Market Framework Reform, UN working
paper Stanford University No. 104 pp. 1-37
9. Nitin Kumar, Puneet Verma (2008),"Credit Deposit Ratio and ownership
Structure in the Indian Banking Sector- an empirical study", Gobal
Academic Society Journal,Social Science Insight Vol.1, No.4 pp4-17
10. RBI,(2006),History ,Volume-IV, Page 23
11. Dr. Vibha Jain (2007),"Non-Performing Assets in commercial Banks":
Regal Publication, New Delhi,1st Edition pp.78-79.
142